EP3105604B1 - Verfahren zur kernmagnetresonanzanalyse - Google Patents
Verfahren zur kernmagnetresonanzanalyse Download PDFInfo
- Publication number
- EP3105604B1 EP3105604B1 EP14827779.1A EP14827779A EP3105604B1 EP 3105604 B1 EP3105604 B1 EP 3105604B1 EP 14827779 A EP14827779 A EP 14827779A EP 3105604 B1 EP3105604 B1 EP 3105604B1
- Authority
- EP
- European Patent Office
- Prior art keywords
- signal
- fid
- species
- spectrum
- module
- Prior art date
- Legal status (The legal status is an assumption and is not a legal conclusion. Google has not performed a legal analysis and makes no representation as to the accuracy of the status listed.)
- Active
Links
- 238000005481 NMR spectroscopy Methods 0.000 title claims description 42
- 238000004458 analytical method Methods 0.000 title description 23
- 238000001228 spectrum Methods 0.000 claims description 248
- 238000012545 processing Methods 0.000 claims description 135
- 229910001868 water Inorganic materials 0.000 claims description 103
- XLYOFNOQVPJJNP-UHFFFAOYSA-N water Substances O XLYOFNOQVPJJNP-UHFFFAOYSA-N 0.000 claims description 92
- 238000000034 method Methods 0.000 claims description 88
- 239000000523 sample Substances 0.000 claims description 72
- 238000001914 filtration Methods 0.000 claims description 40
- 239000002207 metabolite Substances 0.000 claims description 30
- 238000004364 calculation method Methods 0.000 claims description 16
- 230000006698 induction Effects 0.000 claims description 11
- 239000000203 mixture Substances 0.000 claims description 10
- 239000002904 solvent Substances 0.000 claims description 10
- 150000001875 compounds Chemical class 0.000 claims description 9
- 239000000126 substance Substances 0.000 claims description 8
- 239000012472 biological sample Substances 0.000 claims description 4
- 238000004590 computer program Methods 0.000 claims description 2
- 230000005284 excitation Effects 0.000 claims description 2
- 239000013074 reference sample Substances 0.000 claims 1
- 241000894007 species Species 0.000 description 183
- 238000011282 treatment Methods 0.000 description 28
- 238000012937 correction Methods 0.000 description 20
- 238000010586 diagram Methods 0.000 description 20
- 230000009466 transformation Effects 0.000 description 18
- 210000004556 brain Anatomy 0.000 description 16
- 230000008901 benefit Effects 0.000 description 14
- 239000000243 solution Substances 0.000 description 14
- 238000002474 experimental method Methods 0.000 description 13
- 230000008569 process Effects 0.000 description 13
- 230000003595 spectral effect Effects 0.000 description 13
- 230000001629 suppression Effects 0.000 description 13
- 238000011002 quantification Methods 0.000 description 12
- 230000010363 phase shift Effects 0.000 description 11
- 238000006243 chemical reaction Methods 0.000 description 10
- 230000006870 function Effects 0.000 description 10
- 238000004611 spectroscopical analysis Methods 0.000 description 10
- 150000002632 lipids Chemical class 0.000 description 9
- 230000002829 reductive effect Effects 0.000 description 8
- 238000006467 substitution reaction Methods 0.000 description 8
- 238000000354 decomposition reaction Methods 0.000 description 7
- 238000000605 extraction Methods 0.000 description 7
- 238000001727 in vivo Methods 0.000 description 7
- 230000000694 effects Effects 0.000 description 6
- 238000003384 imaging method Methods 0.000 description 6
- 238000004088 simulation Methods 0.000 description 6
- 210000001519 tissue Anatomy 0.000 description 6
- 230000003247 decreasing effect Effects 0.000 description 5
- 238000013139 quantization Methods 0.000 description 5
- 230000009467 reduction Effects 0.000 description 5
- CVSVTCORWBXHQV-UHFFFAOYSA-N creatine Chemical compound NC(=[NH2+])N(C)CC([O-])=O CVSVTCORWBXHQV-UHFFFAOYSA-N 0.000 description 4
- 238000002124 flame ionisation detection Methods 0.000 description 4
- 229910052739 hydrogen Inorganic materials 0.000 description 4
- 239000001257 hydrogen Substances 0.000 description 4
- 239000011159 matrix material Substances 0.000 description 4
- 230000036961 partial effect Effects 0.000 description 4
- 230000000717 retained effect Effects 0.000 description 4
- 230000002123 temporal effect Effects 0.000 description 4
- UFHFLCQGNIYNRP-UHFFFAOYSA-N Hydrogen Chemical compound [H][H] UFHFLCQGNIYNRP-UHFFFAOYSA-N 0.000 description 3
- 240000008042 Zea mays Species 0.000 description 3
- 239000002131 composite material Substances 0.000 description 3
- 238000001514 detection method Methods 0.000 description 3
- 239000003814 drug Substances 0.000 description 3
- 230000008030 elimination Effects 0.000 description 3
- 238000003379 elimination reaction Methods 0.000 description 3
- 230000001747 exhibiting effect Effects 0.000 description 3
- 238000000338 in vitro Methods 0.000 description 3
- 230000000670 limiting effect Effects 0.000 description 3
- 238000012986 modification Methods 0.000 description 3
- 230000004048 modification Effects 0.000 description 3
- FGUUSXIOTUKUDN-IBGZPJMESA-N C1(=CC=CC=C1)N1C2=C(NC([C@H](C1)NC=1OC(=NN=1)C1=CC=CC=C1)=O)C=CC=C2 Chemical compound C1(=CC=CC=C1)N1C2=C(NC([C@H](C1)NC=1OC(=NN=1)C1=CC=CC=C1)=O)C=CC=C2 FGUUSXIOTUKUDN-IBGZPJMESA-N 0.000 description 2
- 241001080024 Telles Species 0.000 description 2
- 230000003321 amplification Effects 0.000 description 2
- 238000003491 array Methods 0.000 description 2
- 125000004429 atom Chemical group 0.000 description 2
- 238000004422 calculation algorithm Methods 0.000 description 2
- 230000015556 catabolic process Effects 0.000 description 2
- 230000008859 change Effects 0.000 description 2
- 238000012512 characterization method Methods 0.000 description 2
- 238000011109 contamination Methods 0.000 description 2
- 238000007796 conventional method Methods 0.000 description 2
- 229960003624 creatine Drugs 0.000 description 2
- 239000006046 creatine Substances 0.000 description 2
- 238000006731 degradation reaction Methods 0.000 description 2
- 238000011161 development Methods 0.000 description 2
- 230000018109 developmental process Effects 0.000 description 2
- 230000003116 impacting effect Effects 0.000 description 2
- 230000005415 magnetization Effects 0.000 description 2
- 238000003199 nucleic acid amplification method Methods 0.000 description 2
- 230000010355 oscillation Effects 0.000 description 2
- 244000045947 parasite Species 0.000 description 2
- 230000003071 parasitic effect Effects 0.000 description 2
- 238000010183 spectrum analysis Methods 0.000 description 2
- 240000007594 Oryza sativa Species 0.000 description 1
- 235000007164 Oryza sativa Nutrition 0.000 description 1
- 241000135309 Processus Species 0.000 description 1
- 238000013459 approach Methods 0.000 description 1
- 230000003416 augmentation Effects 0.000 description 1
- 235000013405 beer Nutrition 0.000 description 1
- 239000012620 biological material Substances 0.000 description 1
- 210000004027 cell Anatomy 0.000 description 1
- ARUVKPQLZAKDPS-UHFFFAOYSA-L copper(II) sulfate Chemical compound [Cu+2].[O-][S+2]([O-])([O-])[O-] ARUVKPQLZAKDPS-UHFFFAOYSA-L 0.000 description 1
- 229910000366 copper(II) sulfate Inorganic materials 0.000 description 1
- 238000012217 deletion Methods 0.000 description 1
- 230000037430 deletion Effects 0.000 description 1
- 239000006185 dispersion Substances 0.000 description 1
- 230000005672 electromagnetic field Effects 0.000 description 1
- 229940082150 encore Drugs 0.000 description 1
- 238000009499 grossing Methods 0.000 description 1
- 150000002431 hydrogen Chemical class 0.000 description 1
- 230000002452 interceptive effect Effects 0.000 description 1
- 239000000463 material Substances 0.000 description 1
- 239000008155 medical solution Substances 0.000 description 1
- 230000003278 mimic effect Effects 0.000 description 1
- 239000003607 modifier Substances 0.000 description 1
- 238000001208 nuclear magnetic resonance pulse sequence Methods 0.000 description 1
- 238000000655 nuclear magnetic resonance spectrum Methods 0.000 description 1
- 238000005457 optimization Methods 0.000 description 1
- 238000005215 recombination Methods 0.000 description 1
- 230000006798 recombination Effects 0.000 description 1
- 238000011160 research Methods 0.000 description 1
- 238000012827 research and development Methods 0.000 description 1
- 235000009566 rice Nutrition 0.000 description 1
- 238000005070 sampling Methods 0.000 description 1
- 230000003068 static effect Effects 0.000 description 1
- 210000001179 synovial fluid Anatomy 0.000 description 1
- 230000036962 time dependent Effects 0.000 description 1
- 238000000844 transformation Methods 0.000 description 1
- 230000001052 transient effect Effects 0.000 description 1
- 238000011144 upstream manufacturing Methods 0.000 description 1
- 238000010200 validation analysis Methods 0.000 description 1
- 238000012800 visualization Methods 0.000 description 1
Images








Classifications
-
- G—PHYSICS
- G01—MEASURING; TESTING
- G01R—MEASURING ELECTRIC VARIABLES; MEASURING MAGNETIC VARIABLES
- G01R33/00—Arrangements or instruments for measuring magnetic variables
- G01R33/20—Arrangements or instruments for measuring magnetic variables involving magnetic resonance
- G01R33/44—Arrangements or instruments for measuring magnetic variables involving magnetic resonance using nuclear magnetic resonance [NMR]
- G01R33/46—NMR spectroscopy
- G01R33/4625—Processing of acquired signals, e.g. elimination of phase errors, baseline fitting, chemometric analysis
-
- G—PHYSICS
- G01—MEASURING; TESTING
- G01R—MEASURING ELECTRIC VARIABLES; MEASURING MAGNETIC VARIABLES
- G01R33/00—Arrangements or instruments for measuring magnetic variables
- G01R33/20—Arrangements or instruments for measuring magnetic variables involving magnetic resonance
- G01R33/44—Arrangements or instruments for measuring magnetic variables involving magnetic resonance using nuclear magnetic resonance [NMR]
- G01R33/46—NMR spectroscopy
- G01R33/465—NMR spectroscopy applied to biological material, e.g. in vitro testing
Definitions
- the present invention relates in general to nuclear magnetic resonance (NMR) techniques used in particular for the analysis of a sample.
- NMR nuclear magnetic resonance
- the present invention advantageously applies to the field of medicine for the analysis of biological samples of the human body, for example, or to the field of chemistry for the analysis of chemical compositions. It proves to be particularly advantageous for correcting the phase and / or the frequency of a free-of-induction decay signal (FID).
- FID free-of-induction decay signal
- the invention will be used to efficiently recombine NMR signals detected by antenna arrays.
- nuclear magnetic resonance NMR
- spectroscopy and spectrometry will be used interchangeably, techniques which make it possible to identify and / or quantify the content of species in a sample.
- Nuclear magnetic resonance is a complex phenomenon that is only fully described by the laws of quantum physics. As regards the understanding of the invention and of the state of the art, however, it is sufficient to know the main phenomena implemented by NMR and very briefly recalled below. It should be noted here that there is a very abundant technical literature on all aspects of NMR.
- B0 Placed in a strong magnetic field, traditionally noted B0, generally of the order of Tesla (T) and more, certain atoms acquire particular properties such that if they are disturbed by a radio wave of suitable frequency they then return a signal that we can analyze.
- T Tesla
- the atoms concerned are those which have an atomic nucleus with a non-zero magnetic moment or spin.
- the hydrogen (H) of water (H2O) which constitutes the major part of the human body has this property.
- the water molecule has two hydrogen nuclei or protons having a non-zero spin animated by a precessional movement of their axis at a particular frequency called the Larmor frequency.
- the nuclei Placed in a strong external static magnetic field, the nuclei then see their spin orient either in the direction of the external magnetic field, or in the opposite direction while undergoing a precession movement at the Larmor frequency depending on the intensity of the field. exterior B0.
- the nuclei can then be disturbed by a radio or radiofrequency (RF) wave all the more easily as the frequency thereof is close to the Larmor frequency and therefore preferably in resonance with the latter.
- the disturbance has the effect of changing the orientation of the spin until it possibly tilts in the other direction allowed by the external magnetic field B0. That is, the orientation is parallel or antiparallel to it and thus passes from one to the other.
- B1 the magnetic induction of the disturbing radio wave is applied perpendicular to that of B0 to tilt the spin of the nuclei. It is this tilting and the return to equilibrium or relaxation that generates the electrical signal detected in all NMR equipment.
- This signal is usually qualified as FID from the English “free induction decay” that is to say “free decay of the induction”.
- the electromagnetic disturbance B1 is applied using electric coils most often referred to as antennas.
- the coils or antennas are generally used both to apply the disturbance and to detect the electrical signals generated during the return to equilibrium of the nuclei. To do this, they are associated on the one hand with electronic circuits which will allow an electric current to circulate there for a controlled time at the Larmor frequency, which will generate the wave in the area of the body to be analyzed.
- electromagnetic field and the disturbing field B1 and on the other hand to electronic circuits which will make it possible to detect the electrical signals generated by the return to equilibrium of the nuclei after the electromagnetic disturbance has been interrupted.
- the signal to noise ratio is the key criterion of the electrical detection part of any NMR equipment. It must be high enough so that the signals detected are at a level above the noise which makes them usable by the application considered.
- the known techniques consist in carrying out a Fourier transform of the complex FID signal to obtain a spectral distribution of the sample. This spectral distribution makes it possible to compare the frequency and the amplitude of a reference signal with those of the signals of the metabolites to be characterized.
- the reference signal most often corresponds to a majority species in the sample.
- the reference signal is typically the water signal.
- this slippage is at least in part due to the difference which exists in practice between the demodulation frequency used by the receiver and the effective frequency of the reference signal.
- Another manual correction operation consists in rephasing the reference signal. Indeed, in practice there is necessarily a random shift between the phase of the signal used by the receiver and the phase of the reference signal. This results, on a representation of a complex signal of FID, by the fact that the first point of the FID is in general not real.
- phase shifts and frequency shifts are also generated by the use of multiple antennas.
- antenna structures have evolved a lot and research and development of NMR equipment now tends to favor the use, for the analysis of a given area of the human body, of antennas. multiple.
- These multiple antennas are generally identical and small in size and the signals detected separately are combined in order to obtain a composite signal which notably has a better SNR than if it had been obtained with a single antenna covering the same analysis area.
- the use of a plurality of antennas generally makes it possible to increase the speed of the acquisition, while maintaining a good SNR, which is essential when the sample is part of a living body and therefore very often not perfectly still.
- phased array antenna This type of antenna, called “phased array antenna”, is characterized by a markedly increased complexity of the electronic part and of the computer processing of the signals produced separately by each of the antennas of the network. It is indeed necessary to be able to recombine them efficiently despite the inevitable geometric, physical and electrical differences which exist between antennas and which must be able to be compensated in order to effectively obtain the expected improvements of the antenna array.
- the document US 2004/0095139 describes a solution for recombining FID signals from multiple coils.
- Another advantage consists in proposing a solution to simplify the complexity of NMR equipment, in particular those using several receiver coils.
- a step of identification and / or quantification of the species to be characterized from the modulus of the modified signal s ⁇ ( t ) of FID is then carried out.
- the invention makes it possible to obtain a very satisfactory SNR. Taking the module into account makes it possible to automatically correct the phase and frequency shifts due in particular to the movements of the sample during the duration of the FID, to inhomogeneities of the B0 field and the inevitable variations in behavior of the different antennas in the context of an acquisition by several antennas.
- the signal of the reference species acts as a carrier for the signals of the species to be characterized and the phase information of the latter is retained despite the module being taken into account.
- the spectrum obtained makes it possible to identify and characterize very easily the species in the sample.
- the replacement of a portion of the spectrum S (par) by a portion of the spectrum Sref ( ⁇ ) resulting from a modeling of the reference species makes it possible to obtain the modified spectrum S ⁇ ( ⁇ ) which does not present no noise on its portion not including the species to be characterized.
- the signal s ⁇ ( t ) from which the modulus is calculated then only comprises the noise coming from the portion of the spectrum S ( ⁇ ) comprising the species to be characterized. Steps c to f therefore make it possible to prevent, when the modulus is taken into account in step h, there is a superposition of the noises initially carried by the two portions of the spectrum S ( ⁇ ).
- the SNR of the signal obtained is therefore considerably improved, since the drawbacks inherent in taking the module into account are limited or even eliminated by steps c to f.
- the invention makes it possible, thanks to the module, to dispense with additional steps specially dedicated to phase and frequency corrections, these steps usually requiring significant processing time, or even very often manual intervention by an operator.
- This method is particularly advantageous in the context of a spectroscopic / spectrometric nuclear magnetic resonance (NMR) analysis of a sample. It makes it possible to easily identify and / or quantify the species in the sample.
- NMR nuclear magnetic resonance
- the quantity of data to be processed is greatly reduced compared to that which must be processed in a conventional manner where the complex signal is needed to calculate the phase shift of the signal.
- the calculation of the modulus can be performed in the real domain since it suffices to take the square root of the sum of two numbers, each squared, while the calculation of the phase requires working with complex numbers, this which is more difficult to implement.
- the time and cost of treatment are therefore considerably reduced, and the fact that the manual intervention of an operator is no longer required makes it possible to perform automatic treatment in real time without impacting users.
- the invention thus offers significant advantages in terms of precision, reliability, reproducibility, processing time and cost reduction.
- complex signals S (t) of FID originating from several voxels of the sample are acquired, and in which is carried out, after the calculation of the modulus of the modified signal s ⁇ ( t ) of FID for each of the voxels, a step of spatial filtering.
- Spatial filtering is applicable when working on CSIs, whether they are acquired by one or more coils.
- spatial filtering comprises the following steps in the case of a CSI with two spatial dimensions: multiplying each row and each column of the CSI matrix, by a "bell" function (for example Gaussian, cosine, hanning, hamming , ...) before Fourier transformation in the space domain.
- a "bell" function for example Gaussian, cosine, hanning, hamming , ...) before Fourier transformation in the space domain.
- a CSI analysis involves the processing of a plurality of voxels and can for example result in a plurality of spectra each corresponding to a voxel or to a two-dimensional image, for example.
- the step of calculating the modulus of the modified signal s ⁇ ( t ) of FID and for the purpose of identifying and / or quantifying the species to be characterized from the modulus of the modified signal s ⁇ ( t ) of FID it is possible , according to one embodiment applying a Fourier transform to a signal comprising at least the modulus of the modified signal s ⁇ ( t ) of FID.
- the FFT is preferably applied to the modulus of the modified signal s ⁇ ( t ) of FID.
- the step of calculating the modulus of the modified signal s ⁇ ( t ) of FID and for the purpose of identifying and / or quantifying the species to be characterized from the modulus of the modified signal s ⁇ ( t ) of FID it is possible , according to another embodiment, dispense with applying a Fourier transform to a signal comprising at least the modulus of the modified signal s ⁇ ( t ) of FID.
- the identification and / or quantification is then carried out in the time domain.
- well-known software makes it possible to sum elementary FIDs, each corresponding to a species, so as to approximate the modulus of the modified signal s ⁇ ( t ) of FID.
- the elementary FIDs selected as well as the coefficient associated with them in order to best reconstitute the modulus of the modified signal s ⁇ ( t ) of FID provides information on the nature and quantification of the species present in the sample. It will be noted that even by carrying out this quantization step in the time domain, it is often recommended to carry out a Fourier transform in order to be able to visualize the result.
- the content of the reference species in the solvent is at least greater than 5 times, preferably 10 times, preferably 10 3 times and preferably 10 5 times the content of each of the species to be characterize.
- the content of the at least one species to be characterized is the mass content in the sample.
- the signal of the reference species acts as a carrier for the signal of the at least one species to be characterized.
- the content of the reference species in the sample is sufficiently greater than the content of the species to be characterized in the sample for the signal of the reference species to act as a carrier for the. signal of at least one species to be characterized.
- the reference species has a resonant frequency.
- the relative contents of the reference species and of the at least one species to be characterized as well as their relative relaxation times are chosen so that the amplitude of the signal of the reference species or at least twice the amplitude of the signal of the at least one species to be characterized.
- the sample is chosen so that in each signal S (t) complex of FID acquired the amplitude of the signal of the reference species is at least two times greater than the amplitude of that of the au least one species to characterize.
- the sample is chosen so that in each signal S (t) complex of FID acquired the amplitude of the signal of the reference species is at least three times greater, or even at least five times greater, or even at least ten times greater, or even at least one hundred times greater than the amplitude of that of each of the species to be characterized.
- a plurality of complex FID signals S (t) is acquired.
- the step of calculating the modulus of the modified signal s ⁇ ( t ) of FID is performed for each modified signal s ⁇ ( t ) of FID.
- the modules of the modified signals s ⁇ ( t ) are summed so as to obtain a combined signal FID.
- the step of identifying and / or quantifying the species to be characterized comprises the application of a Fourier transform to said summation.
- the antennas are coils and the complex acquired FID signals originate from the same coil.
- the invention advantageously makes it possible to provide an efficient and simple correction to the phase shift and the frequency shift due in particular to the movements of the sample during the acquisition.
- the antennas are coils and the complex FID signals acquired come from different coils.
- the invention advantageously makes it possible to provide an efficient and simple correction to the phase shift of each coil relative to one another, as well as to the phase shift and the frequency shift due in particular to the inhomogeneity of the field B0 .
- the antennas are coils and the complex FID signals acquired come from different coils and several Complex FID signals are acquired for at least some coils.
- the invention advantageously makes it possible to correct in an efficient and simple manner the phase shift and the frequency shift due in particular to the movements of the sample and to the inhomogeneity of B0.
- a step of calculating a weighting factor is carried out for each coil and each weight is weighted. modulus of FID by the weighting factor of the coil from which it comes.
- the step of calculating a weighting factor is carried out by the method of the sum of the squares of the amplitudes at the start of the FID module.
- a single complex signal S (t) of FID is acquired, a single spectrum S ( ⁇ ) of FID is obtained by applying a Fourier transform to the parts real and complex of said single complex signal S (t) of FID.
- a Fourier transform is applied to a single modulus of the modified signal s ⁇ ( t ) of FID.
- a spatially encoded FID signal is acquired, this acquisition is repeated several times, preferably at least twice, in order to obtain several encoded signals, each of said encoded signals being then decoded so that it is associated with a voxel of the sample and generating an FID modulus for the FD signal associated with each voxel.
- the sample is a sample of biological material
- the reference species is water and the species to be characterized are metabolites.
- the sample is a chemical composition
- the reference species is water or another solvent and the species to be characterized are chemical compounds.
- the sample comprises several species to be characterized.
- the constant B0 field is applied to several voxels of a sample and the frequency spectra of the combined FID signals of the different voxels are used to generate one or more spectroscopic images.
- the analysis is a spectroscopic or spectrometric analysis.
- the species to be characterized has at least a first resonant frequency located to the right of the resonant frequency F 0Ref of the reference species and at least one second resonant frequency located to the left of the frequency of F 0Ref resonance of the reference species.
- the method according to the invention is carried out for each of the two half spectra.
- step f is carried out. considering that said second spectrum portion is the portion located to the left of the resonant frequency F 0Ref of the reference species, so as to obtain a first modified spectrum S ⁇ ( ⁇ ) of FID representative of the first resonant frequency.
- Step f is also carried out. considering that said second spectrum portion is the portion located to the right of the resonant frequency F0Ref of the reference species, so as to obtain a second modified spectrum S ⁇ ( ⁇ ) of FID representative of the second resonant frequency.
- steps g are applied. and h. to each of the first and second modified spectra S ⁇ ( ⁇ ) of FID.
- the method according to the invention is implemented by computer.
- the present invention relates to a computer program product or to a non-transient medium readable by a computer, comprising instructions, which when they are carried out by at least one processor, executes at least the steps c. at h. of the process according to the invention mentioned above.
- antenna designates any type of electromagnetic wave receiver.
- the figure 1 briefly describes the type of signals detected by any antenna of NMR equipment.
- the signal can be observed after each emission of an electromagnetic pulse B1 used to disturb the hydrogen nuclei or protons at equilibrium in the constant magnetic field B0.
- the RF frequency used must preferably be in resonance with the Larmor frequency of the protons for the intensity of the magnetic field B0 developed by the NMR equipment considered and which is all the higher as the field B0 is large. As mentioned it grows 42 MHz per tesla.
- the NMR signal detected is referred to as FID for “free induction decay”, that is to say “free decay of the induction”. It is representative of the return to equilibrium of nuclei after the electromagnetic disturbance to which they are subjected has ceased.
- FID free induction decay
- the captured FID signal comes from an elementary volume entity of the area covered by the antenna 101. This elementary entity is qualified as voxel 110. The physical size of a voxel depends on the volume resolution of the NMR equipment used.
- the signal captured by the antenna is conventionally processed by an electronic receiver 120 mainly comprising an analog amplifier 121 and two analog-to-digital converters (ADC) 124.
- ADC analog-to-digital converters
- a frequency conversion and a frequency conversion are effected in effect.
- the purpose of frequency conversion is to transpose the FID signal into a frequency range compatible with the operation of the following ADCs.
- filtering 123 After filtering 123, a complex signal is thus obtained for each antenna having a so-called “real” part and a so-called “imaginary” part.
- the analog electrical signals thus obtained, both very real, are then each sampled by an ADC 124 so as to have a complex FID signal in digital form 130 having a “real” component 132 and an “imaginary” component 131, c 'that is to say in quadrature with the real part.
- the number of digital samples available for each of the channels is of the order of 2 10, that is to say 1024 samples.
- the digital signal 130 is thus capable of being processed using all software means and hardware that has been developed for decades for digital processing of analog signals. These means include in particular specialized digital processors called “signal processors” and specific algorithms, in particular those for implementing Fourier transforms which make it possible to perform a spectral analysis of the time signals received.
- the diagrams 140 and 150 represent, in analog form, the two components of an exemplary FID signal. It is, respectively, the real part and the imaginary part of an FID signal captured by the antenna after amplification, conversion and detection in quadrature of the signal.
- figure 1 represents the simple case of a single acquisition of the FID signal from a single antenna. It is in fact assumed in this simple example that the captured signal is of sufficient amplitude to be processed after a single acquisition and that it is not necessary to carry out several successive acquisitions to improve the SNR as will be seen in some of the cases described below.
- the water signal is normally "in resonance", that is to say that the conversion frequency of the receiver is adjusted exactly to the resonant frequency of the water signal.
- this setting is correct, the water signal does appear as a decreasing exponential.
- the frequency of the water signal is slightly different from the conversion frequency. This results in an oscillation of the FID signal.
- the decreasing exponential is then modulated by a sine whose frequency is equal to the difference between the frequency of the water signal and the conversion frequency of the receiver.
- the oscillation of the FID signal of the figure 1 translates this shift into frequency.
- An acquired signal exactly "in resonance” would be similar to that of diagram 222 of the figure 2 .
- phase of the signal it is arbitrary because the phase of the received FID signal is completely independent of the phase of the conversion signal from the receiver.
- the frequency conversion at the level of the receiver is done by subtracting from the FID signal a signal of frequency equal to the Larmor frequency. But the receiver does not know the phase of the FID signal. There is therefore necessarily a random shift between the phase of the signal used by the receiver and the phase of the water signal. This is reflected in the figure by the fact that the first point of the FID is generally not real.
- the coordinates of this first point in the complex plane are in this example, if we refer to diagrams 140 and 150, approximately (-60, -100). If the signal was in phase, the coordinates of this point would be (116,0) ie 116 for the real part, and 0 for the imaginary part.
- the figure 2 compare, from the case of figure 1 , that is to say that of a single antenna and a single acquisition of the signal, the method of the invention and the conventional processing of the FID signal.
- the conventional processing of the FID signal is therefore carried out in the complex plane.
- the corresponding Fourier transform 210 which makes it possible to go from the time domain to the frequency domain and to obtain a spectral analysis of the received signal, reflects the frequency 213 and phase shifts possibly present in the complex signal 130 thus obtaining the frequency spectrum 212 to which it is necessary to apply successively a phase 214 and frequency 216 correction to find the water signal 211 in resonance, that is to say fixed on the frequency 0 of the Fourier transform
- the complex NMR signal is obtained by phase-shifting part of the received signal by 90 °.
- the signal collected is quite real, and once all the operations have been carried out in the complex plane, for greater mathematical ease, we arrange for the spectrum obtained to be also real.
- the imaginary part introduced for reasons of ease of calculation is then removed. If we assume that the signal FID is a decreasing exponential we then obtain narrow so-called “Lorentzian” lines such as those represented in diagram 214.
- the lines of diagram 212 are a mixture of Lorentzian and rays in dispersion.
- the phasing or phasing operation consists in recovering the Lorentzians in the real part and in dispersing the lines in the imaginary part. Once this operation has been carried out, the imaginary part can be put aside and we only continue to work on the real part.
- the frequency slip is the same as that previously described in figure 1 . In the figure 1 it results in a modulation of the FID signal while in the figure 2 it is its spectral representation that appears.
- the frequency slip is in this case, as we have seen, due to the difference between the demodulation frequency used by the receiver and the effective frequency of the water signal.
- the invention allows these two operations to be carried out at one time.
- the processing according to the invention of the signal captured by the antenna begins with the calculation of the modulus 220 of the complex signal 130 as defined above.
- a 0 (t) is the modulus or amplitude of the signal complex.
- This module is independent of frequency and phase. From a practical point of view, the modulus at each instant t is therefore the square root of the sum of the squares of the real and imaginary parts of the FID signal at this instant t as captured and converted by the electronic module 120 associated with each antenna.
- the signal obtained therefore corresponds at all times to the module of the FID. It is qualified in the present patent application as an “FID module” or more simply as a module.
- the Fourier transform 230 is then applied to the FID module 222 in order to obtain its frequency spectrum 232.
- the modulus of the signal captured by the antenna not carrying any frequency or phase information therefore does not need to be applied to it. corrections 214 and 216 of the conventional processing mode briefly described above.
- the spectrum of water 231 is then always well centered on the frequency 0.
- the spectrum of the module which is a signal having only a real part, is characterized by the fact that it is symmetrical 233. It can be used directly. by the following processes which are specific to each NMR application.
- the invention thus makes it possible to dispense with steps dedicated to phase and frequency corrections, these steps usually requiring significant processing time, or even very often the manual intervention of an operator.
- a sample will be chosen which does not present, with a conventional solution based on a Fourier transform in the time domain, a signal on either side of the frequency corresponding to that of the majority species.
- the spectrum of the module is symmetrical, only one of the halves is generally retained. It will also be noted that the Fourier transform of the module of the FID is simpler in particular because the quantity of data to be processed is half of those which must be processed in a conventional manner where one operates simultaneously on the real parts and on the imaginary parts of the captured FID signals. Processing time is therefore considerably reduced, which allows processing in real time without impacting users.
- the fact of working only on a real signal halves the occupation of the random access memory of the computer. This allows you to work on a larger volume of data without risking a slowdown of the machine.
- the fact of having to keep only half the spectrum after processing divides by four the total volume of data to be saved.
- the RSB remains perfectly satisfactory.
- the invention is intended more particularly for NMR applications which are interested in the analysis of the secondary peaks 234 which appear in the spectral decomposition and which are generated by metabolites possibly present in the tissues examined.
- the water constituting the major part of the tissues generates a signal of very high amplitude 231 which acts as a carrier and as a reference for the secondary peaks 234 which one wishes to detect and which are characteristic in the voxel examined for the presence of metabolites .
- the shift or frequency shift appears in the spectral decomposition in the form of shifted secondary peaks which reveal the presence of these metabolites.
- the frequency shift is characteristic of the nature of the metabolite.
- the area of the peak, relative to that of water, makes it possible to quantify their concentration in the tissue examined.
- the figure 3 illustrates the case where it is necessary to carry out several successive acquisitions 310 to obtain a signal FID having a sufficient SNR to be able to be used by the application.
- the conventional processing and according to the invention of the FID signal are essentially identical to what is described in the figure 2 .
- the only differences concern the summation steps.
- the real 320 and imaginary 330 parts of the successive captured FID signals must be summed separately.
- the modulus 340 of each FID signal is first calculated. Only the FID modules then need to be summed 350 before applying the Fourier transform 230 to the resulting module, which substantially simplifies the calculation process in the case of the invention.
- the summation is in this case carried out on phased and aligned signals with respect to each other, unlike the conventional case. This makes it possible to obtain an optimum SNR.
- the figure 4 compares experimental results which illustrate the advantage of using module 420 for processing FID signals instead of using conventional processing separate from real and imaginary parts 410.
- Figures 410 and 420 emphasize the interesting part of each of the spectra, that is to say they only show the parts relating to the metabolites.
- the water signal and the symmetrical volume signal have been eliminated in order to make the 422 region of the spectrum more visible.
- Diagram 420 shows that the processing of the module significantly improves the SNR of the captured FID signal and makes it possible to reduce the width of the lines of the spectrum.
- the reduction in the width of the lines reveals some small secondary resonances 422 which were not visible in the conventional spectrum.
- the invention thus makes it possible to detect species that are difficult to detect or even not detect with the solutions of the prior art.
- the shape of the resonances is also improved 424.
- the figure 5 illustrates the case where a spectroscopic image of a volume of tissues including several voxels is acquired.
- This type of analysis by CSI is practiced in a conventional manner by superimposing magnetization gradients on the fixed magnetization B0 so as to be able to practice a spatial discrimination of the signals originating from each of the voxels.
- This case is similar to that of the figure 1 but is intended for a volume of voxels 510 for which one can observe between them phase and frequency shifts due to inhomogeneities of the magnetic field B0.
- the global corrections are those which concern all the FID signals identically. These are mainly frequency and phase shifts between the demodulation signal from the receiver and the signal actually acquired.
- the local or relative corrections are those which relate to the phase and frequency differences observed between two FID signals acquired, either from two different coils, or successively by the same coil or even if the FID signals come from spatially different regions. The differences observed are, depending on the case, caused by: a movement of the patient, the electronics of the coils, the spatial variations of the B0 fields or a combination of these phenomena.
- the figure 6 compares experimental results obtained under the conditions described in the previous figure for two voxels located at different positions in a human brain.
- the diagrams 610 and 620 on the one hand and 630 and 640 on the other hand describe, respectively, the signals obtained for two voxels at different positions (1 and 2) with a conventional processing of the captured FID signals and a processing according to the invention of their modules.
- the figure 7 illustrates the case of acquiring FID signals from an antenna array as discussed in the chapter on state of the technical.
- the invention is particularly advantageous for this complex case where it is also necessary to be able to easily correct the large differences, in particular of phase, which may exist between the individual antennas.
- the FID signal transmitted by each voxel 110 is captured by several antennas.
- Two antennas, 101 and 102, are shown in this example. It is common practice to combine a larger number, for example arrays of eight antennas are frequently used.
- Each individual antenna is provided with its own reception system, 1201 and 1202 in this example, each delivering a complex FID signal, 1301 and 1302.
- the diagrams 710 and 730 on the one hand and 720 and 740 on the other hand are, respectively, examples of the real parts and of the imaginary parts of the complex FID signals delivered by each of the antennas. As expected, strong differences 750 can be seen in the phase and amplitude of the signals captured by the individual antennas of the antenna array.
- the figure 8 illustrates the steps of the method of the invention for the processing of FID signals captured from an antenna array and compares them with those of their conventional processing.
- the process of the invention remains extremely simple and is not significantly different from what has been described in the figure 3 for the successive acquisition of FID signals from a single antenna.
- the signals are acquired, preferably simultaneously, and the module 340 is calculated on each of the signals acquired from the individual antennas 101 and 102 in this example. It is of course not excluded to also proceed, as in the figure 3 , to multiple acquisitions in the case of an antenna array.
- a notable difference in the case of an antenna array is that in the next step 810 it is necessary to correct the amplitude of the modules coming from different antennas in order to take into account all the differences that inevitably exist between the individual antennas forming the network.
- the summation 350 of the moduli whose amplitude has just been weighted is then carried out. It is then possible to calculate the spectral composition of the modulus resulting from the combination of the FID signals using a Fourier transform 230.
- weighting of the FID signals is only optional.
- the figure 9 compares experimental results obtained from an antenna array under the conditions described in the previous figure.
- the diagrams 910 and 920 show the spectra obtained after acquisition and summation of the FID signals, Fourier transformation then elimination of the water line in these examples in order to better visualize the metabolites.
- Diagram 920 shows the real part of the spectrum obtained at the end of the conventional processing of the FID signals. As mentioned previously, the imaginary part is introduced artificially by the receiver and does not contain any additional information. It is therefore only used during signal processing, never in the presentation of results.
- the diagram 910 shows the result of the processing according to the invention of the module of the FID signals. As already mentioned, the processing of the module leads to a symmetrization of the spectrum of which only half is kept. The peaks present in diagram 920 obtained with the known systems are clearly found in diagram 910 obtained with the solution of the invention.
- Characterizing a species generally consists in identifying the nature of this species in the sample and / or in quantifying it. It is further noted that its peaks are very narrow, which allows precise characterization and shows that the signal / noise ratio is not visibly degraded by the processing according to the invention of the signal modulus.
- the water signal is much higher than that of the metabolites, of the order of 10 5 times.
- ADC analog digital converters
- the water signal is typically suppressed in two stages.
- a first step is performed during the acquisition using an appropriate sequence (it will be an attenuation in this case).
- a second suppression is carried out after summation to reduce the number of signals to be processed, generally just before the quantization of the spectra.
- the purpose of the first deletion is to reduce the amplitude of the signal received by the analog-to-digital converter of the receiver, and therefore to keep the full coding range, which is typically 16 bits, to digitize the signals as well as possible. the little ones.
- the second step is performed to facilitate the quantification of the metabolites. For that one models the signal of water by carrying out a decomposition in singular value of the signal, and by retaining in the principal components only those which correspond to the signal of water. We reconstruct a signal from these values which we subtract from the spectrum.
- the water signal is used as a phase and frequency reference signal in the context of the invention. Only partial removal of the water is then practiced to keep a signal of sufficient amplitude to be exploited. As already also mentioned previously the water signal can also be used as a concentration reference to estimate the absolute concentration of the metabolites. In this case, it is necessary to obtain the entire signal from the water. Often, to reconcile the requirements linked to a better visualization of the metabolites on the one hand and to their quantification on the other hand, it is possible to carry out two successive experiments, one with partial or total elimination of water and the other. other without.
- the reference species is considered to be water.
- the invention is however not limited to water as a reference species. Thus, these equations will be able to be used by replacing the water by any solvent acting as a reference species.
- the use of the FID signal module leads to a symmetrization of the spectrum around the frequency of the reference species, most often water 1010, such that, as illustrated in the figures 10a and 10b , noise 1030 and any artefacts 1020 which are located to the left of the spectrum are then superimposed on the signal resulting from the symmetrization as illustrated in figure 10b .
- noise 1030 and any artefacts 1020 which are located to the left of the spectrum are then superimposed on the signal resulting from the symmetrization as illustrated in figure 10b .
- the first step is to model the water spectrum from a sample that is to be characterized.
- This modeling will be used in the invention to replace half of the acquired spectrum, located to the left of the frequency of the reference species, by the corresponding portion of the model.
- the spectrum thus recomposed contains neither noise nor artefact in the left part.
- the right part corresponds to the acquired signal comprising the species to be characterized.
- the HLSVD method comprises the following main steps: A matrix is created from the FID signal (the first row of this matrix contains the FID signal, the following rows contain the circular permutations of this FID signal, of 1 point for the 2 nd line, 2 point for the 3 th line, etc.)
- This matrix is broken down into eigenvalues and eigenvectors, then only the 10 or 20 principal components are retained.
- the method according to the invention naturally does not apply only to species which exhibit one or more peaks (resonance frequencies) on one side only of the peak (resonance frequency) of the reference species. .
- the peak 1020 is not an artefact but is a peak (that is to say a resonant frequency) of the species to be characterized, typically a metabolite.
- This species to be characterized thus comprises the following two peaks 1020, 1040 (that is to say two resonance frequencies) located on either side of the resonance peak 1010 of the reference species.
- Step 11d corresponds to step 11b, but instead of replacing the left part of the signal S ( ⁇ ) by the left part of Sref ( ⁇ ), we substitute the right part of the signal S ( ⁇ ) of the figure 10a , that is to say the one comprising the resonance peak 1040 by the right part of Sref ( ⁇ ) of the figure 11a , so as to maintain the resonance peak 1020 of the figure 10a .
- the modified signal s ⁇ ( t ) of FID representative of the resonant frequency 1020 figure 11e ).
- each of the peaks 1020, 1040 for a species to be analyzed.
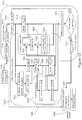
- the figure 13 shows, in frame 1310, the flowchart of the processing of the FID signal module as described previously in the figures 1 to 9 and which more particularly applies to a CSI type process in this example without this being limiting.
- the additional processing is hereinafter referred to as " DFRR ”, acronym for“ Downfield region replacement ”in reference to the replacement of part of the spectrum by a model as already briefly described in the figures 11a to 11c .
- This processing can also be qualified as the substitution of a part of the spectrum by the corresponding part of the spectrum of the reference signal.
- the FID of a first voxel S (t) is extracted 1313 from the CSI file 1312 and processed using a modeling method such as the HLSVD method mentioned above.
- the signal model of the reference species is thus extracted 1321 from the singular value decomposition by selecting the resonances which are in a range of plus or minus 0.5 ppm (parts per million) around the resonance of the water.
- the signal of the reference species is designated by the generic term Sref (t).
- h 2 o ( t ) This reference species often being water, in the example which follows, the term used for the signal of the reference species will be h 2 o ( t ) .
- the invention applies whatever the reference species, the latter being advantageously taken among a solvent.
- h 2o ( t ) is used to remove the signal from residual water and is subtracted from the signal S (t).
- both the FFT of S (t) and of h 2o ( t ) are calculated leading to obtain, respectively, S ( ⁇ ) and H 2 O ( ⁇ ) (the latter term designating the frequency spectrum of the signal of the reference species, typically water.
- S ( ⁇ ) can be separated into two regions: the region towards the weak fields (DFR), which is half of the part of the spectrum located at the left of the signal of the reference species; and the region towards strong fields (UFR) which is the other half of the part of the spectrum to the right of the resonance of the reference species.
- DFR weak fields
- UFR strong fields
- the spectrum of the water signal modeled from S (t) can be split into two regions: the region towards weak fields, which is half of the part of the spectrum to the left of the signal from l 'reference species; and the region towards the strong fields which is the other half of the part of the spectrum to the right of the resonance of the reference species.
- Each of these two regions extends from the resonance frequency F 0Ref ' of the reference species in this spectrum resulting from a modeling.
- the DFR contains only noise and artefacts. This region can therefore be replaced 1324 by the same region extracted from the model of the water H 2 O ( ⁇ ) signal without modifying the quantization of the spectrum.
- the standard processing 1360 can be carried out as it would be done on the original raw data in the case of a conventional processing which would take the direct path 1340, as provided for in the state of the art.
- the step of calculating the modulus of the modified signal s ⁇ ( t ) of FID and its reintroduction 1315 into the CSI file it is possible, according to one embodiment, to dispense with applying a Fourier transform.
- the identification and / or quantification is then carried out in the time domain.
- well-known software makes it possible, for example, to sum predetermined elementary FIDs and each corresponding to a species, so as to approximate the modulus of the modified signal s ⁇ ( t ) of FID.
- the elementary FIDs selected as well as the coefficient associated with them in order to best reconstitute the modulus of the modified signal s ⁇ ( t ) of FID provides information on the nature and quantification of the species present in the sample.
- a Fourier transform can be applied to it.
- a spectrum is then obtained for each of the moduli of the modified signal s ⁇ ( t ), each of these spectra corresponding to a voxel.
- this method is not limiting to CSI imaging. It can in fact be applied to a monovoxel treatment. In this case, the process will be more or less the same, except for the steps dedicated to spatial processing which then no longer have any reason to exist.
- the spatial filtering step is in particular eliminated.
- the invention also applies to cases where the species to be characterized are located to the left of the signal of the species of reference. reference.
- the species which it is sought to analyze are found to the right of the reference signal.
- the species to characterize to the left of the water may be species to characterize to the left of the water, but they are generally not visible under normal spectroscopy / spectrometry conditions as practiced in biomedical medicine.
- the invention extends to cases where the species to be characterized are to the left of the signal of the reference species. In this case, it is naturally the right portion of the modeled signal of the reference species which will be substituted for the right portion of the spectrum of the FID, the left portion bearing the species to be characterized being kept. For example, it will then be necessary either to treat the spectrum in two stages (one keeps in one case the DFR, then one remakes the treatment while keeping the UFR). It is also possible that the UFR species do not appear at the same distance from the reference signal as any of the DFR species and that there is no problem with symmetrization in this case.
- N is the number of points in time.
- the noise obtained in NMR is characterized by a Gaussian distribution centered on zero.
- the noise In the absence of a signal, which is the case here, the noise is therefore centered on the X axis. In the presence of a signal, the noise is naturally superimposed on the signal, the return to the centered position then depends on the width of signal line (typically a few Hertz for the width at half height, but in the case of a Lorentzian the wings are relatively wide) and if the signal is intense (water) it can be several hundred Hertz.
- the width of signal line typically a few Hertz for the width at half height, but in the case of a Lorentzian the wings are relatively wide
- the signal is intense (water) it can be several hundred Hertz.
- the modulus of a noise characterized by a Gaussian distribution having an average centered on zero is distributed according to the so-called Rice law. This distribution can be approximated by a Gaussian distribution when the SNR is greater than 3, and by a Rayleigh distribution when the SNR tends to zero.
- the characteristics of the RSB obtained under the two conditions above have already been discussed in the description of the figures 1 to 9 . Only the modification introduced by the DFRR 1320 processing is discussed further.
- the standard deviation of ⁇ ( ⁇ ) is equal to that of ⁇ ( t ) which is itself equal to ⁇ 2 .
- the standard deviation of the signal noise obtained using the DFRR transformation is reduced by a factor 2 by comparison with the standard deviation obtained by using only the processing of the module. This is exactly the reduction in SNR that is observed when we compare the processing using the module with the conventional processing for the same Gaussian approximation of the noise.
- the DFRR processing allows us to find the lost SNR resulting from the processing of the module in the presence of a Gaussian distribution of the noise.
- step 1351 corresponds to the subtraction of the spectrum S Mod ⁇ to the spectrum S ⁇ Mod ⁇ so as to obtain the “sidebands” 1352.
- step 1353 corresponds to the subtraction of the “sidebands” 1352 from the spectrum S ⁇ Mod ⁇ to obtain a new spectrum 1354 in which the "sidebands" 1352 are removed.
- the subtraction 1351 can be carried out indifferently on the FID in the as indicated in figure 13 or on the spectrum as indicated in figure 12c-12e , the FFT being distributive with respect to the addition.
- a smoothing function is applied to the subtraction obtained.
- This embodiment has the particular advantage of being particularly simple, reliable and effective for improving the SNR. It thus makes it possible to take advantage of the advantages of the module by automatically eliminating the antisymmetric artefacts but without suffering from the limitations usually induced by the module with the superposition of the noise present on either side of the resonance frequency of the species of reference.
- Spatial filtering is applicable when working on CSIs, whether they are acquired by one or more coils.
- the voxels involved are therefore not aligned in phase and frequency and the resolution of the resulting spectrum may be degraded leading to a decrease in the SNR as illustrated in the section below outlining the results.
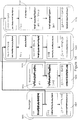
- the figure 22 partly takes up the figure 13 .
- the steps bearing the same references as those of the figure 13 are identical to those described above with reference to figure 13 .
- This figure illustrates in dotted lines the conventional processing (without taking into account the module). It also illustrates the processing 1310 by the module applied to the complex signal S (t) of FID (step 1314).
- This flowchart also illustrates the DFRR processing associated with the processing by the module (steps 132 to 1326).
- the spatial filtering is performed before the computation of the modulus (steps 1314 or 1326) with the consequences discussed above. We will therefore prefer the case where this spatial filtering is carried out after steps 1314 or 1326.
- step 1311, 1312 and 1317 of the figure 13 no longer exist and step 1313 becomes the extraction of an FID from among those which have been acquired.
- step 1326 there is then an FID which can be quantified in the time domain, or perform a temporal Fourier transformation to obtain a spectrum which can be quantified in the spectral domain.
- the final validation of the result will preferably be done in the spectral domain since it is a space where an operator can easily judge the quality of a spectrum. Indeed, RSB, presence or absence of artefacts, width of the lines cannot be appreciated visually by an operator in the time domain.
- the processing will be carried out for each FID before summing them (at step 1315) of the figure 13 .
- the stages between 1313 and 1315 of the figure 13 can replace steps 340 of the figure 3 , the “calculation of the Module of each FID” step of the figure 5 (in the case where the modulus is calculated after the spatial filtering) and step 340 of the figure 8 , as emerges from the above description.
- the field of view is 240x240 millimeters (mm) and the slice is 20 mm thick.
- the total acquisition time is 11 minutes and 7 seconds.
- the results of CSI experiments with long echo times are also presented, in particular with an echo time of 135 ms, all the other parameters remaining identical.
- the subsequent processing was carried out using a specific software called CSIAPO which applies a spatial filtering called Hanning, a filling with zeros of the data acquired on 8000 time domain sampling points and residual signal removal from water using HLSVD technique.
- the first signal r ( t ) 1411 consists of a normal distribution, in the statistical sense of the term, composed of two times 4000 samples forming a pseudo-random sequence with a mean of zero and a standard deviation of 10 and representing the distribution of Rayleigh.
- the second signal g ( t ) 1412 is obtained by adding a constant signal with an amplitude of 50. It represents the Gaussian distribution.
- the figure 14 illustrates the results obtained on these two noise signals at each stage of the processing using either the modulus processing alone, or the modulus processing with DFRR.
- and ⁇ g ( t ) ⁇ are extracted and after the FFT transformation the noise spectra R Mod ⁇ and G Mod ⁇ are obtained.
- these noise signals are multiplied by a factor of two in order to compensate for the loss of signal amplitude induced by the processing of the module.
- the change in SNR can then be estimated visually by only evaluating the amplitude of the noise.
- a Fourier transform is applied to the signals r ( t ) and g ( t ) which leads respectively to obtaining the signals R Mod ⁇ 1421 and G Mod ⁇ 1422, that is to say the noise signals that would be obtained using conventional processing.
- the DFR of each signal is then replaced by zeros, operation at the end of which one obtains R ⁇ ( ⁇ ) 1431 and G ⁇ ( ⁇ ) 1432.
- a Fourier transform is applied to these two signals. inverse or iFFT, the module is extracted then we apply an FFT again and we multiply by a factor of two for the same reason as before, which leads to the final result R ⁇ Mod ⁇ 1441 and G ⁇ Mod ⁇ 1442.
- Tables 1a and 1b below give the standard deviation of the noise obtained at various interesting steps when this simulation is repeated 1000 times.
- Table 1a shows the results obtained in the time domain and Table 1b in the frequency domain.
- This gain can be up to a factor of 4.6 near the limits of the spectral window.
- these two regions are present in an acquired FID signal and the resulting SNR is between these two limits according to the ratio which exists between the noise which can be approximated by a Gaussian distribution and that which approaches a distribution of Rayleigh in the original FID signal.
- the condition for the Rayleigh law to apply is not desirable, it should be noted that it is possible to add a constant signal just before the extraction of the module and to remove it after extraction of the one. -this. If the value of the constant signal is chosen to be greater than three times the standard deviation of the noise of the original FID signal, the condition for considering that the distribution is Gaussian is then satisfied.
- the SNR of the spectra obtained using the processing of the module with DFRR will be the same as that of the spectrum obtained by the conventional processing. The gain in SNR will be lost but the noise of the resulting spectrum will then be flat.
- the 1370 frame of the figure 13 shows how this additional treatment can be introduced in the treatment of DFRR 1320.
- a ghost is a model of what one wants to study.
- it could be a container with water and some of the metabolites found in the brain.
- the figure 15 shows eight spectra extracted from the same voxel of a CSI acquisition with long echo on a brain without water suppression.
- the graphs 1510, 1520, 1530 and 1540 each represent a spectrum obtained using the processing, respectively, conventional, of the modulus, of the modulus with DFR and with the addition of a constant signal. This is done without apodization in the time domain in order to maximize the Gaussian contribution of the noise. It is in fact a matter of multiplying the FID by a decreasing exponential which favors the beginning of the FID (that is to say the region where there is signal) and attenuates the end of the FID (where there is no remaining only noise).
- Graphs 1550, 1560, 1570 and 1580 show the spectra obtained using the same treatments but adding an exponential temporal filtering with a bandwidth equal to 0.5 in order to favor the conditions for obtaining a Rayleigh distribution .
- the figure 16 shows two spectra of the same voxel of a CSI acquisition with short echo carried out on a brain with only partial removal of water, in order to minimize the “sidebands”.
- Diagram 1610 shows the spectrum obtained using the processing of the module alone and the spectrum obtained with the DFRR processing.
- Diagram 1620 shows the result of the subtraction between the spectrum obtained using the DFRR processing and that of the module alone. We see on this curve, the result of the subtraction, that there is no residual signal from the metabolites. The subtraction signal is only made up of noise and artifacts which are probably "sidebands".
- FIG. 12a corresponds to a CSI acquisition with short echo on a phantom which contains several metabolites in order to mimic a brain spectrum.
- the figures 12a and 12b already described and the figure 12c show, respectively, the spectra obtained using a conventional processing, with the modulus alone and with the modulus plus the DFRR.
- the “sidebands” are removed during the processing of the module alone but not in the case of the module plus DFRR processing as can be seen 1220.
- the figure 12d shows the result of the subtraction between the spectra of figures 5b and 5c , that is to say the difference between module only and module plus DFRR.
- the figure 12e shows the spectrum obtained when this signal is subtracted from the signal after processing the module with DFRR, i.e. that of the figure 5c .
- the figure 12f represents the result of the subtraction between the spectrum obtained using the processing of the module alone and the spectrum obtained after subtraction of the “sidebands” by the DFRR method.
- This spectrum essentially comprises any artifacts of the “sidebands” type. Therefore, this result clearly confirms that the DFRR process is very effective in eliminating possible sidebands.
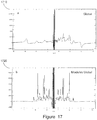
- the figure 17 illustrates the differences that can be obtained when using the module processing before or after the spatial filtering on a CSI acquisition with echo runs on a ghost that mimics a brain spectrum.
- the spatial filtering consists in this case in multiplying the rows and columns of the CSI by a hanning function before spatial Fourier transformation (therefore in the k space).
- Diagrams 1710 and 1720 show the overall spectrum obtained by summing all the spectra of the CSI.
- Diagram 1710 shows the spectra obtained by not using any treatment at all, the spectrum obtained is the spectrum of the whole of the excited part of the sample, i.e. 2 cm, which corresponds to l 'wafer thickness chosen by the pulse sequence in this case.
- Diagram 1710 represents what we get if we sum the spectra before taking into account the modulus (which amplifies what we would have obtained if we had carried out a spatial filtering before taking into account the), and 1720 if the modulus is applied before summing the spectra.
- Diagram 1720 shows the spectrum obtained by summing all the spectra of the CSI, obtained by using the processing by the module as represented in box 1310 of the figure 13 .
- the figure 18 shows the results obtained using the same scheme from a CSI acquisition with long echo on a brain.
- the signal of lipids can be higher than that of water.
- the lipid signal is taken as a reference by the processing of the module.
- the spectra of these voxels are then aligned in phase and in frequency according to the resonance of these lipids. Fortunately, in spectroscopy / spectrometry of the brain such a region does not contain an interesting resonance.
- the lipid resonance maximum is around 0.8 ppm, it will shift to 4.7 ppm (the water resonance position).
- the water resonance will then be separated into two parts (due to the symmetrization induced by the taking into account of the Modulus) which will be positioned, approximately at 8.8 and -0.8 ppm, which inevitably corresponds to a region outside the region of interest.
- the spectrum of interest is between 2 ppm (NAA) and 4 ppm (creatine).
- NAA ppm
- the peak at around 2ppm corresponds to NAA
- the peak at around 4ppm corresponds to creatine.
- the mass located between 0.8 and 1.8 ppm is that of lipids.
- this effect will act as a post lipid suppression treatment since in all voxels where the lipid signal is higher than the water signal, the lipid signal will be reassigned to the water resonance and will be suppressed. with water signal by removing residual water. This is the reason why the lipid signal is higher on the spectrum obtained without treatment of the 1810 module, which is compared to the spectrum obtained with treatment of the 1820 module.
- the figure 19 shows the influence of the application of the processing by the module before or after the spatial filtering on a CSI acquisition of a brain with long echo.
- the spatial filtering function is a so-called Kaiser-Bessel window.
- the figure 19 shows the spectra obtained when the modulus is carried out before (in dotted lines) and after (in solid lines).
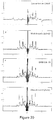
- the figures 20 and 21 illustrate this effect on a CSI acquisition carried out on the one hand on a phantom ( figure 20 ) and, on the other hand, on a patient ( figure 21 ).
- the figure 23 clearly illustrates that when the sample comprises several species to be characterized, the invention requires the presence of a reference species present in large quantity in order to serve as a carrier for the species to be characterized. In fact, taking into account the module impacts the carrier while making it possible to compare the latter with the signals of the species to be characterized.
- the invention is thus clearly different from techniques which aim to analyze the relaxation time of a single species and for which the frequency of the magnetic field is suitable.
- the invention applies in particular to spectroscopy / spectrometry, whether it is mono-voxel or multi-voxels (CSI).
- Spectrum 2304 is the spectrum obtained by Fourier transform of FID 2302. This spectrum is unusable. It is very different from the 2303 spectrum and the metabolites are neither identifiable nor quantifiable. Due to the acquisition with suppression of the signal of the reference species, taking the module into account distorts any interpretation.
- the signal of the reference species will form a carrier for the signals of the other species.
- the present invention is also advantageous for the analysis of a non-biological chemical composition. Indeed, the invention makes it possible for example to identify chemical compounds in a solution comprising a reference species such as water or any other solvent and to measure the content of these compounds in this solution.
- reference species is often water as indicated in the previous examples but can be another species, for example a solvent other than water.
Landscapes
- Physics & Mathematics (AREA)
- Spectroscopy & Molecular Physics (AREA)
- High Energy & Nuclear Physics (AREA)
- Condensed Matter Physics & Semiconductors (AREA)
- General Physics & Mathematics (AREA)
- Engineering & Computer Science (AREA)
- Signal Processing (AREA)
- Health & Medical Sciences (AREA)
- Life Sciences & Earth Sciences (AREA)
- General Health & Medical Sciences (AREA)
- Molecular Biology (AREA)
- Magnetic Resonance Imaging Apparatus (AREA)
Claims (15)
- Verfahren zur Kernspinresonanz- (RMN) Analyse mindestens einer Probe, die mindestens eine Spezies, welche charakterisiert werden soll, sowie eine Referenzspezies umfasst, deren Gehalt in der Probe mehr als das Zweifache des Gehalts der mindestens einen zu charakterisierenden Spezies beträgt, wobei das Verfahren die folgenden Schritte umfasst:Bereitstellen der mindestens einen Probe;a. Anlegen mindestens eines konstanten Feldes B0 an die mindestens eine Probe;b. Erfassen (1330) mindestens eines komplexen Signals S(t) des freien Induktionszerfalls (FID) über eine oder mehrere Antennen, wobei jedes komplexe FID-Signal S(t) einen Realteil (140) und einen Imaginärteil (150) umfasst, wobei der Schritt des Bereitstellens so ausgeführt wird, dass die Probe derart ist, dass der relative Gehalt der Referenzspezies und der mindestens einen zu charakterisierenden Spezies sowie deren relative Relaxationszeiten dazu führen, dass in dem mindestens einen komplexen FID-Signal S(t) die Amplitude des Signals der Referenzspezies mindestens zweimal höher ist als die Amplitude des Signals der mindestens einen zu charakterisierenden Spezies;c. Erhalten (1323) eines FID-Spektrums S(ω) durch Anwenden einer Fourier-Transformation auf den Real- und Komplexteil des mindestens einen komplexen FID-Signals S(t), wobei das erhaltene FID-Spektrum S(ω) dann die Referenzspezies und die mindestens eine zu charakterisierende Spezies umfasst und zwei Abschnitte (UFR, DFR) aufweist, die sich jeweils ab der Resonanzfrequenz F0Ref der Referenzspezies und auf der einen bzw. anderen Seite von F0Ref erstrecken, wobei eine Resonanzfrequenz (1040) der mindestens einen zu charakterisierenden Spezies in einem ersten Spektrumsabschnitt aus den zwei Abschnitten (UFR, DFR) liegt;dadurch gekennzeichnet, dass das Verfahren ebenfalls mindestens die folgenden Schritte umfasst:d. Modellieren (1321) des Signals der Referenzspezies Sref(t) auf Grundlage des Real- und Komplexteils des mindestens einen komplexen FID-Signals S(t);e. Erhalten (1322) eines Spektrums Sref(ω) der Referenzspezies durch Anwenden einer Fourier-Transformation auf die Modellierung des Signals der Referenzspezies Sref(t), wobei das Spektrum Sref(ω) der Referenzspezies dann zwei Spektrumsabschnitte aufweist, die sich jeweils ab der Resonanzfrequenz F0Ref der Referenzspezies des Spektrums Sref(ω) erstrecken und sich auf der einen bzw. anderen Seite von F0Ref' erstrecken;f. Erhalten (1324) eines modifizierten FID-Spektrums S̃(ω) durch Ersetzen eines zweiten Abschnitts des FID-Spektrums S(ω), wobei es sich bei dem zweiten Abschnitt um den Abschnitt aus den zwei Abschnitten (UFR und DFR) des Spektrums S(ω) handelt, der die Resonanzfrequenz (1040) der mindestens einen zu charakterisierenden Spezies nicht umfasst, durch den Abschnitt des Spektrums Sref(ω) aus den zwei Spektrumsabschnitten, der sich ab F0Ref' des Spektrums Sref(ω) erstreckt und der sich auf der gleichen Seite wie der zweite Abschnitt des Spektrums S(ω) erstreckt;g. Anwenden (1325) einer inversen Fourier-Transformation auf das modifizierte Spektrum S̃(ω), um ein modifiziertes FID-Signal s̃(t) im Zeitbereich zu erhalten;h. Berechnen (1326) des Moduls des modifizierten FID-Signals s̃(t);wobei das Verfahren nach dem Schritt des Berechnens (1326) des Moduls des modifizierten FID-Signals s̃(t) einen Schritt des Identifizierens und/oder des Quantifizierens der mindestens einen zu charakterisierenden Spezies auf Grundlage des Moduls des modifizierten FID-Signals s̃(t) umfasst.
- Verfahren nach dem vorstehenden Anspruch, das einen Schritt des Berechnens (1314) des Moduls des komplexen FID-Signals S(t) umfasst und:- die folgenden Schritte umfasst, die nach Berechnung (1326) des Moduls des modifizierten FID-Signals s̃(t) ausgeführt werden:i. Subtrahieren (1351) des Moduls des komplexen FID-Signals S(t) vom Modul des modifizierten FID-Signals s̃(t);j. Subtrahieren (1354) des im vorstehenden Schritt erhaltenen Ergebnisses vom Modul des modifizierten FID-Signals s̃(t),- oder die folgenden Schritte, die nach Berechnung (1326) des Moduls des modifizierten FID-Signals s̃(t) ausgeführt werden:i. Anwenden einer Fourier-Transformation auf den Modul des Signals S(t) und auf den Modul des modifizierten FID-Signals s̃(t), und anschließend Subtrahieren des Spektrums des Moduls des Signals S(t) vom Spektrum des Moduls des modifizierten FID-Signals s̃(t);j. Subtrahieren des im vorstehenden Schritt erhaltenen Ergebnisses vom Spektrum des Moduls des modifizierten FID-Signals s̃(t).
- Verfahren nach einem der vorstehenden Ansprüche, wobei im Verlauf des Schritts des Identifizierens und/oder des Quantifizierens der mindestens einen zu charakterisierenden Spezies auf Grundlage des Moduls des modifizierten FID-Signals s̃(t) eine Fourier-Transformation auf ein Signal angewendet wird, das mindestens den Modul des modifizierten FID-Signals s̃(t) umfasst.
- Verfahren nach einem der vorstehenden Ansprüche:- wobei der Gehalt der Referenzspezies in der Probe ausreichend höher ist als der Gehalt der mindestens einen zu charakterisierenden Spezies in der Probe, sodass das Signal der Referenzspezies als Träger für das Signal der mindestens einen zu charakterisierenden Spezies dient, oder- wobei der relative Gehalt der Referenzspezies und der mindestens einen zu charakterisierenden Spezies in der Probe, sowie deren relative Relaxationszeiten derart sind, dass die Amplitude des Signals der Referenzspezies mindestens fünf-, und vorzugsweise zehnmal höher ist als die Amplitude des Signals der mindestens einen zu charakterisierenden Spezies.
- Verfahren nach einem der vorstehenden Ansprüche, wobei der FID-Modul (222) einer Probe, die die mindestens eine zu charakterisierende Spezies umfasst, gleich ∥S(t)∥ ist, das durch die folgende Gleichung definiert ist:
 Δω = ω-ωH20 und Δϕ = ϕ - ϕH20 dem Frequenz- bzw. Phasenversatz zwischen der mindestens einen zu charakterisierenden Spezies und der Referenzspezies entsprechen,AH2O(t) die zeitabhängige Amplitude des FID-Signals der Referenzspezies ist,A0(t) die zeitabhängige Amplitude des FID-Signals der mindestens einen zu charakterisierenden Spezies ist.
 - Verfahren nach einem der vorstehenden Ansprüche, wobei im Verlauf des Erfassungsschritts (1313) eine Vielzahl von komplexen FID-Signalen S(t) erfasst werden, und:- wobei der Schritt des Berechnens (1326) des Moduls des modifizierten FID-Signals s̃(t) für jedes modifizierte FID-Signal s̃(t) ausgeführt wird, oder- wobei nach dem Schritt des Berechnens (1326) des Moduls des modifizierten Signals s̃(t) für jedes komplexe FID-Signal S(t) und vor dem Schritt des Identifizierens und/oder des Quantifizierens der mindestens einen zu charakterisierenden Spezies ein Summieren (350) der Moduln der modifizierten Signale s̃(t) ausgeführt wird, um ein kombiniertes FID-Signal zu erhalten.
- Verfahren nach einem der vorstehenden Ansprüche, wobei das Erfassen (1330) über mehrere Antennen ausgeführt wird, wobei es sich bei den Antennen um Spulen handelt, und:- wobei die erfassten komplexen FID-Signale S(t) von der gleichen Spule stammen, oder- wobei im Verlauf des Erfassungsschritts (1313) eine Vielzahl von komplexen FID-Signalen S(t) erfasst werden, und die erfassten komplexen FID-Signale S(t) von verschiedenen Spulen stammen, oder- wobei im Verlauf des Erfassungsschritts (1313) eine Vielzahl von komplexen FID-Signalen S(t) erfasst werden, und die erfassten komplexen FID-Signale S(t) von verschiedenen Spulen stammen, und bei mindestens gewissen Spulen mehrere komplexe FID-Signale S(t) erfasst werden, oder- wobei im Verlauf des Erfassungsschritts (1313) komplexe FID-Signale S(t) erfasst werden, die von mehreren Voxeln der Probe stammen, und wobei nach dem Berechnen (1326) des Moduls des modifizierten FID-Signals s̃(t) für jedes der Voxel ein Schritt der räumlichen Filterung ausgeführt wird.
- Verfahren nach einem der Ansprüche 1 bis 5:- wobei im Verlauf des Erfassungsschritts ein einziges komplexes FID-Signal S(t) erfasst wird, wobei durch Anwenden einer Fourier-Transformation auf den Real- und Komplexteil des einzigen komplexen FID-Signals S(t) ein einziges FID-Spektrum S(ω) erhalten (1323) wird, und wobei ein Schritt des Identifizierens und/oder des Quantifizierens der mindestens einen zu charakterisierenden Spezies ausgeführt wird, und anschließend eine Fourier-Transformation auf einen einzigen Modul des modifizierten FID-Signals s̃(t) angewendet wird, oder- wobei im Verlauf des Erfassungsschritts (1330) ein räumlich codiertes FID-Signal erfasst wird, dieses Erfassen mehrmals wiederholt wird, um mehrere codierte Signale zu erhalten, wobei jedes der codierten Signale anschließend decodiert wird, sodass es mit einem Voxel der Probe verknüpft ist, und ein FID-Modul (222) für das mit jedem Voxel verknüpfte FID-Signal erzeugt wird.
- Verfahren nach einem der vorstehenden Ansprüche, wobei die Probe mehrere zu charakterisierende Spezies umfasst, wobei der Schritt des Bereitstellens so ausgeführt wird, dass die Probe derart ist, dass der relative Gehalt der Referenzspezies und der zu charakterisierenden Spezies, sowie deren relative Relaxationszeiten dazu führen, dass in dem mindestens einen komplexen FID-Signal S(t) die Amplitude des Signals der Referenzspezies mindestens zweimal höher ist als die Amplitude des Signals jeder der zu charakterisierenden Spezies.
- Verfahren nach einem der vorstehenden Ansprüche, wobei die Probe mehrere zu charakterisierende Spezies umfasst, und wobei der Gehalt der Referenzspezies in der Probe mindestens mehr als das 102-Fache, ja sogar 103-Fache des Gehalt jeder der zu charakterisierenden Spezies beträgt.
- Verfahren nach einem der vorstehenden Ansprüche:- wobei es sich bei der Probe um eine Probe von biologischem Material handelt, wobei es sich bei der Referenzspezies um Wasser handelt, und es sich bei der mindestens einen zu charakterisierenden Spezies um einen Metaboliten handelt, oder- wobei es sich bei der Probe um eine chemische Zusammensetzung handelt, bei der Referenzspezies um ein Lösungsmittel handelt, und bei der mindestens einen zu charakterisierenden Spezies um eine chemische Verbindung handelt.
- Verfahren nach einem der vorstehenden Ansprüche, wobei die mindestens eine zu charakterisierende Spezies mindestens eine erste Resonanzfrequenz (1040) aufweist, die rechts der Resonanzfrequenz F0Ref (1010) der Referenzspezies liegt, und mindestens eine zweite Resonanzfrequenz (1020), die links der Resonanzfrequenz F0Ref (1010) der Referenzspezies liegt;
und wobei:- der Schritt f. unter der Annahme ausgeführt wird, dass es sich bei dem zweiten Spektrumsabschnitt um den Abschnitt handelt, der links der Resonanzfrequenz F0Ref (1010) der Referenzspezies liegt, um ein erstes modifiziertes FID-Spektrum S̃(ω) zu erhalten, das für die erste Resonanzfrequenz (1040) repräsentativ ist; und- der Schritt f. unter der Annahme ausgeführt wird, dass es sich bei dem zweiten Spektrumsabschnitt um den Abschnitt handelt, der rechts der Resonanzfrequenz F0Ref (1010) der Referenzspezies liegt, um ein zweites modifiziertes FID-Spektrum S̃(ω) zu erhalten, das für die zweite Resonanzfrequenz (1020) repräsentativ ist, und wobei die Schritte g. und h. auf jedes aus dem ersten und zweiten modifizierten FID-Spektrum S̃(ω) angewendet werden. - Computerprogrammprodukt, das Anweisungen umfasst, die, wenn sie von mindestens einem Prozessor ausgeführt werden, mindestens die Schritte c. bis h. (1323, 1321, 1322, 1324, 1325, 1326) des Verfahrens nach einem der vorstehenden Schritte ausführen.
- System zur Kernspinresonanz- (RMN) Analyse mindestens einer Probe, die mindestens eine Spezies, welche charakterisiert werden soll, sowie eine Referenzspezies umfasst, wobei der Gehalt der Referenzspezies in der Probe mehr als das Zweifache des Gehalts der mindestens einen zu charakterisierenden Spezies beträgt, wobei das System Mittel zum Anlegen des konstanten Feldes B0 an die Probe, und Mittel zum Anlegen eines Feldes umfasst, das eine elektromagnetische Anregung in dem konstanten Feld B0 erzeugt, und mindestens eine Antenne umfasst, die dafür ausgelegt ist, mindestens ein komplexes Signal S(t) des freien Induktionszerfalls (FID) im Zeitbereich zu erfassen (1330), wobei jedes komplexe FID-Signal S(t) einen Realteil und einen Imaginärteil umfasst; wobei die Probe derart ist, dass der relative Gehalt der Referenzspezies und der mindestens einen zu charakterisierenden Spezies sowie deren relative Relaxationszeiten dazu führen, dass in dem mindestens einen komplexen FID-Signal S(t) die Amplitude des Signals der Referenzspezies mindestens zweimal höher ist als die Amplitude des Signals der mindestens einen zu charakterisierenden Spezies;
wobei das System Verarbeitungsmittel umfasst, die so ausgelegt sind, dass sie die folgenden Schritte auszuführen:- Erhalten (1323) eines FID-Spektrums S(ω) durch Anwenden einer Fourier-Transformation auf den Real- und Komplexteil des mindestens einen komplexen FID-Signals S(t), wobei das erhaltene FID-Spektrum S(ω) dann die Referenzspezies und die mindestens eine zu charakterisierende Spezies umfasst und zwei Abschnitte (UFR, DFR) aufweist, die sich jeweils ab der Resonanzfrequenz der Referenzspezies (F0Ref) und auf der einen bzw. anderen Seite von F0Ref erstrecken, wobei eine Resonanzfrequenz (1040) der mindestens einen zu charakterisierenden Spezies in einem ersten Spektrumsabschnitt aus den zwei Abschnitten (UFR, DFR) liegt;- Modellieren (1321) des Signals der Referenzspezies Sref(t) auf Grundlage des Real- und Komplexteils des mindestens einen komplexen FID-Signals S(t);- Erhalten (1322) eines Spektrums Sref(ω) der Referenzspezies, das nur die Referenzspezies umfasst, durch Anwenden einer Fourier-Transformation auf die Modellierung des Signals der Referenzspezies Sref(t), wobei das Spektrum Sref(ω) der Referenzspezies dann zwei Spektrumsabschnitte aufweist, die sich ab der Resonanzfrequenz der Referenzspezies (F0Ref') des Spektrums Sref(ω) erstrecken und sich auf der einen bzw. anderen Seite von F0Ref' erstrecken;- Erhalten (1324) eines modifizierten FID-Spektrums S̃(ω) durch Ersetzen eines zweiten Abschnitts des FID-Spektrums S(ω), wobei es sich bei dem zweiten Abschnitt um den Abschnitt aus den zwei Abschnitten (UFR und DFR) des Spektrums S(ω) handelt, der die Resonanzfrequenz (1040) der mindestens einen zu charakterisierenden Spezies nicht umfasst, durch den Abschnitt des Spektrums Sref(ω) aus den zwei Spektrumsabschnitten, der sich ab F0Ref' des Spektrums Sref(ω) erstreckt und der sich auf der gleichen Seite wie der zweite Abschnitt des Spektrums S(ω) erstreckt;- Anwenden (1325) einer inversen Fourier-Transformation auf das modifizierte Spektrum S̃(ω), um ein modifiziertes FID-Signal s̃(t) im Zeitbereich zu erhalten;- Berechnen (1326) des Moduls des modifizierten FID-Signals s̃(t); und- Identifizieren und/oder Quantifizieren der mindestens einen zu charakterisierenden Spezies auf Grundlage des Moduls des modifizierten FID-Signals s̃(t). - System nach dem vorstehenden Anspruch, das eine oder mehrere Antennen umfasst, die dafür ausgelegt sind, eine Vielzahl von komplexen FID-Signalen S(t) zu erfassen, wobei die Verarbeitungsmittel so ausgelegt sind, dass sie nach dem Schritt des Berechnens des Moduls des modifizierten FID-Signals s̃(t) für jedes komplexe Signal S(t) aus der Vielzahl von komplexen FID-Signalen S(t) ein Summieren (350) der Module der modifizierten FID-Signale s̃(t) ausführen, um ein kombiniertes FID-Signal zu erhalten, und auf das kombinierte FID-Signal eine Fourier-Transformation anwenden.
Applications Claiming Priority (2)
| Application Number | Priority Date | Filing Date | Title |
|---|---|---|---|
| FR1363573A FR3015692B1 (fr) | 2013-12-24 | 2013-12-24 | Procede d'analyse par resonance magnetique nucleaire |
| PCT/EP2014/079182 WO2015097227A1 (fr) | 2013-12-24 | 2014-12-23 | Procede d'analyse par resonance magnetique nucleaire |
Publications (2)
| Publication Number | Publication Date |
|---|---|
| EP3105604A1 EP3105604A1 (de) | 2016-12-21 |
| EP3105604B1 true EP3105604B1 (de) | 2020-12-23 |
Family
ID=51063475
Family Applications (1)
| Application Number | Title | Priority Date | Filing Date |
|---|---|---|---|
| EP14827779.1A Active EP3105604B1 (de) | 2013-12-24 | 2014-12-23 | Verfahren zur kernmagnetresonanzanalyse |
Country Status (5)
| Country | Link |
|---|---|
| US (1) | US10436863B2 (de) |
| EP (1) | EP3105604B1 (de) |
| JP (1) | JP6420348B2 (de) |
| FR (1) | FR3015692B1 (de) |
| WO (1) | WO2015097227A1 (de) |
Families Citing this family (5)
| Publication number | Priority date | Publication date | Assignee | Title |
|---|---|---|---|---|
| FR3000556B1 (fr) * | 2012-12-28 | 2016-03-25 | Univ Aix Marseille | Procede de correction de phase et/ou de frequence d’au moins un signal de decroissance libre d’induction (fid) |
| CN111050639B (zh) * | 2017-08-31 | 2021-06-11 | 株式会社村田制作所 | 心拍测定装置 |
| EP3588120B1 (de) * | 2018-06-26 | 2021-02-24 | Bruker BioSpin GmbH | System und verfahren zur verbesserten signaldetektion in der nmr-spektroskopie |
| EP3772660A1 (de) * | 2019-08-08 | 2021-02-10 | Siemens Healthcare GmbH | Magnetresonanzbildrekonstruktion mit clusteranalyse |
| EP3819653B1 (de) * | 2019-11-07 | 2023-09-06 | Siemens Healthcare GmbH | Verfahren zum prüfen einer empfangskette eines magnetresonanztomographen |
Family Cites Families (19)
| Publication number | Priority date | Publication date | Assignee | Title |
|---|---|---|---|---|
| JPS523489A (en) * | 1975-06-27 | 1977-01-11 | Hitachi Ltd | Fourier converter type nuclear magnetic resonator |
| US4354499A (en) | 1978-11-20 | 1982-10-19 | Damadian Raymond V | Apparatus and method for nuclear magnetic resonance scanning and mapping |
| JPS55112556A (en) * | 1979-02-22 | 1980-08-30 | Jeol Ltd | Correction method of level in fourier spectrum unit |
| JPS60102544A (ja) * | 1983-11-10 | 1985-06-06 | Hitachi Ltd | Νmrイメ−ジング装置 |
| JPS62127673A (ja) * | 1985-11-29 | 1987-06-09 | Jeol Ltd | フ−リエ変換装置 |
| NL8702700A (nl) * | 1987-11-12 | 1989-06-01 | Philips Nv | Werkwijze en inrichting voor automatische fasecorrectie van complexe nmr spectra. |
| JPH03287089A (ja) * | 1990-04-04 | 1991-12-17 | Jeol Ltd | 時系列信号のスペクトル解析方式 |
| US5162734A (en) * | 1991-03-08 | 1992-11-10 | Elbit-Ati, Ltd. | Method and apparatus for obtaining an nmr signal having a preselected frequency domain |
| CA2331116A1 (en) * | 2001-01-15 | 2002-07-15 | Chenomx, Inc. | Compound identification and quantitation in liquid mixtures -- method and process using an automated nuclear magnetic resonance measurement system |
| US20040095139A1 (en) * | 2002-11-19 | 2004-05-20 | Brown Mark Allen | Magnetic resonance spectroscopy |
| US7064544B1 (en) | 2004-05-18 | 2006-06-20 | General Electric Company | Method and system of scaling MR spectroscopic data acquired with phased-array coils |
| JP2006017486A (ja) * | 2004-06-30 | 2006-01-19 | Hitachi Ltd | 核磁気共鳴を用いるスペクトル分析方法および核磁気共鳴装置 |
| US8339135B2 (en) | 2006-08-21 | 2012-12-25 | Stc.Unm | Biological detector and method |
| CA2674250A1 (en) | 2009-04-01 | 2010-10-01 | National Research Council Of Canada | Wavelet encoding in gradient-echo mri |
| EP2526439B1 (de) * | 2010-01-18 | 2014-07-30 | Max-Planck-Gesellschaft zur Förderung der Wissenschaften e.V. | Verfahren und vorrichtung für die spektroskopische magnetresonanzbildgebung |
| US8886283B1 (en) * | 2011-06-21 | 2014-11-11 | Stc.Unm | 3D and 4D magnetic susceptibility tomography based on complex MR images |
| FR3000556B1 (fr) * | 2012-12-28 | 2016-03-25 | Univ Aix Marseille | Procede de correction de phase et/ou de frequence d’au moins un signal de decroissance libre d’induction (fid) |
| US10222437B2 (en) * | 2013-10-21 | 2019-03-05 | Koninklijke Philips N.V. | MR imaging with temperature mapping |
| DE102014219778B4 (de) * | 2014-09-30 | 2016-09-01 | Siemens Healthcare Gmbh | Betrieb eines bildgebenden medizinischen Untersuchungsgeräts mit einer Mehrzahl an Teilsystemen |
-
2013
- 2013-12-24 FR FR1363573A patent/FR3015692B1/fr not_active Expired - Fee Related
-
2014
- 2014-12-23 JP JP2016542920A patent/JP6420348B2/ja not_active Expired - Fee Related
- 2014-12-23 WO PCT/EP2014/079182 patent/WO2015097227A1/fr not_active Ceased
- 2014-12-23 US US15/107,783 patent/US10436863B2/en not_active Expired - Fee Related
- 2014-12-23 EP EP14827779.1A patent/EP3105604B1/de active Active
Non-Patent Citations (1)
| Title |
|---|
| None * |
Also Published As
| Publication number | Publication date |
|---|---|
| US20170052238A1 (en) | 2017-02-23 |
| FR3015692A1 (fr) | 2015-06-26 |
| EP3105604A1 (de) | 2016-12-21 |
| FR3015692B1 (fr) | 2017-03-03 |
| JP2017501413A (ja) | 2017-01-12 |
| JP6420348B2 (ja) | 2018-11-14 |
| WO2015097227A1 (fr) | 2015-07-02 |
| US10436863B2 (en) | 2019-10-08 |
Similar Documents
| Publication | Publication Date | Title |
|---|---|---|
| EP2939046B1 (de) | Kernspinresonanz-analyse einer probe, die eine zu charakterisierende spezies und eine referenz-spezies umfasst | |
| EP3105604B1 (de) | Verfahren zur kernmagnetresonanzanalyse | |
| Bilgic et al. | Lipid suppression in CSI with spatial priors and highly undersampled peripheral k‐space | |
| Bilgic et al. | Fast image reconstruction with L2‐regularization | |
| Knoll et al. | Parallel imaging with nonlinear reconstruction using variational penalties | |
| Furuyama et al. | Application of compressed sensing to multidimensional spectroscopic imaging in human prostate | |
| EP2924457B1 (de) | "Half Fourier"-MRT mit iterativer Rekonstruktion | |
| EP3295201B1 (de) | Verfahren und vorrichtung zur bildgebung mittels magnetresonanz | |
| CN110879980B (zh) | 基于神经网络算法的核磁共振波谱去噪方法 | |
| Mayer et al. | Detection of glutamate in the human brain at 3 T using optimized constant time point resolved spectroscopy | |
| Sakhaii et al. | Improving the sensitivity of conventional spin echo spectra by preservation of initial signal-to-noise ratio | |
| EP4314854A1 (de) | Verfahren zur rauschunterdrückung in bildern aus mehreren mrt-erfassungen | |
| EP4147062B1 (de) | Verfahren zur nachbearbeitung von daten einer wasab1-akquisitionssequenz | |
| EP0913700B1 (de) | Verfahren zur Anregung und Aufnahme von magnetischen Kernresonanzsigalen, insbesondere in leichtem Wasser | |
| KR20140106664A (ko) | 국소화된 일차원 자기 공진 공간-주파수 분광기 | |
| EP2676149A1 (de) | Magnetresonanzspektroskopie mit hoher bandbreite und einem hohen statischen (b0-)magnetfeld mittels polarisationstransfer | |
| Maria et al. | Processing of high resolution magic angle spinning spectra of breast cancer cells by the filter diagonalization method | |
| WO2019077246A1 (fr) | Génération optimisée d'images irm par un système irm multi-antennes | |
| CN108700638B (zh) | Mrs成像法中调节激励信号频带中心频率和接收带宽而抑制水信号且增强代谢物信号方法 | |
| US6781373B2 (en) | Water chopped dual-band selective excitation | |
| WO2025045743A1 (fr) | Procédé de post-traitement d'une séquence d'acquisitions pour corriger les inhomogénéités de champs magnétiques d'un appareil d'imagerie par résonance magnétique | |
| Jenkins | The influence of spectral registration on diffusion-weighted magnetic resonance spectroscopy ADC estimates | |
| Ersoz et al. | Undersampled linogram trajectory for fast imaging (ULTI): experiments at 3 T and 7 T | |
| WO2023222508A1 (fr) | Procédé de formation d'une image d'un corps au moyen d'un dispositif irm | |
| Perry et al. | Scan time reduction in spectroscopic imaging using HYPR |
Legal Events
| Date | Code | Title | Description |
|---|---|---|---|
| STAA | Information on the status of an ep patent application or granted ep patent |
Free format text: STATUS: THE INTERNATIONAL PUBLICATION HAS BEEN MADE |
|
| PUAI | Public reference made under article 153(3) epc to a published international application that has entered the european phase |
Free format text: ORIGINAL CODE: 0009012 |
|
| STAA | Information on the status of an ep patent application or granted ep patent |
Free format text: STATUS: REQUEST FOR EXAMINATION WAS MADE |
|
| 17P | Request for examination filed |
Effective date: 20161021 |
|
| AK | Designated contracting states |
Kind code of ref document: A1 Designated state(s): AL AT BE BG CH CY CZ DE DK EE ES FI FR GB GR HR HU IE IS IT LI LT LU LV MC MK MT NL NO PL PT RO RS SE SI SK SM TR |
|
| AX | Request for extension of the european patent |
Extension state: BA ME |
|
| DAX | Request for extension of the european patent (deleted) | ||
| GRAJ | Information related to disapproval of communication of intention to grant by the applicant or resumption of examination proceedings by the epo deleted |
Free format text: ORIGINAL CODE: EPIDOSDIGR1 |
|
| GRAP | Despatch of communication of intention to grant a patent |
Free format text: ORIGINAL CODE: EPIDOSNIGR1 |
|
| GRAP | Despatch of communication of intention to grant a patent |
Free format text: ORIGINAL CODE: EPIDOSNIGR1 |
|
| STAA | Information on the status of an ep patent application or granted ep patent |
Free format text: STATUS: GRANT OF PATENT IS INTENDED |
|
| INTG | Intention to grant announced |
Effective date: 20200610 |
|
| GRAJ | Information related to disapproval of communication of intention to grant by the applicant or resumption of examination proceedings by the epo deleted |
Free format text: ORIGINAL CODE: EPIDOSDIGR1 |
|
| STAA | Information on the status of an ep patent application or granted ep patent |
Free format text: STATUS: REQUEST FOR EXAMINATION WAS MADE |
|
| GRAR | Information related to intention to grant a patent recorded |
Free format text: ORIGINAL CODE: EPIDOSNIGR71 |
|
| GRAS | Grant fee paid |
Free format text: ORIGINAL CODE: EPIDOSNIGR3 |
|
| STAA | Information on the status of an ep patent application or granted ep patent |
Free format text: STATUS: GRANT OF PATENT IS INTENDED |
|
| GRAA | (expected) grant |
Free format text: ORIGINAL CODE: 0009210 |
|
| STAA | Information on the status of an ep patent application or granted ep patent |
Free format text: STATUS: THE PATENT HAS BEEN GRANTED |
|
| INTC | Intention to grant announced (deleted) | ||
| INTG | Intention to grant announced |
Effective date: 20201111 |
|
| AK | Designated contracting states |
Kind code of ref document: B1 Designated state(s): AL AT BE BG CH CY CZ DE DK EE ES FI FR GB GR HR HU IE IS IT LI LT LU LV MC MK MT NL NO PL PT RO RS SE SI SK SM TR |
|
| REG | Reference to a national code |
Ref country code: GB Ref legal event code: FG4D Free format text: NOT ENGLISH |
|
| REG | Reference to a national code |
Ref country code: DE Ref legal event code: R096 Ref document number: 602014073640 Country of ref document: DE |
|
| REG | Reference to a national code |
Ref country code: AT Ref legal event code: REF Ref document number: 1348255 Country of ref document: AT Kind code of ref document: T Effective date: 20210115 |
|
| REG | Reference to a national code |
Ref country code: IE Ref legal event code: FG4D Free format text: LANGUAGE OF EP DOCUMENT: FRENCH |
|
| PG25 | Lapsed in a contracting state [announced via postgrant information from national office to epo] |
Ref country code: NO Free format text: LAPSE BECAUSE OF FAILURE TO SUBMIT A TRANSLATION OF THE DESCRIPTION OR TO PAY THE FEE WITHIN THE PRESCRIBED TIME-LIMIT Effective date: 20210323 Ref country code: RS Free format text: LAPSE BECAUSE OF FAILURE TO SUBMIT A TRANSLATION OF THE DESCRIPTION OR TO PAY THE FEE WITHIN THE PRESCRIBED TIME-LIMIT Effective date: 20201223 Ref country code: FI Free format text: LAPSE BECAUSE OF FAILURE TO SUBMIT A TRANSLATION OF THE DESCRIPTION OR TO PAY THE FEE WITHIN THE PRESCRIBED TIME-LIMIT Effective date: 20201223 Ref country code: GR Free format text: LAPSE BECAUSE OF FAILURE TO SUBMIT A TRANSLATION OF THE DESCRIPTION OR TO PAY THE FEE WITHIN THE PRESCRIBED TIME-LIMIT Effective date: 20210324 |
|
| REG | Reference to a national code |
Ref country code: CH Ref legal event code: NV Representative=s name: STOLMAR AND PARTNER INTELLECTUAL PROPERTY S.A., CH |
|
| REG | Reference to a national code |
Ref country code: AT Ref legal event code: MK05 Ref document number: 1348255 Country of ref document: AT Kind code of ref document: T Effective date: 20201223 |
|
| REG | Reference to a national code |
Ref country code: NL Ref legal event code: MP Effective date: 20201223 |
|
| PG25 | Lapsed in a contracting state [announced via postgrant information from national office to epo] |
Ref country code: LV Free format text: LAPSE BECAUSE OF FAILURE TO SUBMIT A TRANSLATION OF THE DESCRIPTION OR TO PAY THE FEE WITHIN THE PRESCRIBED TIME-LIMIT Effective date: 20201223 Ref country code: SE Free format text: LAPSE BECAUSE OF FAILURE TO SUBMIT A TRANSLATION OF THE DESCRIPTION OR TO PAY THE FEE WITHIN THE PRESCRIBED TIME-LIMIT Effective date: 20201223 Ref country code: BG Free format text: LAPSE BECAUSE OF FAILURE TO SUBMIT A TRANSLATION OF THE DESCRIPTION OR TO PAY THE FEE WITHIN THE PRESCRIBED TIME-LIMIT Effective date: 20210323 |
|
| PG25 | Lapsed in a contracting state [announced via postgrant information from national office to epo] |
Ref country code: HR Free format text: LAPSE BECAUSE OF FAILURE TO SUBMIT A TRANSLATION OF THE DESCRIPTION OR TO PAY THE FEE WITHIN THE PRESCRIBED TIME-LIMIT Effective date: 20201223 Ref country code: NL Free format text: LAPSE BECAUSE OF FAILURE TO SUBMIT A TRANSLATION OF THE DESCRIPTION OR TO PAY THE FEE WITHIN THE PRESCRIBED TIME-LIMIT Effective date: 20201223 |
|
| REG | Reference to a national code |
Ref country code: LT Ref legal event code: MG9D |
|
| PG25 | Lapsed in a contracting state [announced via postgrant information from national office to epo] |
Ref country code: SM Free format text: LAPSE BECAUSE OF FAILURE TO SUBMIT A TRANSLATION OF THE DESCRIPTION OR TO PAY THE FEE WITHIN THE PRESCRIBED TIME-LIMIT Effective date: 20201223 Ref country code: CZ Free format text: LAPSE BECAUSE OF FAILURE TO SUBMIT A TRANSLATION OF THE DESCRIPTION OR TO PAY THE FEE WITHIN THE PRESCRIBED TIME-LIMIT Effective date: 20201223 Ref country code: EE Free format text: LAPSE BECAUSE OF FAILURE TO SUBMIT A TRANSLATION OF THE DESCRIPTION OR TO PAY THE FEE WITHIN THE PRESCRIBED TIME-LIMIT Effective date: 20201223 Ref country code: LT Free format text: LAPSE BECAUSE OF FAILURE TO SUBMIT A TRANSLATION OF THE DESCRIPTION OR TO PAY THE FEE WITHIN THE PRESCRIBED TIME-LIMIT Effective date: 20201223 Ref country code: PT Free format text: LAPSE BECAUSE OF FAILURE TO SUBMIT A TRANSLATION OF THE DESCRIPTION OR TO PAY THE FEE WITHIN THE PRESCRIBED TIME-LIMIT Effective date: 20210423 Ref country code: SK Free format text: LAPSE BECAUSE OF FAILURE TO SUBMIT A TRANSLATION OF THE DESCRIPTION OR TO PAY THE FEE WITHIN THE PRESCRIBED TIME-LIMIT Effective date: 20201223 Ref country code: RO Free format text: LAPSE BECAUSE OF FAILURE TO SUBMIT A TRANSLATION OF THE DESCRIPTION OR TO PAY THE FEE WITHIN THE PRESCRIBED TIME-LIMIT Effective date: 20201223 |
|
| PG25 | Lapsed in a contracting state [announced via postgrant information from national office to epo] |
Ref country code: AT Free format text: LAPSE BECAUSE OF FAILURE TO SUBMIT A TRANSLATION OF THE DESCRIPTION OR TO PAY THE FEE WITHIN THE PRESCRIBED TIME-LIMIT Effective date: 20201223 Ref country code: PL Free format text: LAPSE BECAUSE OF FAILURE TO SUBMIT A TRANSLATION OF THE DESCRIPTION OR TO PAY THE FEE WITHIN THE PRESCRIBED TIME-LIMIT Effective date: 20201223 |
|
| REG | Reference to a national code |
Ref country code: DE Ref legal event code: R097 Ref document number: 602014073640 Country of ref document: DE |
|
| PG25 | Lapsed in a contracting state [announced via postgrant information from national office to epo] |
Ref country code: IS Free format text: LAPSE BECAUSE OF FAILURE TO SUBMIT A TRANSLATION OF THE DESCRIPTION OR TO PAY THE FEE WITHIN THE PRESCRIBED TIME-LIMIT Effective date: 20210423 |
|
| PG25 | Lapsed in a contracting state [announced via postgrant information from national office to epo] |
Ref country code: LU Free format text: LAPSE BECAUSE OF NON-PAYMENT OF DUE FEES Effective date: 20201223 Ref country code: AL Free format text: LAPSE BECAUSE OF FAILURE TO SUBMIT A TRANSLATION OF THE DESCRIPTION OR TO PAY THE FEE WITHIN THE PRESCRIBED TIME-LIMIT Effective date: 20201223 Ref country code: IT Free format text: LAPSE BECAUSE OF FAILURE TO SUBMIT A TRANSLATION OF THE DESCRIPTION OR TO PAY THE FEE WITHIN THE PRESCRIBED TIME-LIMIT Effective date: 20201223 Ref country code: IE Free format text: LAPSE BECAUSE OF NON-PAYMENT OF DUE FEES Effective date: 20201223 |
|
| PLBE | No opposition filed within time limit |
Free format text: ORIGINAL CODE: 0009261 |
|
| STAA | Information on the status of an ep patent application or granted ep patent |
Free format text: STATUS: NO OPPOSITION FILED WITHIN TIME LIMIT |
|
| PG25 | Lapsed in a contracting state [announced via postgrant information from national office to epo] |
Ref country code: DK Free format text: LAPSE BECAUSE OF FAILURE TO SUBMIT A TRANSLATION OF THE DESCRIPTION OR TO PAY THE FEE WITHIN THE PRESCRIBED TIME-LIMIT Effective date: 20201223 Ref country code: ES Free format text: LAPSE BECAUSE OF FAILURE TO SUBMIT A TRANSLATION OF THE DESCRIPTION OR TO PAY THE FEE WITHIN THE PRESCRIBED TIME-LIMIT Effective date: 20201223 |
|
| 26N | No opposition filed |
Effective date: 20210924 |
|
| PGFP | Annual fee paid to national office [announced via postgrant information from national office to epo] |
Ref country code: GB Payment date: 20211220 Year of fee payment: 8 Ref country code: MC Payment date: 20211228 Year of fee payment: 8 Ref country code: DE Payment date: 20211210 Year of fee payment: 8 Ref country code: FR Payment date: 20211228 Year of fee payment: 8 |
|
| PG25 | Lapsed in a contracting state [announced via postgrant information from national office to epo] |
Ref country code: SI Free format text: LAPSE BECAUSE OF FAILURE TO SUBMIT A TRANSLATION OF THE DESCRIPTION OR TO PAY THE FEE WITHIN THE PRESCRIBED TIME-LIMIT Effective date: 20201223 |
|
| PGFP | Annual fee paid to national office [announced via postgrant information from national office to epo] |
Ref country code: CH Payment date: 20211223 Year of fee payment: 8 Ref country code: BE Payment date: 20211221 Year of fee payment: 8 |
|
| PG25 | Lapsed in a contracting state [announced via postgrant information from national office to epo] |
Ref country code: IS Free format text: LAPSE BECAUSE OF FAILURE TO SUBMIT A TRANSLATION OF THE DESCRIPTION OR TO PAY THE FEE WITHIN THE PRESCRIBED TIME-LIMIT Effective date: 20210423 Ref country code: TR Free format text: LAPSE BECAUSE OF FAILURE TO SUBMIT A TRANSLATION OF THE DESCRIPTION OR TO PAY THE FEE WITHIN THE PRESCRIBED TIME-LIMIT Effective date: 20201223 Ref country code: MT Free format text: LAPSE BECAUSE OF FAILURE TO SUBMIT A TRANSLATION OF THE DESCRIPTION OR TO PAY THE FEE WITHIN THE PRESCRIBED TIME-LIMIT Effective date: 20201223 Ref country code: CY Free format text: LAPSE BECAUSE OF FAILURE TO SUBMIT A TRANSLATION OF THE DESCRIPTION OR TO PAY THE FEE WITHIN THE PRESCRIBED TIME-LIMIT Effective date: 20201223 |
|
| PG25 | Lapsed in a contracting state [announced via postgrant information from national office to epo] |
Ref country code: MK Free format text: LAPSE BECAUSE OF FAILURE TO SUBMIT A TRANSLATION OF THE DESCRIPTION OR TO PAY THE FEE WITHIN THE PRESCRIBED TIME-LIMIT Effective date: 20201223 |
|
| REG | Reference to a national code |
Ref country code: DE Ref legal event code: R119 Ref document number: 602014073640 Country of ref document: DE |
|
| REG | Reference to a national code |
Ref country code: CH Ref legal event code: PL |
|
| GBPC | Gb: european patent ceased through non-payment of renewal fee |
Effective date: 20221223 |
|
| REG | Reference to a national code |
Ref country code: BE Ref legal event code: MM Effective date: 20221231 |
|
| PG25 | Lapsed in a contracting state [announced via postgrant information from national office to epo] |
Ref country code: LI Free format text: LAPSE BECAUSE OF NON-PAYMENT OF DUE FEES Effective date: 20221231 Ref country code: GB Free format text: LAPSE BECAUSE OF NON-PAYMENT OF DUE FEES Effective date: 20221223 Ref country code: DE Free format text: LAPSE BECAUSE OF NON-PAYMENT OF DUE FEES Effective date: 20230701 Ref country code: CH Free format text: LAPSE BECAUSE OF NON-PAYMENT OF DUE FEES Effective date: 20221231 |
|
| PG25 | Lapsed in a contracting state [announced via postgrant information from national office to epo] |
Ref country code: FR Free format text: LAPSE BECAUSE OF NON-PAYMENT OF DUE FEES Effective date: 20221231 Ref country code: BE Free format text: LAPSE BECAUSE OF NON-PAYMENT OF DUE FEES Effective date: 20221231 |
|
| PG25 | Lapsed in a contracting state [announced via postgrant information from national office to epo] |
Ref country code: MC Free format text: LAPSE BECAUSE OF NON-PAYMENT OF DUE FEES Effective date: 20230103 |
|
| PG25 | Lapsed in a contracting state [announced via postgrant information from national office to epo] |
Ref country code: MC Free format text: LAPSE BECAUSE OF NON-PAYMENT OF DUE FEES Effective date: 20230103 |