EP3108794A1 - Procédé de calcul de locus de balayage optique, et dispositif de balayage optique - Google Patents
Procédé de calcul de locus de balayage optique, et dispositif de balayage optique Download PDFInfo
- Publication number
- EP3108794A1 EP3108794A1 EP15751455.5A EP15751455A EP3108794A1 EP 3108794 A1 EP3108794 A1 EP 3108794A1 EP 15751455 A EP15751455 A EP 15751455A EP 3108794 A1 EP3108794 A1 EP 3108794A1
- Authority
- EP
- European Patent Office
- Prior art keywords
- light
- scanning
- scanning pattern
- optical fiber
- calculating
- Prior art date
- Legal status (The legal status is an assumption and is not a legal conclusion. Google has not performed a legal analysis and makes no representation as to the accuracy of the status listed.)
- Withdrawn
Links
- 230000003287 optical effect Effects 0.000 title claims abstract description 49
- 238000000034 method Methods 0.000 title claims abstract description 46
- 239000013307 optical fiber Substances 0.000 claims abstract description 72
- 230000010355 oscillation Effects 0.000 claims abstract description 59
- 230000010363 phase shift Effects 0.000 claims abstract description 41
- 230000002123 temporal effect Effects 0.000 claims abstract description 19
- 239000000835 fiber Substances 0.000 description 52
- 238000001514 detection method Methods 0.000 description 45
- 230000006870 function Effects 0.000 description 40
- 238000005286 illumination Methods 0.000 description 19
- 238000003780 insertion Methods 0.000 description 7
- 230000037431 insertion Effects 0.000 description 7
- 238000010586 diagram Methods 0.000 description 6
- 230000000694 effects Effects 0.000 description 4
- 238000002847 impedance measurement Methods 0.000 description 3
- 238000012545 processing Methods 0.000 description 3
- 230000032683 aging Effects 0.000 description 2
- 230000006399 behavior Effects 0.000 description 2
- 238000006073 displacement reaction Methods 0.000 description 2
- 238000013507 mapping Methods 0.000 description 2
- 239000000523 sample Substances 0.000 description 2
- 230000003595 spectral effect Effects 0.000 description 2
- 239000000853 adhesive Substances 0.000 description 1
- 230000001070 adhesive effect Effects 0.000 description 1
- 230000015572 biosynthetic process Effects 0.000 description 1
- 239000003086 colorant Substances 0.000 description 1
- 239000000470 constituent Substances 0.000 description 1
- 238000013016 damping Methods 0.000 description 1
- 238000013461 design Methods 0.000 description 1
- 230000006866 deterioration Effects 0.000 description 1
- 230000007613 environmental effect Effects 0.000 description 1
- 230000005484 gravity Effects 0.000 description 1
- 238000005259 measurement Methods 0.000 description 1
- 238000000691 measurement method Methods 0.000 description 1
- 238000012544 monitoring process Methods 0.000 description 1
- 230000000737 periodic effect Effects 0.000 description 1
- 239000007787 solid Substances 0.000 description 1
- 238000010408 sweeping Methods 0.000 description 1
- 238000012546 transfer Methods 0.000 description 1
Images









Classifications
-
- G—PHYSICS
- G02—OPTICS
- G02B—OPTICAL ELEMENTS, SYSTEMS OR APPARATUS
- G02B26/00—Optical devices or arrangements for the control of light using movable or deformable optical elements
- G02B26/08—Optical devices or arrangements for the control of light using movable or deformable optical elements for controlling the direction of light
- G02B26/10—Scanning systems
- G02B26/103—Scanning systems having movable or deformable optical fibres, light guides or waveguides as scanning elements
-
- A—HUMAN NECESSITIES
- A61—MEDICAL OR VETERINARY SCIENCE; HYGIENE
- A61B—DIAGNOSIS; SURGERY; IDENTIFICATION
- A61B1/00—Instruments for performing medical examinations of the interior of cavities or tubes of the body by visual or photographical inspection, e.g. endoscopes; Illuminating arrangements therefor
- A61B1/00002—Operational features of endoscopes
- A61B1/00004—Operational features of endoscopes characterised by electronic signal processing
- A61B1/00006—Operational features of endoscopes characterised by electronic signal processing of control signals
-
- A—HUMAN NECESSITIES
- A61—MEDICAL OR VETERINARY SCIENCE; HYGIENE
- A61B—DIAGNOSIS; SURGERY; IDENTIFICATION
- A61B1/00—Instruments for performing medical examinations of the interior of cavities or tubes of the body by visual or photographical inspection, e.g. endoscopes; Illuminating arrangements therefor
- A61B1/00163—Optical arrangements
- A61B1/00172—Optical arrangements with means for scanning
-
- A—HUMAN NECESSITIES
- A61—MEDICAL OR VETERINARY SCIENCE; HYGIENE
- A61B—DIAGNOSIS; SURGERY; IDENTIFICATION
- A61B1/00—Instruments for performing medical examinations of the interior of cavities or tubes of the body by visual or photographical inspection, e.g. endoscopes; Illuminating arrangements therefor
- A61B1/06—Instruments for performing medical examinations of the interior of cavities or tubes of the body by visual or photographical inspection, e.g. endoscopes; Illuminating arrangements therefor with illuminating arrangements
- A61B1/07—Instruments for performing medical examinations of the interior of cavities or tubes of the body by visual or photographical inspection, e.g. endoscopes; Illuminating arrangements therefor with illuminating arrangements using light-conductive means, e.g. optical fibres
-
- G—PHYSICS
- G02—OPTICS
- G02B—OPTICAL ELEMENTS, SYSTEMS OR APPARATUS
- G02B23/00—Telescopes, e.g. binoculars; Periscopes; Instruments for viewing the inside of hollow bodies; Viewfinders; Optical aiming or sighting devices
- G02B23/24—Instruments or systems for viewing the inside of hollow bodies, e.g. fibrescopes
- G02B23/2407—Optical details
- G02B23/2461—Illumination
- G02B23/2469—Illumination using optical fibres
-
- G—PHYSICS
- G02—OPTICS
- G02B—OPTICAL ELEMENTS, SYSTEMS OR APPARATUS
- G02B23/00—Telescopes, e.g. binoculars; Periscopes; Instruments for viewing the inside of hollow bodies; Viewfinders; Optical aiming or sighting devices
- G02B23/24—Instruments or systems for viewing the inside of hollow bodies, e.g. fibrescopes
- G02B23/26—Instruments or systems for viewing the inside of hollow bodies, e.g. fibrescopes using light guides
-
- H—ELECTRICITY
- H02—GENERATION; CONVERSION OR DISTRIBUTION OF ELECTRIC POWER
- H02N—ELECTRIC MACHINES NOT OTHERWISE PROVIDED FOR
- H02N2/00—Electric machines in general using piezoelectric effect, electrostriction or magnetostriction
- H02N2/0005—Electric machines in general using piezoelectric effect, electrostriction or magnetostriction producing non-specific motion; Details common to machines covered by H02N2/02 - H02N2/16
- H02N2/0075—Electrical details, e.g. drive or control circuits or methods
- H02N2/008—Means for controlling vibration frequency or phase, e.g. for resonance tracking
Definitions
- the present disclosure relates to a method for calculating a scanning pattern of light in scanning endoscopes and an optical scanning apparatus such as a scanning endoscope.
- an fiber scanning observation apparatus which scans light from an emitting end of an optical fiber toward an object and detects light reflected or scattered by the object or fluorescence or the like generated in the object.
- the optical fiber in order to scan the irradiated light on the object, the optical fiber is cantilevered at the tip part thereof, with the emitting end for emitting light being in an oscillatable state, and a drive mechanism such as a piezoelectric element is disposed so as to exert a force in the vicinity of the supporting part, to thereby vibrate the optical fiber.
- Helical scan spiral scan
- Raster scan have been known as exemplary methods of scanning an optical fiber.
- the spiral scan scans an optical fiber such that the spot of the irradiated light draws spirals.
- the raster scan vibrates an optical fiber at high speed in one direction while driving the fiber at low speed in other direction perpendicular thereto.
- the vibration frequency is generally set equal to or near the resonance frequency.
- the optical fiber may preferably be vibrated near the resonance frequency in the direction of high-speed vibration. For these reasons, the fiber has been conventionally vibratory driven based on the resonance frequency determined based on the design value of the optical fiber scanning apparatus.
- sensors for detecting the position of the fiber may be used to obtain beforehand the coordinate data on the irradiation position of light from the optical fiber, as a function of time elapsed from the start of the scan, and in the actual scan of the object, pixel signals detected according to the time elapsed from the start of the scan are mapped on a two-dimensional coordinate, to thereby generate an image.
- the properties of the optical fiber are not always constant, and susceptible to temporal variation due to changes in the surrounding environment such as temperature change, aging of the constituent members, and impact against an object during use. Further, members such as piezoelectric elements and adhesives constituting the drive mechanism are also to change with time. Such temporal variations in the characteristics of the optical fiber and of the drive mechanism lead to changes in the resonance frequency at the tip part of the optical fiber and the attenuation coefficient (Q value) of the vibration, and in the driving force of the drive mechanism. As a result, the scanning pattern of the optical fiber will be diverged to be different from the scanning pattern originally intended, which is described with reference to FIGS. 1 and 2 .
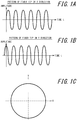
- FIGS. 1 each show, as a simplified example, the scanning of an optical fiber in a circular orbit, in which: FIG. 1 A shows a pattern of the tip of the optical fiber in the X direction; FIG. 1B shows a pattern of the tip of the optical fiber in the Y direction; and FIG. 1 C shows a pattern of the optical scanning in the XY plane.
- the fiber-tip vibration in the X direction and the fiber-tip vibration in the Y direction are shifted from each other in phase by 90 degrees, and thus, the fiber tip renders a circular orbit.
- FIGS. 2 show the scanning of the optical fiber which has been varied with time.
- Changes in resonance frequency, Q value of the vibration, and driving force of the drive mechanism vary the phase and the amplitude as can be seen from the fiber tip loci in the X direction and in the Y direction of FIGS. 2A and 2B . Accordingly, as shown in FIG. 2C , the pattern of the optical scanning on the object is also deformed.
- the scanning pattern 101 is deformed as illustrated by the solid line of FIG. 3 from the pattern (broken line) 102 originally intended.
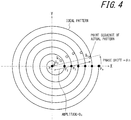
- the scanning pattern of light has been deformed as described above, when an image of the object is formed by mapping pixel data on a two dimensional coordinate based on a pre-intended orbit of the optical fiber, the generated image is distorted from the actual image. More specifically, as illustrated in FIG. 4 , the actual pattern (plotted by white circles at regular time intervals) is deviated in amplitude and phase from the ideal pattern (plotted by black circles at regular time intervals).
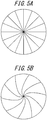
- a phase shift ⁇ n is generated, there has been a problem that the original image of FIG. 5A is formed as an image distorted in the circumferential direction particularly in the center as illustrated in FIG. 5B .
- Cited Document 1 describes an invention which uses scanning position detectors such as a position sensor device (PSD) to obtain a coordinate value of the actual scanning pattern and creates a look-up table having information on the coordinate value, based on which a coordinate to be assigned to each pixel is corrected.
- scanning position detectors such as a position sensor device (PSD)
- Cited Invention 1 the actual scanning loci obtained by PSD or the like are all stored in a memory as the look-up table, which leads to a problem in that the memory capacity will be enormously increased, imposing constraints on the hardware.
- Cited Document 1 has involved another problem in that the coordinate value of the pattern is deviated from the original value, due to the influences of electric noise of the PSD and light reflected by lenses in the optical lenses.
- one of the disclosed aspects therefore provides a method for calculating a scanning pattern of light and an optical scanning apparatus which are capable of obtaining a high-quality image without imposing constrains on the hardware.
- the disclosed method for calculating a scanning pattern of light and the disclosed optical scanning apparatus are generally configured as follows.
- the disclosed method for calculating a scanning pattern of light includes the steps of: detecting a resonance frequency and an attenuation coefficient of an oscillation part of an optical fiber which guides light from a light source and irradiates an object with the light; and calculating a scanning pattern of the light, based on the detected resonance frequency and attenuation coefficient.
- the scanning pattern may preferably include information on temporal change in phase shift of the oscillation part.
- the phase refers to an angle of the scanning pattern represented by polar coordinates.
- the disclosed method for calculating a scanning pattern of light may preferably further include the step of calculating an approximation function of the temporal change in phase shift.
- the disclosed method for calculating a scanning pattern of light includes the steps of: detecting, using position data detected by a scanning position detector, a scanning pattern of light from an oscillation part of an optical fiber which guides the light from a light source and irradiates an object with the light; and calculating an approximation coefficient of temporal change in phase shift of the oscillation part included in the scanning pattern.
- the approximation function may preferably be an exponential function when the amplitude of the oscillation part is equal to or lower than a certain value, and may preferably be a first-order function when the amplitude is larger than the certain value.
- the approximation function may preferably be a second or higher-order polynomial function when the amplitude of the oscillation part is equal to or smaller than a certain value, and may preferably be a first-order function when the amplitude is larger than the certain value.
- the approximation function may preferably be calculated separately for the forward path and the return path of the scanning pattern.
- the approximation function may preferably depend on the drive frequency and/or the maximum amplitude of the oscillation part.
- the disclosed optical scanning apparatus includes: an optical fiber which guides light from a light source and irradiates an object with the light; a scanning part which drives an oscillation part oscillatably supported of the optical fiber; a detector which detects a resonance frequency of the oscillation part; a calculation part which determines an irradiation position of the light using a scanning pattern calculated based on the resonance frequency detected by the detector and the attenuation coefficient obtained in advance.
- the scanning pattern may preferably include information on temporal change in phase shift of the oscillation part.
- the calculation part may preferably calculate an approximation coefficient of the temporal change in phase shift.
- the disclosed optical scanning apparatus includes: an optical fiber which guides light from a light source and irradiates an object with the light; a scanning part which drives an oscillation part oscillatably supported of the optical fiber; and a calculation part which calculates, using position data detected by a scanning position detector, an approximation coefficient of temporal change in phase shift of the oscillation part included in the scanning pattern.
- the approximation function may preferably be an exponential function when the amplitude of the oscillation part is equal to or smaller than a certain value, and may preferably be a first-order function when the amplitude is larger than the certain value.
- the approximation function may preferably be a second or higher-order polynomial function when the amplitude of the oscillation part is equal to or smaller than a certain value, and may preferably be a first-order function when the amplitude is larger than the certain value.
- the calculation part calculates the approximation function separately for the forward path and the return path of the scanning pattern.
- the approximation function may preferably depend on the drive frequency and/or the maximum amplitude of the oscillation part.
- the disclosed method for calculating a scanning pattern of light and the disclosed optical scanning apparatus are capable of obtaining a high-quality image without imposing constraints on the hardware.
- FIG. 6 is a block diagram illustrating a schematic configuration of an optical scanning endoscope apparatus as an example of the optical scanning apparatus.
- the optical scanning endoscope apparatus 10 includes: a scope 20; a control device body 30; and a display 40.
- the control device body 30 is configured by including: a control/calculation part 31 controlling across the entire optical scanning endoscope apparatus 10; an emission timing controller 32; lasers 33R, 33G, 33B; and a coupler 34.
- the emission timing controller 32 controls, under the control of the control/calculation part 31, the emission timings of the three lasers 33R, 33G, 33B emitting laser light of three primary colors of red, green, and blue.
- Examples for use as the lasers 33R, 33G, 33B may include, for example, a diode pumped solid state (DPSS) laser and a laser diode.
- DPSS diode pumped solid state
- Laser lights emitted from the lasers 33R, 33G, 33B are multiplexed by the coupler 34, and caused to incident, as white illumination light, on an illumination optical fiber 11 being a single mode fiber.
- the light sources of the optical scanning endoscope apparatus 10 may not be limitedly configured as above; the apparatus 10 may use one laser light source or a plurality of other light sources.
- the lasers 33R, 33G, 33B and the coupler 34 may be accommodated in another casing which is different from the control device body 30 but connected with the control device body 30 via a signal line.
- the illumination optical fiber 11 is linked to the tip part of the scope 20, and light incident on the illumination optical fiber 11 from the coupler 34 is guided to the tip part of the scope 20 and irradiated toward an object 100.
- an actuator 21 is vibratory driven, so as to two-dimensionally scan an observation surface of the object 100 with illumination light emitted from the illumination optical fiber 11.
- the actuator 21 is controlled by a drive control/resonance frequency detection part 38 of the control device body 30 to be described later.
- the object 100 irradiated with the illumination light provides signal light such as reflected light, scattered light, and fluorescence, which are received at the tip of a detection optical fiber bundle 12 formed of multimode fibers and guided through the scope 20 to the control device body 30.
- the control device body 30 further includes a photodetector 35, an analog-to-digital converter (ADC) 36, and an image processor 37, which are for processing signal light.
- the photodetector 35 splits signal light that has passed through the detection optical fiber bundle 12 into spectral components, and converts the spectral components into electric signals by using photodiodes.
- the image signals having been converted into electric signals are converted into digital signals by the ADC 36, which then outputs the digital signals to the image processor 37.
- the control/calculation part 31 calculates, based on information on the amplitude and phase of the vibration voltage applied by the drive control/resonance frequency detection part 38, information on the scanning position on the scanning path, and passes the information to the image processor 37.
- the image processor 37 obtains, from the digital signals output from the ADC 36, pixel data of the object 100 at the scanning position.
- the image processor 37 sequentially stores, in a memory (not shown), information on the scanning position and the pixel data, performs necessary process such as interpolation process on the data during or after the scan to generate an image of the object 100, and displays the image on the display 40.
- control/calculation part 31 synchronously controls the emission timing controller 32, the photodetector 35, the drive control/resonance frequency detection part 38, and the image processor 37.
- FIG. 7 is an overview schematically illustrating the scope 20.
- the scope 20 includes the operating portion 22 and the insertion portion 23.
- the illumination optical fiber 11, the detection optical fiber bundle 12, and the wiring cable 13 from the control device body 30 are each connected to the operating portion 22.
- the illumination optical fiber 11, the detection optical fiber bundle 12, and the wiring cable 13 extend through inside the insertion portion 23 to be guided to the tip part 24 (enclosed by the dashed line of FIG. 7 ) of the insertion portion 23.
- FIG. 8 is an enlarged sectional view of the tip part 24 of the insertion portion 23 of the scope 20 of FIG. 7 .
- the tip part 24 is configured by including: the actuator 21; projection lenses 25a, 25b; the illumination optical fiber 11 passing through the central part; and the detection optical fiber bundle 12 passing through the circumferential part.
- the actuator 21 is configured by including: an actuator tube 27 fixed inside the insertion portion 23 of the scope 20 through an attachment ring 26; and a fiber holding member 29 and piezoelectric elements 28a to 28d (see FIGS. 9A and 9B ) disposed within the actuator tube 27.
- the illumination optical fiber 11 is held by the fiber holding member 29, and has an oscillation part 11b oscillatably supported, the oscillation part 11b being defined between an fixed end 11 a held by the fiber holding member 29 and the tip part 11c.
- the detection optical fiber bundle 12 is disposed so as to pass through the circumferential part of the insertion portion 23 to extend to the tip of the tip part 24. Further, the detection optical fiber bundle 12 may include a detection lens, which is not shown, at the tip part of each fiber.
- the projection lenses 25a, 25b and the detection lens are disposed at the extreme tip of the tip part 24.
- the projection lenses 25a, 25b are configured such that laser light emitted from the tip part 11c of the illumination optical fiber 11 is substantially converged onto the object 100.
- the detection lens is disposed to take in the laser light that has been reflected, scattered, and refracted by the object 100 (light that has been interacted with the object 100) after being converged onto the object 100, so as to converge and couple the laser light to the detection optical fiber bundle 12 disposed behind the detection lens.
- one projection lens or a plurality of other lenses may constitute the projection lens system, without being limited to the two-lens configuration.
- the detection fiber bundle may directly take in light without using the detection lens.
- FIG. 9A illustrates a vibratory drive mechanism of the actuator 21 of the optical scanning endoscope device 10 and the oscillation part 11b of the illumination optical fiber 11, and FIG. 9B is a sectional view taken along the line A-A of FIG. 9A .
- the illumination optical fiber 11 penetrates through the center of the fiber holding member 29 in a prism shape, so as to be fixed and held by the fiber holding member 29.
- the fiber holding member 29 has four side faces each facing the +Y direction and the +X direction and the directions opposite thereto, respectively, of which two side faces of the fiber holding member 29 facing the +Y direction and -Y direction have a pair of the Y-direction driving piezoelectric elements 28a, 28c fixed thereon, and two side faces of the fiber holding member 29 facing the +X direction and -X direction have a pair of the X-direction driving piezoelectric elements 28b, 28d fixed thereon.
- the piezoelectric elements 28a to 28d are each connected with the wiring cables 13 from the drive control/resonance frequency detection part 38.
- the control device body 30 includes the drive control/resonance frequency detection part 38 for detecting the resonance frequency of the oscillation part 11b of the optical fiber 11.
- the drive control/resonance frequency detection part 38 may detect the resonance frequency by a simple method such as, for example, impedance measurement for monitoring a current value to be obtained when a predetermined voltage is applied to the piezoelectric elements.
- FIG. 10 is a block diagram showing a schematic configuration of the drive control/resonance frequency detection part 38.
- the drive control/resonance frequency detection part 38 includes: a direct digital synthesizers (DDS) 51x, 51 y; a digital-to-analog converters (DAC) 52x, 52y; and amplifiers 53x, 53y.
- the DDS 51x and the DDS 51y each receive a control signal from the control/calculation part 31 and generate a digital drive signal waveform.
- the signal is converted into an analog signal by the DAC 52x, 52y, amplified by the amplifiers 53x, 53y, and drives, via the wiring cable 13, the piezoelectric elements 28a to 28d disposed at the tip part 24 of the scope 20.
- a voltage of the same magnitude and opposite polarity is always applied across the X-direction piezoelectric elements 28b and 28d.
- a voltage of the same magnitude and opposite polarity is always applied across the Y-direction piezoelectric elements 28a and 28c.
- the piezoelectric elements 28b, 28d disposed opposite to each other across the fiber holding member 29 one is extended while the other is contracted in an alternating manner to deflect the fiber holding member 29, which may be repeated to cause vibration in the X direction. The same applies to the vibration in the Y direction.
- the drive control/resonance frequency detection part 38 may vibratory drive the X-direction-drive piezoelectric elements 28b, 28d and the Y-direction-drive piezoelectric elements 28a, 28c by applying thereto vibration voltages of the same frequency or vibration voltages of different frequencies.
- the oscillation part 11b of the illumination optical fiber 11 is vibrated to deflect the tip part 11c, which causes laser light emitted from the tip part 11c to sequentially scan the surface of the object 100.
- the oscillation part 11b of the illumination optical fiber 11 is vibratory driven both in the X and Y directions at the resonance frequency.
- the resonance frequency of the oscillation part 11b varies due to the environmental conditions and lapse of time, and thus the drive control/resonance frequency detection part 38 has a resonance frequency detection mechanism for detecting the resonance frequency of the oscillation part 11b of the illumination optical fiber 11.
- the resonance frequency detection mechanism includes, as illustrated in FIG.
- a current detection circuit 55x and a voltage detection circuit 56x disposed on a circuit extending from the amplifier 53x toward the piezoelectric elements 28b, 28d; analog-to-digital converters (ADC) 57, 58 for converting the current signal and the voltage signal detected by the circuits 55x, 56x into digital signals; and a resonance frequency detector 59 detecting the resonance frequency of a vibration in the X direction based on the phase difference between the output signals from the two ADC 57 and ADC 58.
- ADC analog-to-digital converters
- a current detection circuit 55y and a voltage detection circuit 56y are similarly provided in order to detect the resonance frequency of vibration in the Y direction, which are also configured to have the outputs thereof to be input to the resonance frequency detector 59 via ADC (not shown).
- the X-direction piezoelectric elements 28b, 28d and the Y-direction piezoelectric elements 28a, 28c are applied with vibration voltages having an amplitude equal to a predetermined amplitude, shifted in phase by 90° in the X direction and the Y direction, and having a frequency f that increases with time. This way causes the vibration frequency of the tip part 11c of the illumination optical fiber 11 to sweep within a predetermined frequency range.
- the predetermined frequency range is determined by predicting in advance a range in which the resonance frequency may vary in the neighborhood of the designed resonance frequency.
- the resonance frequency detector 59 monitors the current signal and the voltage signal each detected by the current detection circuits 55x, 55y and the voltage detection circuits 56x, 56y, respectively.
- the resonance frequency detector 59 senses phase shifts in the current signal and the voltage signal to thereby detect the resonance frequency.
- the frequency characteristics of the impedance of the vibration circuit and of the phase shift in current and voltage are each known to be obtained as those illustrated in FIGS. 11A and 11 B , respectively.
- FIG. 11 A when vibrated at the resonance frequency, the impedance reaches its minimum and the phase shift turns to zero.
- the resonance frequency detector 59 identifies, as the resonance frequency, a frequency fr obtained when the phase shift between the current signal from the current detection circuits 55x, 55y and the voltage signal from the voltage detection circuits 55x, 56y turns to zero, and outputs the resonance frequency thus identified to the control/calculation part 31.
- the aforementioned measurement method can obtain other various measurement values from a dynamic admittance circle which is the admittance of the piezoelectric elements represented on a complex plane, and a mechanical series resonance frequency fs may be identified as the resonance frequency.
- the attenuation coefficient (Q value), impedance measurement or the like allows for calculating in advance the attenuation coefficient.
- the resonance frequency and the attenuation frequency may be detected by a shared detector or by separate detectors.
- this embodiment has exemplified an actuator using piezoelectric elements, the same method may also be used in an actuator of electromagnetic driving type to detect the resonance frequency and the attenuation coefficient.
- frequency characteristics relative to the drive signal at the scanning amplitude of the optical fiber may be measured to obtain the resonance frequency, the maximum amplitude, and the attenuation coefficient (Q value) of the fiber.
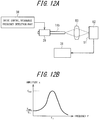
- the drive control/resonance frequency detection part 38 may give a periodic drive waveform having a constant amplitude to the piezoelectric element 28, to thereby drive the oscillation part 11b of the fiber.
- Light is guided through the fiber and emitted from the fiber emitting end, which is then focused, through an optical system 50, onto a light detection surface 51 of the optical scanning position detector 52.
- the amplitude value of the fiber may be measured by sweeping the frequency of the drive waveform, so as to obtain the graph as shown in FIG. 12B .
- the resonance frequency fx in a certain driving direction (X) of the fiber and the maximum amplitude Xmax of the fiber can be obtained.
- Equation 1 may be used to obtain Q value (Qx) of the vibration.
- the resonance frequency fy, the maximum amplitude Ymax, and Q value (Qy) can be obtained for the Y direction.
- the method for measuring the amplitude is not limited to the aforementioned example.
- an image sensor may be used in place of the PSD, or the vibratory displacement of the oscillation part 11b of the fiber may be measured by a laser displacement meter.
- the drive signal for scanning an optical fiber is set to zero at a certain time, so as to analyze the attenuation curve of the damping oscillation of the fiber, to thereby obtain the resonance frequency and the attenuation coefficient (Q value) of the fiber.
- control/calculation part 31 may calculate the scanning pattern of light, based on the attenuation coefficient; the resonance frequency detected by the drive control/resonance frequency detection part 38; and a selected drive frequency and/or maximum amplitude.
- the coefficients of the motion equation of the oscillation part 11b may be substituted by the resonance frequency detected by the drive control/resonance frequency detection part 38, the attenuation coefficient obtained in advance, and the scanning amplitude of the fiber, so as to solve the motion equation.
- the motion equation may be solved analytically and/or numerically.
- the resonance frequency and the attenuation coefficient may be detected upon shipment of the product to calculate the resonance frequency, or the resonance frequency and the attenuation coefficient may be detected after having changed due to aging.
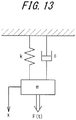
- Equation 3 may be used to express the vibration of the oscillation part 11b of the fiber, in which x represents the amplitude of the oscillation part 11b of the fiber.
- Equation 3 may be used to express the vibration of the oscillation part 11b of the fiber, in which x represents the amplitude of the oscillation part 11b of the fiber.
- m x ⁇ ⁇ kx ⁇ c x ⁇ + F t (where m: mass, k: spring coefficient, c: damper coefficient, F(t): external force)
- Equation 4 The differential equation (Equation 4) may be Laplace transformed, so as to obtain a transfer function G(s) of the fiber vibration system, which can be expressed by a secondary delay system as shown in Equation 5 below.
- G s K s 2 + ⁇ Q ⁇ s + ⁇ 2
- the resonance frequency, the attenuation coefficient, and the maximum amplitude of the fiber may be obtained, so as to numerically calculate the scanning pattern with respect to an arbitrary drive input waveform.
- the scanning pattern thus calculated includes information on temporal change in phase shift, which allows the control/calculation part 31 to calculate an approximation function for the temporal change in phase shift.
- f 0 represents the modulation frequency (frame rate/2).
- FIG. 14B is a partial enlarged view of FIG. 14A , in which f represents the drive frequency.
- one image can be obtained at a time in the forward path and the return path of a spiral scan, respectively.
- the vibration pattern when comparing the phase shift relative to the input signal waveform, the vibration pattern may be considered separately in the center and the periphery of the forward path as illustrated in FIGS. 16A and 16B .
- the phase shift becomes greater near the center of the scanning pattern while the phase shift becomes smaller near the periphery of the scanning pattern.
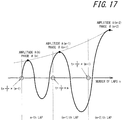
- the amplitude A(n) and the phase ⁇ (n) in the X direction in the n-th lap may be obtained by, for example, polynomial fitting, which may be represented by Equations 7 and 8 below.
- the spiral modulation pattern in the X direction can be represented as follows.
- the pattern in the Y direction may similarly be obtained, to thereby derive the coefficients a 6 to a 0 and b 6 to b 0 .
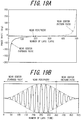
- FIGS. 19A and 19B each show, in a graph, the approximation functions of the amplitude and the phase thus obtained.
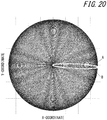
- different fitting functions may separately be used for the center and the periphery of the pattern. That is, as illustrated in FIGS. 20A and 20B , the phase shift behavior is different between near the periphery and near the center, and thus, linear approximation may be applied near the periphery while polynomial approximation may be applied near the center.
- the phase shift ⁇ (n) may be approximated by a polynomial (for example, fifth-order function) in the 0 to 150th laps (the forward path near the center), the phase shift ⁇ (n) may be approximated by a first-order function in the 151st to 350th laps (near the periphery), and the phase shift ⁇ (n) may be approximated by a polynomial (for example, fifth-order function) in the 351st to 500th laps (the return path near the center).
- a polynomial for example, fifth-order function
- control/calculation part 31 may pass, to the image processor 37, information on the scanning pattern calculated based on information such as the amplitude and the phase of a vibration voltage applied by the drive control/resonance frequency detection part 38.
- the drive control/resonance frequency detection part 38 obtains in advance the resonance frequency of the oscillation part 11b of the optical fiber.
- the attenuation coefficient can also be obtained in advance by, for example, measuring impedance.
- control/calculation part 31 calculates a scanning pattern based on the resonance frequency and the attenuation coefficient obtained in advance, and the scanning pattern thus calculated by the control/calculation part 31 may be used so as to use the position coordinate indicated by the scanning pattern, as position information during image processing.
- the calculated scanning pattern includes phase shift information, which eliminates image distortion (in particular, distortion in the direction of rotation).
- this embodiment allows for obtaining a high-quality image by a simple method.
- the drive frequency was defined to be smaller than the resonance frequency.
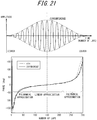
- FIG. 21 shows a scanning pattern calculated when a spiral scan has been performed.
- the yellow dot sequence A shows a phase shift in the Y-axis direction of the forward path from the center toward the periphery of the spiral
- the light blue dot sequence B shows a phase shift in the Y-axis direction of the return path from the periphery toward the center of the spiral.
- FIG. 22 shows a drive pattern (upper illustration) and a relation between the number of laps and the phase (lower illustration), indicating, as an experimental result, the relation between the number of laps and the phase actually measured by the PSD.
- control/calculation part 31 is capable of calculating the scanning pattern with accuracy.
- the phase shift becomes particularly significant in a position closer to the center than the periphery of the spiral.
- second or higher-order polynomial approximation or exponential approximation may be performed at the center of the spiral (i.e., where the amplitude is equal to or lower than a certain value), while linear (first-order function) approximation may be performed in the periphery of the spiral (i.e., where the amplitude is larger than a certain value), to thereby perform approximation with further accuracy.
- the approximation functions for the forward path and the return path of the spiral pattern may preferably be calculated independently of each other.
- the forward path and the return path may render different scanning loci, and thus, the separate calculation may further enhance the accuracy of approximation.
- the disclosed method and apparatus may be applied to a part of the scan. More specifically, the approximation function may preferably be calculated based on position data detected by the scanning position detector, when the amplitude of the oscillation part is equal to or lower than a certain value.
- the phase shift relative to an ideal scanning pattern is significant near the center of the scanning region, and thus the scanning pattern needs to be obtained with higher accuracy.
- the scanning position detector may be used in such range to obtain actual data to thereby obtain an accurate scanning pattern, while the scanning pattern may be calculated as described above in a range where the amplitude is large, to thereby suppress the memory capacity to minimum.
- the scanning position detector may obtain actual data for the entire amplitude range and the data may be converted into a function using the aforementioned method, which can also similarly suppress the memory capacity.
- the oscillation part of the scanner 60 and the light receiving part of the PSD 62 may be designed to be optically conjugate to each other, and a laser spot light from the scanner 60 may be received by the PSD 62, to thereby obtain the scanning pattern of the fiber.
- the magnifying power of the optical system 61 may be adjusted, so that the pattern range CD as the projection of the scanning range AB of the oscillation part of the fiber becomes larger than the light receiving range EF of the PSD 62, which allows for measuring the scanning pattern at the center of the spiral scanning region.
- the magnifying power of the optical system 61 may be adjusted such that CD becomes smaller than EF.
- FIG. 23C illustrates the scanning pattern range and the light receiving range of the PSD, viewed from the optical axis direction.
- the distance between the probe tip and the PSD may be properly adjusted, to thereby expand the pattern at the center of the scanning region so as to be measured with accuracy.
- the PSD detects the center of gravity of the laser spot light, and thus the fiber oscillation part of the fiber and the light receiving part of the PSD may not necessarily be conjugate to each other.
- the distance between the probe tip and the PSD may be adjusted as appropriate such that CD becomes smaller than EF.
- the scanning position can be detected with accuracy in a region where the amplitude is equal to or lower than a certain value.
- FIG. 24 is a flow chart of the disclosed method of calculating a scanning pattern of light according to an embodiment thereof.
- the resonance frequency and the attenuation coefficient of the oscillation part of the optical fiber are first detected to be determined in advance by the aforementioned simple method for measuring impedance (Step S101). Then, based on the resonance frequency and the attenuation coefficient thus detected, the scanning pattern of light is calculated (Step S102).
- the scanning pattern includes information on temporal change in phase shift, and thus, the approximation function of the pattern may also be obtained as appropriate (Step S103).
- the position information on the scanning position of light based on the calculated scanning pattern may be used as the position coordinate for use in mapping during image formation, so as to process the image (Step S104).
- the method for calculating the scanning pattern of light according to this embodiment is capable of obtaining a high-quality image without imposing constraints on the hardware.
- Steps S101 and S102 a scanning pattern actually measured by using PSD or the like may be used, which can reduce constraints to be imposed on the hardware as compared to storing all the scanning loci in a memory.
- the scanning pattern of light under a plurality of drive conditions may be calculated in advance and a plurality of approximation coefficients may be obtained and memorized in hardware.
- the plurality of drive conditions may conceivably include the resonance frequency and the attenuation coefficient.
- a temperature sensor may be disposed near the scanner so as to estimate the resonance frequency and the attenuation coefficient based on the temperature obtained by the temperature sensor, so that the optical scanning pattern and the approximation function may be read out from the memory based on the estimated drive conditions and applied to the image processing, which can alleviate distortion in the image due to temperature change with time.
- Embodiments of the disclosed apparatus and method are described in the above, which in no way limit the present disclosure.
- a spiral scan is exemplified in the embodiment above, but the present disclosure is also applicable to Lissajous scan and Raster scan.
- the detection step thereof is unnecessary, and the scanning pattern may be calculated by reading out the attenuation coefficient and the resonance frequency from a memory incorporated in the scope 20.
- a method of driving the fiber using piezoelectric elements is illustrated in the specification, which in no way limits the fiber driving means, and other means such as electromagnetic drive means may similarly be used to obtain the same effect.
- the drive waveform may also be in other patterns than those described in the specification, which can still be expected to provide the same effect as long as the disclosed method is used.
Landscapes
- Physics & Mathematics (AREA)
- Health & Medical Sciences (AREA)
- Life Sciences & Earth Sciences (AREA)
- Optics & Photonics (AREA)
- Surgery (AREA)
- Engineering & Computer Science (AREA)
- General Physics & Mathematics (AREA)
- Medical Informatics (AREA)
- Public Health (AREA)
- Pathology (AREA)
- Biomedical Technology (AREA)
- Heart & Thoracic Surgery (AREA)
- Nuclear Medicine, Radiotherapy & Molecular Imaging (AREA)
- Molecular Biology (AREA)
- Animal Behavior & Ethology (AREA)
- General Health & Medical Sciences (AREA)
- Radiology & Medical Imaging (AREA)
- Veterinary Medicine (AREA)
- Biophysics (AREA)
- Astronomy & Astrophysics (AREA)
- Signal Processing (AREA)
- Mechanical Optical Scanning Systems (AREA)
- Endoscopes (AREA)
- Instruments For Viewing The Inside Of Hollow Bodies (AREA)
Applications Claiming Priority (2)
| Application Number | Priority Date | Filing Date | Title |
|---|---|---|---|
| JP2014031815 | 2014-02-21 | ||
| PCT/JP2015/055727 WO2015125976A1 (fr) | 2014-02-21 | 2015-02-20 | Procédé de calcul de locus de balayage optique, et dispositif de balayage optique |
Publications (2)
| Publication Number | Publication Date |
|---|---|
| EP3108794A1 true EP3108794A1 (fr) | 2016-12-28 |
| EP3108794A4 EP3108794A4 (fr) | 2018-02-14 |
Family
ID=53878471
Family Applications (1)
| Application Number | Title | Priority Date | Filing Date |
|---|---|---|---|
| EP15751455.5A Withdrawn EP3108794A4 (fr) | 2014-02-21 | 2015-02-20 | Procédé de calcul de locus de balayage optique, et dispositif de balayage optique |
Country Status (5)
| Country | Link |
|---|---|
| US (1) | US9766451B2 (fr) |
| EP (1) | EP3108794A4 (fr) |
| JP (1) | JP6382297B2 (fr) |
| CN (1) | CN105899120B (fr) |
| WO (1) | WO2015125976A1 (fr) |
Cited By (2)
| Publication number | Priority date | Publication date | Assignee | Title |
|---|---|---|---|---|
| US11054565B2 (en) | 2016-03-24 | 2021-07-06 | Olympus Corporation | Optical fiber scanning apparatus for adjusting a driving frequency of the optical fiber |
| EP4109165A1 (fr) * | 2021-06-21 | 2022-12-28 | FUJIFILM Corporation | Dispositif de balayage optique et son procédé de commande |
Families Citing this family (10)
| Publication number | Priority date | Publication date | Assignee | Title |
|---|---|---|---|---|
| WO2017029691A1 (fr) * | 2015-08-18 | 2017-02-23 | オリンパス株式会社 | Procédé de balayage optique, dispositif de balayage optique et dispositif d'observation à balayage optique |
| JP2017064270A (ja) * | 2015-10-01 | 2017-04-06 | オリンパス株式会社 | 走査型内視鏡装置 |
| US10959608B2 (en) | 2016-03-31 | 2021-03-30 | Tohoku University | Optical imaging device |
| WO2017203585A1 (fr) * | 2016-05-23 | 2017-11-30 | オリンパス株式会社 | Dispositif d'acquisition de valeur de correction, dispositif de traitement d'image, système d'observation par balayage optique, procédé d'acquisition de valeur de correction et procédé de traitement d'image |
| JP6765903B2 (ja) * | 2016-09-01 | 2020-10-07 | オリンパス株式会社 | 光源装置及び内視鏡システム |
| JP6908825B2 (ja) * | 2017-02-14 | 2021-07-28 | ミツミ電機株式会社 | 光走査装置及び光走査方法 |
| WO2019078058A1 (fr) * | 2017-10-18 | 2019-04-25 | 株式会社日立産機システム | Dispositif de sortie de lumière du type à balayage et son procédé de commande |
| CN108803012A (zh) * | 2018-03-26 | 2018-11-13 | 成都理想境界科技有限公司 | 光纤扫描中用于矫正图像畸变的方法及光纤扫描器 |
| CN114184547B (zh) * | 2021-11-29 | 2024-05-14 | 重庆川仪自动化股份有限公司 | 一种基于双闭环的扫描光栅微镜机械摆角的控制方法 |
| CN117330191B (zh) * | 2023-12-01 | 2024-03-29 | 中国科学院光电技术研究所 | 一种可调参数的谐振频率内置循环搜索方法 |
Family Cites Families (14)
| Publication number | Priority date | Publication date | Assignee | Title |
|---|---|---|---|---|
| US6111645A (en) * | 1991-04-29 | 2000-08-29 | Massachusetts Institute Of Technology | Grating based phase control optical delay line |
| US5840024A (en) * | 1993-10-18 | 1998-11-24 | Olympus Optical Co., Ltd. | Endoscope form detecting apparatus in which coil is fixedly mounted by insulating member so that form is not deformed within endoscope |
| JPH10282452A (ja) * | 1997-04-07 | 1998-10-23 | Venture Forum Mie:Kk | レ−ザ−ポインタ |
| US6563105B2 (en) * | 1999-06-08 | 2003-05-13 | University Of Washington | Image acquisition with depth enhancement |
| US6654158B2 (en) * | 2001-04-20 | 2003-11-25 | Microvision, Inc. | Frequency tunable resonant scanner with auxiliary arms |
| WO2003002956A1 (fr) * | 2001-06-27 | 2003-01-09 | Center For Advanced Science And Technology Incubation, Ltd. | Dispositif et procede de mesure de vibration |
| EP3552534A3 (fr) | 2004-10-01 | 2020-04-15 | University of Washington | Procédés de remappage pour réduire les distorsions dans des images |
| US20080058629A1 (en) * | 2006-08-21 | 2008-03-06 | University Of Washington | Optical fiber scope with both non-resonant illumination and resonant collection/imaging for multiple modes of operation |
| US8305432B2 (en) * | 2007-01-10 | 2012-11-06 | University Of Washington | Scanning beam device calibration |
| US7608842B2 (en) * | 2007-04-26 | 2009-10-27 | University Of Washington | Driving scanning fiber devices with variable frequency drive signals |
| JP2011036462A (ja) * | 2009-08-12 | 2011-02-24 | Hoya Corp | 医療用観察システム |
| JP2011217836A (ja) * | 2010-04-06 | 2011-11-04 | Hoya Corp | 電子内視鏡装置 |
| WO2013111604A1 (fr) * | 2012-01-26 | 2013-08-01 | オリンパス株式会社 | Dispositif d'observation à balayage lumineux |
| JP6270830B2 (ja) * | 2013-05-21 | 2018-01-31 | オリンパス株式会社 | 光走査ユニット、光走査型観察装置、および光ファイバ走査装置 |
-
2015
- 2015-02-20 CN CN201580004203.0A patent/CN105899120B/zh active Active
- 2015-02-20 JP JP2016504215A patent/JP6382297B2/ja active Active
- 2015-02-20 WO PCT/JP2015/055727 patent/WO2015125976A1/fr not_active Ceased
- 2015-02-20 EP EP15751455.5A patent/EP3108794A4/fr not_active Withdrawn
-
2016
- 2016-08-17 US US15/238,848 patent/US9766451B2/en active Active
Cited By (2)
| Publication number | Priority date | Publication date | Assignee | Title |
|---|---|---|---|---|
| US11054565B2 (en) | 2016-03-24 | 2021-07-06 | Olympus Corporation | Optical fiber scanning apparatus for adjusting a driving frequency of the optical fiber |
| EP4109165A1 (fr) * | 2021-06-21 | 2022-12-28 | FUJIFILM Corporation | Dispositif de balayage optique et son procédé de commande |
Also Published As
| Publication number | Publication date |
|---|---|
| CN105899120A (zh) | 2016-08-24 |
| US9766451B2 (en) | 2017-09-19 |
| WO2015125976A1 (fr) | 2015-08-27 |
| JPWO2015125976A1 (ja) | 2017-03-30 |
| CN105899120B (zh) | 2018-05-08 |
| EP3108794A4 (fr) | 2018-02-14 |
| JP6382297B2 (ja) | 2018-08-29 |
| US20170045734A1 (en) | 2017-02-16 |
Similar Documents
| Publication | Publication Date | Title |
|---|---|---|
| EP3108794A1 (fr) | Procédé de calcul de locus de balayage optique, et dispositif de balayage optique | |
| KR101583277B1 (ko) | 2차원 광학 스캐닝을 위한 스캐너, 그 제조방법 및 이를 채용한 의료 영상 기기 | |
| US20170090181A1 (en) | Optical scanning endoscope apparatus | |
| JP2014202716A (ja) | 距離測定装置 | |
| US20160150948A1 (en) | Optical scanning unit, optical scanning observation apparatus, and optical fiber scanning apparatus | |
| CN107407802B (zh) | 光扫描装置的驱动条件设定方法和驱动条件设定装置 | |
| JP6284433B2 (ja) | 光走査型観察装置および光走査型観察方法 | |
| JP2014020963A (ja) | 距離測定装置、発光タイミング制御装置及びプログラム | |
| KR20200128338A (ko) | 리사주 기반의 이미지 캘리브레이션 기술 | |
| CN117099015A (zh) | 计测对象物的距离以及/或者速度的装置及方法 | |
| US20080297869A1 (en) | Oscillator device and drive control method for oscillation system of oscillator device | |
| CN111381366B (zh) | 光扫描装置及其控制方法 | |
| JPWO2014132447A1 (ja) | 光走査装置 | |
| US10845588B2 (en) | Optical scanner and imaging apparatus | |
| EP4016164B1 (fr) | Procédé de fabrication de système de balayage optique, procédé de fabrication de dispositif de balayage optique et procédé d'acquisition de données | |
| US10606067B2 (en) | Drive-condition setting device and drive-condition setting method for optical scanning apparatus | |
| US20170311776A1 (en) | Optical scanning apparatus | |
| JP6341325B2 (ja) | ステージの位置制御装置 | |
| JP6143953B2 (ja) | 走査型内視鏡システム | |
| JP6172465B2 (ja) | ステージの位置制御装置及び方法 | |
| JP2019528483A (ja) | ファイバ式レーザ走査器 | |
| US12366745B2 (en) | Light scanning system and light scanning device | |
| CN110389443B (zh) | 扫描驱动装置、光扫描控制装置以及驱动波形生成方法 | |
| JP2017129882A (ja) | 光走査装置 | |
| JP2010014871A (ja) | 揺動体装置、光偏向装置、光学機器、及び共振周波数検出方法 |
Legal Events
| Date | Code | Title | Description |
|---|---|---|---|
| PUAI | Public reference made under article 153(3) epc to a published international application that has entered the european phase |
Free format text: ORIGINAL CODE: 0009012 |
|
| STAA | Information on the status of an ep patent application or granted ep patent |
Free format text: STATUS: REQUEST FOR EXAMINATION WAS MADE |
|
| 17P | Request for examination filed |
Effective date: 20160822 |
|
| AK | Designated contracting states |
Kind code of ref document: A1 Designated state(s): AL AT BE BG CH CY CZ DE DK EE ES FI FR GB GR HR HU IE IS IT LI LT LU LV MC MK MT NL NO PL PT RO RS SE SI SK SM TR |
|
| AX | Request for extension of the european patent |
Extension state: BA ME |
|
| DAX | Request for extension of the european patent (deleted) | ||
| RIC1 | Information provided on ipc code assigned before grant |
Ipc: A61B 1/00 20060101AFI20170920BHEP Ipc: G02B 23/24 20060101ALI20170920BHEP Ipc: G02B 26/10 20060101ALI20170920BHEP |
|
| A4 | Supplementary search report drawn up and despatched |
Effective date: 20180116 |
|
| RIC1 | Information provided on ipc code assigned before grant |
Ipc: G02B 26/10 20060101ALI20180110BHEP Ipc: G02B 23/24 20060101ALI20180110BHEP Ipc: A61B 1/00 20060101AFI20180110BHEP |
|
| STAA | Information on the status of an ep patent application or granted ep patent |
Free format text: STATUS: THE APPLICATION IS DEEMED TO BE WITHDRAWN |
|
| 18D | Application deemed to be withdrawn |
Effective date: 20200901 |