EP3156860A1 - Système pour un contrôle dynamique avec visualisation interactive afin d'optimiser la consommation d'énergie - Google Patents
Système pour un contrôle dynamique avec visualisation interactive afin d'optimiser la consommation d'énergie Download PDFInfo
- Publication number
- EP3156860A1 EP3156860A1 EP16193603.4A EP16193603A EP3156860A1 EP 3156860 A1 EP3156860 A1 EP 3156860A1 EP 16193603 A EP16193603 A EP 16193603A EP 3156860 A1 EP3156860 A1 EP 3156860A1
- Authority
- EP
- European Patent Office
- Prior art keywords
- energy consumption
- devices
- map
- floor map
- floor
- Prior art date
- Legal status (The legal status is an assumption and is not a legal conclusion. Google has not performed a legal analysis and makes no representation as to the accuracy of the status listed.)
- Withdrawn
Links
Images




Classifications
-
- G—PHYSICS
- G05—CONTROLLING; REGULATING
- G05F—SYSTEMS FOR REGULATING ELECTRIC OR MAGNETIC VARIABLES
- G05F1/00—Automatic systems in which deviations of an electric quantity from one or more predetermined values are detected at the output of the system and fed back to a device within the system to restore the detected quantity to its predetermined value or values, i.e. retroactive systems
- G05F1/66—Regulating electric power
-
- G—PHYSICS
- G05—CONTROLLING; REGULATING
- G05B—CONTROL OR REGULATING SYSTEMS IN GENERAL; FUNCTIONAL ELEMENTS OF SUCH SYSTEMS; MONITORING OR TESTING ARRANGEMENTS FOR SUCH SYSTEMS OR ELEMENTS
- G05B13/00—Adaptive control systems, i.e. systems automatically adjusting themselves to have a performance which is optimum according to some preassigned criterion
- G05B13/02—Adaptive control systems, i.e. systems automatically adjusting themselves to have a performance which is optimum according to some preassigned criterion electric
- G05B13/04—Adaptive control systems, i.e. systems automatically adjusting themselves to have a performance which is optimum according to some preassigned criterion electric involving the use of models or simulators
- G05B13/041—Adaptive control systems, i.e. systems automatically adjusting themselves to have a performance which is optimum according to some preassigned criterion electric involving the use of models or simulators in which a variable is automatically adjusted to optimise the performance
-
- G—PHYSICS
- G05—CONTROLLING; REGULATING
- G05B—CONTROL OR REGULATING SYSTEMS IN GENERAL; FUNCTIONAL ELEMENTS OF SUCH SYSTEMS; MONITORING OR TESTING ARRANGEMENTS FOR SUCH SYSTEMS OR ELEMENTS
- G05B15/00—Systems controlled by a computer
- G05B15/02—Systems controlled by a computer electric
-
- G—PHYSICS
- G05—CONTROLLING; REGULATING
- G05B—CONTROL OR REGULATING SYSTEMS IN GENERAL; FUNCTIONAL ELEMENTS OF SUCH SYSTEMS; MONITORING OR TESTING ARRANGEMENTS FOR SUCH SYSTEMS OR ELEMENTS
- G05B19/00—Program-control systems
- G05B19/02—Program-control systems electric
- G05B19/418—Total factory control, i.e. centrally controlling a plurality of machines, e.g. direct or distributed numerical control [DNC], flexible manufacturing systems [FMS], integrated manufacturing systems [IMS] or computer integrated manufacturing [CIM]
-
- G—PHYSICS
- G06—COMPUTING OR CALCULATING; COUNTING
- G06Q—INFORMATION AND COMMUNICATION TECHNOLOGY [ICT] SPECIALLY ADAPTED FOR ADMINISTRATIVE, COMMERCIAL, FINANCIAL, MANAGERIAL OR SUPERVISORY PURPOSES; SYSTEMS OR METHODS SPECIALLY ADAPTED FOR ADMINISTRATIVE, COMMERCIAL, FINANCIAL, MANAGERIAL OR SUPERVISORY PURPOSES, NOT OTHERWISE PROVIDED FOR
- G06Q50/00—Information and communication technology [ICT] specially adapted for implementation of business processes of specific business sectors, e.g. utilities or tourism
- G06Q50/06—Energy or water supply
-
- G—PHYSICS
- G05—CONTROLLING; REGULATING
- G05B—CONTROL OR REGULATING SYSTEMS IN GENERAL; FUNCTIONAL ELEMENTS OF SUCH SYSTEMS; MONITORING OR TESTING ARRANGEMENTS FOR SUCH SYSTEMS OR ELEMENTS
- G05B2219/00—Program-control systems
- G05B2219/20—Pc systems
- G05B2219/26—Pc applications
- G05B2219/2639—Energy management, use maximum of cheap power, keep peak load low
-
- G—PHYSICS
- G05—CONTROLLING; REGULATING
- G05B—CONTROL OR REGULATING SYSTEMS IN GENERAL; FUNCTIONAL ELEMENTS OF SUCH SYSTEMS; MONITORING OR TESTING ARRANGEMENTS FOR SUCH SYSTEMS OR ELEMENTS
- G05B2219/00—Program-control systems
- G05B2219/20—Pc systems
- G05B2219/26—Pc applications
- G05B2219/2642—Domotique, domestic, home control, automation, smart house
Definitions
- the present disclosure pertains to devices in a space that use energy and particularly to ways of controlling energy consumption by the devices.
- the disclosure reveals a system and approach for monitoring and controlling energy consumption.
- the system may incorporate one or more devices configured on a floor map or site map or BIM or 3D model, a monitor that detects energy consumption by each of the one or more devices, a heat map or other visualization shown on the floor map, a processor, a user interface having a display connected to the processor, and a wearable such as a watch or a body-attached device.
- the heat map may indicate energy consumption in various areas of the floor plan or other structure layout. Levels of energy consumption may be indicated by color, shades or patterns of the same color, and so on.
- the floor map or other kind of layout with the heat map may be a screen showable on the display.
- the floor map or other representative layout may be that of a home, office building, factory, hospital, airport, casino, apartment, commercial building, and so forth.
- a user may have a choice of the kind of layout, representation of level of energy consumption, and the like to have displayed.
- the energy consumption by each of the one or more devices from the monitor may be calculated by the processor in terms of time that each device is active and in terms of a power rating of the respective device.
- the energy consumption by each of the one or more devices may be converted by the processor into cost.
- the present system and approach may incorporate one or more processors, computers, wearable devices, controllers, user interfaces, wireless and/or wire connections, and/or the like, in an implementation described and/or shown herein.
- This description may provide one or more illustrative and specific examples or ways of implementing the present system and approach.
- the system and approach may be described in terms of a home and heat map on a floor plan.
- the system may incorporate one or more devices configured on a floor map, site map, BIM or 3D model, a monitor that detects energy consumption by each of the one or more devices, a heat map or other visualization shown on the floor map, a processor, a user interface having a display connected to the processor, and a wearable such as a watch.
- the heat map may indicate energy consumption in various areas of the floor plan or other structure layout. Levels of energy consumption may be indicated by color, shades or patterns of the same color, and so on.
- the floor map or other kind of layout with the heat map may be a screen showable on the display.
- the floor map or other representative layout may be that of a home, office building, factory, hospital, airport, casino, apartment, commercial building, and so forth. A user may have a choice of the kind of layout, representation of level of energy consumption, and the like to be displayed.
- Homes may have energy consumption control in a house related to activation and deactivation of the sensors, and devices attached to the automation system.
- Devices may include sensors. Devices that are attached to the system may be like door and window sensors, window blinds, door locks, lights, thermostat (cooling and heating unit), garage door controls, refrigerator, fans, electric iron, water heater, washing machine, cameras, smoke/gas detectors, coffee maker, microwave, dishwasher, televisions, and so on. Some of these devices are also connected via binary switches. Some systems may give details about the overall energy consumption of the house.
- Some systems may try to learn a trend and try to force a setting in the system to optimize the energy consumption but can compromise a user's comfort or take time to change the comfort settings. So there appears to be a need for a solution that gives full control to a user on giving flexible, instant and dynamic options to the user to measure and optimize the energy consumption. There appears no necessarily easy and interactive approach to visualize the energy/power consumption by the connected home system, by devices and sensors or by zone/area. There appears a lack of a dynamic option to optimize the energy consumption, and a lack of control by an end user relative to energy optimization options.
- the present system and approach may work by visualizing energy consumption of the individual connected with home system's devices and sensors or by zone on the interactive floor map and give an option to user to dynamically adjust or reduce energy consumption by percentage and time.
- Virtually all connected home sensors and devices may be configured on a floor map.
- the floor map may show a heat map (which may be color coded) or other visualization to indicate energy consumption in different parts of the home or according to individual devices.
- Energy consumption by individual sensors and devices may be calculated by monitoring the active time and power rating, (watts per day (hours), convert it to kilowatts, usage over a month (days) and calculate the cost).
- Energy consumption on each device or zone may be viewed by hours, days, weeks, months, or years on the map view. Energy consumption on each device or zone may be shown as, for example, a cost/currency value in dollars, watt-hours per day, kWh per day, and so on.
- a user may select a heat map region or individual device or can define dynamic region on the floor map to adjust the energy consumption by percentage and by time. If user selects a region and says to reduce consumption in the area by ten percent, then the system may internally change set points to optimize the consumption like dimming lights, adjusting thermostat set points, reducing the fan speed, and so on. A user may also set a duration for setting changes in that, for example, a setting may be applicable for next three hours or one day, and so on.
- a timeline may be shown on the map view and upon selecting a different time of the day, the heat map may get updates, and thus the user can clearly see the trend/changes from minutes to weeks and so on.
- the present system may show and hide the savings that can be achieved by doing dynamic and time based adjustments, by showing money that will be saved with dynamic feedback from a system.
- the system may generate recommendations and notifications to user to optimize the energy consumption and based on a user's acknowledgement, the system may automatically reduce energy consumption by, for instance, five percent, which can be configurable.
- the system may be extended to a mobile device and cloud platform.
- Figure 1 is a diagram that is a solution flow that visualizes energy consumption on a map.
- One may start at symbol 41 and at symbol 42, connected home sensors and devices may be configured on a floor map. The configuring of the sensors and devices may extend to buildings and large premises. Each device's energy consumption may be monitored by a system at the background as indicated in symbol 43. Over a period of time, a floor map may show a heat map (color, pattern, shade coded, and so on) to indicate energy consumption in different parts of a home or by individual device, according to symbol 44.
- a heat map color, pattern, shade coded, and so on
- Energy consumption by individual sensors and devices may be calculated by monitoring the active time and power (in watts per day or hour) and converting the time and power rating to kilowatts, usage over a month or days, and calculating the cost, as noted in symbol 45.
- Energy consumption on each device or zone can be viewed by hours, day, week, month or year on a map view in view of symbol 46.
- a timeline may be shown on a map view, and upon selecting a different time of the day, the heat map may get updates, and thus the user may clearly see the trend and changes from minutes to weeks, and so on.
- Symbol 47 may indicate that energy consumption on each device or zone can be shown as cost/currency value like dollars or by "watt-hours per day” or "kWh per day”.
- the solution flow may end at symbol 48.
- Figure 2 is a diagram of a solution flow that may define a virtual region and control energy consumption. From a symbol 51 at a start, one may go to symbol 52 where over a period of time, a floor map may show a heat map (color coded) to indicate energy consumption in different parts of the home or by individual device. At symbol 53, a question of whether a user selects a region on a floor map or an individual device to replace energy consumption or not. If an answer is no, then a return to symbol 52 may be made for its content to be repeated. If the answer is yes, then an option to reduce the consumption by a percentage may be shown at symbol 54. An option to set the time in minutes, hours, days or weeks, for which a user setting is applicable, may be shown in symbol 55.
- a system may internally change set points to optimize the consumption. For instance, if a user selects a region and says reduce consumption by ten percent, the system may internally change the set points to optimize the consumption like dimming lights, adjusting thermostat setpoints, reducing a fan speed, and so on. The user may also set a duration for the changes (in that a setting can be indicated to be applicable, for example, three hours, one day, and so on). The solution flow may end at symbol 57.
- Figure 3 is a diagram of a screen of a main menu 11 of a subsystem for a home or commercial building in terms of energy consumption.
- Figure 4 is a diagram 12 that reveals smart phones, tablets, wearable devices, and the like for controlling remotely the subsystem.
- Figures 5 and 6 are diagrams of example thermostats 13 and 14 that may be part of local control of the subsystem.
- Figure 7 is a diagram of a console with a display of temperatures in various rooms of a house, of hot water, and more. The items of Figures 3-7 may contribute to dynamic control of a connected home subsystem by interactive visualization to optimize energy consumption.
- Energy consumption may be calculated.
- a living room light may be in an ON state for 11 hours a day on the average. This information may be read from the system's activity data, user action data and overall history data.
- energy consumption by the living room light is 40 watts.
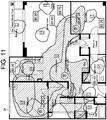
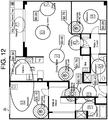
- a solution visualization of the system may be described as a user selects an intended floor map 21 in a display of a smart phone or tablet 22 shown in a diagram of Figure 8 , that may configure devices on floor map 23 of Figure 9 from a device list, get energy consumption details on floor map 23 of Figure 10 with a heat map visualization screen 24 of Figure 11 , get energy consumption details on the floor map with a heat map visualization screen 25 in Figure 12 , dynamically adjusts/reduces energy consumption screen 26 in Figure 13 , and dynamically adjusts/reduces energy consumption screen 27 in Figure 14 .
- Screens 21 and 23-27 may be presented on a display of a smart phone 22, tablet or the like.
- Screens 24-27 may show costs of energy consumption for the various devices.
- the user may select the intended floor map in screen 21 of Figure 9 .
- the user may select his/her home's floor map as a visual input to configure devices.
- the map may be any visual reference that user for a house (2D, 3D, image CAD file, and so forth).
- Configuring devices may be noted on a floor map in screen 23 from a device list.
- a user may drag drop a device and sensors from a list onto the floor map based on a physical location of the devices and sensors such as, door and window sensors, window blinds, door locks, lights, thermostat with cooling and heating units, garage door controls, power points using binary switches (refrigerator, fan, electric iron, water heater, washing machine), cameras, smoke/gas detectors, and so forth.
- Energy consumption details may be noted on a floor map with heat map visualization of screen 24.
- the borders of various levels of consumption are rough lines reflecting an actual difference between areas in terms of energy consumption.
- Energy consumption by category (high, medium, low) or by device may be visualized by day or week or month or year energy consumption may be shown as currency value like dollars ($) or by "watt-hours per day” or "kWh per day”.
- Energy consumption details may be noted on a floor map with heat map visualization of screen 25.
- the lines reflecting the differences of energy consumption are smoothed into geometrical changes such as circles, ovals and the like.
- Energy consumption by category (high, medium, low) or by device may be visualized as in screen 24
- Screen 26 resembles screen 24, except it has an energy consumption adjuster 28 along with a savings indication 29.
- Adjuster 28 may be set for a ten percent reduction of energy consumption for three hours. It may show and hide the savings that can be achieved by doing the dynamic and time based changes on adjuster 28. It is like showing money that will be saved with energy consumption changes.
- each group or device there may be two options, one to reduce/adjust the consumption by a percentage and the other option to set it by time in hours/days (like the setting is applicable for next 3 hours or 1 day, or the like).
- a timeline 31 can be shown on the map view, as in screens 26 and 27, and upon selecting the different time of the day, the heat map may get updates in that a user can clearly see the trend of a day, and similarly timeline 31 can be extended to days, weeks, month, year and so on.
- a dynamic adjust/reduce the energy consumption screen 27 is shown by the diagram of Figure 14 .
- Screen 27 can resemble screen 26 except adjuster 28 may have a different reduction of energy setting and be in another area of a home with a different rate of energy consumption. Also, a time setting for the energy consumption may be made. Indicator 29 may reveal a new monetary savings.
- a user may define a virtual zone on the floor map of screen 27 and reduce ninety or one hundred percent for next two days.
- the use case may be a certain part of house that will not necessarily be used for next two days due to the offspring being gone on for vacation, or some maintenance activity going on at the house or the like.
- a user may differentiate a change in the pattern as the details are shown on floor map. For example, usually just thermostat (heating and cooling) use may take more energy consumption than normal in a day but then suddenly, the map may show a lighting area taking more energy (red area in heat map) which could indicate a possible insulation issue, a faulty device, or so on.
- the present system may be extended to any structure like hotels, corporate buildings, apartments, commercial buildings, and so forth.
- the system may provide recommendations to optimize energy consumption by sending notifications, such as SMS or e-mail.
- Visualization and optimization controls may be done from a mobile device such as a smart phone, tablet, web portal, desktop system, a wearable device, an intrusion panel/keypad (e.g., tuxedo TM ), and the like.
- a mobile device such as a smart phone, tablet, web portal, desktop system, a wearable device, an intrusion panel/keypad (e.g., tuxedo TM ), and the like.
- the present system may provide an option for flexible schedules based on the need.
- the system may aim to visualize energy consumption by households and give a dynamic options and recommendations to control them.
- Dynamic grouping of devices may optimize energy. Instantly, a user may sense a change of energy consumption and take preventive actions. Visualization may help the user to see energy consumption patterns and cost details of each device so that a user can plan energy usage. The visualization may be easy to implement, as it may require a simple software change that most of the eco systems could use.
- the present system may add a competitive advantage to all offerings like Value Net TM , Total Connect TM , evohome TM , Lyric TM , tuxedo TM , and so on.
- the system may also be extended to offerings like DRAS, EBI, and so forth.
- the present system may work by visualizing energy consumption by individually connected home devices, or by zone on the interactive floor map and may give an option to a user to dynamically adjust, such as reduce, energy consumption by percentage and by time.
- the present system may be based on an intrusion detection system, home automation system and connected home system, and it can be made into practice in the Value Net, Total connect, evohome, Lyric, tuxedo products/services and solution can also be extended to offerings like DRAS, EBI, and so on.
- the system may visualize the energy consumption by devices on a user's home floor plan.
- the system may give an option to a user to make the energy optimization actions instantly and dynamically.
- the system may give full control to a user on taking any energy optimization actions instead of forcing the settings in the system.
- the system may give a feedback on the saving that is going to happen based on the correction that the user did.
- the system may allow a user to define a virtual zone on the floor map to take action for energy optimization.
- the system may show a timeline and playback controls on the visualization map view.
- a mechanism for monitoring and controlling energy consumption may incorporate one or more devices configured on a floor map, a monitor that detects energy consumption by each of the one or more devices, an energy consumption map shown on the floor map, a processor, and a user interface having a display connected to the processor.
- the energy consumption map may indicate amounts of energy consumption in various areas of the floor plan.
- the floor map with the energy consumption map may be a screen showable on the display.
- the energy consumption by each of the one or more devices from the monitor may be calculated by the processor in terms of time that each device is active and in terms of a power rating of the respective device.
- the energy consumption by each of the one or more devices may be converted by the processor into cost.
- the cost for each device of the one or more devices may be shown on the floor map.
- the cost of energy consumption of the one or more devices may be shown in terms of one or more zones encompassing one or more devices, respectively.
- An entry into the processor to change energy consumption of a device or a region of devices by a predetermined proportion may cause the processor, which receives input about energy consumption from the monitor and provides an output to control the devices, to optimize energy consumption at the pre-determined proportion.
- Control of devices may be selected from a group of actions incorporating adjusting setpoints of one or more thermostats, dimming and turning on and off lights, changing a speed of one or more fans, and controlling sensors, window blinds, door locks, garage door controls, refrigerator, electric iron, freezer, water heater, washing machine, cameras, smoke/gas detectors, clothes dryer, dishwasher, microwave oven, stove, water filtration system, water pump, coffee maker, toaster, waste grinder, televisions, intrusion detectors, actuators, devices attached to a binary switch, and remotely controllable switches.
- the processor may indicate via the display what actions were effected for optimization of energy consumption by the predetermined proportion.
- An approach for controlling energy consumption may incorporate selecting a floor map of a building as a visual input to configure devices, configuring devices to be placed on the floor map from a device list, dragging and dropping the devices from the device list based on a physical location of actual devices of the floor plan, determining energy consumption on the floor plan with a heat map visualization, and dynamically adjusting the energy consumption with settings of the devices.
- the heat map may show an amount of savings achieved by dynamically adjusting the energy consumption.
- the approach may further incorporate selecting a group of devices for which energy consumption may be adjusted by a pre-determined percentage of decrease or increase of energy consumption.
- An adjustment of energy consumption may be set according to a time of start and finish.
- the times of start and finish may be uniform for some time periods and non-uniform for other time periods.
- the approach may further incorporate defining a virtual zone on the floor map, and reducing energy consumption X percent for a duration of time for the virtual zone.
- the approach may further incorporate differentiating a change in pattern on the heat map of the floor map visualization. If the change in pattern is unanticipated, a check for a cause of the change may be sought.
- a system for controlling energy consumption may incorporate a visualization of energy consumption on a floor map, and a mechanism connected to devices in a building configured on the floor map.
- the floor map may show a heat map to indicate energy consumption in different parts of the building according to the devices in the building. Energy consumption may be calculated by the mechanism for different parts of the building.
- Energy consumption may be expressed in power used per unit time or by cost in terms of a currency.
- a heat map region may be selected and its energy consumption may be defined by percentage and time.
- a user may determine that energy consumption be reduced by X percent.
- the mechanism in response to the determined reduction of consumption energy, may change setpoints of lights, thermostats and other energy consuming devices in an optimal fashion.
- X may be a number.
- the heat map may incorporate a timeline which records heat map data through a set period of time.
- the heat map from data over time may reveal trends and changes on the floor map.
- the mechanism may show savings that can be achieved by dynamic and time based adjustments.
- the optimization mechanism may generate recommendations or notifications for optimizing energy consumption.
- the mechanism may be monitored and controlled with a mobile device and a cloud platform.
- the mobile device may be selected from a group incorporating a smart phone, tablet, web portal, desktop system, a wearable device, and an intrusion panel/keypad.
Landscapes
- Engineering & Computer Science (AREA)
- Physics & Mathematics (AREA)
- General Physics & Mathematics (AREA)
- Automation & Control Theory (AREA)
- Business, Economics & Management (AREA)
- Health & Medical Sciences (AREA)
- Economics (AREA)
- General Engineering & Computer Science (AREA)
- Electromagnetism (AREA)
- Radar, Positioning & Navigation (AREA)
- Power Engineering (AREA)
- Water Supply & Treatment (AREA)
- Tourism & Hospitality (AREA)
- Theoretical Computer Science (AREA)
- General Business, Economics & Management (AREA)
- Public Health (AREA)
- Strategic Management (AREA)
- General Health & Medical Sciences (AREA)
- Human Resources & Organizations (AREA)
- Marketing (AREA)
- Primary Health Care (AREA)
- Computer Vision & Pattern Recognition (AREA)
- Software Systems (AREA)
- Evolutionary Computation (AREA)
- Medical Informatics (AREA)
- Artificial Intelligence (AREA)
- Manufacturing & Machinery (AREA)
- Quality & Reliability (AREA)
- Management, Administration, Business Operations System, And Electronic Commerce (AREA)
- Remote Monitoring And Control Of Power-Distribution Networks (AREA)
- Air Conditioning Control Device (AREA)
- Selective Calling Equipment (AREA)
Applications Claiming Priority (1)
| Application Number | Priority Date | Filing Date | Title |
|---|---|---|---|
| US14/883,521 US10248146B2 (en) | 2015-10-14 | 2015-10-14 | System for dynamic control with interactive visualization to optimize energy consumption |
Publications (1)
| Publication Number | Publication Date |
|---|---|
| EP3156860A1 true EP3156860A1 (fr) | 2017-04-19 |
Family
ID=57482128
Family Applications (2)
| Application Number | Title | Priority Date | Filing Date |
|---|---|---|---|
| EP16193603.4A Withdrawn EP3156860A1 (fr) | 2015-10-14 | 2016-10-12 | Système pour un contrôle dynamique avec visualisation interactive afin d'optimiser la consommation d'énergie |
| EP16193602.6A Withdrawn EP3156859A1 (fr) | 2015-10-14 | 2016-10-12 | Système contrôle dynamique à visualisation interactive permettant d'optimiser la consommation d'énergie |
Family Applications After (1)
| Application Number | Title | Priority Date | Filing Date |
|---|---|---|---|
| EP16193602.6A Withdrawn EP3156859A1 (fr) | 2015-10-14 | 2016-10-12 | Système contrôle dynamique à visualisation interactive permettant d'optimiser la consommation d'énergie |
Country Status (4)
| Country | Link |
|---|---|
| US (4) | US10248146B2 (fr) |
| EP (2) | EP3156860A1 (fr) |
| CN (1) | CN106597863A (fr) |
| CA (1) | CA2945391A1 (fr) |
Cited By (2)
| Publication number | Priority date | Publication date | Assignee | Title |
|---|---|---|---|---|
| CN113610330A (zh) * | 2021-10-08 | 2021-11-05 | 国网江西省电力有限公司供电服务管理中心 | 一种基于用户体验的用户侧灵活资源用能行为优化方法 |
| CN115113587A (zh) * | 2021-03-17 | 2022-09-27 | 西安中建智达信息科技有限公司 | 一种基于北斗高精度定位以及bim的路面施工质量智慧化管控系统 |
Families Citing this family (12)
| Publication number | Priority date | Publication date | Assignee | Title |
|---|---|---|---|---|
| KR20180104224A (ko) * | 2017-03-09 | 2018-09-20 | 삼성전자주식회사 | 화면 제어 방법 및 이를 지원하는 전자 장치 |
| CA3074148A1 (fr) * | 2017-09-21 | 2019-03-28 | Price Industries Limited | Systeme de dispositifs d'exploitation a commande repartie |
| AT520580B1 (de) * | 2017-11-14 | 2019-11-15 | Ing Georg Leitner Msc | Verfahren zur Einbindung von zumindest einer, eine Datenschnittstelle aufweisende Überwachungs- und/oder Steuervorrichtung eines Überwachungs- und/oder Automatisierungssystems in eine Benutzerschnittstelle |
| US10996325B2 (en) * | 2018-11-30 | 2021-05-04 | Ademco Inc. | Systems and methods for adjusting a signal broadcast pattern of an intrusion detector |
| US10762773B1 (en) | 2019-08-19 | 2020-09-01 | Ademco Inc. | Systems and methods for building and using a false alarm predicting model to determine whether to alert a user and/or relevant authorities about an alarm signal from a security system |
| US11953871B2 (en) * | 2019-11-19 | 2024-04-09 | Johnson Controls Tyco IP Holdings LLP | Building control system with automatic control problem formulation using building information model |
| CN111371180B (zh) * | 2020-03-23 | 2023-03-17 | 国网黑龙江省电力有限公司鹤岗供电公司 | 变电站巡查监管与数据分析系统 |
| CN111552197A (zh) * | 2020-04-03 | 2020-08-18 | 五邑大学 | 基于bim的制冷设备能耗优化方法、装置和设备 |
| EP4101676B1 (fr) * | 2021-06-09 | 2024-08-28 | Volvo Car Corporation | Système de surveillance pour véhicule |
| JP7047965B1 (ja) | 2021-08-03 | 2022-04-05 | 株式会社安川電機 | コントローラ、及びシステム構築方法 |
| GB2619524B (en) * | 2022-06-07 | 2024-11-27 | Kingsway Enterprises Uk Ltd | Door monitoring system |
| CN116755377A (zh) * | 2023-08-21 | 2023-09-15 | 山东嘉隆新能源股份有限公司 | 醇类精制机组的能耗监测及远程控制系统 |
Citations (7)
| Publication number | Priority date | Publication date | Assignee | Title |
|---|---|---|---|---|
| US20040158541A1 (en) * | 2003-02-06 | 2004-08-12 | Ultrawatt Energy Systems, Inc. | Power savings financial compensation control method and system |
| EP2292986A2 (fr) * | 2009-07-23 | 2011-03-09 | Mitsubishi Electric Corporation | Appareil d'économie d'énergie et climatiseur |
| US20120280827A1 (en) * | 2011-05-06 | 2012-11-08 | Akifumi Kashiwagi | Information processing apparatus, information processing method, and program |
| JP2014082811A (ja) * | 2012-10-12 | 2014-05-08 | Panasonic Corp | エネルギー管理装置 |
| US20140180968A1 (en) * | 2012-12-18 | 2014-06-26 | Samsung Electronics Co. Ltd. | Method and apparatus for managing energy consumption in a home network system |
| US20140222230A1 (en) * | 2011-11-30 | 2014-08-07 | Panasonic Corporation | Energy management device and program |
| US20150127181A1 (en) * | 2012-05-10 | 2015-05-07 | Sony Corporation | Energy management device, energy management method and program |
Family Cites Families (41)
| Publication number | Priority date | Publication date | Assignee | Title |
|---|---|---|---|---|
| US9042952B2 (en) * | 1997-01-27 | 2015-05-26 | Lawrence A. Lynn | System and method for automatic detection of a plurality of SPO2 time series pattern types |
| US6798627B2 (en) * | 2002-02-05 | 2004-09-28 | Onan Corporation | Engine generator set systems and methods providing load power fault protection |
| EP1372238B1 (fr) | 2002-06-13 | 2018-06-06 | Whirlpool Corporation | Système global de gestion domestique d'énergie |
| TW200629806A (en) * | 2004-10-14 | 2006-08-16 | Lagotek Corp | Distributed wireless home and commercial electrical automation systems |
| US7567844B2 (en) * | 2006-03-17 | 2009-07-28 | Honeywell International Inc. | Building management system |
| JP4306746B2 (ja) * | 2007-03-09 | 2009-08-05 | 株式会社デンソー | 車両用電源装置 |
| US8344665B2 (en) * | 2008-03-27 | 2013-01-01 | Orion Energy Systems, Inc. | System and method for controlling lighting |
| JP4395800B2 (ja) * | 2007-09-18 | 2010-01-13 | 日本電気株式会社 | 電力管理システムおよび電力管理方法 |
| WO2009046095A1 (fr) * | 2007-10-01 | 2009-04-09 | Iconics, Inc. | Visualisation de données de commande de processus |
| US8160752B2 (en) * | 2008-09-30 | 2012-04-17 | Zome Networks, Inc. | Managing energy usage |
| JP4743232B2 (ja) * | 2008-06-17 | 2011-08-10 | ソニー株式会社 | 画像処理装置、画像信号処理方法、プログラム及び記録媒体 |
| JP4450100B2 (ja) * | 2008-09-19 | 2010-04-14 | トヨタ自動車株式会社 | 動力出力装置、それを備えた車両および動力出力装置の制御方法 |
| EP2427862B1 (fr) * | 2009-05-08 | 2016-07-27 | Accenture Global Services Limited | Système d'analyse de la consommation d'énergie d'un bâtiment |
| US8943845B2 (en) * | 2009-09-15 | 2015-02-03 | General Electric Company | Window air conditioner demand supply management response |
| JP5607053B2 (ja) * | 2009-12-28 | 2014-10-15 | パナソニック株式会社 | 電子機器、電子機器の制御方法、コンピュータプログラムおよび記録媒体 |
| US8196085B1 (en) * | 2010-01-19 | 2012-06-05 | Altera Corporation | Interactive design optimization techniques and interface |
| JP5503365B2 (ja) * | 2010-03-25 | 2014-05-28 | キヤノン株式会社 | デバイス管理システム、管理装置、デバイス管理方法及びプログラム |
| AT509823B1 (de) * | 2010-04-15 | 2012-07-15 | Edwin Ing Ploder | System zur überwachung und steuerung des energie- und wasserhaushalts |
| US8738186B2 (en) * | 2010-04-23 | 2014-05-27 | Emerson Electric Co. | Load reduction based on percentage change in energy price |
| US8514540B2 (en) * | 2011-01-26 | 2013-08-20 | General Electric Company | Smart plug with internal condition-based demand response capability |
| US8417361B2 (en) * | 2011-03-22 | 2013-04-09 | General Electric Company | Model predictive control system and method for integrated gasification combined cycle power generation |
| US8396686B2 (en) | 2011-04-13 | 2013-03-12 | Fujitsu Limited | Measure energy consumption and determine energy-consumption patterns for electricity-consuming devices |
| US9154001B2 (en) * | 2011-05-19 | 2015-10-06 | Honeywell International Inc. | Intuitive scheduling for energy management devices |
| US8982130B2 (en) * | 2011-07-15 | 2015-03-17 | Green Charge Networks | Cluster mapping to highlight areas of electrical congestion |
| US9874885B2 (en) * | 2011-12-12 | 2018-01-23 | Honeywell International Inc. | System and method for optimal load and source scheduling in context aware homes |
| KR101984214B1 (ko) * | 2012-02-09 | 2019-05-30 | 삼성전자주식회사 | 로봇 청소기의 청소 작업을 제어하기 위한 장치 및 방법 |
| US8793518B2 (en) * | 2012-06-13 | 2014-07-29 | Dell Products Lp | Systems and methods for providing supplemental power to battery powered information handling systems |
| US20140046722A1 (en) * | 2012-08-10 | 2014-02-13 | Sample6 Technologies, Inc. | System for on-site environment monitoring |
| US9002531B2 (en) * | 2012-09-28 | 2015-04-07 | Sharp Laboratories Of America, Inc. | System and method for predictive peak load management via integrated load management |
| CN203340098U (zh) * | 2013-01-21 | 2013-12-11 | 上海科斗电子科技有限公司 | 红外中转智能家居系统 |
| CN104471956B (zh) * | 2013-03-29 | 2019-07-19 | 松下电器(美国)知识产权公司 | 便携信息终端及其控制方法、以及信息提供方法 |
| US20140316594A1 (en) * | 2013-04-17 | 2014-10-23 | Green Edge Technologies, Inc. | Systems, devices, and methods for reducing safety risk and optimizing energy use |
| KR20150003550A (ko) * | 2013-07-01 | 2015-01-09 | 삼성전자주식회사 | 웹 컨텐츠 전송 방법 및 장치 |
| KR102083299B1 (ko) * | 2013-09-02 | 2020-03-03 | 엘지전자 주식회사 | 표시장치와 그 휘도 제어 방법 |
| US20150198938A1 (en) * | 2014-01-15 | 2015-07-16 | Green Edge Technologies, Inc. | Systems, devices, methods and graphical user interface for configuring a building automation system |
| US20150227397A1 (en) * | 2014-02-10 | 2015-08-13 | Ca, Inc. | Energy efficient assignment of workloads in a datacenter |
| CN104765329B (zh) * | 2014-03-11 | 2019-02-05 | 北京博锐尚格节能技术股份有限公司 | 一种3d能耗展示方法、装置及系统 |
| CN204116930U (zh) * | 2014-09-26 | 2015-01-21 | 广东广联电子科技有限公司 | 一种智能家居节能系统 |
| US20160358722A1 (en) * | 2015-02-05 | 2016-12-08 | Ramasamy Lakshmanan | Intelligent wireless and wired control of devices |
| CN104850013B (zh) * | 2015-04-28 | 2017-05-17 | 南京邮电大学 | 一种家用电器的智能用电方法 |
| WO2017133389A1 (fr) * | 2016-02-05 | 2017-08-10 | 广东欧珀移动通信有限公司 | Système de charge de terminal, procédé de charge et adaptateur d'alimentation |
-
2015
- 2015-10-14 US US14/883,521 patent/US10248146B2/en active Active
-
2016
- 2016-10-12 EP EP16193603.4A patent/EP3156860A1/fr not_active Withdrawn
- 2016-10-12 EP EP16193602.6A patent/EP3156859A1/fr not_active Withdrawn
- 2016-10-13 CA CA2945391A patent/CA2945391A1/fr not_active Abandoned
- 2016-10-14 CN CN201611151610.7A patent/CN106597863A/zh active Pending
-
2019
- 2019-03-01 US US16/290,349 patent/US10809754B2/en active Active
-
2020
- 2020-09-23 US US17/029,578 patent/US11327518B2/en active Active
-
2022
- 2022-03-22 US US17/701,121 patent/US11868151B2/en active Active
Patent Citations (7)
| Publication number | Priority date | Publication date | Assignee | Title |
|---|---|---|---|---|
| US20040158541A1 (en) * | 2003-02-06 | 2004-08-12 | Ultrawatt Energy Systems, Inc. | Power savings financial compensation control method and system |
| EP2292986A2 (fr) * | 2009-07-23 | 2011-03-09 | Mitsubishi Electric Corporation | Appareil d'économie d'énergie et climatiseur |
| US20120280827A1 (en) * | 2011-05-06 | 2012-11-08 | Akifumi Kashiwagi | Information processing apparatus, information processing method, and program |
| US20140222230A1 (en) * | 2011-11-30 | 2014-08-07 | Panasonic Corporation | Energy management device and program |
| US20150127181A1 (en) * | 2012-05-10 | 2015-05-07 | Sony Corporation | Energy management device, energy management method and program |
| JP2014082811A (ja) * | 2012-10-12 | 2014-05-08 | Panasonic Corp | エネルギー管理装置 |
| US20140180968A1 (en) * | 2012-12-18 | 2014-06-26 | Samsung Electronics Co. Ltd. | Method and apparatus for managing energy consumption in a home network system |
Cited By (3)
| Publication number | Priority date | Publication date | Assignee | Title |
|---|---|---|---|---|
| CN115113587A (zh) * | 2021-03-17 | 2022-09-27 | 西安中建智达信息科技有限公司 | 一种基于北斗高精度定位以及bim的路面施工质量智慧化管控系统 |
| CN113610330A (zh) * | 2021-10-08 | 2021-11-05 | 国网江西省电力有限公司供电服务管理中心 | 一种基于用户体验的用户侧灵活资源用能行为优化方法 |
| CN113610330B (zh) * | 2021-10-08 | 2022-01-25 | 国网江西省电力有限公司供电服务管理中心 | 一种基于用户体验的用户侧灵活资源用能行为优化方法 |
Also Published As
| Publication number | Publication date |
|---|---|
| CA2945391A1 (fr) | 2017-04-14 |
| US11327518B2 (en) | 2022-05-10 |
| US20210034090A1 (en) | 2021-02-04 |
| US20170108885A1 (en) | 2017-04-20 |
| US20190196526A1 (en) | 2019-06-27 |
| EP3156859A1 (fr) | 2017-04-19 |
| CN106597863A (zh) | 2017-04-26 |
| US20220214708A1 (en) | 2022-07-07 |
| US10809754B2 (en) | 2020-10-20 |
| US10248146B2 (en) | 2019-04-02 |
| US11868151B2 (en) | 2024-01-09 |
Similar Documents
| Publication | Publication Date | Title |
|---|---|---|
| US11868151B2 (en) | System for dynamic control with interactive visualization to optimize energy consumption | |
| US11719456B2 (en) | Thermostat temperature compensation modeling | |
| US8121737B2 (en) | Systems and methods for presenting saving opportunities for electronic edvices | |
| EP2502121B1 (fr) | Unité de commande pour la commande automatique et l'optimisation d'équipements cvca&r en service, et systèmes et procédés l'utilisant | |
| US11692717B2 (en) | Hydronic floor heating systems with features | |
| US20190227582A1 (en) | System and method for using a wireless device as a sensor for an energy management system | |
| US10151502B2 (en) | HVAC zoning devices, systems, and methods | |
| US20180087795A1 (en) | Multi-function thermostat | |
| US20120273581A1 (en) | Controller For Automatic Control And Optimization Of Duty Cycled HVAC&R Equipment, And Systems And Methods Using Same | |
| US10823432B2 (en) | Electric heating systems and method of use thereof | |
| US20200003448A1 (en) | Facility management portal | |
| AU2013274827A1 (en) | System and method for optimizing use of individual HVAC units in multi-unit chiller-based systems | |
| US20170336088A1 (en) | System and Apparatus for Temperature Control | |
| US20260110453A1 (en) | Networked electric baseboard thermostat and master control system | |
| Urban et al. | Energy savings from five home automation technologies: A scoping study of technical potential |
Legal Events
| Date | Code | Title | Description |
|---|---|---|---|
| PUAI | Public reference made under article 153(3) epc to a published international application that has entered the european phase |
Free format text: ORIGINAL CODE: 0009012 |
|
| 17P | Request for examination filed |
Effective date: 20161012 |
|
| AK | Designated contracting states |
Kind code of ref document: A1 Designated state(s): AL AT BE BG CH CY CZ DE DK EE ES FI FR GB GR HR HU IE IS IT LI LT LU LV MC MK MT NL NO PL PT RO RS SE SI SK SM TR |
|
| AX | Request for extension of the european patent |
Extension state: BA ME |
|
| STAA | Information on the status of an ep patent application or granted ep patent |
Free format text: STATUS: THE APPLICATION HAS BEEN WITHDRAWN |
|
| 18W | Application withdrawn |
Effective date: 20200709 |