EP3276551A1 - Verfahren, computerprogramm und system zur erkennung eines diskrepanz aus einem ungleichgewicht zwischen eingehenden und ausgehenden strömen von ressourcen - Google Patents
Verfahren, computerprogramm und system zur erkennung eines diskrepanz aus einem ungleichgewicht zwischen eingehenden und ausgehenden strömen von ressourcen Download PDFInfo
- Publication number
- EP3276551A1 EP3276551A1 EP17163169.0A EP17163169A EP3276551A1 EP 3276551 A1 EP3276551 A1 EP 3276551A1 EP 17163169 A EP17163169 A EP 17163169A EP 3276551 A1 EP3276551 A1 EP 3276551A1
- Authority
- EP
- European Patent Office
- Prior art keywords
- vertex
- vertices
- target
- values
- resource
- Prior art date
- Legal status (The legal status is an assumption and is not a legal conclusion. Google has not performed a legal analysis and makes no representation as to the accuracy of the status listed.)
- Withdrawn
Links
Images


Classifications
-
- G—PHYSICS
- G06—COMPUTING OR CALCULATING; COUNTING
- G06Q—INFORMATION AND COMMUNICATION TECHNOLOGY [ICT] SPECIALLY ADAPTED FOR ADMINISTRATIVE, COMMERCIAL, FINANCIAL, MANAGERIAL OR SUPERVISORY PURPOSES; SYSTEMS OR METHODS SPECIALLY ADAPTED FOR ADMINISTRATIVE, COMMERCIAL, FINANCIAL, MANAGERIAL OR SUPERVISORY PURPOSES, NOT OTHERWISE PROVIDED FOR
- G06Q10/00—Administration; Management
- G06Q10/08—Logistics, e.g. warehousing, loading or distribution; Inventory or stock management
-
- G—PHYSICS
- G06—COMPUTING OR CALCULATING; COUNTING
- G06Q—INFORMATION AND COMMUNICATION TECHNOLOGY [ICT] SPECIALLY ADAPTED FOR ADMINISTRATIVE, COMMERCIAL, FINANCIAL, MANAGERIAL OR SUPERVISORY PURPOSES; SYSTEMS OR METHODS SPECIALLY ADAPTED FOR ADMINISTRATIVE, COMMERCIAL, FINANCIAL, MANAGERIAL OR SUPERVISORY PURPOSES, NOT OTHERWISE PROVIDED FOR
- G06Q50/00—Information and communication technology [ICT] specially adapted for implementation of business processes of specific business sectors, e.g. utilities or tourism
- G06Q50/06—Energy or water supply
Definitions
- the present invention relates to detection of discrepancies in resource flows between entities.
- the entities may be individuals, natural or legal persons, companies and other separately defined entities which exchange a resource.
- the resource in question may be physical, natural or man-made, such as a utility, for example in the form of water, gas or electricity, or such as humanitarian aids, for example in the form of boxes of clothing or bags of rice for disaster relief.
- the resource also may be financial.
- a system, computer program and method is provided for graph-based fraud detection of discrepancies in a supply chain. These discrepancies can indicate leaks (in a case where the resource is a fluid, such as oil or gas), connection issues (for example where the resource is electricity) or fraud (when the resource is financial but equally in the other cases).
- Fraud detection is gaining momentum recently due to austerity measures exercised in both developed and developing countries in response to hefty debts, leading to increasing pressure on public budgets and new and more sophisticated fraudulent tactics that jeopardise existing approaches.
- Fraud detection is conventionally performed by subject experts with extensive domain knowledge. Subject experts normally screen the data manually and proceed with inference in the form of "if-then" rules. For instance, in case of social benefit, when two applicants are found to share the same mobile phone numbers, they are considered largely similar and this can indicate a high risk fraud case.
- Manual data processing and screening though provide high accuracy in a majority of cases, is time consuming and presents high risk of human errors as well as inter-/intra-individual variants. Automated solutions are therefore desirable.
- the cost of fraud to the UK economy is believed to be more than 10 billion pounds per annum.
- the cost to the entire world economy can be somewhere between 3% and 6% of global GDP.
- There are different types of fraud which, though sharing some common fundamentals, target different types of victims and can demonstrate different characteristics. However, a majority of fraud cases can be detected through discovering certain patterns.
- a computer-implemented method for detecting a discrepancy arising from a mismatch between incoming and outgoing flows of resource between a target entity and entities with which the target entity exchanges resources comprising:
- Invention embodiments provide a method, a computer program and a computing apparatus (or system) which can use graph algorithms and graph-based heuristics to detect discrepancies in resource flow between entities. These discrepancies can be applied in fraud detection within a supply chain and discrepancies detection in finance reporting systems, e.g. revenue reporting.
- This graph-based approach may also benefit from a parallel computation model to significantly increase the performance by initiating light computation (perhaps simultaneously) from multiple target graph vertices.
- Difference in utility/data/money/traffic flow can be detected while influence of discrepancies which may represent fraudulent behaviour or connection issues/leaks can additionally be propagated to present a complete picture of trading network anomalies.
- the way used to select target vertices may be any that is suitable.
- it is expressed as a numerical exposure (a numerical value based on one or more characteristics of a vertex which indicate a higher tendency to exhibit discrepancies, without calculation of any discrepancies) and preferably indicates a target vertex if the numerical exposure is beyond a threshold.
- the numerical exposure may be above the threshold if it represents a more suspicious characteristic (a higher tendency to exhibit discrepancies, based on the vertex characteristics, without calculation of any discrepancies).
- the numerical exposure (selection) is based on connectivity of the vertex, preferably on the level of neighbour vertices which are leaf vertices, or on the level of triangles including the vertex in the network graph.
- the numerical exposure is based on a level of ingoing and/or outgoing resource flow in comparison to the number of neighbour vertices.
- the numerical exposure (selection) is determined in dependence upon the ratio of the number of triangles including the vertex's neighbours to the total number of the vertex's neighbours.
- the numerical exposure (selection) is determined in dependence upon the ratio of the vertex's neighbours that are leaf vertices in the network graph to the total number of the vertex's neighbours.
- the numerical exposure is determined in dependence upon the ratio of the sum of the incoming values and/or outgoing values to the total number of the vertex's neighbours.
- any combination of these examples may be used to determine the specific exposure (make the selection of the target vertices), to give an overall measure based on several factors.
- the resource-flow discrepancy and thus a local risk (of a leak, fraud etc) for each target vertex is calculated as explained above. It is possible to propagate these local risks to try to identify entities which are acting fraudulently by "misdeclaring" resource flow. This misdeclaration may be detectable from anomalies in the direct and/or indirect neighbours in the network graph.
- Propagation of the local risk may take place as follows: firstly by normalising a local risk for each target vertex based on the incoming and outgoing flows of resource; by iteratively updating the local risk for each vertex using the local risk values of the neighbouring vertices to provide a propagated risk value for each target vertex; and by stopping the iterative updates when the network graph converges on a predetermined convergence threshold and/or when the number of iterations exceeds a predetermined iteration threshold; wherein the propagated risk value is used as detection of a discrepancy.
- Propagation may use the well-known PageRank or Weighted PageRank algorithm.
- the propagated risk value may be used instead of, or as well as the local risk value to detect a discrepancy.
- a local risk for each target entity is presented to the user (for example on a representation of the graph, or as a simple value next to an entity name) and then iteratively updated to give a propagated risk and presented to the user during the iterations and at a final value.
- the method may further comprise weighting the edges between each target vertex and the vertex's neighbours, and using the weighting in the propagation.
- edges need not bear weights.
- weights are added in a directed graph/network, one can determine how the risk can be propagated through the graph and whether the influence of A on B is the same as the reciprocal one (from B to A), assuming A and B are connected and the connection is bidirectional. Weights are not presented in the original PageRank algorithm which can be used for propagation but were added in improved versions.
- Each new entity may be identical or similar to an entity already in the graph, for example having a different name, but essentially referring to the same identity. This is referred to as an overlapping entity or vertex.
- the method may include adding new entities to the network graph as new vertices, wherein if none of the new vertices overlaps with an original vertex, an independent network graph to represent relationships between the new vertices.
- the method may further comprise:
- the method may be implemented on one or more servers or other computers in any preferred manner.
- the method further comprises obtaining an adjacency matrix of the network graph on one or more servers when the network graph is generated and compressing the adjacency matrix to provide a compressed sparse row vector; storing the compressed sparse row vector as an adjacency matrix on the one or more servers; and the one or more servers accessing the compressed sparse row vector in order to select target entities and calculate discrepancies.
- a program which when executed on a computer carries out a method for detecting a discrepancy arising from a mismatch between incoming and outgoing flows of resource between a target entity and entities with which the target entity exchanges resources, the method comprising:
- a computer apparatus to detect a discrepancy arising from a mismatch between incoming and outgoing flows of resource between a target entity and entities with which the target entity exchanges resources, the computer apparatus comprising:
- An apparatus or computer program according to preferred embodiments of the present invention can comprise any combination of the method aspects.
- Methods or computer programs according to further embodiments can be described as computer-implemented in that they require processing and memory capability.
- the apparatus is described as configured or arranged to, or simply "to" carry out certain functions.
- This configuration or arrangement could be by use of hardware or middleware or any other suitable system.
- the configuration or arrangement is by software.
- the computer may comprise the elements listed as being configured or arranged to provide the functions defined.
- this computer may include memory, processing, and a network interface.
- the invention can be implemented in digital electronic circuitry, or in computer hardware, firmware, software, or in combinations of them.
- the invention can be implemented as a computer program or computer program product, i.e., a computer program tangibly embodied in a non-transitory information carrier, e.g., in a machine-readable storage device, or in a propagated signal, for execution by, or to control the operation of, one or more hardware modules.
- a computer program can be in the form of a stand-alone program, a computer program portion or more than one computer program and can be written in any form of programming language, including compiled or interpreted languages, and it can be deployed in any form, including as a stand-alone program or as a module, component, subroutine, or other unit suitable for use in a data processing environment.
- a computer program can be deployed to be executed on one module or on multiple modules at one site or distributed across multiple sites and interconnected by a communication network.
- Method steps of the invention can be performed by one or more programmable processors executing a computer program to perform functions of the invention by operating on input data and generating output.
- Apparatus of the invention can be implemented as programmed hardware or as special purpose logic circuitry, including e.g., an FPGA (field programmable gate array) or an ASIC (application-specific integrated circuit).
- processors suitable for the execution of a computer program include, by way of example, both general and special purpose microprocessors, and any one or more processors of any kind of digital computer.
- a processor will receive instructions and data from a read-only memory or a random access memory or both.
- the essential elements of a computer are a processor for executing instructions coupled to one or more memory devices for storing instructions and data.
- test script versions can be edited and invoked as a unit without using object-oriented programming technology; for example, the elements of a script object can be organized in a structured database or a file system, and the operations described as being performed by the script object can be performed by a test control program.
- separately defined means may be implemented using the same memory and/or processor as appropriate.
- Tax authorities should have complete data from all registered businesses in a country. Such tax data filing is required in nearly all countries. For example, in the case of the Spanish tax agency all companies are required to file their transactions with other entities within and outside Spain. In this document, we assume such data are available and are accessible.
- the units may be KW, kilowatt, of power consumption claimed by individuals who pay for the electricity and measurement can be at different layers of substations and regional distributors.
- Invention embodiments can provide a fast approach to detecting unbalanced consumption and provision.
- embodiments can be used to detect meter tampering in many utility cases.
- the system runs in two modes, off-line analysis and online analysis.
- the former updates a database with inferred knowledge and serves the later with such off-line inferences.
- Human intervention is introduced either when off-line analysis raises some warnings or he/she prompts the system to investigate a particular entity.
- the system can use a data intensive, data-driven application which can be accommodated, for example, with a plethora of networked commodity computers.
- a client-server structure can be applied, with the user working on the client side. This is a suitable arrangement purely because of the sheer quantity of data.
- Multiple servers can be geographically collocated or distributed across multiple data centres.
- FIG. 1 is a flow diagram illustrating a method of detecting a discrepancy in flows of resource between entities according to an embodiment.
- step S10 data is received relating to incoming and outgoing flows of resource for each entity. These are resource values, which may have units, for example of megawatts or pounds sterling or million Euros.
- the data can be received directly or indirectly from the individual entities, from a central authority, such as a utility company or tax authority, or from a mixture of sources.
- the received data is used to generate a network graph, in which each entity is represented as a vertex, and each relationship between two entities is an edge between the two vertices representing those entities.
- the incoming and outgoing values take the form of attribute pairs at the vertices.
- vertex A will be labelled with incoming and outgoing values associated with entity B
- vertex B will be labelled with incoming and outgoing values associated with entity A.
- these values are likely to tally, so that if A has the values 15 incoming and 20 outgoing associated with B, then B will have the values 15 outgoing and 20 incoming associated with A.
- target vertices are selected in step S30, by using a characteristic of the vertices.
- the characteristic may represent an exposure in the sense that a high exposure vertex has a higher tendency to exhibit discrepancies than other vertices in the graph, perhaps by dint of higher connectivity, high value resource flow or other feature that indicates an increased risk.
- the characteristic does not rely on detection of discrepancies themselves (which has not yet taken place), but on observations as to what kind of vertex is mostly likely to have a discrepancy. This is a time- and processing power efficient way of cutting down the size of the task whilst keeping the more suspicious entities in consideration.
- an outwards difference and/or an inwards difference is calculated in steps S40A and S40B.
- An outwards difference is calculated in S40A as the difference between the sum of the outgoing values (for all the relationships) at the target vertex and the sum of the incoming resources from the target vertex taken from the neighbouring vertices (direct neighbours only, which are one hop from the target vertex). Normally the difference should be zero (the data at A matches the data from all the neighbours), and if the difference is not zero, then a discrepancy is detected.
- An inwards difference is calculated in S40B as the difference between the sum of the incoming values (for all the relationships) at the target vertex and the sum of the outgoing resources from the target vertex taken from the neighbouring vertices (direct neighbours only, which are one hop from the target vertex). Again, the difference should be zero (the data at A matches the data from all the neighbours), and if the difference is not zero, then a discrepancy is detected.
- the discrepancy can be detected using the inwards difference or using the outwards difference, but in many circumstances both will be calculated to give a fuller check.
- the method can provide a warning, in the form of an alarm (whether audible or displayed or be automatic email, for example).
- a warning in the form of an alarm (whether audible or displayed or be automatic email, for example).
- the alarm could be of an issue in the flows between the entities, or of deliberate misreporting (fraud), or it could be non-specific. Alternatively, any non-zero discrepancies may simply be displayed to the user.
- the method may then consider all the other vertices, or further selected vertices. For a really large network graph, it may be impractical to consider all vertices. Alternatively, even for a large graph, the method may continue to calculate discrepancies for (non-target) vertices at times when processing power requirements are otherwise low, and generate a warning or display if such discrepancies are detected.
- FIG. 2 is a block diagram of a computing device, such as a data storage server, which embodies the present invention, and which may be used to implement a method of detecting discrepancies in resource flow between entities.
- the computing device comprises a processor 993, and memory, 994.
- the computing device also includes a network interface 997 for communication with other computing devices, for example with other computing devices of invention embodiments.
- the computing device cooperates with other computing devices to generate and store the network graph, select target vertices and calculate discrepancies/propagate risks in a distributed manner.
- an embodiment may be composed of a network of such computing devices.
- the computing device also includes one or more input mechanisms such as keyboard and mouse 996, and a display unit such as one or more monitors 995.
- the components are connectable to one another via a bus 992.
- the memory 994 may include a computer readable medium, which term may refer to a single medium or multiple media (e.g., a centralized or distributed database and/or associated caches and servers) configured to carry computer-executable instructions or have data structures stored thereon.
- Computer-executable instructions may include, for example, instructions and data accessible by and causing a general purpose computer, special purpose computer, or special purpose processing device (e.g., one or more processors) to perform one or more functions or operations.
- the term "computer-readable storage medium” may also include any medium that is capable of storing, encoding or carrying a set of instructions for execution by the machine and that cause the machine to perform any one or more of the methods of the present disclosure.
- computer-readable storage medium may accordingly be taken to include, but not be limited to, solid-state memories, optical media and magnetic media.
- computer-readable media may include non-transitory computer-readable storage media, including Random Access Memory (RAM), Read-Only Memory (ROM), Electrically Erasable Programmable Read-Only Memory (EEPROM), Compact Disc Read-Only Memory (CD-ROM) or other optical disk storage, magnetic disk storage or other magnetic storage devices, flash memory devices (e.g., solid state memory devices).
- RAM Random Access Memory
- ROM Read-Only Memory
- EEPROM Electrically Erasable Programmable Read-Only Memory
- CD-ROM Compact Disc Read-Only Memory
- flash memory devices e.g., solid state memory devices
- the processor 993 is configured to control the computing device and execute processing operations, for example executing code stored in the memory to implement the various different functions described here and in the claims.
- the memory 994 stores data being read and written by the processor 993.
- a processor may include one or more general-purpose processing devices such as a microprocessor, central processing unit, or the like.
- the processor may include a complex instruction set computing (CISC) microprocessor, reduced instruction set computing (RISC) microprocessor, very long instruction word (VLIW) microprocessor, or a processor implementing other instruction sets or processors implementing a combination of instruction sets.
- CISC complex instruction set computing
- RISC reduced instruction set computing
- VLIW very long instruction word
- the processor may also include one or more special-purpose processing devices such as an application specific integrated circuit (ASIC), a field programmable gate array (FPGA), a digital signal processor (DSP), network processor, or the like.
- ASIC application specific integrated circuit
- FPGA field programmable gate array
- DSP digital signal processor
- a processor is configured to execute instructions for performing the operations and steps discussed herein. That is the processor can execute instructions to receive resource flows, generate part or all of a network graph, select target entities and calculate inwards and/or outwards difference.
- the display unit 997 may display a representation of data stored by the computing device, such as the network graph, resource flows or a list of entity names with associated discrepancy/risk values (when calculated) at the vertices. It may also display a cursor and dialog boxes and screens enabling interaction between a user and the programs and data stored on the computing device.
- the input mechanisms 996 may enable a user to input data and instructions to the computing device. For example, the user may select vertex characteristics which are used to identify target vertices.
- the network interface (network I/F) 997 may be connected to a network, such as the Internet, and is connectable to other such computing devices via the network.
- the network I/F 997 may control data input/output from/to other apparatus via the network.
- Other peripheral devices such as microphone, speakers, printer, power supply unit, fan, case, scanner, trackerball etc may be included in the computing device.
- the processor 993 (or plurality thereof) executes processing instructions (a program) stored on a memory 994 and exchanges data via a network I/F 997.
- the processor 993 executes processing instructions to receive, via the network I/F, incoming and outgoing resource values of the entities to be included in part or all of the network graph, along with identification of the entities.
- the processor 993 may execute processing instructions to generate part or all of the network graph as described herein, to select target entities and to calculate inwards and outwards differences for the target entities of part or all of the network graph, to detect discrepancies. It may store part or all of the network graph and related data as an adjacency matrix, potentially as a compressed sparse row vector, on a connected storage unit and/or transmit the graph/data, via the network I/F 997, to other devices.
- Methods embodying the present invention may be carried out on a computing device such as that illustrated in Figure 2 .
- a computing device need not have every component illustrated in Figure 2 , and may be composed of a subset of those components.
- a method embodying the present invention may be carried out by a single computing device in communication with one or more data storage servers via a network.
- the computing device may be a data storage itself storing the network graph annotated with incoming and outgoing resource flows, and discrepancies and propagated risks when calculated.
- a method embodying the present invention may be carried out by a plurality of computing devices operating in cooperation with one another.
- One or more of the plurality of computing devices may be a data storage server storing at least a portion of network graph.
- the entire network graph may be composed of multiple subgraphs.
- each server can process the network in parallel on the fragment of graph allocated to it.
- the computation is effectively vertex local processing (also known as vertex programming).
- vertex programming also known as vertex programming
- all vertices can start processing in parallel. Otherwise, the vertices can only be processed sequentially. In this case, the system needs to decide which vertices should be processed first as target vertices. Other vertices can be given lower processing priority and be processed afterwards (or not at all).
- Fraudulent behaviours can be buried in normal trading behaviours.
- Table 1 below illustrates resource values between entities A and B in the form of financial data reported to a tax authority.
- Table 1 Agents Reported Imputed Reporting Imputing Revenue (Income) Payment (Cost) Revenue (Income Payment (Cost) A B 12 15 20 15 B A 15 20 15 12
- A reports a payment to B of 15K Euro for goods or services and revenue of 12k Euro due to the transaction with B. This revenue is not net revenue, but just gives the cash flow.
- B is considered the imputing party and its figures are borrowed from the second row where it reported when dealing with A a payment of 20K Euro and revenue 15k Euro. This already highlights a mismatch in the figures and suggests that at least one of the firms is misreporting.
- the graph including vertices for A and B and some others may be as shown in figure 3 .
- the income and cost numbers are defined as attributes at vertices. For fast retrieval, this are defined as key-value pairs where keys are neighbouring vertices and values are pair of income and cost figures.
- A-B-C and A-D-E are neighbourhood triangles, suggesting that A should be investigated earlier than others as a target vertex.
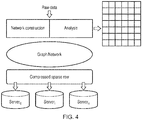
- raw data is used for network construction in a network construction module which generates the network graph and also for later analysis in an analysis module which detects discrepancies, providing the matrix format shown to the right of the figure.
- These modules may be provided by servers 0...i...n.. or in (a) processor(s) elsewhere.
- the graph/network is converted to a compressed sparse row or CSR format and stored on servers 0...i...n.. according to any convenient distribution mechanism.
- a supply network is constructed which also captures the flow (of money in this example) among different entities involved.
- a space efficient data structure is selected to facilitate distributed data storage while not much sacrificing the computational efficiency.
- the analysis module applies graph based algorithms to emerge and extract suspicious patterns out of the "structured" data.
- the set of supplier/consumer links effectively forms a network of trading relationships.
- Graph-based algorithms can then be applied to screen out trading connections by checking for discrepancies.
- graph based methods can also be applied as explained herein.
- the supply chain network is constructed as an attributed, undirected graph.
- ⁇ is a function: ⁇ : V ⁇ A that maps a vertex to a set of attributes. Attributes can be used to record properties at the vertices. For instance, it can be used to indicate how much influence a vertex receives from a neighbouring vertex and/or impose upon a neighbouring vertex.
- the attributes represent incoming and outgoing resource flows.
- the advantage of putting edge-oriented value at the end vertices is that the graph can be simplified to an undirected one which can be less expensive than directed graphs for some algorithms.
- the supply chain network can be constructed as follows:
- the attribute values may also be adjusted according to a given time window.
- the attributes can be indexed with edges as ⁇ v i , v j ⁇ : f ( t ) and ⁇ v j , v i ⁇ : g ( t ) as functions over time.
- the value can reflect a cumulative resource flow or discrepancy value over the past. It can also be an adjusted discrepancy value for a given time period. For instance, one can investigate the connection between two entities over a particular fiscal year or within the timeframe of another investigation.
- a trie (digital tree or prefix tree) based index can be used to fragment data series data and fast retrieve data based on the range of time segments.
- Some domain specific restriction may be applied when constructing the graph/network. For instance, when constructing a snap-shot graph/network for the supply chain, only closed deals/purchasing can used to avoid accidental discrepancies due to transactions that have not yet gone through. The assumption is that tax applies only to those closed deals.
- the typical storage data structure of a graph/network is an adjacency matrix.
- the resultant network can be sparse and thus cause significant redundancy and inefficiency on disk utilisation.
- the compressed sparse row (CSR) approach is adapted to reduce disk usage.
- the CSR vector is evenly distributed to multiple servers.
- the column-indices array is broken based on row-offsets to ensure one adjacency list is not stored on different machines. This is to reduce network communication overhead during level-synchronised breadth first search.
- the key purpose is to discover discrepancies among cumulative incoming and outgoing edges. It is expected that for connected components of a graph, the overall inwards and outwards influence factors should be balanced. Imbalanced components may signify a highly risky case.
- the cumulative values are computed straightforwardly as follows: let 0 t denote the total value of outwards influence value (e.g. the total sales or provision reported by a company), 0 ⁇ i , j ⁇ the outwards value along edge ⁇ i , j ⁇ , and I t and I ⁇ i , j ⁇ represent the inwards values accordingly.
- V CSR For each vertex, its CSR vector is retrieved as V CSR , for each v i ⁇ V CSR , ⁇ ( v i ) ⁇ s j obtain the vertex's server. Each server holds a complete adjacency list and will broadcast to all the servers holding the corresponding neighbouring vertices. Upon receiving the message, s j sends the corresponding values back and updates the status of v i held locally at the server.
- Calculating ⁇ out or ⁇ in for all the vertices may be inefficient for large network.
- the following heuristics can be applied to select the initial groups of highly suspicious vertices.
- the assumption is that characteristics of a vertex's neighbours should follow a power law that can be learnt from the entire network. Any of or any combination of the following characteristics can be used to detect high risk vertices.
- the aggregated/propagated risk value at each vertex reflects the significance of fraudulent behaviours imposing on the local vertex.
- an initial risk value is assigned at each vertex as the normalised (cash) flow discrepancies.
- This value can be normalised as ⁇ ⁇ ⁇ ⁇ 2 to avoid negative values.
- This initial risk value is then considered as the initial state of a vertex.
- All edges are associated with edge weights, w.
- Edge weights are introduced to generalise the original PageRank algorithm.
- the edge weights can be assigned by users to a particular type of cash flow (e.g. cash flow during a particular time window, or cash flow between two types of entities, where entity type can be defined by users and recorded as vertex attributes).
- the system then iteratively updates all neighbours of a vertex using the initial states and the edge weights.
- ⁇ is a predefined threshold and ⁇ is the difference between a current value and a value of a previous iteration, or until the number of iterations i reaches a predefined limit, i.e. i ⁇ n .
- i is a predefined threshold
- ⁇ is the difference between a current value and a value of a previous iteration, or until the number of iterations i reaches a predefined limit, i.e. i ⁇ n .
- Outputs are the updated vertex risk values when the flooding/iteration terminates. This can be a list of key-value pairs where key is the vertex id and value is the refined risk value.
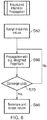
- Figure 6 is a flow chart illustrating propagation of discrepancy values.
- initial risk values are based on discrepancies.
- the risks are propagated using, for example, Weighted PageRank.
- step S70 there is a check whether the step change in each iteration is below or at a convergence threshold. If not, the propagation continues. If the step change is at or below the threshold, the process has finished and in step S80, there is termination and output of the final values.
- a known propagated risk value acquired when the propagation converges, can then be used to combine with other graph-based rules to identify high risk entities when new data are added and more analysis is necessary, as explained in more detail below.
- the network graph has been constructed from the scratch. This section treats new insertions to the graph when for example new businesses register with the tax office. This can be triggered by user input.
- Vertices in the newly added subgraph to an existing network can be either overlapping with existing vertices (thus representing the same or a closely related entity) or else non-overlapping.
- the overlapping vertex needs to be reconciled with existing network.
- the non-overlapping vertices can be processed (e.g. the discrepancy calculation).
- Boundary vertices between the two sets of data may be reconciled overlapping vertices.
- the system When the non-overlapping vertices are processed, the system considers and records whether such process affects (changes the values of) the overlapping/boundary vertices. In order to improve performance, only those are changed/affected will be re-processed after the newly added parts are merged.
- Update to the network with a new sub-network or updated sub-network will be performed in two different situations. If the sub-network can be aligned with existing entities, a full network re-processing may need to be performed
- processing can be restricted to the newly-changed sub network, which is effectively an independent graph.
- the re-processing can be performed in two stages:
- the process can have two steps in general, which are: online processing where alignment and those values/entities directly affected are reprocessed; and offline processing where the changed values are to be widely propagated to other potentially affected entities/parts.
- the alignment and local update is carried out up to the boundary entities.
- the second step if there are entities whose status has been updated in the first step, such changes will have to be reflected in other parts of the graph/network. In this case, a full network reprocessing needs to be carried out. Such reprocessing is likely to be performed when system resource permits.
- FIG. 7 is a flow chart illustrating addition of one or more new entities to a network graph. Firstly in step S90, the new entities are matched against an existing network. Then if existing entities (overlaps) or relationships with existing entities are found in step S100, then there is a graph alignment step S110 to identify matching entities
- Figure 8 shows an example of reconciliation between an old network (of which only a few vertices are shown) and a new network (also only partially shown).
- the four vertices on the right are newly added ones, while those on the left are existing ones.
- the outer ellipse indicates overlapping vertices and the inner ellipses outlines reconciliation mappings between the same entity in the old network and the new network.
Landscapes
- Business, Economics & Management (AREA)
- Engineering & Computer Science (AREA)
- Economics (AREA)
- Tourism & Hospitality (AREA)
- General Business, Economics & Management (AREA)
- Human Resources & Organizations (AREA)
- Marketing (AREA)
- Health & Medical Sciences (AREA)
- Theoretical Computer Science (AREA)
- Strategic Management (AREA)
- General Physics & Mathematics (AREA)
- Physics & Mathematics (AREA)
- Quality & Reliability (AREA)
- Development Economics (AREA)
- Entrepreneurship & Innovation (AREA)
- Operations Research (AREA)
- Public Health (AREA)
- Water Supply & Treatment (AREA)
- General Health & Medical Sciences (AREA)
- Primary Health Care (AREA)
- Debugging And Monitoring (AREA)
- Management, Administration, Business Operations System, And Electronic Commerce (AREA)
Priority Applications (1)
| Application Number | Priority Date | Filing Date | Title |
|---|---|---|---|
| JP2017107180A JP2018018512A (ja) | 2016-07-25 | 2017-05-30 | リソースのインカミングフローとアウトゴーイングフローとのミスマッチに起因する不一致を検出する方法、コンピュータプログラムおよびシステム |
Applications Claiming Priority (1)
| Application Number | Priority Date | Filing Date | Title |
|---|---|---|---|
| DE102016213614 | 2016-07-25 |
Publications (1)
| Publication Number | Publication Date |
|---|---|
| EP3276551A1 true EP3276551A1 (de) | 2018-01-31 |
Family
ID=58464212
Family Applications (1)
| Application Number | Title | Priority Date | Filing Date |
|---|---|---|---|
| EP17163169.0A Withdrawn EP3276551A1 (de) | 2016-07-25 | 2017-03-27 | Verfahren, computerprogramm und system zur erkennung eines diskrepanz aus einem ungleichgewicht zwischen eingehenden und ausgehenden strömen von ressourcen |
Country Status (2)
| Country | Link |
|---|---|
| EP (1) | EP3276551A1 (de) |
| JP (1) | JP2018018512A (de) |
Cited By (4)
| Publication number | Priority date | Publication date | Assignee | Title |
|---|---|---|---|---|
| CN109472538A (zh) * | 2018-09-12 | 2019-03-15 | 盈奇科技(深圳)有限公司 | 一种重力感应智能出库系统 |
| CN111832910A (zh) * | 2020-06-24 | 2020-10-27 | 陕西法士特齿轮有限责任公司 | 一种多指标异响判定阈值确定方法、系统和计算机设备 |
| CN113704495A (zh) * | 2021-08-30 | 2021-11-26 | 合肥智能语音创新发展有限公司 | 实体对齐方法、装置、电子设备和存储介质 |
| CN120807152A (zh) * | 2025-07-28 | 2025-10-17 | 北京骊海新能源科技有限公司 | 一种基于大数据分析的电力交易安全风险管理方法 |
Families Citing this family (1)
| Publication number | Priority date | Publication date | Assignee | Title |
|---|---|---|---|---|
| EP4235450A1 (de) * | 2022-02-23 | 2023-08-30 | Celonis SE | Verfahren zum speichern und rekonstruieren eines graphen |
Citations (5)
| Publication number | Priority date | Publication date | Assignee | Title |
|---|---|---|---|---|
| US20050246112A1 (en) * | 2004-04-29 | 2005-11-03 | Abhulimen Kingsley E | Realtime computer assisted leak detection/location reporting and inventory loss monitoring system of pipeline network systems |
| US7920983B1 (en) * | 2010-03-04 | 2011-04-05 | TaKaDu Ltd. | System and method for monitoring resources in a water utility network |
| US20130211797A1 (en) * | 2012-02-13 | 2013-08-15 | TaKaDu Ltd. | System and method for analyzing gis data to improve operation and monitoring of water distribution networks |
| JP2014054151A (ja) * | 2012-09-10 | 2014-03-20 | Toshiba Corp | 輸送ネットワークのグラフ構造構築装置、グラフ構造構築システム、グラフ構造構築方法及びグラフ構造構築プログラム |
| US20150339412A1 (en) * | 2014-05-20 | 2015-11-26 | International Business Machines Corporation | Partitioning of a Network Using Multiple Poles for Each Part Thereof |
-
2017
- 2017-03-27 EP EP17163169.0A patent/EP3276551A1/de not_active Withdrawn
- 2017-05-30 JP JP2017107180A patent/JP2018018512A/ja active Pending
Patent Citations (5)
| Publication number | Priority date | Publication date | Assignee | Title |
|---|---|---|---|---|
| US20050246112A1 (en) * | 2004-04-29 | 2005-11-03 | Abhulimen Kingsley E | Realtime computer assisted leak detection/location reporting and inventory loss monitoring system of pipeline network systems |
| US7920983B1 (en) * | 2010-03-04 | 2011-04-05 | TaKaDu Ltd. | System and method for monitoring resources in a water utility network |
| US20130211797A1 (en) * | 2012-02-13 | 2013-08-15 | TaKaDu Ltd. | System and method for analyzing gis data to improve operation and monitoring of water distribution networks |
| JP2014054151A (ja) * | 2012-09-10 | 2014-03-20 | Toshiba Corp | 輸送ネットワークのグラフ構造構築装置、グラフ構造構築システム、グラフ構造構築方法及びグラフ構造構築プログラム |
| US20150339412A1 (en) * | 2014-05-20 | 2015-11-26 | International Business Machines Corporation | Partitioning of a Network Using Multiple Poles for Each Part Thereof |
Cited By (6)
| Publication number | Priority date | Publication date | Assignee | Title |
|---|---|---|---|---|
| CN109472538A (zh) * | 2018-09-12 | 2019-03-15 | 盈奇科技(深圳)有限公司 | 一种重力感应智能出库系统 |
| CN111832910A (zh) * | 2020-06-24 | 2020-10-27 | 陕西法士特齿轮有限责任公司 | 一种多指标异响判定阈值确定方法、系统和计算机设备 |
| CN111832910B (zh) * | 2020-06-24 | 2024-03-12 | 陕西法士特齿轮有限责任公司 | 一种多指标异响判定阈值确定方法、系统和计算机设备 |
| CN113704495A (zh) * | 2021-08-30 | 2021-11-26 | 合肥智能语音创新发展有限公司 | 实体对齐方法、装置、电子设备和存储介质 |
| CN113704495B (zh) * | 2021-08-30 | 2024-05-28 | 合肥智能语音创新发展有限公司 | 实体对齐方法、装置、电子设备和存储介质 |
| CN120807152A (zh) * | 2025-07-28 | 2025-10-17 | 北京骊海新能源科技有限公司 | 一种基于大数据分析的电力交易安全风险管理方法 |
Also Published As
| Publication number | Publication date |
|---|---|
| JP2018018512A (ja) | 2018-02-01 |
Similar Documents
| Publication | Publication Date | Title |
|---|---|---|
| Vanini et al. | Online payment fraud: from anomaly detection to risk management | |
| Amini et al. | Resilience to contagion in financial networks | |
| US10445496B2 (en) | Product risk profile | |
| Cerchiello et al. | Twitter data models for bank risk contagion | |
| CN111833182B (zh) | 识别风险对象的方法和装置 | |
| EP3276551A1 (de) | Verfahren, computerprogramm und system zur erkennung eines diskrepanz aus einem ungleichgewicht zwischen eingehenden und ausgehenden strömen von ressourcen | |
| Yarovenko | Evaluating the threat to national information security | |
| CN111915316A (zh) | 一种可疑交易的监控方法、装置、计算机设备和存储介质 | |
| CN116012152A (zh) | 异常交易实体的识别方法、装置、设备及可读存储介质 | |
| Zhang et al. | Fairness of ratemaking for catastrophe insurance: Lessons from machine learning | |
| Ho et al. | A network analysis of the cryptocurrency market | |
| CN112287039A (zh) | 一种团伙识别方法及相关装置 | |
| Mou et al. | Microlending on mobile social credit platforms: an exploratory study using Philippine loan contracts: J. Mou et al. | |
| El Ayeb et al. | Community detection for mobile money fraud detection | |
| CN110851482A (zh) | 为多个数据方提供数据模型的方法及装置 | |
| CN116450847B (zh) | 企业信用评估方法、装置、电子设备及可读存储介质 | |
| Nithya et al. | Leveraging Bayesian Networks for Enhanced Transparency in Financial Data Provenance Tracking | |
| CN117522403A (zh) | 一种基于子图融合的gcn异常客户预警方法及装置 | |
| CN115577955A (zh) | 企业风险识别方法、装置、计算机设备和存储介质 | |
| Izmailova et al. | Assessing the Variety of Expected Losses upon the Materialisation of Threats to Banking Information Systems | |
| CN113870009A (zh) | 基于图数据库的反洗钱管控方法、装置、系统及存储介质 | |
| Reisch et al. | Inferring supply networks from mobile phone data to estimate the resilience of a national economy | |
| Zhao et al. | Network-based feature extraction method for fraud detection via label propagation | |
| CN112598496A (zh) | 风控黑名单设置方法、装置、终端设备及可读存储介质 | |
| Ho et al. | A short-term cryptocurrency price movement prediction using centrality measures |
Legal Events
| Date | Code | Title | Description |
|---|---|---|---|
| PUAI | Public reference made under article 153(3) epc to a published international application that has entered the european phase |
Free format text: ORIGINAL CODE: 0009012 |
|
| STAA | Information on the status of an ep patent application or granted ep patent |
Free format text: STATUS: THE APPLICATION HAS BEEN PUBLISHED |
|
| AK | Designated contracting states |
Kind code of ref document: A1 Designated state(s): AL AT BE BG CH CY CZ DE DK EE ES FI FR GB GR HR HU IE IS IT LI LT LU LV MC MK MT NL NO PL PT RO RS SE SI SK SM TR |
|
| AX | Request for extension of the european patent |
Extension state: BA ME |
|
| STAA | Information on the status of an ep patent application or granted ep patent |
Free format text: STATUS: REQUEST FOR EXAMINATION WAS MADE |
|
| STAA | Information on the status of an ep patent application or granted ep patent |
Free format text: STATUS: EXAMINATION IS IN PROGRESS |
|
| 17P | Request for examination filed |
Effective date: 20180405 |
|
| RBV | Designated contracting states (corrected) |
Designated state(s): AL AT BE BG CH CY CZ DE DK EE ES FI FR GB GR HR HU IE IS IT LI LT LU LV MC MK MT NL NO PL PT RO RS SE SI SK SM TR |
|
| 17Q | First examination report despatched |
Effective date: 20180515 |
|
| STAA | Information on the status of an ep patent application or granted ep patent |
Free format text: STATUS: THE APPLICATION IS DEEMED TO BE WITHDRAWN |
|
| 18D | Application deemed to be withdrawn |
Effective date: 20181127 |