EP3290908B1 - Verfahren zur bestimmung einer unbekannten probe - Google Patents
Verfahren zur bestimmung einer unbekannten probe Download PDFInfo
- Publication number
- EP3290908B1 EP3290908B1 EP17189696.2A EP17189696A EP3290908B1 EP 3290908 B1 EP3290908 B1 EP 3290908B1 EP 17189696 A EP17189696 A EP 17189696A EP 3290908 B1 EP3290908 B1 EP 3290908B1
- Authority
- EP
- European Patent Office
- Prior art keywords
- fluorescence
- spectrum
- candidate
- sample
- peak
- Prior art date
- Legal status (The legal status is an assumption and is not a legal conclusion. Google has not performed a legal analysis and makes no representation as to the accuracy of the status listed.)
- Active
Links
Images


Classifications
-
- G—PHYSICS
- G01—MEASURING; TESTING
- G01N—INVESTIGATING OR ANALYSING MATERIALS BY DETERMINING THEIR CHEMICAL OR PHYSICAL PROPERTIES
- G01N21/00—Investigating or analysing materials by the use of optical means, i.e. using sub-millimetre waves, infrared, visible or ultraviolet light
- G01N21/62—Systems in which the material investigated is excited whereby it emits light or causes a change in wavelength of the incident light
- G01N21/63—Systems in which the material investigated is excited whereby it emits light or causes a change in wavelength of the incident light optically excited
- G01N21/64—Fluorescence; Phosphorescence
- G01N21/645—Specially adapted constructive features of fluorimeters
-
- G—PHYSICS
- G01—MEASURING; TESTING
- G01J—MEASUREMENT OF INTENSITY, VELOCITY, SPECTRAL CONTENT, POLARISATION, PHASE OR PULSE CHARACTERISTICS OF INFRARED, VISIBLE OR ULTRAVIOLET LIGHT; COLORIMETRY; RADIATION PYROMETRY
- G01J1/00—Photometry, e.g. photographic exposure meter
- G01J1/02—Details
- G01J1/0219—Electrical interface; User interface
-
- G—PHYSICS
- G01—MEASURING; TESTING
- G01J—MEASUREMENT OF INTENSITY, VELOCITY, SPECTRAL CONTENT, POLARISATION, PHASE OR PULSE CHARACTERISTICS OF INFRARED, VISIBLE OR ULTRAVIOLET LIGHT; COLORIMETRY; RADIATION PYROMETRY
- G01J3/00—Spectrometry; Spectrophotometry; Monochromators; Measuring colours
-
- G—PHYSICS
- G01—MEASURING; TESTING
- G01J—MEASUREMENT OF INTENSITY, VELOCITY, SPECTRAL CONTENT, POLARISATION, PHASE OR PULSE CHARACTERISTICS OF INFRARED, VISIBLE OR ULTRAVIOLET LIGHT; COLORIMETRY; RADIATION PYROMETRY
- G01J3/00—Spectrometry; Spectrophotometry; Monochromators; Measuring colours
- G01J3/02—Details
- G01J3/0264—Electrical interface; User interface
-
- G—PHYSICS
- G01—MEASURING; TESTING
- G01J—MEASUREMENT OF INTENSITY, VELOCITY, SPECTRAL CONTENT, POLARISATION, PHASE OR PULSE CHARACTERISTICS OF INFRARED, VISIBLE OR ULTRAVIOLET LIGHT; COLORIMETRY; RADIATION PYROMETRY
- G01J3/00—Spectrometry; Spectrophotometry; Monochromators; Measuring colours
- G01J3/28—Investigating the spectrum
- G01J3/2823—Imaging spectrometer
-
- G—PHYSICS
- G01—MEASURING; TESTING
- G01J—MEASUREMENT OF INTENSITY, VELOCITY, SPECTRAL CONTENT, POLARISATION, PHASE OR PULSE CHARACTERISTICS OF INFRARED, VISIBLE OR ULTRAVIOLET LIGHT; COLORIMETRY; RADIATION PYROMETRY
- G01J3/00—Spectrometry; Spectrophotometry; Monochromators; Measuring colours
- G01J3/28—Investigating the spectrum
- G01J3/44—Raman spectrometry; Scattering spectrometry ; Fluorescence spectrometry
- G01J3/4406—Fluorescence spectrometry
-
- G—PHYSICS
- G01—MEASURING; TESTING
- G01N—INVESTIGATING OR ANALYSING MATERIALS BY DETERMINING THEIR CHEMICAL OR PHYSICAL PROPERTIES
- G01N21/00—Investigating or analysing materials by the use of optical means, i.e. using sub-millimetre waves, infrared, visible or ultraviolet light
- G01N21/17—Systems in which incident light is modified in accordance with the properties of the material investigated
- G01N21/25—Colour; Spectral properties, i.e. comparison of effect of material on the light at two or more different wavelengths or wavelength bands
- G01N21/27—Colour; Spectral properties, i.e. comparison of effect of material on the light at two or more different wavelengths or wavelength bands using photo-electric detection ; circuits for computing concentration
- G01N21/274—Calibration, base line adjustment, drift correction
-
- G—PHYSICS
- G01—MEASURING; TESTING
- G01N—INVESTIGATING OR ANALYSING MATERIALS BY DETERMINING THEIR CHEMICAL OR PHYSICAL PROPERTIES
- G01N21/00—Investigating or analysing materials by the use of optical means, i.e. using sub-millimetre waves, infrared, visible or ultraviolet light
- G01N21/62—Systems in which the material investigated is excited whereby it emits light or causes a change in wavelength of the incident light
- G01N21/63—Systems in which the material investigated is excited whereby it emits light or causes a change in wavelength of the incident light optically excited
- G01N21/64—Fluorescence; Phosphorescence
-
- G—PHYSICS
- G01—MEASURING; TESTING
- G01J—MEASUREMENT OF INTENSITY, VELOCITY, SPECTRAL CONTENT, POLARISATION, PHASE OR PULSE CHARACTERISTICS OF INFRARED, VISIBLE OR ULTRAVIOLET LIGHT; COLORIMETRY; RADIATION PYROMETRY
- G01J3/00—Spectrometry; Spectrophotometry; Monochromators; Measuring colours
- G01J3/28—Investigating the spectrum
- G01J2003/283—Investigating the spectrum computer-interfaced
- G01J2003/284—Spectral construction
-
- G—PHYSICS
- G01—MEASURING; TESTING
- G01N—INVESTIGATING OR ANALYSING MATERIALS BY DETERMINING THEIR CHEMICAL OR PHYSICAL PROPERTIES
- G01N21/00—Investigating or analysing materials by the use of optical means, i.e. using sub-millimetre waves, infrared, visible or ultraviolet light
- G01N21/62—Systems in which the material investigated is excited whereby it emits light or causes a change in wavelength of the incident light
- G01N21/63—Systems in which the material investigated is excited whereby it emits light or causes a change in wavelength of the incident light optically excited
- G01N21/64—Fluorescence; Phosphorescence
- G01N2021/6417—Spectrofluorimetric devices
- G01N2021/6419—Excitation at two or more wavelengths
-
- G—PHYSICS
- G01—MEASURING; TESTING
- G01N—INVESTIGATING OR ANALYSING MATERIALS BY DETERMINING THEIR CHEMICAL OR PHYSICAL PROPERTIES
- G01N21/00—Investigating or analysing materials by the use of optical means, i.e. using sub-millimetre waves, infrared, visible or ultraviolet light
- G01N21/62—Systems in which the material investigated is excited whereby it emits light or causes a change in wavelength of the incident light
- G01N21/63—Systems in which the material investigated is excited whereby it emits light or causes a change in wavelength of the incident light optically excited
- G01N21/64—Fluorescence; Phosphorescence
- G01N2021/6417—Spectrofluorimetric devices
- G01N2021/6421—Measuring at two or more wavelengths
-
- G—PHYSICS
- G01—MEASURING; TESTING
- G01N—INVESTIGATING OR ANALYSING MATERIALS BY DETERMINING THEIR CHEMICAL OR PHYSICAL PROPERTIES
- G01N21/00—Investigating or analysing materials by the use of optical means, i.e. using sub-millimetre waves, infrared, visible or ultraviolet light
- G01N21/17—Systems in which incident light is modified in accordance with the properties of the material investigated
- G01N21/25—Colour; Spectral properties, i.e. comparison of effect of material on the light at two or more different wavelengths or wavelength bands
- G01N21/27—Colour; Spectral properties, i.e. comparison of effect of material on the light at two or more different wavelengths or wavelength bands using photo-electric detection ; circuits for computing concentration
- G01N21/274—Calibration, base line adjustment, drift correction
- G01N21/276—Calibration, base line adjustment, drift correction with alternation of sample and standard in optical path
-
- G—PHYSICS
- G01—MEASURING; TESTING
- G01N—INVESTIGATING OR ANALYSING MATERIALS BY DETERMINING THEIR CHEMICAL OR PHYSICAL PROPERTIES
- G01N21/00—Investigating or analysing materials by the use of optical means, i.e. using sub-millimetre waves, infrared, visible or ultraviolet light
- G01N21/62—Systems in which the material investigated is excited whereby it emits light or causes a change in wavelength of the incident light
- G01N21/63—Systems in which the material investigated is excited whereby it emits light or causes a change in wavelength of the incident light optically excited
- G01N21/64—Fluorescence; Phosphorescence
- G01N21/6486—Measuring fluorescence of biological material, e.g. DNA, RNA, cells
-
- G—PHYSICS
- G01—MEASURING; TESTING
- G01N—INVESTIGATING OR ANALYSING MATERIALS BY DETERMINING THEIR CHEMICAL OR PHYSICAL PROPERTIES
- G01N2201/00—Features of devices classified in G01N21/00
- G01N2201/12—Circuits of general importance; Signal processing
Definitions
- the present disclosure relates to a method for acquiring a three-dimensional (3D) spectrum of the excitation wavelength, the fluorescence wavelength, and the fluorescence intensity and determining an unknown sample based on the acquired fluorescence characteristic.
- the mainstream of fluorescence measurements is to measure a two-dimensional excitation-fluorescence spectrum in which fluorescence intensity values are plotted with respect to the excitation wavelength or the fluorescence wavelength. And a quantitative analysis is performed using a standard curve with respect to the fluorescence intensity that is obtained at a single pair of an excitation wavelength and a fluorescence wavelength using a standard having a known density.
- Nonpatent document 1 3D fluorescence spectra of plural samples are acquired and converted into a data matrix, which is read into multivariate analysis software.
- a PLS regression formula is determined using, as known teacher data, measurement values of a chemical analysis on free amino acid, free fatty acid, or the like (target variable) and 3D fluorescence spectrum data (explanatory variable) and a target value of an unknown sample is obtained using the determined PLS regression formula.
- the PLS regression analysis is an analyzing method for obtaining a quantitative value of a target substance.
- a peak in a 3D fluorescence spectrum can be identified as long as a fluorescence wavelength of a compound that emits measurement target fluorescence.
- a measurement target such as a food, a chemical material, or an environmental substance in many cases contains plural fluorescent substances, in which case compounds other than a target compound for which a quantitative value is to be obtained emit fluorescence.
- a final target value is obtained by extracting characteristics of plural fluorescent substances at pairs of an excitation wavelength and a fluorescence wavelength. There may occur a case that an unknown fluorescence wavelength contributes to a model, in which case it cannot be determined to what fluorescent substances 3D fluorescence spectrum data of the model are attributed.
- the model is a combination of the wavelengths and the coefficients.
- the analysis accuracy is increased by eliminating noise such as scattered light, second-order light, and third-order light.
- a sample whose fluorescence characteristic is known such as aflatoxin which is referred to in JP-B-5856741
- data in an excitation wavelength range and a fluorescence wavelength range of a 3D fluorescence spectrum that represents the features of aflatoxin contained in a measurement target are mainly extracted.
- Non-Patent Document 2 Gamal Elmasry et al "Non-invasive sensing of freshness indices of frozen fish and fillets using pretreated excitation-emission matrices " discloses fluorescence spectroscopy with a fiber optic probe was utilized to estimate different freshness indices of whole and filleted horse mackerel (Trachurus japonicus) directly in the frozen state. The actual freshness values were assessed using the nucleotide-based method depending on the determination of ATP and its breakdown derivatives with high pressure liquid chromatography (HPLC). Different spectral treatments (i.e.
- WO 2012/074413 A1 discloses a method for determining the botanical origin of honey: (a) estimating the botanical origin of standard honey samples, by: (i) obtaining key chemical concentrations; (ii) assigning the botanical origin as a value on the abundance of chemical compounds characteristic of botanical groups; (b) generating the fluorescence signature of standard honey samples, by: (i) measuring the intensity and wavelength of the fluorescent light emitted from a diluted light-excited honey solution; (ii) combining excitation and emitted light as 2-dimensional excitation-emission matrix (EEM); (c) constructing a predictive mathematical model from standard honey data; (d) generate the fluorescence EEM signature of an unknown honey sample or samples, as outlined in step (b); and (e) using the unknown honey fluorescence EEM data from step (d) with the mathematical model of step (c) to predict and assign value of botanical origin of honey.
- EEM 2-dimensional excitation-emission matrix
- LU F et al "Dissolved organic matter with multi-peak fluorophores in landfill leachate" discusses an experiment in which dissolved organic matter (DOM) sampled from municipal landfill leachate of different ages with/without anoxic or aerobic treatment, was intensively fractionated via size exclusion chromatography (SEC) and hydrophobic resins and was studied with fluorescence excitation and emission matrix (EEM). he spectral characteristics of these fluorophores were discussed using fractional EEM and apparent molecular weight (AMW) data obtained via SEC analysis. This paper revealed that the coupling of SEC and EEM can be useful to track the fluorescent DOM fraction in landfill leachate.
- SEC size exclusion chromatography
- EEM fluorescence excitation and emission matrix
- a sample without such property information can be determined by sequentially identifying fluorescent substances to which respective fluorescence characteristic-indicative fluorescence spectrum peaks are attributed. It is necessary to determine a spectrum range and sub peaks that indicate a fluorescence characteristic based on a peak of attention of a measured 3D fluorescence spectrum and to determine a fluorescent substan ce by comparing an excitation wavelength and a fluorescence w avelength of the peak of attention and the determined spectrum range and sub peaks with a known fluorescent substance library. It is further necessary to set an effective spectrum range and perform a multivariate analysis.
- the fluorescence spectrophotometer includes a photometer unit 100, a computer unit 200, and an interface unit 300.
- An analyst inputs measurement conditions through an operating panel 32 of the interface unit 300.
- continuous wave light emitted from a light source 1 is split by an excitation-side spectroscope 2 to produce excitation light, part of which is shone, via a beam splitter 3, on a measurement sample 6 that is mounted on a sample mounting stage 5.
- An excitation-side slit is included in the excitation-side spectroscope 2, and resolution of monochrome light that is extracted from continuous wave light is determined by setting a width of the slit.
- a light quantity of the part, separated by the beam splitter 3, of the excitation light is measured by a monitoring detector 4, whereby a variation in the light source 1 is corrected.
- Fluorescent light emitted from the sample 6 is split by a fluorescence-side spectroscope 7 to produce monochrome light, which is detected by a detector 8.
- a fluorescence-side slit is included in the fluorescence-side spectroscope 7, and resolution of monochrome light that is separated from fluorescent light is determined by setting a width of the slit.
- a signal detected by the detector 8 is received by a data processing unit 23 as a signal intensity via an A/D converter 21, and a measurement result is displayed on a monitor 31.
- An excitation-side pulse motor 12 is driven according to an instruction from a controller 22 and the excitation-side spectroscope 2 is thereby set at an intended wavelength.
- a fluorescence-side pulse motor 11 is driven according to an instruction from the controller 22 and the fluorescence-side spectroscope 7 is thereby set at an intended wavelength.
- An excitation-side filter 15 is disposed between the excitation-side spectroscope 2 and the measurement sample 6.
- One of plural cut filters is inserted into the optical path as the excitation-side filter 15 by an excitation-side filter pulse motor 13.
- a fluorescence-side filter 16 is disposed between the measurement sample 6 and the fluorescence-side spectroscope 7.
- One of plural cut filters is inserted into the optical path as the fluorescence-side filter 16 by a fluorescence-side filter pulse motor 14.
- fluorescent substance as used herein is a generic term of compounds that emit fluorescent light.
- Example fluorescent compounds are organic compounds such as L-tyrosine, L-tryptophan, vitamin E, and chlorophyll and inorganic compounds such as europium and terbium, as well as amorphous organic compounds such as humic acid and fulvic acid. Scattered light of excitation light appears at the same wavelength as the excitation light, and high-order light such as second-order light appears at a wavelength that is N times the wavelength of scattered light (N: integer).
- a peak selection step S11 an excitation wavelength and a fluorescence wavelength of a peak of attention as a first peak are selected in a measured 3D fluorescence spectrum.
- Fig. 4 shows an example first peak selected in a 3D fluorescence spectrum.
- An excitation wavelength range and a fluorescence wavelength range (e.g., ⁇ 5 nm) with respect to the peak wavelengths are also input as search allowable ranges to be used in referring to a candidate fluorescent substance library.
- a spectrum range selection step S12 spectrum ranges corresponding to a region enclosed by a broken line in area (a) of Fig. 5 are acquired.
- a spectrum range is defined by an excitation wavelength range and a fluorescence wavelength range and is set for each contour line determination value.
- the contour line determination value is a parameter that is specified by a measurer and indicates a threshold value for extraction of intensity data from a 3D fluorescence spectrum.
- peaks of two fluorescent substances are located close to each other as shown in area (a) of Fig. 6 , sets of contour lines of the two fluorescent substances overlap with each other, that is, contour lines of one fluorescent substance extend to wavelength ranges of the other fluorescent substance.
- an excitation wavelength that is located on the shorter wavelength side or the longer wavelength side is set instead of an excitation wavelength corresponding to a maximum fluorescence intensity (proximate peaks determination processing), whereby a single fluorescence spectrum range that does not overlap with a fluorescence spectrum range of another fluorescent substance.
- a candidate fluorescent substance is extracted through collation with a candidate fluorescent substance library that is prepared in advance.
- the candidate fluorescent substance library is a library of fluorescent substances produced by performing, in advance, measurements on fluorescent substances to become candidates, and contains, for each fluorescent substance, a peak excitation wavelength range and a peak fluorescence wavelength range that were obtained at the peak selection step S11, spectrum ranges that were set for respective contour line determination values at the spectrum range selection step S12, and the number of sub peaks, sub peak ratios, sub peak excitation wavelengths, and sub peak fluorescence wavelengths that were obtained at the sub peak selection step S13.
- Wavelength range conditions are set that include an excitation start wavelength, an excitation end wavelength, an excitation data interval, a fluorescence start wavelength, a fluorescence end wavelength, and a fluorescence data interval.
- a condition that dictates a measurement speed is a wavelength scanning rate.
- Conditions that dictate resolution are an excitation-side slit width and a fluorescence-side slit width.
- a condition relating to a data response speed is a response setting value that relates to noise and resolution.
- a condition that determines sensitivity is a detector voltage.
- step S22 To perform a multivariate analysis, measurement data of plural standards are necessary.
- standards that are supposed to be subjected to measurement are registered in a standard table in advance.
- information to become a target variable that is, determination information (production area information when a production area determination is intended and success/failure information when a success/failure determination is intended) and density information (for a regression analysis such as PLS), is input for each standard.
- step S23 3D fluorescence spectra of the standards are measured based on the standard table.
- step S24 the candidate fluorescent substance determining process shown in Figs. 3A-3D is executed on each measured 3D fluorescence spectrum, whereby candidate fluorescent substances are determined.
- a model is obtained by performing a multivariate analysis such as a PLS regression analysis or a discriminant analysis using the data that have been set as a subject of the multivariate analysis. Since model coefficients obtained here are basically ones obtained based on the data in the spectrum ranges, correlation is made between sets of model coefficients corresponding to respective pairs of wavelengths and candidate fluorescent substances involved.
- An average of model coefficients corresponding to each candidate fluorescent substance serves as an index to be used for determining whether the candidate fluorescent substance contributes to obtaining a target value.
- model coefficients corresponding to each pair of wavelengths are important finally, an average of model coefficients is useful for evaluation of influence of interaction between components that occurs in a case that plural fluorescent substances are included. For example, in the case of a PLS regression analysis, a component an average of whose model coefficients is negative has no correlation with a target value. On the other hand, a component an average of whose model coefficients is positive has correlation with a target value.
- sample measurement conditions are set. Basically, the sample measurement conditions are set the same as the standard measurement conditions. However, to shorten the measurement time, the excitation start wavelength, the excitation end wavelength, the excitation data interval, the fluorescence start wavelength, the fluorescence end wavelength, the fluorescence data interval, etc. that relate to the measurement wavelength ranges may be changed according to the measurement wavelength ranges that were selected at step S25 of the standard process.
- step S33 it is determined whether the pairs of an excitation wavelength and a fluorescence wavelength corresponding to the sets of model coefficients that were read at step S31 are included in the respective pairs of measurement wavelength ranges, and whether the wavelength scanning rate, the excitation-side slit width, the fluorescence-side slit width, the response setting value, and the detector voltage are the same as those of the standard measurement conditions. Since the measurement conditions influence the resolution and sensitivity and hence fluorescence intensity values, the measurement conditions other than the measurement wavelength ranges should not be changed. The determination step S33 is executed to equalize these sample measurement conditions to the corresponding standard measurement conditions, to avoid measurement errors.
- a sample table is set in advance for a sample to be subjected to measurement.
- a success/failure determination condition and determination value names may be determined.
- An example of the success/failure determination condition is a threshold value for a determination on a target value obtained by a multivariate analysis. Examples of the determination value names are "larger” indicating that a target value obtained is larger than the threshold value, "smaller” indicating that a target value obtained is smaller than the threshold value, "larger or smaller” indicating a destination item of a case that a target value obtained is the same as the threshold value.
- a 3D fluorescence spectrum of the sample is measured according to the sample table set at step S34.
- candidate fluorescent substances are determined according to the candidate fluorescent substance determining process shown in Figs. 3A-3D .
- a success/failure determination is made and a result is output.
- the 3D fluorescence spectrum and a result of determination of candidate fluorescent substances are displayed as shown in Fig. 10 .
- a final measurement result of the entire process including the standard process and the sample process is displayed as shown in Fig. 11 .
- Information of the standard table that was set in the standard process is displayed in a top-left part of the screen.
- Values of the calculation that was performed using the model coefficients that were read at step S31 and results of success/failure determinations made according to the success/failure determination condition that was set in the sample table at step S34 are added to the sample table that was set in the sample process, and resulting information is displayed in a bottom-left part of the screen.
- a 3D fluorescence spectrum of an item selected from the standard information displayed in the top-left part or the sample information displayed in the bottom-left part is displayed in a top-right part of the screen.
- Displayed in a bottom-right part of the screen is a list of candidate fluorescent substances, obtained at step S24, of the item selected from the standard information displayed in the top-left part or a list of candidate fluorescent substances, obtained at step S36, of the item selected from the sample information displayed in the bottom-left part. Also displayed is an average of the model coefficients, calculated at step S26 in the standard process, of each candidate fluorescent substance. If a fluorescent substance other than the candidate fluorescent substances that were obtained in the standard process is obtained in the sample process, no average of model coefficients of that fluorescent substance is displayed.
- the candidate fluorescent substance for a peak of attention can be recognized visually.
- its peak wavelengths and spectrum range may be highlighted for determination.
- Embodiment 2 fluorescent substances are identified using fluorescence characteristics of 3D fluorescence spectra of standards measured in the standard process.
- the sample is identified by executing the candidate fluorescent substance determining process shown in Figs. 3A-3D .
- Sample measurement conditions are set at step S32, a sample table is set at step S34 by inputting pieces of sample information, and a 3D fluorescence spectrum of the sample is measured at step S35 according to the conditions that were set at step S32.
- the candidate fluorescent substance determining process shown in Figs. 3A-3D which includes the peak selection step S11, the spectrum range selection step S12, and the sub peak selection step S13, is performed on a 3D fluorescence spectrum obtained, whereby pieces of fluorescence characteristic information are obtained.
- Candidate fluorescent substances are determined by collating obtained peak wavelengths, spectrum ranges, and pieces of sub peak information with a candidate fluorescent substance library. A sample containing the thus-determined candidate fluorescent substances is extracted from a candidate fluorescent sample library.
- a measurement target sample such as a food, a chemical material, or an environmental substance in many cases contains plural fluorescent substances and plural kinds of fluorescence characteristics may be obtained from a 3D fluorescence spectrum. Where plural kinds of fluorescence characteristics are obtained from a 3D fluorescence spectrum, as shown in Fig. 12 , determination of candidate fluorescent substances of an unknown sample and extraction of a candidate sample that were described above are performed repeatedly and candidate samples are thereby narrowed down. A candidate sample that exhibits an effective fluorescence characteristic is extracted finally from the candidate fluorescent sample library.
- an unknown sample determining instrument according to Embodiment 3 of the present disclosure will be described below with reference to Fig. 1 .
- the unknown sample determining instrument according to Embodiment 3 can be used suitably for the above-described unknown sample determining method, the measuring device used therein is not limited to the one described below.
- Fig. 1 shows a fluorescence spectrophotometer which includes a photometer unit 100, a computer unit 200, and an interface unit 300.
- An analyst inputs measurement conditions through an operating panel 32 of the interface unit 300.
- Continuous wave light emitted from a light source 1 is split by an excitation-side spectroscope 2 to produce excitation light, part of which is shone, via a beam splitter 3, on a measurement sample 6 that is mounted on a sample mounting stage 5.
- An excitation-side slit is included in the excitation-side spectroscope 2, and resolution of monochrome light that is extracted from white light is determined by setting a width of the slit.
- a light quantity of the part, separated by the beam splitter 3, of the excitation light is measured by a monitoring detector 4, whereby a variation in the light source 1 is corrected.
- Fluorescent light emitted from the sample 6 is split by a fluorescence-side spectroscope 7 to produce monochrome light, which is detected by a detector 8.
- a fluorescence-side slit is included in the fluorescence-side spectroscope 7, and resolution of monochrome light that is separated from fluorescent light is determined by setting a width of the slit.
- a signal detected by the detector 8 is received by a data processing unit 23 as a signal intensity via an A/D converter 21, and a measurement result is displayed on a monitor 31.
- An excitation-side pulse motor 12 is driven according to an instruction from a controller 22 and the excitation-side spectroscope 2 is thereby set at an intended wavelength.
- a fluorescence-side pulse motor 11 is driven according to an instruction from the controller 22 and the fluorescence-side spectroscope 7 is thereby set at an intended wavelength.
- Each of the excitation-side spectroscope 2 and the fluorescence-side spectroscope 7 employs such an optical element as a diffraction grating or a prism, and a spectrum scan is performed by rotating the optical element via gears and a cam using motive power produced by the excitation-side pulse motor 12 or the fluorescence-side pulse motor 11.
- An excitation-side filter 15 is disposed between the excitation-side spectroscope 2 and the measurement sample 6.
- One of plural cut filters is inserted into the optical path as the excitation-side filter 15 by an excitation-side filter pulse motor 13.
- a fluorescence-side filter 16 is disposed between the measurement sample 6 and the fluorescence-side spectroscope 7.
- One of plural cut filters is inserted into the optical path as the fluorescence-side filter 16 by a fluorescence-side filter pulse motor 14.
- the fluorescence spectrophotometer shown in Fig. 1 is a monochrometer in which a wavelength scan of the fluorescence-side spectroscope 7 is performed by the fluorescence-side pulse motor 11 and monochromatic light is detected by the detector 8 such as a photomultiplier, it can be implemented as a polychrometer that does not include the fluorescence-side pulse motor 11 and employs, as the detector 8, an area detector such as a CCD.
- Fluorescence intensity values of a 3D fluorescence spectrum are shown with the vertical axis and the horizontal axis representing the excitation wavelength EX and the fluorescence wavelength EM, respectively.
- the vertical axis and the horizontal axis may represent the fluorescence wavelength and the excitation wavelength, respectively.
- the input measurement conditions of sample measurement includes excitation wavelength and fluorescence wavelength at the time of calculating model coefficients are within the measurement wavelength range and whether the input measurement conditions of sample measurement includes wavelength scanning rate, an excitation-side slit width, a fluorescence-side slit width, a response setting value, and a detector voltage that matches the measurement conditions being set in the condition setting step in the standard process.
- the data processing unit 23 extracts a candidate fluorescent substance by collating, with the candidate fluorescent substance library, results obtained for a measured 3D fluorescence spectrum of an unknown measurement target sample whose determination information is not available, that is, an excitation wavelength and a fluorescence wavelength of a first peak selected at the peak selection step S11 of the fluorescent substance determining process shown in Figs. 3A-3D , spectrum ranges that were set for respective contour determination values at the spectrum range selection step S12, and the number of sub peaks, sub peak ratios, sub peak excitation wavelengths, and sub peak fluorescence wavelengths that were obtained at the sub peak selection step S13.
- sets of a peak wavelength, spectrum ranges, and pieces of sub peak information are sequentially collated with the candidate fluorescent sample library, whereby candidate fluorescent substances that satisfy the above sets of pieces of peak information are extracted.
- a sample containing the extracted candidate fluorescent substances is extracted from the candidate fluorescent sample library, and the 3D fluorescence spectrum and the sample table of the measurement target sample and the extracted candidate sample are displayed on the monitor 31.
- the program causes setting, through the operating panel 32, of conditions under which to measure a 3D fluorescence spectrum of each standard by means of the photometer unit 100 by sending an instruction from the controller 22 to it.
- Wavelength range conditions are set that include an excitation start wavelength, an excitation end wavelength, an excitation data interval, a fluorescence start wavelength, a fluorescence end wavelength, and a fluorescence data interval.
- a condition that dictates a measurement speed is a wavelength scanning rate.
- Conditions that dictate resolution are an excitation-side slit width and a fluorescence-side slit width.
- a condition relating to a data response speed is a response setting value that relates to noise and resolution.
- a condition that determines sensitivity is a detector voltage.
- the program causes input, through the operating panel 32, of a sample name, information to become a target variable, and density information, and storage of them in the data processing unit 23.
- the program causes the data processing unit 23 to read the model coefficients obtained at the multivariate analysis step S26.
- the program sets sample measurement conditions by receiving them through the operating panel 32 or select sample measurement conditions stored in the data processing unit 23. Basically, the sample measurement conditions are set the same as the standard measurement conditions. However, to shorten the measurement time, the excitation start wavelength, the excitation end wavelength, the excitation data interval, the fluorescence start wavelength, the fluorescence end wavelength, the fluorescence data interval, etc. that relate to the measurement wavelength ranges may be changed according to the measurement wavelength ranges that were selected at step S25 of the standard process.
- the program causes the photometer unit 100 to measure a 3D fluorescence spectrum of the sample according to the sample table that was set at step S34 and according to an instruction from the controller 31 that are based on the thus-set measurement conditions.
- the program stores the measured 3D fluorescence spectrum in the data processing unit 23 in the form of 3D data, that is, excitation wavelengths, fluorescence wavelengths, and fluorescence intensity values, and determine candidate fluorescent substances according to the candidate fluorescent substance determining process shown in Figs. 3A-3D .
- the program causes the monitor 31 to display candidate fluorescent substance search results, that is, a 3D fluorescence spectrum and a result of determination of candidate fluorescent substances (see Fig. 10 ).
- the peak wavelengths and the sub peak wavelengths of the candidate fluorescent substances may be plotted so as to be recognizable, in the same manner as in the 3D fluorescence spectrum shown in Fig. 10 .
- Spectrum ranges corresponding to contour line determination values "50" and "10" may further be displayed using a broken line or the like. Since the list of candidate fluorescent substances and the 3D fluorescence spectrum are displayed on the same screen, the candidate fluorescent substance for a peak of attention can be recognized visually. When one candidate fluorescent substance is selected, its peak wavelengths and spectrum range may be highlighted for determination.
- the program causes the data processing unit 23 to normalize the peak intensity of the selected first peak selected by itself to a prescribed value to facilitate data comparison.
- the program causes the data processing unit 23 to select a spectrum range corresponding to a region enclosed by a broken line in area (a) of Fig. 5 .
- a spectrum range is defined by an excitation wavelength range and a fluorescence wavelength range and is set for each contour line determination value, and information indicating it is stored in the data processing unit 23.
- the contour line determination value is a parameter that is specified by a measurer and indicates a threshold value for extraction of intensity data from a 3D fluorescence spectrum. For example, where the contour line determination value is set at "10,” a spectrum range corresponding to an intensity "10" with respect to the normalized intensity "100" of the first peak that was set at the peak selection step S11 is searched for.
- a target area is set that is defined by an excitation wavelength range and a fluorescence wavelength range. Widest wavelength ranges of a closed contour line that connects the same fluorescence intensity values are set. Then it is determined whether the thus-set spectrum range is included in measurement wavelength ranges. If the spectrum range is out of the measurement wavelength ranges, another spectrum range is set.
- the program causes the data processing unit 23 to perform proximate peaks determination processing.
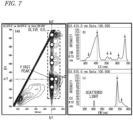
- the program causes the data processing unit 23 to set sub peak wavelengths as shown in area (a) of Fig. 7 (a range enclosed by a broken line) and areas (b) and (c) of Fig. 7 .
- Sub peaks may be set either automatically by setting an intensity threshold value and extracting peaks that exceed the threshold value or manually by an operator.
- the program causes the monitor 31 to display results obtained at the peak selection step S11, the spectrum range selection step S12, and the sub peak selection step S13 of each process in the form of a list. More specifically, the list contains peak wavelengths of a first peak that was specified at the peak selection step S11, a spectrum range (spectrum range-50) corresponding to a contour line determination value "50" and a spectrum range (spectrum range-10) corresponding to a contour line determination value "10" that were obtained at the spectrum range selection step S12, and sub peak information that was obtained at the sub peak selection step S13, that is, the number of sub peaks, sub peak ratios, sub peak excitation wavelengths EX, and sub peak fluorescence wavelengths EM.
- the program causes the monitor 31 to display a result of determination, from the candidate fluorescent substance library, of a candidate fluorescent substance that satisfies the above conditions in the form of a candidate fluorescent substance list.
- the program causes the data processing unit 23 to select another first peak at the peak selection step S11 and determine a candidate fluorescent substance corresponding to peaks selected at the spectrum range selection step S12 and the sub peak selection step S13. Fluorescent substances are thus identified sequentially.
- fluorescent substances are identified using fluorescence characteristics of 3D fluorescence spectra of standards measured in the standard process.
- the sample is identified by executing the candidate fluorescent substance determining process shown in Figs. 3A-3D .
- Sample measurement conditions are set at step S32, a sample table is set at step S34 by inputting pieces of sample information, and a 3D fluorescence spectrum of the sample is measured at step S35 according to the conditions that were set at step S32.
- the candidate fluorescent substance determining process shown in Figs. 3A-3D which includes the peak selection step S11, the spectrum range selection step S12, and the sub peak selection step S13, is performed on the 3D fluorescence spectrum obtained, whereby pieces of fluorescence characteristic information are obtained.
- Candidate fluorescent substances are determined by collating obtained peak wavelengths, spectrum ranges, and pieces of sub peak information with the candidate fluorescent substance library. A sample containing the thus-determined candidate fluorescent substances is extracted from the candidate fluorescent sample library.
- a measurement target sample such as a food, a chemical material, or an environmental substance in many cases contains plural fluorescent substances and plural kinds of fluorescence characteristics may be obtained from a 3D fluorescence spectrum. Where plural kinds of fluorescence characteristics are obtained from a 3D fluorescence spectrum, as shown in Fig. 12 , determination of candidate fluorescent substances of an unknown sample and extraction of a candidate sample that were described above are performed repeatedly and candidate samples are thereby narrowed down. A candidate sample that exhibits an effective fluorescence characteristic is extracted finally from the candidate fluorescent substance library.
- the unknown sample determining method that, in analysis techniques of performing a multivariate analysis on 3D fluorescence spectrum data, is capable to identify fluorescent substances corresponding to peaks of a 3D fluorescence spectrum of a sample and display their list and can also be applied to identification and same/different determination of the sample itself that are made based on identification results of fluorescent substances corresponding to plural respective peaks.
- the use of this method can also provide advantages of increase of the accuracy of a multivariate analysis and shortening of its execution time.
Landscapes
- Physics & Mathematics (AREA)
- Spectroscopy & Molecular Physics (AREA)
- General Physics & Mathematics (AREA)
- Health & Medical Sciences (AREA)
- Engineering & Computer Science (AREA)
- Analytical Chemistry (AREA)
- Biochemistry (AREA)
- General Health & Medical Sciences (AREA)
- Chemical & Material Sciences (AREA)
- Immunology (AREA)
- Pathology (AREA)
- Life Sciences & Earth Sciences (AREA)
- Human Computer Interaction (AREA)
- Nuclear Medicine, Radiotherapy & Molecular Imaging (AREA)
- Mathematical Physics (AREA)
- Theoretical Computer Science (AREA)
- Investigating, Analyzing Materials By Fluorescence Or Luminescence (AREA)
Claims (6)
- Unbekannte Probe bestimmendes Verfahren zum Bestimmen einer unbekannten Probe durch Berechnen von Modellkoeffizienten durch Extrahieren einer Fluoreszenzeigenschaft aus Ergebnissen von Messungen von 3D-Fluoreszenzspektren von Standards, wobei das Verfahren umfasst:einen Standardvorgang eines Durchführens von Messungen an Standards, der aufweist:einen Messbedingungen-Einstellschritt (S21) zum Einstellen von Messbedingungen, unter denen 3D-Fluoreszenzspektren der Standards zu messen sind;einen Standardtabellen-Registrierungsschritt (S22) zum Registrieren der Standards in einer Standardtabelle in Form von Kombinationen von mindestens einem Probennamen, Bestimmungsinformationen und Dichteinformationen;einen 3D-Fluoreszenzspektrum-Messschritt (S23) zum Messen von 3D-Fluoreszenzspektren der Standards, die in der Standardtabelle registriert sind, unter den Bedingungen, die in dem Messbedingungen-Einstellschritt eingestellt wurden;einen Kandidaten-Fluoreszenzsubstanz-Bestimmungsschritt (S24) zum Bestimmen von Kandidaten-Fluoreszenzsubstanzen, die in jedem der Standards enthalten sind, durch Extrahieren von Fluoreszenzeigenschaften aus dem 3D-Fluoreszenzspektrum des Standards und Vergleichen der extrahierten Fluoreszenzeigenschaften mit Fluoreszenzeigenschaften, die in einer Kandidaten-Fluoreszenzsubstanz-Bibliothek registriert sind;wobei der Kandidaten-Fluoreszenzsubstanz-Bestimmungsschritt die Fluoreszenzeigenschaften durch die folgenden Schritte extrahiert:einen Spitzen-Auswahlschritt (S11) zum Extrahieren erster Spitzen, die Teile der Fluoreszenzeigenschaft darstellen, aus dem 3D-Fluoreszenzspektrum jedes der Standards, die in dem 3D-Fluoreszenzspektrum-Messschritt erhalten wurden, und zum Normalisieren der ersten Spitze;einen Spektralbereich-Auswahlschritt (S12) zum Einstellen von Spektralbereichen, die einem Fluoreszenzintensitäts-Konturlinienbestimmungswert entsprechen; undeinen Unterspitzen-Auswahlschritt (S13) zum Auswählen von Unterspitzen in jedem der Spektralbereiche, die in dem Spektralbereich-Auswahlschritt eingestellt wurden;wobei der Standardvorgang des Durchführens von Messungen an Standards ferner einen Modellkoeffizienten-Ausgabeschritt (S26) zum Berechnen von Modellkoeffizienten durch Durchführen einer multivariaten Analyse basierend auf Daten, die auf den Spektralbereich begrenzt sind, der in dem Spektralbereich-Auswahlschritt (S12) bestimmt wurde, umfasst, wobei der Modellkoeffizienten-Ausgabeschritt nach dem Kandidaten-Fluoreszenzsubstanz-Bestimmungsschritt (S24) durchgeführt wird;wobei das Verfahren ferner umfasst:
einen Probenvorgang eines Durchführens einer Messung an einer unbekannten Probe, der aufweist:einen Modellkoeffizienten-Leseschritt (S31) zum Lesen der Modellkoeffizienten, die von dem Standardvorgang ausgegeben wurden;einen Messbedingungen-Einstellschritt (S32) zum Einstellen von Bedingungen, unter denen ein 3D-Fluoreszenzspektrum der unbekannten Probe zu messen ist;einen Messbedingungen-Bestimmungsschritt (S33) zum Bestimmen, ob die Messbedingungen, die in dem Messbedingungen-Einstellschritt eingestellt wurden, äquivalent zu den Bedingungen sind, die in dem Messbedingungen-Bestimmungsschritt des Standardvorgangs eingestellt wurden, oder einen Spektralbereich einer Fluoreszenzeigenschaft aufweisen;einen Probentabellen-Einstellschritt (S34) zum Einstellen, als Probentabelle, eines Probennamens der unbekannten Probe und einer Bestimmungsbedingung, die ein Schwellenwert zur Bestimmung eines Zielwertes ist, der durch multivariate Analyse und basierend auf den Modellkoeffizienten, die in dem Modellkoeffizienten-Leseschritt (S31) gelesen werden, erhalten wird;einen 3D-Fluoreszenzspektrum-Messschritt (S35) zum Durchführen einer Messung an der unbekannten Probe unter den Bedingungen, die in dem Messbedingungen-Einstellschritt (S32) eingestellt wurden;einen Kandidaten-Fluoreszenzsubstanz-Bestimmungsschritt (S36) zum Bestimmen von Kandidaten-Fluoreszenzsubstanzen basierend auf einem Vergleichen von Fluoreszenzeigenschaften, die erste Spitzen, Spektralbereiche und Unterspitzen eines 3D-Fluoreszenzspektrums umfassen, das in dem 3D-Fluoreszenzspektrum-Messschritt (S35) erhalten wurde, mit Fluoreszenzeigenschaften, die in einer Kandidaten-Fluoreszenzsubstanz-Bibliothek registriert sind;einen Bestimmungsschritt (S37) zum Berechnen, ob die Bestimmungsbedingung durch den Zielwert erfüllt ist; undeinen Kandidatenproben-Extraktionsschritt zum Extrahieren einer Kandidatenprobe durch Vergleichen einer Kombination der Kandidaten-Fluoreszenzsubstanzen, die in dem Kandidaten-Fluoreszenzsubstanz-Bestimmungsschritt bestimmt wurden, mit einer Kandidatenproben-Bibliothek;einen Kandidaten-Fluoreszenzsubstanz-Anzeigeschritt zum Anzeigen einer Liste von Namen der extrahierten Kandidaten-Fluoreszenzsubstanzen und der Fluoreszenzeigenschaft, die für die Bestimmung der Kandidaten-Fluoreszenzsubstanzen verwendet wird; undeinen Kandidatenproben-Anzeigeschritt zum Anzeigen eines Namens der extrahierten Kandidatenprobe zusammen mit den Fluoreszenzeigenschaften der jeweiligen Kandidaten-Fluoreszenzsubstanzen. - Unbekannte Probe bestimmendes Verfahren nach Anspruch 1,wobei der Kandidaten-Fluoreszenzsubstanz-Bestimmungsschritt (S24, S36) sowohl des Standardvorgangs als auch des Probenvorgangs umfasst:einen Spitzen-Auswahlschritt (S11) zum Auswählen erster Spitzen, von denen jede eine lokale maximale Fluoreszenzintensität des 3D-Fluoreszenzspektrums darstellt, das in dem 3D-Fluoreszenzspektrum-Messschritt des Standardvorgangs oder des Probenvorgangs gemessen wurde, oder eine dominante Fluoreszenzeigenschaft in einem spezifizierten Spektralbereich des gemessenen 3D-Fluoreszenzspektrums darstellt, Normalisieren der ersten Spitzen und Einstellen eines zulässigen Wellenlängenbereichs der ersten Spitzen;einen Spektralbereich-Auswahlschritt (S12) zum Durchführen eines Bestimmungsvorgangs für nahegelegene Spitzen, so dass mehrere der eingestellten Spektralbereiche sich nicht überlappen, die durch Auswählen von Spektralbereichen eingestellt werden, von denen jeder durch einen Anregungswellenlängenbereich und einen Fluoreszenzwellenlängenbereich definiert ist und einem Konturlinien-Bestimmungswert entspricht, und Ausschließen von Spektralbereichen von gestreutem Licht, Licht hoher Ordnung und dergleichen, die für eine Fluoreszenzeigenschaft-Bestimmung unnötig sind; undeinen Unterspitzen-Einstellschritt (S13) zum Einstellen mindestens der Anzahl, der Spitzenwellenlängen und der Spitzenintensitätsverhältnisse für die erste Spitze von Unterspitzen in jedem der Spektralbereiche entsprechend dem Konturlinien-Bestimmungswert,wobei der Kandidaten-Fluoreszenzsubstanz-Bestimmungsschritt (S24) des Standardvorgangs einen Bestimmungsschritt zum Bestimmen umfasst, ob die ersten Spitzen, die in dem Spitzen-Auswahlschritt eingestellt wurden, die Spektralbereiche, die in dem Spektralbereich-Auswahlschritt eingestellt wurden, und die Teile der Unterspitzen-Informationen, die in dem Unterspitzen-Auswahlschritt eingestellt wurden, mit entsprechenden Teilen von Informationen von Kandidaten-Fluoreszenzsubstanzen übereinstimmen, die in der Kandidaten-Fluoreszenzsubstanz-Bibliothek registriert sind,wobei der Kandidaten-Fluoreszenzsubstanz-Bestimmungsschritt (S36) des Probenvorgangs einen Bestimmungsschritt zum Bestimmen umfasst, ob die ersten Spitzen, die in dem Spitzen-Auswahlschritt eingestellt wurden, die Spektralbereiche, die in dem Spektralbereich-Auswahlschritt eingestellt wurden, und die Teile der Unterspitzen-Informationen, die in dem Unterspitzen-Auswahlschritt eingestellt wurden, mit entsprechenden Teilen von Informationen der Kandidaten-Fluoreszenzsubstanzen übereinstimmen, die in dem Standardvorgang bestimmt wurden, undwobei der Kandidaten-Fluoreszenzsubstanz-Bestimmungsschritt sowohl des Standardvorgangs als auch des Probenvorgangs ferner umfasst:
einen Anzeigeschritt zum Anzeigen einer Liste von Namen der Kandidaten-Fluoreszenzsubstanzen, die in dem Bestimmungsschritt des Probenprozesses zufällig gefunden wurden, der ersten Spitzen, die in dem Spitzen-Auswahlschritt eingestellt wurden, der Spektralbereiche, die in dem Spektralbereich-Auswahlschritt eingestellt wurden, und der Teile von Unterspitzen-Informationen, die in dem Unterspitzen-Auswahlschritt eingestellt wurden. - Unbekannte Probe bestimmendes Verfahren nach Anspruch 1,
wobei der Spektralbereich-Auswahlschritt (S12) eine Bestimmungsverarbeitung für nahegelegene Spitzen umfasst, die durchgeführt wird, wenn erste Spitzen, die mehreren jeweiligen Fluoreszenzsubstanzen zugeordnet sind, so nahe beieinander liegen, dass Spektralbereiche, die dem Konturlinien-Bestimmungswert entsprechen, einander überlappen, wobei die Bestimmungsverarbeitung für nahegelegene Spitzen umfasst:Auswählen von Fluoreszenzwellenlängenbereichen, so dass sich Fluoreszenzintensitätskonturlinien nicht überlappen; undEinstellen von Anregungswellenlängenbereichen basierend auf den ausgewählten Fluoreszenzwellenlängenbereichen, wodurch verhindert wird, dass sich Fluoreszenzeigenschaften von mehreren Fluoreszenzsubstanzen gegenseitig stören. - Unbekannte Probe bestimmendes Verfahren nach Anspruch 1,
wobei der Kandidatenproben-Extraktionsschritt umfasst:Identifizieren einer Mehrfachkombination von Fluoreszenzsubstanzen, wenn eine Mehrfachkombination von Fluoreszenzsubstanzen in dem Kandidaten-Fluoreszenzsubstanz-Bestimmungsschritt des Probenvorgangs bestimmt wird, durch wiederholtes Extrahieren einer Kombination von Kandidaten-Fluoreszenzsubstanzen in dem Spitzen-Auswahlschritt, dem Spektralbereich-Auswahlschritt und dem Unterspitzen-Auswahlschritt mit einer Anzahl von Malen, die gleich der Anzahl von Kombinationen von Fluoreszenzsubstanzen ist; undExtrahieren einer Kandidatenprobe durch Vergleichen der identifizierten mehreren Kombinationen von Fluoreszenzsubstanzen mit der Kandidatenproben-Bibliothek. - Unbekannte Probe bestimmendes Verfahren nach Anspruch 1,
wobei der Kandidaten-Fluoreszenzsubstanz-Anzeigeschritt ein Anzeigen einer Liste der Namen der extrahierten Kandidaten-Fluoreszenzsubstanzen und mindestens von Wellenlängenpaaren der ersten Spitzen, der Spektralbereiche und der Sätze von Teilen von Unterspitzen-Informationen, basierend auf denen die Fluoreszenzeigenschaft bestimmt wurde, und der Modellkoeffizienten umfasst. - Unbekannte Probe bestimmendes Verfahren nach Anspruch 1,
wobei der Kandidatenproben-Anzeigeschritt ein selektives Anzeigen zusammen mit den Namen der extrahierten Kandidaten-Fluoreszenzsubstanzen von Folgendem umfasst:einem ersten Bereich, in dem die registrierte Standardtabelle angezeigt wird;einem zweiten Bereich, in dem eine Liste der Namen der extrahierten Kandidaten-Fluoreszenzsubstanzen und mindestens von Wellenlängenpaaren der ersten Spitzen, der Spektralbereiche und der Sätze von Teilen von Unterspitzen-Informationen, basierend auf denen die Fluoreszenzeigenschaft bestimmt wurde, und der Modellkoeffizienten angezeigt wird; undeinem dritten Bereich, in dem ein ausgewähltes der 3D-Fluoreszenzspektren, das markiert ist, angezeigt wird, so dass eine entsprechende der Fluoreszenzsubstanzen in der Liste und ihre erste Spitze erkennbar sind.
Applications Claiming Priority (1)
| Application Number | Priority Date | Filing Date | Title |
|---|---|---|---|
| JP2016186207A JP6831094B2 (ja) | 2016-09-06 | 2016-09-06 | 未知試料判定方法、未知試料判定装置及び未知試料判定プログラム |
Publications (3)
| Publication Number | Publication Date |
|---|---|
| EP3290908A1 EP3290908A1 (de) | 2018-03-07 |
| EP3290908B1 true EP3290908B1 (de) | 2023-12-20 |
| EP3290908B8 EP3290908B8 (de) | 2024-01-24 |
Family
ID=59811127
Family Applications (1)
| Application Number | Title | Priority Date | Filing Date |
|---|---|---|---|
| EP17189696.2A Active EP3290908B8 (de) | 2016-09-06 | 2017-09-06 | Verfahren zur bestimmung einer unbekannten probe |
Country Status (3)
| Country | Link |
|---|---|
| US (1) | US10718713B2 (de) |
| EP (1) | EP3290908B8 (de) |
| JP (1) | JP6831094B2 (de) |
Families Citing this family (12)
| Publication number | Priority date | Publication date | Assignee | Title |
|---|---|---|---|---|
| WO2020053919A1 (ja) * | 2018-09-10 | 2020-03-19 | 日本たばこ産業株式会社 | 蛍光指紋分析を利用した処理原料中のTSNAs定量方法、プログラム及び装置 |
| CN109444071B (zh) * | 2018-12-14 | 2020-12-11 | 江苏东交工程检测股份有限公司 | 基于分波段的沥青红外光谱质量检测方法和装置 |
| JP2022061391A (ja) * | 2020-10-06 | 2022-04-18 | オリンパス株式会社 | 実験支援装置、実験支援システム、実験支援方法、プログラム |
| JP2022142057A (ja) * | 2021-03-16 | 2022-09-30 | 日清オイリオグループ株式会社 | 油脂組成物に含まれるブチルヒドロキシアニソール、tert-ブチルヒドロキノン又は多環芳香族炭化水素の濃度推定方法及び推定モデルの作成方法、及び油脂の選別方法 |
| JP7828141B2 (ja) * | 2021-04-30 | 2026-03-11 | 株式会社キーエンス | 分析装置、分析方法、分析プログラムおよび記憶媒体 |
| CN113418896B (zh) * | 2021-05-18 | 2023-01-10 | 中国农业大学 | 一种用于在线高通量检测玉米籽粒中黄曲霉毒素的方法 |
| CN115615967A (zh) * | 2021-07-16 | 2023-01-17 | 滁州学院 | 基于气味荧光传感器的食用植物油酸败早期快速测定方法 |
| JP7752041B2 (ja) * | 2021-12-22 | 2025-10-09 | 株式会社日立ハイテク | スペクトル解析方法、装置およびシステム |
| CN114739960B (zh) * | 2022-03-18 | 2024-08-16 | 中南大学 | 一种基于荧光光谱的总氮快速检测方法、装置、设备及介质 |
| JP7797324B2 (ja) * | 2022-07-11 | 2026-01-13 | 株式会社日立ハイテクアナリシス | 分光分析システム及び分光分析方法 |
| JP2024143128A (ja) * | 2023-03-30 | 2024-10-11 | 株式会社日立ハイテク | スペクトル解析装置、スペクトル解析システムおよびスペクトル解析方法 |
| CN116392446A (zh) * | 2023-06-05 | 2023-07-07 | 西南大学 | 一种光热抗自由基天然药物自组装纳米颗粒的合成 |
Family Cites Families (13)
| Publication number | Priority date | Publication date | Assignee | Title |
|---|---|---|---|---|
| JPS5856741B2 (ja) | 1979-11-27 | 1983-12-16 | 学校法人 岐阜歯科大学 | 歯科充填材料としての水銀アマルガム用金属混合粉末 |
| US7015484B2 (en) * | 2001-04-16 | 2006-03-21 | Dakota Technologies, Inc. | Multi-dimensional fluorescence apparatus and method for rapid and highly sensitive quantitative analysis of mixtures |
| US20030215791A1 (en) * | 2002-05-20 | 2003-11-20 | Applied Spectral Imaging Ltd. | Method of and system for multiplexed analysis by spectral imaging |
| JP2004325200A (ja) * | 2003-04-24 | 2004-11-18 | Hitachi Ltd | 組織内物質濃度測定装置 |
| GB0719373D0 (en) * | 2007-10-04 | 2007-11-14 | Univ Cranfield | Optical multisensor |
| JP2012098244A (ja) * | 2010-11-05 | 2012-05-24 | National Agriculture & Food Research Organization | 成分分布分析方法、成分分布分析装置、および、プログラム |
| NZ589582A (en) * | 2010-11-29 | 2013-03-28 | Comvita Ltd | Method and Apparatus For Honey Measurement |
| JP5856741B2 (ja) | 2011-02-25 | 2016-02-10 | 国立研究開発法人農業・食品産業技術総合研究機構 | アフラトキシン定量方法、アフラトキシン定量装置、および、プログラム |
| US8901513B2 (en) * | 2011-03-08 | 2014-12-02 | Horiba Instruments, Incorporated | System and method for fluorescence and absorbance analysis |
| US8913240B2 (en) * | 2011-09-30 | 2014-12-16 | Shimadzu Corporation | Fluorescence spectrophotometer |
| JP5974559B2 (ja) * | 2012-03-14 | 2016-08-23 | 株式会社リコー | 感光体及びその製造方法 |
| WO2013190618A1 (ja) * | 2012-06-18 | 2013-12-27 | 株式会社島津製作所 | 分光蛍光光度計 |
| JP6212454B2 (ja) | 2014-08-26 | 2017-10-11 | 国立研究開発法人農業・食品産業技術総合研究機構 | チーズの熟成度指標推定方法、チーズの熟成度指標推定装置、コンピュータが実行可能なプログラム、及びプロセスチーズの製造方法 |
-
2016
- 2016-09-06 JP JP2016186207A patent/JP6831094B2/ja active Active
-
2017
- 2017-09-06 EP EP17189696.2A patent/EP3290908B8/de active Active
- 2017-09-06 US US15/696,392 patent/US10718713B2/en active Active
Also Published As
| Publication number | Publication date |
|---|---|
| EP3290908B8 (de) | 2024-01-24 |
| JP6831094B2 (ja) | 2021-02-17 |
| EP3290908A1 (de) | 2018-03-07 |
| US10718713B2 (en) | 2020-07-21 |
| JP2018040779A (ja) | 2018-03-15 |
| US20180067048A1 (en) | 2018-03-08 |
Similar Documents
| Publication | Publication Date | Title |
|---|---|---|
| EP3290908B1 (de) | Verfahren zur bestimmung einer unbekannten probe | |
| Hussain et al. | Innovative nondestructive imaging techniques for ripening and maturity of fruits–a review of recent applications | |
| EP2710353B1 (de) | Spektroskopievorrichtung und verfahren zur bestimmung der in einer probe vorkommenden komponenten | |
| EP2976620B1 (de) | System und verfahren zur durchführung von untersuchungen mittels einer kombination von libs und infrarot-absorptionsspektroskopie | |
| JP6089345B2 (ja) | 時および/または空間系列ファイルの多成分回帰/多成分分析 | |
| Micó et al. | EEMlab: a graphical user-friendly interface for fluorimetry experiments based on the drEEM toolbox | |
| WO2009105360A1 (en) | Efficient spectral matching, particularly for multicomponent spectra | |
| CN111103259B (zh) | 基于光谱技术的煎炸油品质快速检测方法 | |
| CN105606584A (zh) | 一种使用拉曼光谱鉴别物品一致性的方法和系统 | |
| Bai et al. | Improving the estimation accuracy of soil organic matter based on the fusion of near-infrared and Raman spectroscopy using the outer-product analysis | |
| CN113514446A (zh) | 一种用于快速匹配识别sers谱图的方法 | |
| Fu et al. | The crosstalk fluorescence spectroscopy analysis principle and an accurate fluorescence quantitative method for multi-composition fluorescence substances | |
| CN118518655A (zh) | 土壤全氮含量检测方法、装置、电子设备及存储介质 | |
| JP7752041B2 (ja) | スペクトル解析方法、装置およびシステム | |
| Rasekh et al. | Environmental assessment of soluble solids contents and pH of orange using hyperspectral method and machine learning | |
| KR101951758B1 (ko) | 라만 분광을 이용한 지방 혼합물 내의 돼지 지방 정량 분석 방법 및 장치 | |
| CN119112099B (zh) | 自体荧光组织的探测装置、探测方法及存储介质 | |
| CN116026808B (zh) | 一种拉曼光谱判别方法和系统 | |
| Breitman et al. | Study of Raman spectra of pigment mixtures | |
| CN113435115B (zh) | 一种荧光光谱特征波长筛选方法、装置、计算机设备及可读储存介质 | |
| CN116399836A (zh) | 基于交替梯度下降算法的串扰荧光光谱分解方法 | |
| Li et al. | A spectral recovery method for Raman spectroscopy utilizing prior datasets | |
| Kumar | Non-negative factor (NNF) assisted partial Least Square (PLS) analysis of excitation-emission matrix fluorescence spectroscopic data sets: automating the identification and quantification of Multifluorophoric mixtures | |
| Wu et al. | Time-resolved fluorescence spectroscopy and improved parallel factor framework-clustering analysis for oil spill type identification and concentration quantification | |
| Menegon et al. | Improving efficiency and sustainability with a new smart device for the olive oil chain |
Legal Events
| Date | Code | Title | Description |
|---|---|---|---|
| PUAI | Public reference made under article 153(3) epc to a published international application that has entered the european phase |
Free format text: ORIGINAL CODE: 0009012 |
|
| STAA | Information on the status of an ep patent application or granted ep patent |
Free format text: STATUS: THE APPLICATION HAS BEEN PUBLISHED |
|
| AK | Designated contracting states |
Kind code of ref document: A1 Designated state(s): AL AT BE BG CH CY CZ DE DK EE ES FI FR GB GR HR HU IE IS IT LI LT LU LV MC MK MT NL NO PL PT RO RS SE SI SK SM TR |
|
| AX | Request for extension of the european patent |
Extension state: BA ME |
|
| STAA | Information on the status of an ep patent application or granted ep patent |
Free format text: STATUS: REQUEST FOR EXAMINATION WAS MADE |
|
| 17P | Request for examination filed |
Effective date: 20180907 |
|
| RBV | Designated contracting states (corrected) |
Designated state(s): AL AT BE BG CH CY CZ DE DK EE ES FI FR GB GR HR HU IE IS IT LI LT LU LV MC MK MT NL NO PL PT RO RS SE SI SK SM TR |
|
| STAA | Information on the status of an ep patent application or granted ep patent |
Free format text: STATUS: EXAMINATION IS IN PROGRESS |
|
| 17Q | First examination report despatched |
Effective date: 20210429 |
|
| GRAP | Despatch of communication of intention to grant a patent |
Free format text: ORIGINAL CODE: EPIDOSNIGR1 |
|
| STAA | Information on the status of an ep patent application or granted ep patent |
Free format text: STATUS: GRANT OF PATENT IS INTENDED |
|
| RIC1 | Information provided on ipc code assigned before grant |
Ipc: G01J 3/28 20060101ALN20230628BHEP Ipc: G01J 3/02 20060101ALI20230628BHEP Ipc: G01J 3/44 20060101ALI20230628BHEP Ipc: G01J 1/02 20060101ALI20230628BHEP Ipc: G01N 21/27 20060101ALI20230628BHEP Ipc: G01N 21/64 20060101AFI20230628BHEP |
|
| INTG | Intention to grant announced |
Effective date: 20230713 |
|
| GRAS | Grant fee paid |
Free format text: ORIGINAL CODE: EPIDOSNIGR3 |
|
| GRAA | (expected) grant |
Free format text: ORIGINAL CODE: 0009210 |
|
| STAA | Information on the status of an ep patent application or granted ep patent |
Free format text: STATUS: THE PATENT HAS BEEN GRANTED |
|
| AK | Designated contracting states |
Kind code of ref document: B1 Designated state(s): AL AT BE BG CH CY CZ DE DK EE ES FI FR GB GR HR HU IE IS IT LI LT LU LV MC MK MT NL NO PL PT RO RS SE SI SK SM TR |
|
| REG | Reference to a national code |
Ref country code: GB Ref legal event code: FG4D |
|
| RAP4 | Party data changed (patent owner data changed or rights of a patent transferred) |
Owner name: HITACHI HIGH-TECH SCIENCE CORPORATION |
|
| RIN2 | Information on inventor provided after grant (corrected) |
Inventor name: KOZUMA, MICHINARI Inventor name: HOSEN, YUSUKE Inventor name: SATO, YOICHI Inventor name: NAKAMURA, KOICHI Inventor name: HORIGOME, JUN |
|
| REG | Reference to a national code |
Ref country code: DE Ref legal event code: R096 Ref document number: 602017077649 Country of ref document: DE |
|
| REG | Reference to a national code |
Ref country code: CH Ref legal event code: PK Free format text: BERICHTIGUNG B8 Ref country code: CH Ref legal event code: EP |
|
| REG | Reference to a national code |
Ref country code: IE Ref legal event code: FG4D |
|
| PG25 | Lapsed in a contracting state [announced via postgrant information from national office to epo] |
Ref country code: GR Free format text: LAPSE BECAUSE OF FAILURE TO SUBMIT A TRANSLATION OF THE DESCRIPTION OR TO PAY THE FEE WITHIN THE PRESCRIBED TIME-LIMIT Effective date: 20240321 |
|
| REG | Reference to a national code |
Ref country code: LT Ref legal event code: MG9D |
|
| PG25 | Lapsed in a contracting state [announced via postgrant information from national office to epo] |
Ref country code: LT Free format text: LAPSE BECAUSE OF FAILURE TO SUBMIT A TRANSLATION OF THE DESCRIPTION OR TO PAY THE FEE WITHIN THE PRESCRIBED TIME-LIMIT Effective date: 20231220 |
|
| REG | Reference to a national code |
Ref country code: NL Ref legal event code: MP Effective date: 20231220 |
|
| PG25 | Lapsed in a contracting state [announced via postgrant information from national office to epo] |
Ref country code: ES Free format text: LAPSE BECAUSE OF FAILURE TO SUBMIT A TRANSLATION OF THE DESCRIPTION OR TO PAY THE FEE WITHIN THE PRESCRIBED TIME-LIMIT Effective date: 20231220 |
|
| PG25 | Lapsed in a contracting state [announced via postgrant information from national office to epo] |
Ref country code: LT Free format text: LAPSE BECAUSE OF FAILURE TO SUBMIT A TRANSLATION OF THE DESCRIPTION OR TO PAY THE FEE WITHIN THE PRESCRIBED TIME-LIMIT Effective date: 20231220 Ref country code: GR Free format text: LAPSE BECAUSE OF FAILURE TO SUBMIT A TRANSLATION OF THE DESCRIPTION OR TO PAY THE FEE WITHIN THE PRESCRIBED TIME-LIMIT Effective date: 20240321 Ref country code: FI Free format text: LAPSE BECAUSE OF FAILURE TO SUBMIT A TRANSLATION OF THE DESCRIPTION OR TO PAY THE FEE WITHIN THE PRESCRIBED TIME-LIMIT Effective date: 20231220 Ref country code: ES Free format text: LAPSE BECAUSE OF FAILURE TO SUBMIT A TRANSLATION OF THE DESCRIPTION OR TO PAY THE FEE WITHIN THE PRESCRIBED TIME-LIMIT Effective date: 20231220 Ref country code: BG Free format text: LAPSE BECAUSE OF FAILURE TO SUBMIT A TRANSLATION OF THE DESCRIPTION OR TO PAY THE FEE WITHIN THE PRESCRIBED TIME-LIMIT Effective date: 20240320 |
|
| REG | Reference to a national code |
Ref country code: AT Ref legal event code: MK05 Ref document number: 1642867 Country of ref document: AT Kind code of ref document: T Effective date: 20231220 |
|
| PG25 | Lapsed in a contracting state [announced via postgrant information from national office to epo] |
Ref country code: NL Free format text: LAPSE BECAUSE OF FAILURE TO SUBMIT A TRANSLATION OF THE DESCRIPTION OR TO PAY THE FEE WITHIN THE PRESCRIBED TIME-LIMIT Effective date: 20231220 |
|
| PG25 | Lapsed in a contracting state [announced via postgrant information from national office to epo] |
Ref country code: SE Free format text: LAPSE BECAUSE OF FAILURE TO SUBMIT A TRANSLATION OF THE DESCRIPTION OR TO PAY THE FEE WITHIN THE PRESCRIBED TIME-LIMIT Effective date: 20231220 Ref country code: RS Free format text: LAPSE BECAUSE OF FAILURE TO SUBMIT A TRANSLATION OF THE DESCRIPTION OR TO PAY THE FEE WITHIN THE PRESCRIBED TIME-LIMIT Effective date: 20231220 Ref country code: NO Free format text: LAPSE BECAUSE OF FAILURE TO SUBMIT A TRANSLATION OF THE DESCRIPTION OR TO PAY THE FEE WITHIN THE PRESCRIBED TIME-LIMIT Effective date: 20240320 Ref country code: NL Free format text: LAPSE BECAUSE OF FAILURE TO SUBMIT A TRANSLATION OF THE DESCRIPTION OR TO PAY THE FEE WITHIN THE PRESCRIBED TIME-LIMIT Effective date: 20231220 Ref country code: LV Free format text: LAPSE BECAUSE OF FAILURE TO SUBMIT A TRANSLATION OF THE DESCRIPTION OR TO PAY THE FEE WITHIN THE PRESCRIBED TIME-LIMIT Effective date: 20231220 Ref country code: HR Free format text: LAPSE BECAUSE OF FAILURE TO SUBMIT A TRANSLATION OF THE DESCRIPTION OR TO PAY THE FEE WITHIN THE PRESCRIBED TIME-LIMIT Effective date: 20231220 |
|
| PG25 | Lapsed in a contracting state [announced via postgrant information from national office to epo] |
Ref country code: IS Free format text: LAPSE BECAUSE OF FAILURE TO SUBMIT A TRANSLATION OF THE DESCRIPTION OR TO PAY THE FEE WITHIN THE PRESCRIBED TIME-LIMIT Effective date: 20240420 |
|
| PG25 | Lapsed in a contracting state [announced via postgrant information from national office to epo] |
Ref country code: AT Free format text: LAPSE BECAUSE OF FAILURE TO SUBMIT A TRANSLATION OF THE DESCRIPTION OR TO PAY THE FEE WITHIN THE PRESCRIBED TIME-LIMIT Effective date: 20231220 Ref country code: CZ Free format text: LAPSE BECAUSE OF FAILURE TO SUBMIT A TRANSLATION OF THE DESCRIPTION OR TO PAY THE FEE WITHIN THE PRESCRIBED TIME-LIMIT Effective date: 20231220 |
|
| PG25 | Lapsed in a contracting state [announced via postgrant information from national office to epo] |
Ref country code: SK Free format text: LAPSE BECAUSE OF FAILURE TO SUBMIT A TRANSLATION OF THE DESCRIPTION OR TO PAY THE FEE WITHIN THE PRESCRIBED TIME-LIMIT Effective date: 20231220 |
|
| PG25 | Lapsed in a contracting state [announced via postgrant information from national office to epo] |
Ref country code: SM Free format text: LAPSE BECAUSE OF FAILURE TO SUBMIT A TRANSLATION OF THE DESCRIPTION OR TO PAY THE FEE WITHIN THE PRESCRIBED TIME-LIMIT Effective date: 20231220 Ref country code: SK Free format text: LAPSE BECAUSE OF FAILURE TO SUBMIT A TRANSLATION OF THE DESCRIPTION OR TO PAY THE FEE WITHIN THE PRESCRIBED TIME-LIMIT Effective date: 20231220 Ref country code: RO Free format text: LAPSE BECAUSE OF FAILURE TO SUBMIT A TRANSLATION OF THE DESCRIPTION OR TO PAY THE FEE WITHIN THE PRESCRIBED TIME-LIMIT Effective date: 20231220 Ref country code: IT Free format text: LAPSE BECAUSE OF FAILURE TO SUBMIT A TRANSLATION OF THE DESCRIPTION OR TO PAY THE FEE WITHIN THE PRESCRIBED TIME-LIMIT Effective date: 20231220 Ref country code: IS Free format text: LAPSE BECAUSE OF FAILURE TO SUBMIT A TRANSLATION OF THE DESCRIPTION OR TO PAY THE FEE WITHIN THE PRESCRIBED TIME-LIMIT Effective date: 20240420 Ref country code: EE Free format text: LAPSE BECAUSE OF FAILURE TO SUBMIT A TRANSLATION OF THE DESCRIPTION OR TO PAY THE FEE WITHIN THE PRESCRIBED TIME-LIMIT Effective date: 20231220 Ref country code: CZ Free format text: LAPSE BECAUSE OF FAILURE TO SUBMIT A TRANSLATION OF THE DESCRIPTION OR TO PAY THE FEE WITHIN THE PRESCRIBED TIME-LIMIT Effective date: 20231220 Ref country code: AT Free format text: LAPSE BECAUSE OF FAILURE TO SUBMIT A TRANSLATION OF THE DESCRIPTION OR TO PAY THE FEE WITHIN THE PRESCRIBED TIME-LIMIT Effective date: 20231220 |
|
| PG25 | Lapsed in a contracting state [announced via postgrant information from national office to epo] |
Ref country code: PT Free format text: LAPSE BECAUSE OF FAILURE TO SUBMIT A TRANSLATION OF THE DESCRIPTION OR TO PAY THE FEE WITHIN THE PRESCRIBED TIME-LIMIT Effective date: 20240422 Ref country code: PL Free format text: LAPSE BECAUSE OF FAILURE TO SUBMIT A TRANSLATION OF THE DESCRIPTION OR TO PAY THE FEE WITHIN THE PRESCRIBED TIME-LIMIT Effective date: 20231220 |
|
| REG | Reference to a national code |
Ref country code: DE Ref legal event code: R097 Ref document number: 602017077649 Country of ref document: DE |
|
| PG25 | Lapsed in a contracting state [announced via postgrant information from national office to epo] |
Ref country code: DK Free format text: LAPSE BECAUSE OF FAILURE TO SUBMIT A TRANSLATION OF THE DESCRIPTION OR TO PAY THE FEE WITHIN THE PRESCRIBED TIME-LIMIT Effective date: 20231220 |
|
| PLBE | No opposition filed within time limit |
Free format text: ORIGINAL CODE: 0009261 |
|
| STAA | Information on the status of an ep patent application or granted ep patent |
Free format text: STATUS: NO OPPOSITION FILED WITHIN TIME LIMIT |
|
| PG25 | Lapsed in a contracting state [announced via postgrant information from national office to epo] |
Ref country code: SI Free format text: LAPSE BECAUSE OF FAILURE TO SUBMIT A TRANSLATION OF THE DESCRIPTION OR TO PAY THE FEE WITHIN THE PRESCRIBED TIME-LIMIT Effective date: 20231220 |
|
| PG25 | Lapsed in a contracting state [announced via postgrant information from national office to epo] |
Ref country code: SI Free format text: LAPSE BECAUSE OF FAILURE TO SUBMIT A TRANSLATION OF THE DESCRIPTION OR TO PAY THE FEE WITHIN THE PRESCRIBED TIME-LIMIT Effective date: 20231220 Ref country code: DK Free format text: LAPSE BECAUSE OF FAILURE TO SUBMIT A TRANSLATION OF THE DESCRIPTION OR TO PAY THE FEE WITHIN THE PRESCRIBED TIME-LIMIT Effective date: 20231220 |
|
| 26N | No opposition filed |
Effective date: 20240923 |
|
| PG25 | Lapsed in a contracting state [announced via postgrant information from national office to epo] |
Ref country code: MC Free format text: LAPSE BECAUSE OF FAILURE TO SUBMIT A TRANSLATION OF THE DESCRIPTION OR TO PAY THE FEE WITHIN THE PRESCRIBED TIME-LIMIT Effective date: 20231220 |
|
| REG | Reference to a national code |
Ref country code: CH Ref legal event code: PL |
|
| PG25 | Lapsed in a contracting state [announced via postgrant information from national office to epo] |
Ref country code: LU Free format text: LAPSE BECAUSE OF NON-PAYMENT OF DUE FEES Effective date: 20240906 |
|
| GBPC | Gb: european patent ceased through non-payment of renewal fee |
Effective date: 20240906 |
|
| PG25 | Lapsed in a contracting state [announced via postgrant information from national office to epo] |
Ref country code: GB Free format text: LAPSE BECAUSE OF NON-PAYMENT OF DUE FEES Effective date: 20240906 |
|
| REG | Reference to a national code |
Ref country code: BE Ref legal event code: MM Effective date: 20240930 |
|
| PG25 | Lapsed in a contracting state [announced via postgrant information from national office to epo] |
Ref country code: BE Free format text: LAPSE BECAUSE OF NON-PAYMENT OF DUE FEES Effective date: 20240930 |
|
| PG25 | Lapsed in a contracting state [announced via postgrant information from national office to epo] |
Ref country code: CH Free format text: LAPSE BECAUSE OF NON-PAYMENT OF DUE FEES Effective date: 20240930 |
|
| REG | Reference to a national code |
Ref country code: DE Ref legal event code: R081 Ref document number: 602017077649 Country of ref document: DE Owner name: HITACHI HIGH-TECH ANALYSIS CORPORATION, JP Free format text: FORMER OWNER: HITACHI HIGH-TECH SCIENCE CORPORATION, TOKYO, JP |
|
| PG25 | Lapsed in a contracting state [announced via postgrant information from national office to epo] |
Ref country code: IE Free format text: LAPSE BECAUSE OF NON-PAYMENT OF DUE FEES Effective date: 20240906 |
|
| PGFP | Annual fee paid to national office [announced via postgrant information from national office to epo] |
Ref country code: DE Payment date: 20250730 Year of fee payment: 9 |
|
| PGFP | Annual fee paid to national office [announced via postgrant information from national office to epo] |
Ref country code: FR Payment date: 20250808 Year of fee payment: 9 |
|
| PG25 | Lapsed in a contracting state [announced via postgrant information from national office to epo] |
Ref country code: CY Free format text: LAPSE BECAUSE OF FAILURE TO SUBMIT A TRANSLATION OF THE DESCRIPTION OR TO PAY THE FEE WITHIN THE PRESCRIBED TIME-LIMIT; INVALID AB INITIO Effective date: 20170906 |
|
| PG25 | Lapsed in a contracting state [announced via postgrant information from national office to epo] |
Ref country code: HU Free format text: LAPSE BECAUSE OF FAILURE TO SUBMIT A TRANSLATION OF THE DESCRIPTION OR TO PAY THE FEE WITHIN THE PRESCRIBED TIME-LIMIT; INVALID AB INITIO Effective date: 20170906 |