EP3343377A1 - Procédé de débogage, processeur multi-coeurs et équipement de débogage - Google Patents
Procédé de débogage, processeur multi-coeurs et équipement de débogage Download PDFInfo
- Publication number
- EP3343377A1 EP3343377A1 EP16848167.9A EP16848167A EP3343377A1 EP 3343377 A1 EP3343377 A1 EP 3343377A1 EP 16848167 A EP16848167 A EP 16848167A EP 3343377 A1 EP3343377 A1 EP 3343377A1
- Authority
- EP
- European Patent Office
- Prior art keywords
- core
- debugging
- running
- preset event
- reason
- Prior art date
- Legal status (The legal status is an assumption and is not a legal conclusion. Google has not performed a legal analysis and makes no representation as to the accuracy of the status listed.)
- Withdrawn
Links
Images





Classifications
-
- G—PHYSICS
- G06—COMPUTING OR CALCULATING; COUNTING
- G06F—ELECTRIC DIGITAL DATA PROCESSING
- G06F11/00—Error detection; Error correction; Monitoring
- G06F11/36—Prevention of errors by analysis, debugging or testing of software
- G06F11/362—Debugging of software
-
- G—PHYSICS
- G06—COMPUTING OR CALCULATING; COUNTING
- G06F—ELECTRIC DIGITAL DATA PROCESSING
- G06F11/00—Error detection; Error correction; Monitoring
- G06F11/22—Detection or location of defective computer hardware by testing during standby operation or during idle time, e.g. start-up testing
- G06F11/2205—Detection or location of defective computer hardware by testing during standby operation or during idle time, e.g. start-up testing using arrangements specific to the hardware being tested
- G06F11/2236—Detection or location of defective computer hardware by testing during standby operation or during idle time, e.g. start-up testing using arrangements specific to the hardware being tested to test CPU or processors
- G06F11/2242—Detection or location of defective computer hardware by testing during standby operation or during idle time, e.g. start-up testing using arrangements specific to the hardware being tested to test CPU or processors in multi-processor systems, e.g. one processor becoming the primary tester
-
- G—PHYSICS
- G06—COMPUTING OR CALCULATING; COUNTING
- G06F—ELECTRIC DIGITAL DATA PROCESSING
- G06F11/00—Error detection; Error correction; Monitoring
- G06F11/36—Prevention of errors by analysis, debugging or testing of software
-
- G—PHYSICS
- G06—COMPUTING OR CALCULATING; COUNTING
- G06F—ELECTRIC DIGITAL DATA PROCESSING
- G06F11/00—Error detection; Error correction; Monitoring
- G06F11/36—Prevention of errors by analysis, debugging or testing of software
- G06F11/362—Debugging of software
- G06F11/3636—Debugging of software by tracing the execution of the program
-
- G—PHYSICS
- G06—COMPUTING OR CALCULATING; COUNTING
- G06F—ELECTRIC DIGITAL DATA PROCESSING
- G06F11/00—Error detection; Error correction; Monitoring
- G06F11/36—Prevention of errors by analysis, debugging or testing of software
- G06F11/362—Debugging of software
- G06F11/3648—Debugging of software using additional hardware
-
- G—PHYSICS
- G06—COMPUTING OR CALCULATING; COUNTING
- G06F—ELECTRIC DIGITAL DATA PROCESSING
- G06F11/00—Error detection; Error correction; Monitoring
- G06F11/36—Prevention of errors by analysis, debugging or testing of software
- G06F11/3698—Environments for analysis, debugging or testing of software
-
- G—PHYSICS
- G06—COMPUTING OR CALCULATING; COUNTING
- G06F—ELECTRIC DIGITAL DATA PROCESSING
- G06F9/00—Arrangements for program control, e.g. control units
- G06F9/06—Arrangements for program control, e.g. control units using stored programs, i.e. using an internal store of processing equipment to receive or retain programs
- G06F9/46—Multiprogramming arrangements
- G06F9/54—Interprogram communication
- G06F9/545—Interprogram communication where tasks reside in different layers, e.g. user- and kernel-space
Definitions
- Program debugging is a process in which a compiled computer program is tested manually or by using a method such as a compiling program before the compiled computer program is put into actual operation, so as to correct a syntax error and a logic error. This is an indispensable step for ensuring correctness of a computer information system. Therefore, the compiled computer program needs to be loaded into a computer for debugging.
- kernel mode code code that runs in kernel space
- user mode code code that runs in user space
- different debugging platforms need to be used to debug the kernel mode code and the user mode code.
- a target machine described below refers to a physical machine in which the debugged code runs
- a host machine refers to a physical machine in which a debugger runs.
- a debugger when user mode code is debugged, a debugger needs to run in an operating system of a target machine to perform local debugging; or when user mode code is debugged, a process tracing module (Ptrace) needs to be implanted into an operating system of a target machine, a debugging stub may further need to run in the operating system, and then a debugger runs in a host machine to perform remote debugging.
- a kernel debugger When kernel mode code such as a kernel module is debugged, a kernel debugger needs to be implanted into an operating system of a target machine, and then a debugger runs in a host machine to perform remote debugging.
- Embodiments of the present invention provide a debugging method, a multi-core processor, and a debugging device, so as to debug kernel mode code and user mode code on a same debugging platform.
- an embodiment of the present invention provides a debugging method, applied to a target machine in a remote debugging system, where the target machine includes a multi-core processor, and the method includes:
- the debugging information collection function includes a debugging interface function, a first debugging exception instruction is set in a header of the debugging interface function, and the first debugging exception instruction is used to instruct the core A to stop running; and the starting, by a core A after completing execution of a preset event processing routine, to stop running, and sending a running stop signal to other cores in a process of stopping running specifically includes: after completing the execution of the preset event processing routine, starting, by the core A, to execute the first debugging exception instruction located in the header of the debugging interface function, and sending the running stop signal to the other cores in a process of executing the first debugging exception instruction.
- the debugging information collection function further includes a function associated with the preset event, a second debugging exception instruction is further set in a trailer of the debugging interface function, and the second debugging exception instruction is used to instruct the core A to stop running; and the executing, by the core A, a debugging information collection function to collect debugging information of the preset event, and stopping running after completing the execution of the debugging information collection function specifically includes: executing, by the core A, the function associated with the preset event to collect the debugging information of the preset event, and then executing the second debugging exception instruction located in the trailer of the debugging interface function.
- the function associated with the preset event is located in a kernel debugging stub, and the kernel debugging stub is implanted into an operating system of the target machine in advance.
- a fourth implementation manner of the first aspect if the preset event is the kernel module unloading function, the operation object of the preset event is a kernel module; if the preset event is the process deletion function, the operation object of the preset event is a process; and if the preset event is the thread deletion function, the operation object of the preset event is a thread.
- the debugging information of the preset event includes an identifier of the operation object of the preset event.
- the multi-core processor is integrated into a system on chip SOC; the sending, by a core A, a running stop signal to other cores, where the running stop signal is used to instruct the other cores to stop running specifically includes:
- an embodiment of the present invention provides a debugging method, executed by a debugging apparatus deployed in a host machine, where the host machine is located in a remote debugging system, and the method includes:
- the reason that the core A stops running is a reason other than the preset event, instructing, by the debugging apparatus, the core A to resume running, to collect the debugging information of the preset event.
- the debugging information of the preset event includes an identifier of the operation object of the preset event; and the obtaining, by the debugging apparatus, debugging information of the preset event, and masking an operation object of the preset event according to the debugging information of the preset event specifically includes: obtaining, by the debugging apparatus, the identifier of the operation object of the preset event, and masking the operation object of the preset event according to the identifier of the operation object of the preset event.
- the debugging apparatus includes a debugger and a debugging agent; the determining, by the debugging apparatus after determining that a core A stops running, a reason that the core A stops running, and if the reason that the core A stops running is a preset event, obtaining, by the debugging apparatus, debugging information of the preset event, and masking an operation object of the preset event according to the debugging information of the preset event specifically includes:
- the determining, by the debugging apparatus after determining that a core A stops running, a reason that the core A stops running, and if the reason that the core A stops running is a reason other than the preset event, instructing, by the debugging apparatus, the core A to resume running, to collect the debugging information of the preset event specifically includes: after determining, in a polling manner, that the core A stops running, determining, by the debugging agent, the reason that the core A stops running, and if the reason that the core A stops running is a reason other than the preset event, sending, by the debugging agent, a first stop termination instruction to the core A, where the first stop termination instruction is used to instruct the core A to resume running, to collect the debugging information of the preset event.
- the debugging apparatus includes the debugger and the debugging agent; and the determining, by the debugging apparatus after determining that a core A stops running, a reason that the core A stops running, and if the reason that the core A stops running is a reason other than the preset event, instructing, by the debugging apparatus, the core A to resume running, to collect the debugging information of the preset event specifically includes:
- the preset event is the kernel module unloading function
- the operation object of the preset event is a kernel module
- the preset event is the process deletion function
- the operation object of the preset event is a process
- the preset event is the thread deletion function
- an embodiment of the present invention provides a multi-core processor, applied to a target machine in a remote debugging system, where the multi-core processor includes a core A, other cores, and an input port, and the other cores refer to all cores that are located in the multi-core processor and that belong to a same logical group as the core A, where the core A is configured to: start to stop running after completing execution of a preset event processing routine, and send a running stop signal to the other cores in a process of stopping running, where the running stop signal is used to instruct the other cores to stop running, and the preset event is a kernel module unloading function, a process deletion function, or a thread deletion function; the input port is configured to: receive a first stop termination instruction, and forward the first stop termination instruction to the core A, where the first stop termination instruction is sent by a debugging apparatus in the remote debugging system after the debugging apparatus determines that the core A stops running and that a reason that the core A stops running
- the debugging information collection function includes a debugging interface function, a first debugging exception instruction is set in a header of the debugging interface function, and the first debugging exception instruction is used to instruct the core A to stop running; and the core A is specifically configured to: after completing the execution of the preset event processing routine, start to execute the first debugging exception instruction located in the header of the debugging interface function, and send the running stop signal to the other cores in a process of executing the first debugging exception instruction.
- the debugging information collection function further includes a function associated with the preset event, a second debugging exception instruction is further set in a trailer of the debugging interface function, and the second debugging exception instruction is used to instruct the core A to stop running; and the core A is specifically configured to: execute the function associated with the preset event to collect the debugging information of the preset event, and then execute the second debugging exception instruction located in the trailer of the debugging interface function.
- the function associated with the preset event is located in a kernel debugging stub, and the kernel debugging stub is implanted into an operating system of the target machine in advance.
- a fourth implementation manner of the third aspect if the preset event is the kernel module unloading function, the operation object of the preset event is a kernel module; if the preset event is the process deletion function, the operation object of the preset event is a process; and if the preset event is the thread deletion function, the operation object of the preset event is a thread.
- the debugging information of the preset event includes an identifier of the operation object of the preset event.
- the multi-core processor is integrated into a system on chip SOC; the core A is specifically configured to send the running stop signal to the other cores by using a hardware cross-trigger network of the SOC, where the running stop signal is used to instruct the other cores to stop running; and the core A is specifically configured to send the running resumption instruction to the other cores by using the hardware cross-trigger network of the SOC, where the running resumption instruction is used to instruct the other cores to resume running.
- an embodiment of the present invention provides a debugging apparatus, where the debugging apparatus is deployed in a host machine in a remote debugging system, and the debugging device includes a debugging unit and a receiving unit, where the receiving unit is configured to: receive a message used for instructing a core A to stop running, and forward the message used for instructing the core A to stop running to the debugging unit, where a target machine located in the remote debugging system includes a multi-core processor, and the multi-core processor includes the core A; the debugging unit is configured to: after determining that the core A stops running, determine a reason that the core A stops running; if the reason that the core A stops running is a preset event, the debugging apparatus is further configured to: obtain debugging information of the preset event, and mask an operation object of the preset event according to the debugging information of the preset event, where the preset event is a kernel module unloading function, a process deletion function, or a thread
- the debugging apparatus is further configured to instruct the core A to resume running, to collect the debugging information of the preset event.
- the debugging information of the preset event includes an identifier of the operation object of the preset event; and the debugging apparatus is specifically configured to: obtain the identifier of the operation object of the preset event, and mask the operation object of the preset event according to the identifier of the operation object of the preset event.
- the debugging apparatus includes a debugger and a debugging agent; the debugging agent is specifically configured to: after determining that the core A stops running, determine the reason that the core A stops running, and if the reason that the core A stops running is the preset event, report a second message to the debugger, where the second message includes an identifier indicating that the core A stops running and an identifier of the preset event; the debugger is specifically configured to: after receiving the second message, obtain the debugging information of the preset event, and mask the operation object of the preset event according to the debugging information of the preset event; and the debugger is specifically configured to instruct the debugging agent to send a second stop termination instruction to the core A, where the second stop termination instruction is used to instruct the core A to resume running.
- the debugging agent is specifically configured to: after determining that the core A stops running, determine the reason that the core A stops running, and if the reason that the core A stops running is a reason other than the preset event, send a first stop termination instruction to the core A, where the first stop termination instruction is used to instruct the core A to resume running, to collect the debugging information of the preset event.
- the debugging apparatus includes the debugger and the debugging agent; the debugging agent is specifically configured to: after determining that the core A stops running, determine the reason that the core A stops running, and if the reason that the core A stops running is a reason other than the preset event, report a first message to the debugger, where the first message includes the identifier indicating that the core A stops running and a default identifier; and the debugger is specifically configured to: after receiving the first message, instruct the debugging agent to send a first stop termination instruction to the core A, where the first stop termination instruction is used to instruct the core A to resume running, to collect the debugging information of the preset event.
- an embodiment of the present invention provides a debugging device, including a processor and a memory; the processor is configured to: after determining that the core A stops running, determine a reason that the core A stops running, where a target machine located in the remote debugging system includes a multi-core processor, and the multi-core processor includes the core A; if the reason that the core A stops running is a preset event, the processor is configured to: obtain debugging information of the preset event, and mask an operation object of the preset event according to the debugging information of the preset event, where the preset event is a kernel module unloading function, a process deletion function, or a thread deletion function, and the operation object of the preset event is a kernel module, a process, or a thread; the memory is configured to store the debugging information of the preset event; and the processor is further configured to instruct the core A to resume running.
- the processor is further configured to instruct the core A to resume running, to collect the debugging information of the preset event.
- the debugging information of the preset event includes an identifier of the operation object of the preset event; and the processor is specifically configured to: obtain the identifier of the operation object of the preset event, and mask the operation object of the preset event according to the identifier of the operation object of the preset event.
- the operation object of the preset event is a kernel module
- the preset event is the process deletion function
- the operation object of the preset event is a process
- the preset event is the thread deletion function
- a debugging interface function is added to a trailer of a preset event that runs on a core A.
- the debugging interface function invokes a function that is associated with a type of the preset event and that is in a kernel debugging stub, to obtain debugging information of the preset event.
- a debugger masks an operation object of the preset event according to the debugging information of the preset event.
- the preset event is a kernel module unloading function, a process deletion function, or a thread deletion function
- the operation object of the preset event is a kernel module, a process, or a thread
- the kernel module is kernel mode code
- the process and the thread are user mode code. Therefore, by means of the technical solution provided in the embodiments of the present invention, the kernel mode code and the user mode code can be masked on a same debugging platform.
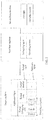
- this embodiment of the present invention provides a debugging method applied to a remote debugging system shown in FIG. 1 .
- the remote debugging system includes a target machine and a host machine, the target machine includes a multi-core processor, and a debugging apparatus is deployed in the host machine.
- the target machine and the host machine are different physical hosts, and the target machine is in communication connection with the host machine.
- the multi-core processor may be a homogeneous multi-core processor, or may be a heterogeneous multi-core processor. If the target machine includes multiple multi-core processors, a core A may be any core of any multi-core processor in the target machine, instead of a specified core of a specified multi-core processor in the target machine.
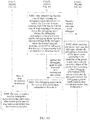
- the debugging method provided in this embodiment of the present invention includes the following steps.
- the core A starts to stop running after completing execution of a preset event processing routine, and sends a running stop signal to other cores in a process of stopping running, where the running stop signal is used to instruct the other cores to stop running, the other cores refer to all cores that are located in the multi-core processor and that belong to a same logical group as the core A, and the preset event is a kernel module unloading function, a process deletion function, or a thread deletion function.
- a debugging interface function is added to a trailer of the preset event.
- the debugging interface function is located outside the preset event, and is not a part of the preset event.
- a first debugging exception instruction is set in a header of the debugging interface function, and the core A stops running after completing execution of the first debugging exception instruction.
- a second debugging exception instruction is further set in a trailer of the debugging interface function, and the core A stops running after completing execution of the second debugging exception instruction.
- the core A starts to stop running after completing execution of a preset event processing routine, and sends a running stop signal to other cores in a process of stopping running includes: After completing the execution of the preset event processing routine, the core A starts to execute the first debugging exception instruction located in the header of the debugging interface function, and sends the running stop signal to the other cores in a process of executing the first debugging exception instruction. It should be noted that, the core A executes the first debugging exception instruction for a period of time.
- the core A starts to execute the first debugging exception instruction, then sends the running stop signal to the other cores at a moment before the execution of the first debugging exception instruction is completed, and continues to execute the first debugging exception instruction after sending the running stop signal to the other cores.
- the core A stops running after completing the execution of the first debugging exception instruction.
- Logical grouping means that multiple cores in a service association relationship are classified into a same logical group by a debugging engineer according to experience.
- the core A, a core B, a core C, and a core D are located in a same logical group.
- that the core A sends a running stop signal to other cores is specifically: The core A sends the running stop signal to the core B, the core C, and the core D.
- the target machine includes a system on chip SOC
- the multi-core processor including the core A is integrated into the SOC
- that the core A sends a running stop signal to other cores, where the running stop signal is used to instruct the other cores to stop running is specifically:
- the core A sends the running stop signal to the other cores by using a hardware cross-trigger network of the SOC, where the running stop signal is used to instruct the other cores to stop running.
- the core A when sending a running resumption instruction to the other cores by using the hardware cross-trigger network of the SOC, the core A sends the running resumption instruction in a broadcast manner.
- An advantage of transmitting a signal by using the hardware cross-trigger network of the system on chip SOC lies in: Compared with transmitting a signal by using software, transmitting a signal by using hardware can improve time validity of transmission of the running stop signal.
- the debugging apparatus After determining that the core A stops running, the debugging apparatus determines a reason that the core A stops running, and if the reason that the core A stops running is a reason other than the preset event, the debugging apparatus sends a first stop termination instruction to the core A, where the first stop termination instruction is used to instruct the core A to resume running.
- the core A during debugging of the core A, if the core B continues to run, distortion may occur because data exchange cannot be correctly performed between the code that runs on the core B and the code that runs on the core A. Therefore, in the solution provided in this embodiment of the present invention, during debugging of the core A, the other cores that belong to the same logical group as the core A stop running, to avoid distortion. Further, the core A and the other cores first stop running synchronously, and then the core A resumes running for debugging. In addition, in order that the core A and the other cores stop running synchronously, a time at which the running stop signal sent by the core A is transmitted to the other cores and a time at which the core A stops running are further fully considered in design of the solution. Specifically, after starting to stop running, the core A sends a running stop instruction to the other cores in a period of stopping running, so that the core A and the other cores stop running synchronously, and relatively precise synchronous debugging is further implemented.
- the preset storage space is specified by a debugging engineer in the memory of the target machine in advance, and both a size and an address of the preset storage space are fixed.
- the preset storage space is used to store a data header. Initially, the data header includes first default information and an address of a data body, and certainly, the first default information may be empty.
- the data body includes second default information, and certainly, the second default information may also be empty.
- the debugging apparatus determines a reason that the core A stops running in S302 specifically includes: After determining, in a polling manner, that the core A stops running, the debugging apparatus determines, by reading content of the data header, the reason that the core A stops running; and because the content of the data header includes the first default information, the debugging apparatus can determine, according to the first default information, that the reason that the core A stops running is a reason other than the preset event.
- the debugging apparatus includes a debugging agent and a debugger, and the debugging apparatus is applied to the remote debugging system described in FIG. 2 .
- the debugging agent and the debugger may be located in a same host machine, or may be located in different host machines.
- the debugging agent is located in a first host machine, and the debugger is located in a second host machine.
- S302 in FIG. 3 specifically includes the following steps.
- the debugging agent After determining, in a polling manner, that the core A stops running, the debugging agent determines the reason that the core A stops running, and if the reason that the core A stops running is a reason other than the preset event, the debugging agent reports a first message to the debugger, where the first message includes an identifier indicating that the core A stops running and a default identifier.
- S402 specifically includes: After determining, in a polling manner, that the core A stops running, the debugging agent determines, by reading the content of the data header, the reason that the core A stops running; and because the content of the data header includes the first default information, the debugging agent can determine, according to the first default information, that the reason that the core A stops running is a reason other than the preset event, and report, to the debugger, the first message including the identifier indicating that the core A stops running and the default identifier.
- the debugger instructs the debugging agent to send the first stop termination instruction to the core A, where the first stop termination instruction is used to instruct the core A to resume running.
- the debugging agent sends the first stop termination instruction to the core A.
- S302 in FIG. 3 specifically includes: After determining, in a polling manner, that the core A stops running, the debugging agent determines the reason that the core A stops running, and if the reason that the core A stops running is a reason other than the preset event, the debugging agent sends the first stop termination instruction to the core A.
- the first stop termination instruction is used to instruct the core A to resume running.
- step S402 the debugging agent no longer reports, to the debugger, the first message including the identifier indicating that the core A stops running and the default identifier. Instead, the debugging agent sends the first stop termination instruction to the core A after reading the first default information from the data header and determining that the reason that the core A stops running is a reason other than the preset event.
- a difference between this embodiment and the foregoing embodiment lies in:
- the debugging agent sends the first stop termination instruction to the core A because the debugging agent determines that the reason that the core A stops running is a reason other than the preset event, instead of receiving an instruction of the debugger.
- the debugger agent shares more work of the debugger in this embodiment. Therefore, fewer function requirements are imposed on the debugger, which helps to simplify the debugger.
- the core A executes a debugging information collection function to collect debugging information of the preset event, and stops running after completing the execution of the debugging information collection function.
- the debugging information collection function includes the debugging interface function added to the trailer of the preset event and a function associated with the preset event.
- the function associated with the preset event is located in a kernel debugging stub, and the kernel debugging stub is implanted into an operating system of the target machine in advance.
- the first debugging exception instruction is set in the header of the debugging interface function
- the second debugging exception instruction is set in the trailer of the debugging interface function.
- S303 includes: The core A executes the function associated with the preset event to collect the debugging information of the preset event, and then executes the second debugging exception instruction located in the trailer of the debugging interface function. The core A stops running after the core A completes the execution of the second debugging exception instruction.
- the debugging information of the preset event includes an identifier of the preset event and an identifier of an operation object of the preset event. It can be learned that an information amount of the debugging information of the preset event is relatively small, and is generally only about 100 rows. Therefore, according to the technical solution provided in this embodiment of the present invention, an amount of data to be processed by a processor of a target machine can be reduced, thereby improving debugging efficiency.
- the debugging apparatus After determining that the core A stops running, the debugging apparatus determines the reason that the core A stops running, and if the reason that the core A stops running is the preset event, the debugging apparatus obtains the debugging information of the preset event, and masks an operation object of the preset event according to the debugging information of the preset event, where the operation object of the preset event is a kernel module, a process, or a thread.
- the debugging apparatus sends a second stop termination instruction to the core A.
- the second stop termination instruction is used to instruct the core A to resume running.
- the debugging apparatus masks the operation object of the preset event to prevent a debugging engineer from debugging the operation object of the preset event again subsequently. This is a specific debugging form, and is also a debugging method.
- the core A if the core A stops running after completing the execution of the debugging information collection function, in a process of executing the debugging information collection function, the core A writes, into the data header to replace default information, an identifier that is of the preset event and is used for triggering the core A to execute the debugging information collection function, and writes the identifier of the operation object of the preset event into the data body.
- the preset event is the kernel module unloading function, the process deletion function, or the thread deletion function
- the debugging information collection function includes the identifier of the preset event and the identifier of the operation object of the preset event.
- the debugging apparatus determines the reason that the core A stops running in S304 specifically includes: After determining, in a polling manner, that the core A stops running, the debugging apparatus determines, by reading the content of the data header, the reason that the core A stops running; and because the content of the data header includes the identifier of the preset event, the debugging apparatus can determine, according to the identifier of the preset event, that the reason that the core A stops running is the preset event.
- the debugging apparatus obtains the debugging information of the preset event, and sets a preset pending breakpoint as an operation object of the preset event according to the debugging information of the preset event in S304 specifically includes: The debugging apparatus reads, from the data body, the identifier of the operation object of the preset event according to the address of the data body located in the data header, and then masks the operation object of the preset event according to the identifier of the operation object of the preset event.
- the preset event is the kernel module unloading function, the process deletion function, or the thread deletion function
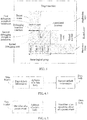
- the core A stops running after completing the execution of the debugging information collection function content of the data header and the data body is shown in FIG. 6.2 .
- the core A stops running due to another event content of the data header and the data body is shown in FIG. 6.1 .
- the execution of the debugging information collection function is completed is excluded from the another event. That is, the data header and the data body include only one message.
- the debugging apparatus does not need to distinguish which is target information.
- the data header and the data body include only one message, the size of the preset storage space in the memory of the target machine is fixed, and space occupied by the preset storage is extremely small, thereby avoiding occupying excessive storage resources of the target machine, and improving efficiency of obtaining information.
- the operation object of the preset event is a kernel module. If the preset event is the process deletion function, the operation object of the preset event is a process. If the preset event is the thread deletion function, the operation object of the preset event is a thread.
- the kernel module may be a dynamic patch, a hot patch, a dynamic library, or the like.
- the debugging apparatus includes a debugging agent and a debugger, and the debugging apparatus is applied to the remote debugging system described in FIG. 2 .
- the debugging agent and the debugger may be located in a same host machine, or may be located in different host machines.
- the debugging agent is located in a first host machine, and the debugger is located in a second host machine.
- S304 in FIG. 3 specifically includes the following steps.
- the debugging agent After determining that the core A stops running, the debugging agent determines the reason that the core A stops running, and if the reason that the core A stops running is the preset event, the debugging agent reports a second message to the debugger, where the second message includes the identifier indicating that the core A stops running and an identifier of the preset event.
- S406 specifically includes: After determining, in a polling manner, that the core A stops running, the debugging agent determines, by reading the content of the data header, the reason that the core A stops running; and because the content of the data header includes the identifier of the preset event, the debugging agent can determine, according to the identifier of the preset event, that the reason that the core A stops running is the preset event, and report, to the debugger, the second message including the identifier indicating that the core A stops running and the identifier of the preset event.
- the debugger After receiving the second message, the debugger obtains the debugging information of the preset event, and masks the operation object of the preset event according to the debugging information of the preset event.
- the debugger instructs the debugging agent to send the second stop termination instruction to the core A.
- the second stop termination instruction is used to instruct the core A to resume running.
- the debugger obtains the debugging information of the preset event, and masks an operation object of the preset event according to the debugging information of the preset event specifically includes: The debugger reads, from the data body, the identifier of the operation object of the preset event according to the address of the data body located in the data header, and then masks the operation object of the preset event according to the identifier of the operation object of the preset event.
- that "the debugger instructs the debugging agent to send the second stop termination instruction” occurs after “the debugger masks the operation object of the preset event".
- that "the debugger instructs the debugging agent to send the second stop termination instruction” may occur at any moment after “the debugger obtains the identifier of the operation object of the preset event” and before “the debugger masks the operation object of the preset event”.
- the debugging agent sends a second stop termination instruction to the core A.
- the core A sends a running resumption instruction to the other cores after receiving the second stop termination instruction and resuming running, where the running resumption instruction is used to instruct the other cores to resume running.
- the core A sends a running resumption instruction to the other cores, where the running resumption instruction is used to instruct the other cores to resume running is specifically:
- the core A sends the running resumption instruction to the other cores by using the hardware cross-trigger network of the SOC, where the running resumption instruction is used to instruct the other cores to resume running.
- the core A sends the running resumption instruction in a broadcast manner.
- an advantage of transmitting a signal by using the hardware cross-trigger network of the SOC lies in that time validity of transmission of the running resumption instruction can be improved.
- a debugging interface function is added to a trailer of a preset event that runs on a core A.
- the debugging interface function invokes a function that is associated with a type of the preset event and that is in a kernel debugging stub, to obtain debugging information of the preset event.
- a debugger masks an operation object of the preset event according to the debugging information of the preset event.
- the preset event is a kernel mode code processing function or a user mode code processing function. Therefore, by means of the technical solution provided in this embodiment of the present invention, kernel mode code and user mode code can be masked on a same debugging platform.
- this embodiment of the present invention includes a multi-core processor applied to the debugging method described in Embodiment 1, and the multi-core processor is deployed in a target machine in a remote debugging system shown in FIG. 1 .
- the multi-core processor includes a core A, an input port, and other cores.
- the other cores include a core B, a core C, and a core D.
- the core B, the core C, and the core D and the core A all are located in the multi-core processor and belong to a same logical group.
- the core A is configured to: start to stop running after completing execution of a preset event processing routine, and send a running stop signal to the other cores in a process of stopping running.
- the running stop signal is used to instruct the other cores to stop running, and the preset event is a kernel module unloading function, a process deletion function, or a thread deletion function.
- a debugging interface function is added to a trailer of the preset event.
- the debugging interface function is located outside the preset event, and is not a part of the preset event.
- a first debugging exception instruction is set in a header of the debugging interface function, and the core A stops running after completing execution of the first debugging exception instruction. Therefore, the core A is specifically configured to: after completing the execution of the preset event processing routine, start to execute the first debugging exception instruction located in the header of the debugging interface function, and send the running stop signal to the other cores in a process of executing the first debugging exception instruction.
- the core A is specifically configured to send the running stop signal to the other cores by using a hardware cross-trigger network of the SOC.
- the running stop signal is used to instruct the other cores to stop running. It should be noted that, when sending a running resumption instruction to the other cores by using the hardware cross-trigger network of the SOC, the core A sends the running resumption instruction in a broadcast manner.
- synchronous debugging can be implemented by using the multi-core processor provided in this embodiment of the present invention.
- the core A, the core B, the core C, and the core D are located in the same logical group.
- Data exchange is performed between code that runs on at least one core (such as the core B) of the core B, the core C, or the core D and code that runs on the core A.
- the core B continues to run
- distortion may occur because data exchange cannot be correctly performed between the code that runs on the core B and the code that runs on the core A. Therefore, in the solution provided in this embodiment of the present invention, during debugging of the core A, the other cores that belong to the same logical group as the core A stop running, to avoid distortion.
- the input port is configured to: receive a first stop termination instruction, and forward the first stop termination instruction to the core A.
- the first stop termination instruction is sent by a debugging apparatus in the remote debugging system after the debugging apparatus determines that the core A stops running and that a reason that the core A stops running is a reason other than the preset event.
- the core A is further configured to: after receiving the first stop termination instruction and resuming running, execute a debugging information collection function to collect debugging information of the preset event, and stop running after completing the execution of the debugging information collection function.
- a second debugging exception instruction is set in a trailer of the debugging interface function.
- the function that is associated with the preset event and is located in the kernel debugging stub is invoked.
- the core A is specifically configured to: execute the function associated with the preset event to collect the debugging information of the preset event, and then execute the second debugging exception instruction located in the trailer of the debugging interface function.
- the core A stops running after the core A completes the execution of the second debugging exception instruction.
- the debugging information of the preset event includes an identifier of the preset event and an identifier of an operation object of the preset event. It can be learned that an information amount of the debugging information of the preset event is relatively small, and is generally only about 100 rows. Therefore, according to the technical solution provided in this embodiment of the present invention, an amount of data to be processed by a processor of a target machine can be reduced, thereby improving debugging efficiency.
- the input port is further configured to: receive a second stop termination instruction, and forward the second stop termination instruction to the core A.
- the second stop termination instruction is sent by the debugging apparatus after the debugging apparatus masks the operation object of the preset event according to the debugging information of the preset event, and the operation object of the preset event is a kernel module, a process, or a thread.
- the operation object of the preset event is a kernel module. If the preset event is the process deletion function, the operation object of the preset event is a process. If the preset event is the thread deletion function, the operation object of the preset event is a thread.
- the kernel module may be a dynamic patch, a hot patch, a dynamic library, or the like.
- the core A is further configured to send a running resumption instruction to the other cores after receiving the second stop termination instruction and resuming running.
- the running resumption instruction is used to instruct the other cores to resume running.
- the core A is specifically configured to send the running resumption instruction to the other cores by using the hardware cross-trigger network of the SOC.
- the running resumption instruction is used to instruct the other cores to resume running.
- the core A sends the running resumption instruction in a broadcast manner.
- an advantage of transmitting a signal by using the hardware cross-trigger network of the SOC lies in that time validity of transmission of the running resumption instruction can be improved.
- a debugging interface function is added to a trailer of a preset event that runs on a core A.
- the debugging interface function invokes a function that is associated with a type of the preset event and that is in a kernel debugging stub, to obtain debugging information of the preset event. Therefore, a debugging apparatus masks an operation object of the preset event according to the debugging information of the preset event.
- this embodiment of the present invention includes a debugging apparatus applied to the debugging method described in Embodiment 1, and the debugging apparatus is deployed in a host machine in the remote debugging system shown in FIG. 1 .
- the debugging apparatus includes a debugging unit and a receiving unit.
- the receiving unit is configured to: receive a message used for instructing a core A to stop running, and forward the message used for instructing the core A to stop running to the debugging apparatus.
- a target machine located in the remote debugging system includes a multi-core processor, and the multi-core processor includes the core A.
- the debugging unit is configured to: after determining that the core A stops running, determine a reason that the core A stops running.
- the debugging unit is further configured to: obtain debugging information of the preset event, and mask an operation object of the preset event according to the debugging information of the preset event.
- the preset event is a kernel module unloading function, a process deletion function, a thread deletion function, or a user mode code processing function
- the operation object of the preset event is a kernel module, a process, or a thread.
- the debugging unit is further configured to instruct the core A to resume running.
- the operation object of the preset event is a kernel module. If the preset event is the process deletion function, the operation object of the preset event is a process. If the preset event is the thread deletion function, the operation object of the preset event is a thread.
- the kernel module may be a dynamic patch, a hot patch, a dynamic library, or the like.
- the core A if the preset event is the kernel module unloading function, the process deletion function, or the thread deletion function, and the core A stops running after completing execution of the debugging information collection function, in a process of executing the debugging information collection function, the core A writes, into the data header to replace default information, an identifier that is of the preset event and is used for triggering the core A to execute the debugging information collection function, and writes an identifier of the operation object of the preset event into the data body.
- the debugging unit is specifically configured to: after determining that the core A stops running, determine, by reading content of the data header, the reason that the core A stops running. Because the content of the data header includes the identifier of the preset event, the debugging unit can determine, according to the identifier of the preset event, that the reason that the core A stops running is the preset event.
- the debugging unit is specifically configured to: read, from the data body, the identifier of the operation object of the preset event according to the address of the data body located in the data header, and then mask the operation object of the preset event according to the identifier of the operation object of the preset event.
- the debugging unit includes a debugging agent and a debugger.
- the debugging agent and the debugger may be located in a same host machine, or may be located in different host machines. Referring to the remote debugging system shown in FIG. 2 , the debugging agent and the debugger are respectively located in different host machines. The debugging agent is located in a first host machine, and the debugger is located in a second host machine.
- the debugging agent is specifically configured to: after determining that the core A stops running, determine the reason that the core A stops running, and if the reason that the core A stops running is the preset event, report a second message to the debugger.
- the second message includes an identifier indicating that the core A stops running and the identifier of the preset event.
- the debugging agent is specifically configured to: after determining, in a polling manner, that the core A stops running, determine, by reading the identifier that is of the preset event and is included in the content of the data header, that the reason that the core A stops running is the preset event; and report, to the debugger, the second message including the identifier indicating that the core A stops running and the identifier of the preset event.
- the debugger is specifically configured to: after receiving the second message, obtain the debugging information of the preset event, and mask the operation object of the preset event according to the debugging information of the preset event.
- the debugger is specifically configured to: read, from the data body, the identifier of the operation object of the preset event or the identifier of the operation object of the preset event according to the identifier that is of the preset event and is in the second message, and mask the operation object of the preset event according to the debugging information of the preset event.
- the debugger is specifically configured to instruct the debugging agent to send a second stop termination instruction to the core A.
- the second stop termination instruction is used to instruct the core A to resume running.
- the debugging unit in the debugging apparatus is further configured to instruct the core A to resume running, to collect the debugging information of the preset event.
- the debugging unit is specifically configured to: after determining that the core A stops running, determine, by reading the content of the data header, the reason that the core A stops running. Because the content of the data header includes the first default information, the debugging unit can determine, according to the first default information, that the reason that the core A stops running is a reason other than the preset event.
- the debugging agent is specifically configured to: after determining that the core A stops running, determine the reason that the core A stops running, and if the reason that the core A stops running is a reason other than the preset event, send a first stop termination instruction to the core A.
- the first stop termination instruction is used to instruct the core A to resume running, to collect the debugging information of the preset event.
- the debugging agent is specifically configured to: after determining, in a polling manner, that the core A stops running, read the content of the data header that includes the first default information; and determine, according to the first default information, that the reason that the core A stops running is a reason other than the preset event.
- the debugging agent is specifically configured to: after determining, in a polling manner, that the core A stops running, determine the reason that the core A stops running, and if the reason that the core A stops running is a reason other than the preset event, report a first message to the debugger.
- the first message includes the identifier indicating that the core A stops running and a default identifier.
- the debugging agent is specifically configured to: after determining, in a polling manner, that the core A stops running, read the content of the data header that includes the first default information; determine, according to the first default information, that the reason that the core A stops running is a reason other than the preset event; and report, to the debugger, the identifier indicating that the core A stops running and the default identifier.
- the debugger is specifically configured to: after receiving the first message, instruct the debugging agent to send a first stop termination instruction to the core A.
- the first stop termination instruction is used to instruct the core A to resume running.
- the debugging agent is specifically configured to send the first stop termination instruction to the core A.
- the debugging apparatus after determining that a core A of a multi-core processor on a target machine side stops running, if it is determined that the reason that the core A stops running is a preset event, the debugging apparatus obtains, from the target machine side, debugging information of the preset event, and masks an operation object of the preset event according to the debugging information of the preset event, so as to debug the operation object of the preset event.
- the preset event is a kernel module unloading function, a process deletion function, or a thread deletion function
- the operation object of the preset event is a kernel module, a process, or a thread
- the kernel module is kernel mode code
- the process and the thread are user mode code. Therefore, by means of the debugging apparatus provided in this embodiment of the present invention, not only the kernel mode code can be masked, but also the user mode code can be masked.
- FIG. 9 is a structural block diagram of a debugging device 500 according to an embodiment of the present invention.
- the debugging device 500 is applied to the debugging method shown in Embodiment 1 and the remote debugging system shown in FIG. 1
- the debugging device 900 is a specific implementation manner of a host machine in the remote debugging system shown in FIG. 1 .
- the debugging device 500 includes: at least one processor 501, at least one network interface 504 or another user interface 503, a memory 505, and at least one communications bus 502.
- the communications bus 502 is configured to implement connection and communication between these components.
- the debugging device 500 optionally includes the user interface 503, including a display (such as a touchscreen, an LCD, a CTR, a holographic (Holographic) device, or a projector (Projector)), a keyboard or a click device (such as a mouse, a trackball (trackball), a touchpad, or a touchscreen).
- a display such as a touchscreen, an LCD, a CTR, a holographic (Holographic) device, or a projector (Projector)
- a keyboard or a click device such as a mouse, a trackball (trackball), a touchpad, or a touchscreen.
- the memory 505 may include a read-only memory and a random access memory, and may provide an instruction and data for the processor.
- a part of the memory 505 may further include a non-volatile random access memory (NVRAM).
- NVRAM non-volatile random access memory
- the memory 505 stores the following elements, executable modules or data structures, or a subset thereof, or an extension set thereof:
- the processor 501 is configured to: after determining that the core A stops running, determine a reason that the core A stops running.
- a target machine located in the remote debugging system includes a multi-core processor, and the multi-core processor includes the core A.
- the preset storage space is specified by a debugging engineer in the memory of the target machine in advance, and both a size and an address of the preset storage space are fixed.
- the preset storage space is used to store a data header. Initially, the data header includes first default information and an address of a data body, and certainly, the first default information may be empty.
- the data body includes second default information, and certainly, the second default information may also be empty.
- the core A if the preset event is a kernel module unloading function, a process deletion function, or a thread deletion function, and the core A stops running after completing execution of the debugging information collection function, in a process of executing the debugging information collection function, the core A writes, into the data header to replace default information, an identifier that is of the preset event and is used for triggering the core A to execute the debugging information collection function, and writes an identifier of the operation object of the preset event into the data body. As shown in FIG. 6.1 , if the core A stops running due to another reason, the data header still includes the first default information and the address of the data body, and the data body still includes the second default information.
- the processor 901 is specifically configured to: after determining that the core A stops running, determine, by reading content of the data header, the reason that the core A stops running; if the data header includes the identifier of the preset event, determine that the reason that the core A stops running is the preset event; and if the data header includes the first default information, determine that the reason that the core A stops running is a reason other than the preset event.
- the processor 501 is configured to: obtain debugging information of the preset event, and mask the operation object of the preset event according to the debugging information of the preset event.
- the preset event is a kernel module unloading function, a process deletion function, or a thread deletion function
- the operation object of the preset event is a kernel module, a process, or a thread.
- the debugging information of the preset event includes the identifier of the preset event and the identifier of the operation object of the preset event.
- the operation object of the preset event is a kernel module. If the preset event is the process deletion function, the operation object of the preset event is a process. If the preset event is the thread deletion function, the operation object of the preset event is a thread.
- the processor 901 is specifically configured to: read, from the data body, the identifier of the operation object of the preset event according to the address of the data body located in the data header, and then mask the operation object of the preset event according to the identifier of the operation object of the preset event.
- the memory 505 is configured to store the debugging information of the preset event.
- the processor 501 is further configured to instruct the core A to resume running.
- the processor 501 is further configured to instruct the core A to resume running, to collect the debugging information of the preset event.
- the debugging device after determining that a core A of a multi-core processor on a target machine side stops running, if it is determined that the reason that the core A stops running is a preset event, the debugging device obtains, from the target machine side, debugging information of the preset event, and masks an operation object of the preset event according to the debugging information of the preset event.
- the preset event is a kernel module unloading function, a process deletion function, or a thread deletion function
- the operation object of the preset event is a kernel module, a process, or a thread
- the kernel module is kernel mode code
- the process and the thread are user mode code. Therefore, by means of the debugging device provided in this embodiment of the present invention, not only the kernel mode code can be masked, but also the user mode code can be masked.
- the technical solutions of the present invention essentially, or the part contributing to the prior art, or some of the technical solutions may be implemented in a form of a software product.
- the software product is stored in a storage medium, and includes several instructions for instructing a computer device (which may be a personal computer, a server, a network device, or the like) to perform all or some of the steps of the methods described in the embodiments of the present invention.
- the foregoing storage medium includes: any medium that can store program code, such as a USB flash drive, a removable hard disk, a read-only memory (ROM, Read-Only Memory), a random access memory (RAM, Random Access Memory), a magnetic disk, or an optical disc.
Landscapes
- Engineering & Computer Science (AREA)
- Theoretical Computer Science (AREA)
- General Engineering & Computer Science (AREA)
- Computer Hardware Design (AREA)
- Physics & Mathematics (AREA)
- General Physics & Mathematics (AREA)
- Quality & Reliability (AREA)
- Software Systems (AREA)
- Debugging And Monitoring (AREA)
Applications Claiming Priority (2)
| Application Number | Priority Date | Filing Date | Title |
|---|---|---|---|
| CN201510623211.5A CN105354136B (zh) | 2015-09-25 | 2015-09-25 | 一种调试方法、多核处理器和调试设备 |
| PCT/CN2016/099995 WO2017050286A1 (fr) | 2015-09-25 | 2016-09-24 | Procédé de débogage, processeur multi-cœurs et équipement de débogage |
Publications (2)
| Publication Number | Publication Date |
|---|---|
| EP3343377A1 true EP3343377A1 (fr) | 2018-07-04 |
| EP3343377A4 EP3343377A4 (fr) | 2018-09-12 |
Family
ID=55330110
Family Applications (1)
| Application Number | Title | Priority Date | Filing Date |
|---|---|---|---|
| EP16848167.9A Withdrawn EP3343377A4 (fr) | 2015-09-25 | 2016-09-24 | Procédé de débogage, processeur multi-coeurs et équipement de débogage |
Country Status (6)
| Country | Link |
|---|---|
| US (1) | US10409709B2 (fr) |
| EP (1) | EP3343377A4 (fr) |
| KR (1) | KR20180057687A (fr) |
| CN (1) | CN105354136B (fr) |
| BR (1) | BR112018005836A2 (fr) |
| WO (1) | WO2017050286A1 (fr) |
Families Citing this family (14)
| Publication number | Priority date | Publication date | Assignee | Title |
|---|---|---|---|---|
| CN105354136B (zh) | 2015-09-25 | 2018-06-15 | 华为技术有限公司 | 一种调试方法、多核处理器和调试设备 |
| US10289785B1 (en) * | 2016-09-15 | 2019-05-14 | Xilinx, Inc. | Platform architecture creation for a system-on-chip |
| US9875167B1 (en) * | 2017-03-29 | 2018-01-23 | Google Inc. | Distributed hardware tracing |
| US10365987B2 (en) | 2017-03-29 | 2019-07-30 | Google Llc | Synchronous hardware event collection |
| US10606679B2 (en) * | 2017-12-04 | 2020-03-31 | Arm Limited | Debug apparatus and method |
| CN109933517A (zh) * | 2017-12-19 | 2019-06-25 | 成都鼎桥通信技术有限公司 | 基于安卓系统的测试方法、装置及设备 |
| JP6981920B2 (ja) * | 2018-05-25 | 2021-12-17 | ルネサスエレクトロニクス株式会社 | 半導体装置、およびデバッグ方法 |
| CN111064769A (zh) * | 2019-11-06 | 2020-04-24 | 江苏三希科技股份有限公司 | 一种电量集中器的远程调试方法、系统及设备 |
| CN110908904B (zh) * | 2019-11-15 | 2024-10-29 | 北京小米移动软件有限公司 | 调试快应用的方法、调试快应用的装置及电子设备 |
| CN112540918A (zh) * | 2020-12-04 | 2021-03-23 | 中国航空工业集团公司成都飞机设计研究所 | 一种基于arinc659总线的多余度飞管计算机同步调试方法 |
| CN112711527B (zh) * | 2020-12-16 | 2024-02-06 | 北京科银京成技术有限公司 | 一种实时进程的调试方法、装置、目标机和存储介质 |
| US11635900B2 (en) * | 2021-08-27 | 2023-04-25 | Micron Technology, Inc. | Memory sub-system signature generation |
| CN114238088A (zh) * | 2021-12-07 | 2022-03-25 | 山东华芯半导体有限公司 | 一种应用于多核裸机系统的内建调试系统 |
| CN116340188B (zh) * | 2023-05-26 | 2023-08-04 | 深流微智能科技(深圳)有限公司 | Gpu芯片渲染任务的调试方法及系统 |
Family Cites Families (35)
| Publication number | Priority date | Publication date | Assignee | Title |
|---|---|---|---|---|
| US5720714A (en) | 1993-11-03 | 1998-02-24 | Smith & Nephew Plc. | Padding |
| JP2001035747A (ja) | 1999-07-21 | 2001-02-09 | Taiyo Yuden Co Ltd | 積層セラミックコンデンサ |
| US6886110B2 (en) | 2000-11-21 | 2005-04-26 | Wind River Systems, Inc. | Multiple device scan chain emulation/debugging |
| US20040098639A1 (en) | 2002-11-14 | 2004-05-20 | Liu Bao Gang | Debugging kernel-loadable modules and suspending and replacing functions in non-microkernel operating systems |
| US9158574B2 (en) * | 2002-11-18 | 2015-10-13 | Arm Limited | Handling interrupts in data processing |
| US7941585B2 (en) * | 2004-09-10 | 2011-05-10 | Cavium Networks, Inc. | Local scratchpad and data caching system |
| CN100359486C (zh) * | 2004-11-24 | 2008-01-02 | 中兴通讯股份有限公司 | 一种调试操作系统内核态程序的方法及装置 |
| US7581087B2 (en) * | 2006-01-17 | 2009-08-25 | Qualcomm Incorporated | Method and apparatus for debugging a multicore system |
| WO2008023323A2 (fr) | 2006-08-21 | 2008-02-28 | Nxp B.V. | Système à processeurs multiples et procédé pour synchroniser un procédé de déboguage d'un système à processeurs multiples |
| US8370806B2 (en) * | 2006-11-15 | 2013-02-05 | Qualcomm Incorporated | Non-intrusive, thread-selective, debugging method and system for a multi-thread digital signal processor |
| EP2003534A3 (fr) * | 2007-06-11 | 2009-02-18 | MediaTek Inc. | Procédé et appareil pour réduire la consommation de puissance dans un circuit intégré |
| JP2008310727A (ja) * | 2007-06-18 | 2008-12-25 | Toshiba Corp | シミュレーション装置及びシミュレーション方法 |
| CN101398780B (zh) | 2007-09-27 | 2011-08-24 | 国际商业机器公司 | 可基于进程定制调试器的即时调试的方法和系统 |
| CN101685420B (zh) | 2008-09-24 | 2013-06-12 | 中兴通讯股份有限公司 | 多线程调试方法和装置 |
| CN101504626B (zh) | 2009-03-06 | 2012-06-06 | 中兴通讯股份有限公司 | 一种调试控制实现方法及系统 |
| CN101515251A (zh) | 2009-03-31 | 2009-08-26 | 华为技术有限公司 | 板级平台调试方法、装置和系统 |
| CN101540706B (zh) | 2009-04-23 | 2011-12-28 | 中兴通讯股份有限公司 | 一种实现远程调试的方法及系统 |
| US8495344B2 (en) * | 2010-01-22 | 2013-07-23 | Via Technologies, Inc. | Simultaneous execution resumption of multiple processor cores after core state information dump to facilitate debugging via multi-core processor simulator using the state information |
| US8533418B2 (en) | 2010-06-30 | 2013-09-10 | International Business Machines Corporation | Memory allocation with identification of requesting loadable kernel module |
| CN102346708B (zh) * | 2010-08-03 | 2014-07-16 | 中兴通讯股份有限公司 | 一种调试器及其调试方法 |
| US8635476B2 (en) * | 2010-12-22 | 2014-01-21 | Via Technologies, Inc. | Decentralized power management distributed among multiple processor cores |
| CN102073565B (zh) | 2010-12-31 | 2014-02-19 | 华为技术有限公司 | 触发操作方法、多核分组调试方法、装置及系统 |
| TW201235833A (en) * | 2011-02-16 | 2012-09-01 | Ind Tech Res Inst | System and method for multi-core synchronous debugging of a multi-core platform |
| US20130031419A1 (en) * | 2011-07-28 | 2013-01-31 | International Business Machines Corporation | Collecting Debug Data in a Secure Chip Implementation |
| CN102521087B (zh) | 2011-11-02 | 2014-11-19 | 烽火通信科技股份有限公司 | 一种远程获取内核模块实时分级调试信息的方法 |
| US9304880B2 (en) | 2013-03-15 | 2016-04-05 | Freescale Semiconductor, Inc. | System and method for multicore processing |
| EP2962205B1 (fr) | 2013-04-09 | 2018-06-20 | Siemens Aktiengesellschaft | Système de processeur multi-coeur pourvu d'une fonction d'analyse d'erreur |
| CN103226504B (zh) | 2013-04-19 | 2016-05-11 | 中国科学院自动化研究所 | 一种分布式片上调试系统 |
| US9600397B2 (en) | 2013-08-29 | 2017-03-21 | Stmicroelectronics (Grenoble 2) Sas | Dynamic debugging method of a software module and corresponding device |
| CN103729288B (zh) * | 2013-11-01 | 2016-02-24 | 华中科技大学 | 一种嵌入式多核环境下应用程序的调试方法 |
| US10102050B2 (en) * | 2015-02-05 | 2018-10-16 | Microchip Technology Incorporated | System and method for generating cross-core breakpoints in a multi-core microcontroller |
| US9626265B2 (en) * | 2015-06-29 | 2017-04-18 | International Business Machines Corporation | Efficiency of cycle-reproducible debug processes in a multi-core environment |
| US20170062075A1 (en) * | 2015-08-31 | 2017-03-02 | Sandisk Technologies Inc. | Apparatus including core and clock gating circuit and method of operating same |
| CN105354136B (zh) * | 2015-09-25 | 2018-06-15 | 华为技术有限公司 | 一种调试方法、多核处理器和调试设备 |
| CN105224454B (zh) | 2015-09-25 | 2018-06-05 | 华为技术有限公司 | 一种调试方法、多核处理器和调试设备 |
-
2015
- 2015-09-25 CN CN201510623211.5A patent/CN105354136B/zh active Active
-
2016
- 2016-09-24 EP EP16848167.9A patent/EP3343377A4/fr not_active Withdrawn
- 2016-09-24 WO PCT/CN2016/099995 patent/WO2017050286A1/fr not_active Ceased
- 2016-09-24 KR KR1020187011356A patent/KR20180057687A/ko not_active Abandoned
- 2016-09-24 BR BR112018005836-0A patent/BR112018005836A2/pt not_active Application Discontinuation
-
2018
- 2018-03-23 US US15/934,329 patent/US10409709B2/en not_active Expired - Fee Related
Also Published As
| Publication number | Publication date |
|---|---|
| US20180210811A1 (en) | 2018-07-26 |
| KR20180057687A (ko) | 2018-05-30 |
| US10409709B2 (en) | 2019-09-10 |
| EP3343377A4 (fr) | 2018-09-12 |
| CN105354136B (zh) | 2018-06-15 |
| WO2017050286A1 (fr) | 2017-03-30 |
| CN105354136A (zh) | 2016-02-24 |
| BR112018005836A2 (pt) | 2018-10-09 |
Similar Documents
| Publication | Publication Date | Title |
|---|---|---|
| US10503629B2 (en) | Debugging method, multi-core processor, and debugging device | |
| US10409709B2 (en) | Debugging method, multi-core processor and debugging device | |
| CN102722431B (zh) | 进程监控方法及装置 | |
| US10769050B2 (en) | Managing and maintaining multiple debug contexts in a debug execution mode for real-time processors | |
| US10761968B2 (en) | Managing and maintaining multiple debug contexts in a debug execution mode for real-time processors | |
| CN102999423B (zh) | 一种多核测试的方法和装置 | |
| CN106155883A (zh) | 一种虚拟机可靠性测试方法及装置 | |
| CN109144873B (zh) | 一种linux内核处理方法及装置 | |
| US20220083455A1 (en) | Managing and maintaining multiple debug contexts in a debug execution mode for real-time processors | |
| EP3961403A1 (fr) | Dispositif et procédé de surveillance de bus, support de stockage et dispositif électronique | |
| US10229033B2 (en) | System, method and apparatus for debugging of reactive applications | |
| CN107179982B (zh) | 一种跨进程调试方法和装置 | |
| CN110532014B (zh) | 程序升级方法、装置、终端设备及计算机可读存储介质 | |
| CN113742113B (zh) | 一种嵌入式系统健康管理方法、设备及储存介质 | |
| US20130318310A1 (en) | Processor processing method and processor system | |
| WO2020073200A1 (fr) | Procédé et système de débogage de programme | |
| CN104572332A (zh) | 处理系统崩溃的方法和装置 | |
| CN117851303A (zh) | 一种多线程dma的高速数据传输方法及系统 | |
| CN111078449B (zh) | 信息处理方法、信息处理装置及终端设备 | |
| CN106598755B (zh) | 一种处理器及dcc通信系统 | |
| RU2830957C1 (ru) | Способ отладки многоядерных многопроцессных вычислительных систем с механизмом контроля режима реального времени | |
| US20250298725A1 (en) | Information processing method, information processing apparatus and information processing device | |
| CN121118786A (zh) | 一种芯片原型验证方法、设备、介质及产品 | |
| CN106339256A (zh) | 用于自动分配模拟器的方法及装置 | |
| KR20150117104A (ko) | 호스트 기기 및 그것의 응용 프로그램 개발 방법 |
Legal Events
| Date | Code | Title | Description |
|---|---|---|---|
| STAA | Information on the status of an ep patent application or granted ep patent |
Free format text: STATUS: THE INTERNATIONAL PUBLICATION HAS BEEN MADE |
|
| PUAI | Public reference made under article 153(3) epc to a published international application that has entered the european phase |
Free format text: ORIGINAL CODE: 0009012 |
|
| STAA | Information on the status of an ep patent application or granted ep patent |
Free format text: STATUS: REQUEST FOR EXAMINATION WAS MADE |
|
| 17P | Request for examination filed |
Effective date: 20180329 |
|
| AK | Designated contracting states |
Kind code of ref document: A1 Designated state(s): AL AT BE BG CH CY CZ DE DK EE ES FI FR GB GR HR HU IE IS IT LI LT LU LV MC MK MT NL NO PL PT RO RS SE SI SK SM TR |
|
| AX | Request for extension of the european patent |
Extension state: BA ME |
|
| A4 | Supplementary search report drawn up and despatched |
Effective date: 20180809 |
|
| RIC1 | Information provided on ipc code assigned before grant |
Ipc: G06F 11/36 20060101AFI20180804BHEP Ipc: G06F 9/54 20060101ALI20180804BHEP |
|
| DAV | Request for validation of the european patent (deleted) | ||
| DAX | Request for extension of the european patent (deleted) | ||
| STAA | Information on the status of an ep patent application or granted ep patent |
Free format text: STATUS: THE APPLICATION HAS BEEN WITHDRAWN |
|
| 18W | Application withdrawn |
Effective date: 20200107 |