EP3346396A1 - Verfahren und vorrichtung zur beurteilung der qualität von multimedia-ressourcen - Google Patents
Verfahren und vorrichtung zur beurteilung der qualität von multimedia-ressourcen Download PDFInfo
- Publication number
- EP3346396A1 EP3346396A1 EP16894153.2A EP16894153A EP3346396A1 EP 3346396 A1 EP3346396 A1 EP 3346396A1 EP 16894153 A EP16894153 A EP 16894153A EP 3346396 A1 EP3346396 A1 EP 3346396A1
- Authority
- EP
- European Patent Office
- Prior art keywords
- multimedia resource
- vector
- playing
- cumulative distribution
- quality
- Prior art date
- Legal status (The legal status is an assumption and is not a legal conclusion. Google has not performed a legal analysis and makes no representation as to the accuracy of the status listed.)
- Ceased
Links
Images




Classifications
-
- G—PHYSICS
- G06—COMPUTING OR CALCULATING; COUNTING
- G06F—ELECTRIC DIGITAL DATA PROCESSING
- G06F16/00—Information retrieval; Database structures therefor; File system structures therefor
- G06F16/40—Information retrieval; Database structures therefor; File system structures therefor of multimedia data, e.g. slideshows comprising image and additional audio data
- G06F16/48—Retrieval characterised by using metadata, e.g. metadata not derived from the content or metadata generated manually
-
- G—PHYSICS
- G06—COMPUTING OR CALCULATING; COUNTING
- G06F—ELECTRIC DIGITAL DATA PROCESSING
- G06F16/00—Information retrieval; Database structures therefor; File system structures therefor
- G06F16/40—Information retrieval; Database structures therefor; File system structures therefor of multimedia data, e.g. slideshows comprising image and additional audio data
- G06F16/43—Querying
- G06F16/438—Presentation of query results
-
- G—PHYSICS
- G06—COMPUTING OR CALCULATING; COUNTING
- G06F—ELECTRIC DIGITAL DATA PROCESSING
- G06F16/00—Information retrieval; Database structures therefor; File system structures therefor
-
- G—PHYSICS
- G06—COMPUTING OR CALCULATING; COUNTING
- G06F—ELECTRIC DIGITAL DATA PROCESSING
- G06F16/00—Information retrieval; Database structures therefor; File system structures therefor
- G06F16/40—Information retrieval; Database structures therefor; File system structures therefor of multimedia data, e.g. slideshows comprising image and additional audio data
-
- G—PHYSICS
- G06—COMPUTING OR CALCULATING; COUNTING
- G06F—ELECTRIC DIGITAL DATA PROCESSING
- G06F16/00—Information retrieval; Database structures therefor; File system structures therefor
- G06F16/40—Information retrieval; Database structures therefor; File system structures therefor of multimedia data, e.g. slideshows comprising image and additional audio data
- G06F16/43—Querying
- G06F16/435—Filtering based on additional data, e.g. user or group profiles
-
- G—PHYSICS
- G06—COMPUTING OR CALCULATING; COUNTING
- G06F—ELECTRIC DIGITAL DATA PROCESSING
- G06F16/00—Information retrieval; Database structures therefor; File system structures therefor
- G06F16/40—Information retrieval; Database structures therefor; File system structures therefor of multimedia data, e.g. slideshows comprising image and additional audio data
- G06F16/45—Clustering; Classification
-
- G—PHYSICS
- G06—COMPUTING OR CALCULATING; COUNTING
- G06F—ELECTRIC DIGITAL DATA PROCESSING
- G06F16/00—Information retrieval; Database structures therefor; File system structures therefor
- G06F16/40—Information retrieval; Database structures therefor; File system structures therefor of multimedia data, e.g. slideshows comprising image and additional audio data
- G06F16/48—Retrieval characterised by using metadata, e.g. metadata not derived from the content or metadata generated manually
- G06F16/483—Retrieval characterised by using metadata, e.g. metadata not derived from the content or metadata generated manually using metadata automatically derived from the content
-
- G—PHYSICS
- G06—COMPUTING OR CALCULATING; COUNTING
- G06F—ELECTRIC DIGITAL DATA PROCESSING
- G06F16/00—Information retrieval; Database structures therefor; File system structures therefor
- G06F16/90—Details of database functions independent of the retrieved data types
- G06F16/95—Retrieval from the web
- G06F16/953—Querying, e.g. by the use of web search engines
- G06F16/9535—Search customisation based on user profiles and personalisation
Definitions
- the present disclosure relates to the technical field of Internet, and more particularly, to a method and device for assessing quality of multimedia resource.
- Native properties e.g., machine properties
- overall quality of multimedia resources may be determined according to such static properties as signal quality, degree of distortion and so on of video and audio resources.
- the overall quality of multimedia resources could be determined with some properties facing users, such as frame rate, definition or the like, further added.
- quality assessment methods in which the overall quality of a multimedia resource is determined by checking network characteristics of the multimedia resource. For example, the characteristics and decoding progress of the data packets transmitted by the streaming media on a network are calculated so as to determine the overall quality of a multimedia resource.
- native properties e.g., dynamic state and static state
- multimedia resources are used as the main index of quality assessment in some existing quality assessment methods.
- users' requirements cannot be met if the quality of a multimedia resource is assessed merely based on the native properties of the multimedia resource.
- whether multimedia resources are satisfying or not cannot necessarily be described merely by such native properties as network transmission, definition or the like.
- a method and device are provided for assessing quality of multimedia resource, which could more accurately indicate the quality of multimedia resource.
- the present disclosure provides a method for assessing quality of multimedia resource, comprising:
- determining the cumulative distribution vector of the multimedia resource according to the indicator data for describing user behavior on the multimedia resource comprises:
- dividing the indicator data of the one type of user behaviors into the multiple groups comprises:
- the present disclosure provides a device for assessing quality of multimedia resource, comprising:
- the first determining unit comprises:
- the dividing subunit comprises:
- the method and device for assessing quality of multimedia resource in the examples according to the present disclosure can more accurately indicate the quality of multimedia resource, and also have a great operability. Moreover, by assessing the quality of multimedia resource using the quality assessment method of multimedia resource in the examples of the present disclosure, the feedback of online behaviors can be reflected on the final dynamic and optimal ranking and recommendation of multimedia resource.
- exemplary means "used as an instance or example, or explanatory". Any “exemplary” example given here is not necessarily construed as being superior to or better than other examples.
- Fig. 1 is a flow chart showing the quality assessment method of multimedia resource according to an Example 1 of the present disclosure.
- the quality assessment method may comprise a step S100, a step S120, and a step S140.
- the step S100 comprises determining a cumulative distribution vector of the multimedia resource according to the indicator data for describing user behaviors on the multimedia resource.
- the terminal apparatus can be, for instance, a mobile phone, a mobile internet apparatus (MID), a personal digital assistant (PDA), a laptop computer, a desktop computer, a smart television and so on.
- the multimedia resource can be, for example, a video, audio, picture and so on.
- multimedia resource in the present disclosure is not limited to the afore-mentioned three examples.
- key point of the present disclosure is not the multimedia resource, and that any multimedia resource in other forms is also suitable for the present disclosure. In other words, there are no restrictions on the specific form of the multimedia resource in the present disclosure.
- Indicator data can be used for describing user behaviors on such multimedia resource as the video, audio and so on.
- user behaviors on the multimedia resource may include various types, e.g. thumb-up/thumb-down, commenting, recommending (forwarding), collecting, playing, downloading or the like.
- Thumb-up/thumb-down refers to an operation of "Thumb-up” or “Thumb-down” made by user for the multimedia resource being played according to the user's supportive or objective attitude to the multimedia resource.
- Thumb-up/thumb-down usually includes the identity (vid) of the multimedia resource being played, the operation of thumb-up/thumb-down, related information of the operator (user), the operation time, the IP (e.g. the user's mobile phone or computer and so on), and the like.
- Commenting refers to an operation of the user providing a comment at a corresponding position according to the user's understanding on the content and form of the multimedia resource being played. Commenting usually includes the identity (vid) of the multimedia resource being played, the specific content of the comment, related information of the operator (user), the operation time, the IP, and the like.
- Collecting refers to a recording operation performed by user based on the user's understanding on the content and form of the multimedia resource being played so that this multimedia resource could be conveniently retrieved in the future.
- Collecting usually includes the identity (vid) of the multimedia resource being played, related information of the operator (user), the operation time, the IP, and the like.
- Recommending refers to an off-site push operation made by user based on the user's understanding on the content and form of the multimedia resource being played.
- Recommending usually includes the identity (vid) of the multimedia resource being played, related information of the operator (user), the operation time, the IP, the recommendation platform, and the like.
- Playing refers to a user's watching behavior with respect to the multimedia resource. Playing usually includes identity (vid) of the multimedia resource being played, related information of the operator (user), the operation time, the IP, the length of the play time, and the like.
- Downloading refers to an operation of downloading to the local performed by user based on the user's understanding on the content and form of the multimedia resource being played. Downloading usually includes the identity (vid) of the multimedia resource being played, related information of the operator (user), the operation time, the IP, the downloading progress, and the like.
- the building process of user behaviors is a mapping process from problem domain to behavior domain: f : Pr oblemDo main ⁇ UserBehavior .
- Pr oblemDo main refers to the problem domain
- UserBehavior refers to the set of user behaviors.
- Each business department can perform assessment by choosing optimal user behaviors according to the background data and page functions of the department itself. According to practical effects, the user behaviors which can faithfully reflect the users' demands and intentions are recommended, so that the quality assessment (calculation) of multimedia resource is more accurate.
- indicator data can be used for measuring each user behavior in each type of user behaviors. Details for the indicator data for each type of user behaviors are as follows.
- thumb-up/thumb-down operation made by the user for the multimedia resource can be used as the indicator data for measuring the user behaviors of the thumb-up/thumb-down type. If the playing-finishing progress of the multimedia resource is calculated, then the playing-finishing progress of the multimedia resource will be recorded every time the operation of thumb-up/thumb-down happens. Theoretically, it is expected that there is no operation of thumb-down from the user, and that the behavior of thumb-up happens as early as possible (it is also fallacious if the behavior of thumb-up happens too early).
- the timings and the emotions of commenting operations made by the users for the multimedia resource can be used as the indicator data for measuring the user behaviors of the commenting type. If the playing-finishing progress of the multimedia resource is calculated, then the playing-finishing progress of the multimedia resource will be recorded every time the operation of commenting happens. Furthermore, positive and negative emotions of the user's comment can be quantified as much as possible. Theoretically, it is expected that there is no negative comment from the user, and that the behavior of commenting happens as early as possible (it is also fallacious if the behavior of commenting happens too early).
- one IP can perform collecting only once for one multimedia resource, then the timing of collecting operation made by the user for the multimedia resource can be used as the indicator data for measuring the user behaviors of the collecting type. If the playing-finishing progress of the multimedia resource is calculated, then the playing-finishing progress of the multimedia resource will be recorded every time the operation of collecting happens. Theoretically, it is expected that there are operations of collecting from the users, and that the behavior of collecting happens as early as possible (it is also fallacious if the behavior of collecting happens too early).
- leading-back flow rate ratio Times of leading-back/Times of emerging
- the times of leading-back refer to the times that the recommended multimedia resource is opened for the second time
- the times of emerging refer to the times that the multimedia resource has be recommended. If the playing-finishing progress of the multimedia resource is calculated, then the playing-finishing progress of the multimedia resource will be recorded every time the operation of recommending happens.
- the leading-back flow rate ratio can be calculated by crawling related data outstations. Theoretically, it is expected that there are recommending behaviors by the users, that the recommending behaviors happen as early as possible (it is also fallacious if the behavior of recommending happens too early), and that the leading-back flow rate ratio is as high as possible.
- the playing-finishing percentage of the multimedia resource, and the times of dragging the process bar (fast backward, fast forward) by the users can be used as the indicator data for measuring the user behaviors of the playing type. It is expected that the playing-finishing percentage of the users is as high as possible, that there is no fast-forward dragging, and that there are reasonable times of fast-backward dragging.
- the timings of downloading operation made by the users for the multimedia resource and the downloading-finishing progress can be used as the indicator data for measuring the user behaviors of the downloading type. If the playing-finishing progress of the multimedia resource is calculated, then the playing-finishing progress of the multimedia resource will be recorded every time the operation of downloading happens.
- the downloading-finishing progress can be used for measuring the user's determination to download the multimedia resource and the network condition. Theoretically, it is expected that there are downloading behaviors by the users, and that the behavior of downloading happens as early as possible (it is also fallacious if the behavior of downloading happens too early); it is also expected that 100% of the multimedia resource is fully downloaded.
- the building process of indicator data is a mapping process from user behaviors to indicator data: f : UserBehavior ⁇ Indicators .
- UserBehavior refers to the set of user behaviors
- Indicators refers to the set of indicator data.
- the building process of a cumulative distribution vector is a mapping process from indicator space to vector space: f : Indicators ⁇ V n .
- Indicators refers to the set of the indicator data
- V n refers to n -dimensional vector space.
- the step S120 comprises determining an upper boundary vector and a lower boundary vector of the multimedia resource according to the cumulative distribution vector.
- the best performance and the worst performance i.e. the upper boundary and the lower boundary, of the indicator data can be defined.
- the best performance comprises the maximum number of the thumb-up/thumb-down operations performed by the users for the multimedia resource at the same timing (in a reasonable range), the highest value of leading-back flow rate ratio of the recommended multimedia resource, and the maximum number of users who have fully watched the multimedia resource.
- both the upper boundary and the lower boundary of the multimedia resource on the indicator data can be expressed by using the vectors, i.e. the upper boundary vector and the lower boundary vector.
- the step S140 comprises determining a quality score of the multimedia resource according to the cumulative distribution vector, the upper boundary vector, and the lower boundary vector.
- the quality score of the multimedia resource can be determined according to the cumulative distribution vector. Theoretically, the farther a cumulative distribution vector is from the lower boundary vector, and the closer the cumulative distribution vector is to the upper boundary vector, the better the user behavior will be, which further shows a higher quality of the multimedia resource. For instance, distance proportion can be used for defining the quality score of the multimedia resource.
- Score is the quality score
- Dis tan ceTOTOP is the distance from the cumulative distribution vector to the upper boundary vector
- Dis tan ceBetween is the distance from the upper boundary vector to the lower boundary vector.
- the methods such as cosine similarity or multi-dimensional Euclidean distance can be used for calculating the distance between vectors. Besides, cosine similarity and multi-dimensional Euclidean distance can ensure that the value range of the quality score Score is [0,1].
- the method of cosine similarity includes drawing the vectors in a vector space according to their coordinate values, acquiring the angle between two vectors, and calculating the cosine value of the angle, and the cosine value can be used for representing similarity of the two vectors.
- Euclidean distance is a commonly adopted distance definition, which refers to the real distance between two points in an m-dimensional space.
- the Euclidean distance between the point A ( x 1 , y 1 ) and the point B ( x 2 , y 2 ) is x 1 ⁇ x 2 + y 1 ⁇ y 2 2 .
- Cosine similarity is a fine method of outputting normalized results
- Euclidean distance is a method of outputting global values. In practical operations, either one of the methods can be chosen according to necessities.
- the building process of the quality score of multimedia resource is a mapping process from a cumulative distribution vector to the interval [0,1]: f : V n ⁇ [0,1], wherein V n is a n -dimensional vector space, and [0,1] is the value range of the quality score Score.
- the quality assessment method provided in Example 1 of the present disclosure is based on user experience and is faithful to the users' feeling, by using user behaviors on the multimedia resource for describing the quality of the multimedia resource, which enables the present disclosure to describe the quality of the multimedia resource more accurately.
- the quality assessment method provided in Example 1 of the present disclosure has a great operability.
- the reason thereof may be, for Internet applications, plenty of multimedia resources are public online, so users can consume these multimedia resources by behaviors of clicking and watching, while enterprise backgrounds can record these user behaviors via the log system. Therefore, the process of the system providing service is right a process of data preparation for the quality assessment of multimedia resource, and it is simple and easy to obtain the user behaviors on multimedia resources.
- special staffs and systems are needed for traditional quality assessment methods which are based on native properties of multimedia resource to complete collecting and measuring related indicators.
- the quality assessment of multimedia resource can be performed either by using indicator data for only one type of user behaviors, or can be performed by using such as statistical methods according to the indicator data for multiple types of user behaviors.
- the quality score for each type of user behaviors can be individually calculated, then the quality scores for all types of user behaviors can be averaged, and the averaged score can be determined as the quality score of the multimedia resource.
- Fig. 2 is a flow chart showing the quality assessment method of multimedia resource according to an Example 2 of the present disclosure. As shown in Fig. 2 , this quality assessment method may comprises a step S201, a step S203, a step S205, a step S207, and a step S209.
- the step S201 comprises dividing the indicator data for one type of user behaviors into multiple groups.
- indicator data for one type of user behaviors can be divided into multiple groups by using a method of non-overlapping grouping; for another example, indicator data for one type of user behaviors can be divided into multiple groups by using a method of overlapping grouping.
- the step of dividing the indicator data for one type of user behaviors into multiple groups comprises:
- the process of grouping is as follows: if it is assumed that a group of data D in real number field is given, the maximum value max( D ) and the minimum value min( D ) of the data D can be obtained; then the interval max( D )-min( D ) (which is also called Range) is equally divided into n groups, and the corresponding dividing interval is max D ⁇ min D n which is also called grouping interval.
- n groups correspond to n grouping intervals, for instance, [ min D , min D + max D ⁇ min D n ) and max D ⁇ max D ⁇ min D n , max D are respectively the first grouping interval and the last grouping interval.
- the process of grouping is as follows: if it is assumed that a group of data D in real number field is given, the maximum value max( D ) and the minimum value min( D ) of the data D can be obtained, and the interval [min( D ), max( D )] contains all of the data D; then the interval max( D )-min( D ) is equally divided into n overlapping grouping intervals, for instance, min D , max D and [ min D , min D + max D ⁇ min D n ) are respectively the largest grouping interval and the smallest grouping interval.
- the step S203 comprises counting the number of the indicator data for the one type of user behaviors included in each group.
- the number of indicator data falling into each group can be respectively counted.
- the step S205 comprises determining the vector formed by the counted numbers for the multiple groups as the cumulative distribution vector of the one type of user behaviors on the multimedia resource.
- the cumulative distribution vector of the one type of user behaviors can be rapidly and directly determined according to the histogram of frequency distribution in which x axis represents the grouping interval and y axis represents the counted number.
- the step S207 comprises determining an upper boundary vector and a lower boundary vector of the multimedia resource according to the cumulative distribution vector.
- the step S209 comprises determining a quality score of the multimedia resource according to the cumulative distribution vector, the upper boundary vector, and the lower boundary vector.
- the quality assessment method provided in Example 2 of the present disclosure is based on user experience and is faithful to the users' feeling, by using user behaviors on the multimedia resource for describing the quality of the multimedia resource, which enables the present disclosure to describe the quality of the multimedia resource more accurately.
- the quality assessment method provided in Example 2 of the present disclosure has a great operability.
- the reason thereof may be, for Internet applications, plenty of multimedia resources are public online, so users can consume these multimedia resources by behaviors of clicking and watching, while enterprise backgrounds can record these user behaviors via the log system. Therefore, the process of the system providing service is right a process of data preparation for the quality assessment of multimedia resource, and it is simple and easy to obtain the user behaviors on multimedia resources.
- special staffs and systems are needed for traditional quality assessment methods which are based on native properties of multimedia resource to complete collecting and measuring related indicators.
- the feedback of online behaviors can be reflected on the final dynamic and optimized ranking and recommendation of the multimedia resource. If user behaviors on some multimedia resource ranking higher in the original ranking and recommendation result of multimedia resource are not so ideal, then the quality score of this multimedia resource will decrease in future iterations, so that this multimedia resource will be automatically put behind.
- Fig. 3a is a flow chart showing the quality assessment method of multimedia resource according to an Example 3 of the present disclosure.
- the quality assessment method of multimedia resource provided in the present disclosure will be exemplified by using indicator data of the playing type of user behaviors, i.e. the playing-finishing percentage of the multimedia resource (e.g. the watching-finishing percentage of a video).
- the quality assessment method may comprise a step S301 of using the video playing log of a certain video website as the basic data source.
- the original video playing log is a data table at least containing the tetrad ⁇ Vids,PlayLength,FullLength,Time ⁇ , wherein Vids indicates the video being watched; PlayLength is the playing time length of the watching behavior, and is usually counted in seconds; FullLength is the full time length of the video being watched; and Time is the timestamp when the watching behavior happens.
- Each line of the original video playing log records the user's watching behavior by clicking the video at the corresponding timestamp. By searching the log with different timestamps, the data for users' watching behaviors in one day, one hour, or even at any moment can be obtained.
- Table 1 is an exemplary fragment from the video playing log.
- Table 1 Exemplary Fragment from Video Playing Log Vids PlayLength FullLength Time ... ... ... ...
- the pre-processing can be performed on the afore-mentioned tetrad ⁇ Vids, PlayLength , FullLength, Time ⁇ , by collecting the watching time lengths of users in the video playing log.
- video playing data in a special time period can be selected by defining the Time field, e.g. a video playing data with Time "20160105" can be selected from the video playing log.
- the playing-finishing percentage of a video (which is also called watching-finishing percentage of the video) with Vids "1" can be calculated by using PlayLength / FullLength, so as to obtain a perc field for the video with Vids "1".
- Data screening can also be performed on the playing-finishing percentage data of the video, for instance, the data with a perc >100% should be discarded.
- the quality assessment method may further comprise a step S302 of obtaining indicator data, i.e. the playing-finishing percentage, of the video based on the video playing log.
- the quality assessment method may further comprise a step S303 of dividing the indicator data of the playing type of user behaviors i.e. playing-finishing percentage perc into multiple groups, and determining the cumulative distribution vector of the playing-finishing percentage perc.
- the playing-finishing percentage perc can be divided into multiple groups by using either the non-overlapping grouping method or the overlapping grouping method described in Example 2.
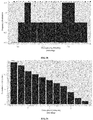
- a frequency distribution histogram can be used for displaying the frequency distribution of the playing-finishing percentage perc, wherein the height of the rectangle in the frequency distribution histogram represents the ratio between the frequency of corresponding group and the grouping interval (since the grouping interval is a constant, and for the convenience of drawing and watching the histogram, the height of the rectangle is directly used for representing the frequency).
- the frequency distribution histogram is capable of clearly showing the frequency distribution of each group, and can easily show the frequency differences between groups.
- the abscissa axis of the frequency distribution histogram is a universe range from 0%-100% of the playing-finishing percentage perc .
- the grouping interval can be determined according to actual situation. According to the statistics, suitable grouping interval can reflect the distribution characteristics of sample data, while over-small grouping interval may result in too many groups and over-large grouping interval may result in too few groups, both of which may cover up the distribution characteristics of the playing-finishing percentage perc . In addition, since over-small grouping intervals may cause too many groups, the dimensionality of the cumulative distribution vector subsequently determined according to the playing-finishing percentage, i.e. the cumulative distribution vector of the playing-finishing percentage, will be too high, which brings excessive calculation burden when analyzing massive data. Therefore, the grouping interval in this example is determined to be 10%.
- the universe interval, i.e. 0%-100%, of the playing-finishing percentage perc could be divided into 10 groups with the grouping interval of 10%, as a result, 10 isometric non-overlapping sample intervals (groups), i.e. 0%-10%, 10%-20%, ..., 90%-100%, will be formed, thereby obtaining the playing-finishing percentage frequency distribution histogram shown in Fig. 3b .
- the universe interval, i.e. 0%-100%, of the playing-finishing percentage perc could be divided into 10 groups with the grouping interval of 10%, as a result, 10 overlapping sample intervals (groups), i.e. 0%-10%, 0%-20%, ..., 0%-100%, will be formed, thereby obtaining the playing-finishing percentage frequency distribution histogram shown in Fig. 3c .
- the overlapping grouping method i.e. cumulative distribution count
- Sample intervals respectively with a playing-finishing percentage perc of 0%, 10%, 20%, 30%, ... , 100% are used.
- the count for a playing-finishing percentage perc of 30% certainly comprises the count for a playing-finishing percentage perc of 10%.
- the critical point for each group could be mapped to a progress point for actual playing progress of the video, and that the users' playing-finishing percentage can describe the playing progress of the video.
- Single-point group 0% can be understood as the number of times that the video is clicked, namely, the count of the group 0% could be increased by 1 every time the video is clicked, and the number of the records for the targeted video in the video playing log can be used as the count of the group 0% directly.
- the times for playing and finishing m% will definitely be no more than the times for playing and finishing c%
- the counts of the group (0%, m%] will definitely be no more than the count of the group (0%, c %].
- the times for finishing 100% of the video will definitely be no more than the times for finishing 20% of the video. Therefore, the internal data of the playing-finishing percentage cumulative distribution vector V vid is a non-increasing series.
- the playing-finishing percentage cumulative distribution vector V vid (14, 13, 11, 10, 9, 8, 7, 6, 4, 2, 1) can be obtained.
- the quality assessment method may further comprise a step S304 of determining an upper boundary vector and a lower boundary vector of the playing-finishing percentage according to the playing-finishing percentage cumulative distribution vector V vid .
- each video can be fully played, namely, the number of users who finish watching the video should be equal to the number of users who click and open the video. Therefore, each element of the upper boundary vector should be the same as the frequency for finishing 0%. Therefore, the upper boundary vector V t , i.e. the possibly best performance for playing and finishing a video, can be defined according to the playing-finishing percentage cumulative distribution vector V vid .
- the lower boundary vector V b can be defined according to the playing-finishing percentage cumulative distribution vector V vid .
- the quality assessment method may further comprise a step S305 of after determining the playing-finishing percentage cumulative distribution vector V vid , the upper boundary vector V t and the lower boundary vector V b of the playing-finishing percentage, calculating the distance from the playing-finishing percentage cumulative distribution vector V vid to the upper boundary vector V t of the playing-finishing percentage, and the distance from the upper boundary vector V t of the playing-finishing percentage to the lower boundary vector V b of the playing-finishing percentage.
- 11-dimensional Euclidean distance is used for calculating the above two distances, wherein the specific definition of 11-dimensional Euclidean distance is as follows.
- quality scores can be calculated for massive videos on a certain video website, and a video quality score statistical table for this video website, as shown in Table 3 below, will be obtained.
- Table 3 Quality Score Statistics for Videos on a Certain Video Website Number of Videos Minimum First Quartile Median Average Third Quartile Maximum 2818673 0.0000017 0.494000 0.6667000 0.6961000 1.0000000 1.0000000
- the third quartile in actual data has already reached the maximum, which means at least 25% of the video quality scores are 1. This is caused by the long tail effect of video playing, namely, a large amount of videos are played only once or twice, and are completely played.
- a quality score distribution histogram of a video shown in Fig. 3d can be obtained. After these video quality scores are obtained, it is possible to perform multiple calculations by introducing new types of user behaviors, or to perform calculation by introducing new indicator data of the videos, thereby getting prepared for subsequent video search and video recommendation.
- the quality assessment method provided in Example 3 of the present disclosure is based on user experience and is faithful to the users' feeling, by using user behaviors on the multimedia resource for describing the quality of the multimedia resource, which enables the present disclosure to describe the quality of the multimedia resource more accurately.
- the quality assessment method provided in Example 3 of the present disclosure has a great operability.
- the reason thereof may be, for Internet applications, plenty of multimedia resources are public online, so users can consume these multimedia resources by behaviors of clicking and watching, while enterprise backgrounds can record these user behaviors via the log system. Therefore, the process of the system providing service is right a process of data preparation for the quality assessment of multimedia resource, and it is simple and easy to obtain the user behaviors on multimedia resources.
- special staffs and systems are needed for traditional quality assessment methods which are based on native properties of multimedia resource to complete collecting and measuring related indicators.
- the feedback of online behaviors can be reflected on the final dynamic and optimized ranking and recommendation of the multimedia resource. If user behaviors on some multimedia resource ranking higher in the original ranking and recommendation result of multimedia resource are not so ideal, then the quality score of this multimedia resource will decrease in future iterations, so that this multimedia resource will be automatically put behind.
- Fig. 4 is a structural block diagram showing the quality assessment device of multimedia resource according to an Example 4 of the present disclosure.
- the quality assessment device 400 provided in Example 4 of the present disclosure is configured to realize the quality assessment method shown in Fig. 1 .
- the quality assessment device 400 may comprise a first determining unit 410, a second determining unit 430, and a third determining unit 450.
- the first determining unit 410 is configured to determine a cumulative distribution vector of the multimedia resource according to the indicator data for describing user behaviors on the multimedia resource.
- the terminal apparatus can be, for instance, a mobile phone, a mobile internet apparatus (MID), a personal digital assistant (PDA), a laptop computer, a desktop computer, a smart television and so on.
- the multimedia resource can be, for example, a video, audio, picture and so on.
- multimedia resource in the present disclosure is not limited to the afore-mentioned three examples.
- key point of the present disclosure is not the multimedia resource, and that any multimedia resource in other forms is also suitable for the present disclosure. In other words, there are no restrictions on the specific form of the multimedia resource in the present disclosure.
- Indicator data can be used for describing user behaviors on such multimedia resource as the video, audio and so on.
- user behaviors on the multimedia resource may include various types, e.g. thumb-up/thumb-down, commenting, recommending (forwarding), collecting, playing, downloading or the like.
- Thumb-up/thumb-down refers to an operation of "Thumb-up” or “Thumb-down” made by user for the multimedia resource being played according to the user's supportive or objective attitude to the multimedia resource.
- Thumb-up/thumb-down usually includes the identity (vid) of the multimedia resource being played, the operation of thumb-up/thumb-down, related information of the operator (user), the operation time, the IP (e.g. the user's mobile phone or computer and so on), and the like.
- Commenting refers to an operation of the user providing a comment at a corresponding position according to the user's understanding on the content and form of the multimedia resource being played. Commenting usually includes the identity (vid) of the multimedia resource being played, the specific content of the comment, related information of the operator (user), the operation time, the IP, and the like.
- Collecting refers to a recording operation performed by user based on the user's understanding on the content and form of the multimedia resource being played so that this multimedia resource could be conveniently retrieved in the future.
- Collecting usually includes the identity (vid) of the multimedia resource being played, related information of the operator (user), the operation time, the IP, and the like.
- Recommending refers to an off-site push operation made by user based on the user's understanding on the content and form of the multimedia resource being played.
- Recommending usually includes the identity (vid) of the multimedia resource being played, related information of the operator (user), the operation time, the IP, the recommendation platform, and the like.
- Playing refers to a user's watching behavior with respect to the multimedia resource. Playing usually includes identity (vid) of the multimedia resource being played, related information of the operator (user), the operation time, the IP, the length of the play time, and the like.
- Downloading refers to an operation of downloading to the local performed by user based on the user's understanding on the content and form of the multimedia resource being played. Downloading usually includes the identity (vid) of the multimedia resource being played, related information of the operator (user), the operation time, the IP, the downloading progress, and the like.
- the building process of user behaviors is a mapping process from problem domain to behavior domain: f : Pr oblemDo main ⁇ UserBehavior .
- Pr oblemDo main refers to the problem domain
- UserBehavior refers to the set of user behaviors.
- Each business department can perform assessment by choosing optimal user behaviors according to the background data and page functions of the department itself. According to practical effects, the user behaviors which can faithfully reflect the users' demands and intentions are recommended, so that the quality assessment (calculation) of multimedia resource is more accurate.
- indicator data can be used for measuring each user behavior in each type of user behaviors. Details for the indicator data for each type of user behaviors are as follows.
- thumb-up/thumb-down operation made by the user for the multimedia resource can be used as the indicator data for measuring the user behaviors of the thumb-up/thumb-down type. If the playing-finishing progress of the multimedia resource is calculated, then the playing-finishing progress of the multimedia resource will be recorded every time the operation of thumb-up/thumb-down happens. Theoretically, it is expected that there is no operation of thumb-down from the user, and that the behavior of thumb-up happens as early as possible (it is also fallacious if the behavior of thumb-up happens too early).
- the timings and the emotions of commenting operations made by the users for the multimedia resource can be used as the indicator data for measuring the user behaviors of the commenting type. If the playing-finishing progress of the multimedia resource is calculated, then the playing-finishing progress of the multimedia resource will be recorded every time the operation of commenting happens. Furthermore, positive and negative emotions of the user's comment can be quantified as much as possible. Theoretically, it is expected that there is no negative comment from the user, and that the behavior of commenting happens as early as possible (it is also fallacious if the behavior of commenting happens too early).
- one IP can perform collecting only once for one multimedia resource, then the timing of collecting operation made by the user for the multimedia resource can be used as the indicator data for measuring the user behaviors of the collecting type. If the playing-finishing progress of the multimedia resource is calculated, then the playing-finishing progress of the multimedia resource will be recorded every time the operation of collecting happens. Theoretically, it is expected that there are operations of collecting from the users, and that the behavior of collecting happens as early as possible (it is also fallacious if the behavior of collecting happens too early).
- leading-back flow rate ratio Times of leading-back/Times of emerging
- the times of leading-back refer to the times that the recommended multimedia resource is opened for the second time
- the times of emerging refer to the times that the multimedia resource has be recommended. If the playing-finishing progress of the multimedia resource is calculated, then the playing-finishing progress of the multimedia resource will be recorded every time the operation of recommending happens.
- the leading-back flow rate ratio can be calculated by crawling related data outstations. Theoretically, it is expected that there are recommending behaviors by the users, that the recommending behaviors happen as early as possible (it is also fallacious if the behavior of recommending happens too early), and that the leading-back flow rate ratio is as high as possible.
- the playing-finishing percentage of the multimedia resource, and the times of dragging the process bar (fast backward, fast forward) by the users can be used as the indicator data for measuring the user behaviors of the playing type. It is expected that the playing-finishing percentage of the users is as high as possible, that there is no fast-forward dragging, and that there are reasonable times of fast-backward dragging.
- the timings of downloading operation made by the users for the multimedia resource and the downloading-finishing progress can be used as the indicator data for measuring the user behaviors of the downloading type. If the playing-finishing progress of the multimedia resource is calculated, then the playing-finishing progress of the multimedia resource will be recorded every time the operation of downloading happens.
- the downloading-finishing progress can be used for measuring the user's determination to download the multimedia resource and the network condition. Theoretically, it is expected that there are downloading behaviors by the users, and that the behavior of downloading happens as early as possible (it is also fallacious if the behavior of downloading happens too early); it is also expected that 100% of the multimedia resource is fully downloaded.
- the building process of indicator data is a mapping process from user behaviors to indicator data: f : UserBehavior ⁇ Indicators .
- UserBehavior refers to the set of user behaviors
- Indicators refers to the set of indicator data.
- the building process of a cumulative distribution vector is a mapping process from indicator space to vector space: f : Indicators ⁇ V n .
- Indicators refers to the set of the indicator data
- V n refers to n -dimensional vector space.
- the second determining unit 430 is connected to the first determining unit 410 and configured to determine an upper boundary vector and a lower boundary vector of the multimedia resource according to the cumulative distribution vector.
- the best performance and the worst performance, i.e. the upper boundary and the lower boundary, of the indicator data can be defined by the second determining unit 430.
- the best performance comprises the maximum number of the thumb-up/thumb-down operations performed by the users for the multimedia resource at the same timing (in a reasonable range), the highest value of leading-back flow rate ratio of the recommended multimedia resource, and the maximum number of users who have fully watched the multimedia resource.
- both the upper boundary and the lower boundary of the multimedia resource on the indicator data can be expressed by using the vectors, i.e. the upper boundary vector and the lower boundary vector.
- the third determining unit 450 is connected to the first determining unit 410 and the second determining unit 430, and is configured to determine a quality score of the multimedia resource according to the cumulative distribution vector, the upper boundary vector and the lower boundary vector.
- the third determining unit 450 can determine the quality score of the multimedia resource according to the cumulative distribution vector determined by the first determining unit 410, and the upper and lower boundary vectors determined by the second determining unit 430. Theoretically, the farther a cumulative distribution vector is from the lower boundary vector, and the closer the cumulative distribution vector is to the upper boundary vector, the better the user behavior will be, which further shows a higher quality of the multimedia resource. For instance, distance proportion can be used for defining the quality score of the multimedia resource.
- Score is the quality score
- Dis tan ceTOTOP is the distance from the cumulative distribution vector to the upper boundary vector
- Dis tan ceBetween is the distance from the upper boundary vector to the lower boundary vector.
- the methods such as cosine similarity or multi-dimensional Euclidean distance can be used for calculating the distance between vectors. Besides, cosine similarity and multi-dimensional Euclidean distance can ensure that the value range of the quality score Score is [0,1].
- the method of cosine similarity includes drawing the vectors in a vector space according to their coordinate values, acquiring the angle between two vectors, and calculating the cosine value of the angle, and the cosine value can be used for representing similarity of the two vectors.
- Euclidean distance is a commonly adopted distance definition, which refers to the real distance between two points in an m-dimensional space.
- the Euclidean distance between the point A ( x 1 , y 1 ) and the point B ( x 2 , y 2 ) is x 1 ⁇ x 2 2 + y 1 ⁇ y 2 2 .
- Cosine similarity is a fine method of outputting normalized results
- Euclidean distance is a method of outputting global values. In practical operations, either one of the methods can be chosen according to necessities.
- the building process of the quality score of multimedia resource is a mapping process from a cumulative distribution vector to the interval [0,1]: f : V n ⁇ [0,1], wherein V n is a n -dimensional vector space, and [0,1] is the value range of the quality score Score.
- the quality assessment device provided in the example of the present disclosure is based on user experience and is faithful to the users' feeling, by using user behaviors on the multimedia resource for describing the quality of the multimedia resource, which enables the present disclosure to describe the quality of the multimedia resource more accurately.
- the quality assessment device provided in the example of the present disclosure has a great operability.
- the reason thereof may be, for Internet applications, plenty of multimedia resources are public online, so users can consume these multimedia resources by behaviors of clicking and watching, while enterprise backgrounds can record these user behaviors via the log system. Therefore, the process of the system providing service is right a process of data preparation for the quality assessment of multimedia resource, and it is simple and easy to obtain the user behaviors on multimedia resources.
- special staffs and systems are needed for traditional quality assessment devices which are based on native properties of multimedia resource to complete collecting and measuring related indicators.
- the quality assessment of multimedia resource can be performed either by using indicator data for only one type of user behaviors, or can be performed by using such as statistical methods according to the indicator data for multiple types of user behaviors.
- the quality score for each type of user behaviors can be individually calculated, then the quality scores for all types of user behaviors can be averaged, and the averaged score can be determined as the quality score of the multimedia resource.
- Fig. 5 illustrates a structural block diagram showing the quality assessment device of multimedia resource according to an Example 5 of the present disclosure.
- the quality assessment device 500 provided in Example 5 is used for realizing the quality assessment method shown in Fig. 2 .
- this quality assessment device 500 may mainly comprise a dividing subunit 510, a counting subunit 530, a determining subunit 550, a second determining unit 570, and a third determining unit 590.
- the dividing subunit 510 is configured to divide the indicator data for one type of user behaviors into multiple groups.
- the dividing subunit 510 can divide the indicator data for one type of user behaviors into multiple groups by using a method of non-overlapping grouping; for another example, the dividing subunit 510 can divide the indicator data for one type of user behaviors into multiple groups by using a method of overlapping grouping.
- the dividing subunit 510 may comprise:
- the process of grouping is as follows: if it is assumed that a group of data D in real number field is given, the obtaining module 511 can firstly obtain the maximum value max( D ) and the minimum value min( D ) of the data D ; then the dividing module 515 can equally divide the interval max( D )-min( D ) (which is also called Range) into n groups, and the corresponding dividing interval is max D ⁇ min D n which is also called grouping interval.
- n groups correspond to n grouping intervals, for instance, [ min D , min D + max D ⁇ min D n ) and max D ⁇ max D ⁇ min D n , max D are respectively the first grouping interval and the last grouping interval.
- the process of grouping is as follows: if it is assumed that a group of data D in real number field is given, the obtaining module 511 can firstly obtain the maximum value max( D ) and the minimum value min( D ) of the data D , and the interval [min( D ),max( D )] contains all of the data D ; then the dividing module 515 can equally divide the interval max( D )-min( D ) into n overlapping grouping intervals, for instance, min D , max D and [ min D , min D + max D ⁇ min D n ) are respectively the largest grouping interval and the smallest grouping interval.
- the counting subunit 530 is connected to the dividing subunit 510 and configured to count the number of the indicator data for this type of user behaviors included in each group.
- the counting subunit 530 can respectively count the number of indicator data falling into each group.
- the determining subunit 550 is connected to the counting subunit 530 and configured to determine the vector formed by the counted numbers for the multiple groups as the cumulative distribution vector of the one type of user behaviors on the multimedia resource.
- the cumulative distribution vector of the one type of user behaviors can be rapidly and directly determined according to the histogram of frequency distribution in which x axis represents the grouping interval and y axis represents the counted number.
- the second determining unit 570 is connected to the determining subunit 550 and configured to determine an upper boundary vector and a lower boundary vector of the multimedia resource according to the cumulative distribution vector.
- the third determining unit 590 is connected to the determining subunit 550 and the second determining unit 570, and is configured to determine a quality score of the multimedia resource according to the cumulative distribution vector, the upper boundary vector, and the lower boundary vector.
- the quality assessment device provided in the example of the present disclosure is based on user experience and is faithful to the users' feeling, by using user behaviors on the multimedia resource for describing the quality of the multimedia resource, which enables the present disclosure to describe the quality of the multimedia resource more accurately.
- the quality assessment device provided in the example of the present disclosure has a great operability.
- the reason thereof may be, for Internet applications, plenty of multimedia resources are public online, so users can consume these multimedia resources by behaviors of clicking and watching, while enterprise backgrounds can record these user behaviors via the log system. Therefore, the process of the system providing service is right a process of data preparation for the quality assessment of multimedia resource, and it is simple and easy to obtain the user behaviors on multimedia resources.
- special staffs and systems are needed for traditional quality assessment devices which are based on native properties of multimedia resource to complete collecting and measuring related indicators.
- Fig. 6 illustrates a structural block diagram showing the quality assessment device of multimedia resource according to an Example 6 of the present disclosure.
- the quality assessment device of multimedia resource provided in the present disclosure will be exemplified by using indicator data of the playing type of user behaviors, i.e. the playing-finishing percentage of the multimedia resource (e.g. the watching-finishing percentage of a video).
- the quality assessment device 600 provided in Example 6 is used for realizing the quality assessment method shown in Fig. 3a .
- the quality assessment device 600 may mainly comprise a using unit 610, an obtaining unit 620, a first determining unit 630, a second determining unit 640, a first calculation unit 650, and a second calculation unit 660.
- the using unit 610 is configured to use the video playing log of a certain website as the basic data source.
- the original video playing log is a data table at least containing the tetrad ⁇ Vids,PlayLength,FullLength,Time ⁇ , wherein Vids indicates the video being watched; PlayLength is the playing time length of the watching behavior, and is usually counted in seconds; FullLength is the full time length of the video being watched; and Time is the timestamp when the watching behavior happens.
- Each line of the original video playing log records the user's watching behavior by clicking the video at the corresponding timestamp.
- searching the log with different timestamps the data for users' watching behaviors in one day, one hour, or even at any moment can be obtained.
- Table 1 in Example 3 is an exemplary fragment from the watching log data of a video.
- the pre-processing can be performed on the afore-mentioned tetrad ⁇ Vids,PlayLength , FullLength,Time ⁇ , by collecting the watching time lengths of users in the video playing log.
- video playing data in a special time period can be selected by defining the Time field, e.g. a video playing data with Time "20160105" can be selected from the video playing log.
- the playing-finishing percentage of a video (which is also called watching-finishing percentage of the video) with Vids "1" can be calculated by using PlayLength / FullLength, so as to obtain a perc field for the video with Vids "1".
- Data screening can also be performed on the playing-finishing percentage data of the video, for instance, the data with a perc >100% should be discarded.
- the obtaining unit 620 is connected to the using unit 610 and configured to obtain indicator data, i.e. the playing-finishing percentage of the video based on the video playing log.
- relevant description for step S302 in Example 3 could be referred to.
- the first determining unit 630 is connected to the obtaining unit 620, and is configured to divide the indicator data playing-finishing percentage perc of the playing type of user behaviors into multiple groups, and determine the cumulative distribution vector of the indicator data playing-finishing percentage perc .
- the first determining unit 630 can divide the playing-finishing percentage perc into multiple groups by using either the non-overlapping grouping method or the overlapping grouping method described in Example 2.
- a frequency distribution histogram can be used for displaying the frequency distribution of the playing-finishing percentage perc, wherein the height of the rectangle in the frequency distribution histogram represents the ratio between the frequency of corresponding group and the grouping interval (since the grouping interval is a constant, and for the convenience of drawing and watching the histogram, the height of the rectangle is directly used for representing the frequency).
- the frequency distribution histogram is capable of clearly showing the frequency distribution of each group, and can easily show the frequency differences between groups. For details, relevant description for step S303 in Example 3 could be referred to.
- the second determining unit 640 is connected to the first determining unit 630 and is configured to determine an upper boundary vector and a lower boundary vector of the playing-finishing percentage according to playing-finishing percentage cumulative distribution vector V vid .
- step S304 in Example 3 For details, relevant description for step S304 in Example 3 could be referred to.
- the first calculation unit 650 is connected to the first determining unit 630 and the second determining unit 640, and is configured to calculate, after the playing-finishing percentage cumulative distribution vector V vid is determined by the first determining unit 630, and the upper boundary vector V t and the lower boundary vector V b of the playing-finishing percentage are determined by the second determining unit 640, the distance from the playing-finishing percentage cumulative distribution vector V vid to the upper boundary vector V t of the playing-finishing percentage, and the distance from the upper boundary vector V t of the playing-finishing percentage to the lower boundary vector V b of the playing-finishing percentage.
- step S305 in Example 3 For details, relevant description for step S305 in Example 3 could be referred to.
- the second calculation unit 660 is connected to the first calculation unit 650, and is configured to calculate, after the distance from the playing-finishing percentage cumulative distribution vector V vid to the upper boundary vector V t of the playing-finishing percentage, and the distance from the upper boundary vector V t of the playing-finishing percentage to the lower boundary vector V b of the playing-finishing percentage are calculated by the first calculation unit 650, the quality score of the video by using the Formula 2 below.
- Score vid 1 ⁇ d V vid , V t d V t , V b
- relevant description for step S306 in Example 3 could be referred to.
- the quality assessment device provided in the example of the present disclosure is based on user experience and is faithful to the users' feeling, by using user behaviors on the multimedia resource for describing the quality of the multimedia resource, which enables the present disclosure to describe the quality of the multimedia resource more accurately.
- the quality assessment device provided in the example of the present disclosure has a great operability.
- the reason thereof may be, for Internet applications, plenty of multimedia resources are public online, so users can consume these multimedia resources by behaviors of clicking and watching, while enterprise backgrounds can record these user behaviors via the log system. Therefore, the process of the system providing service is right a process of data preparation for the quality assessment of multimedia resource, and it is simple and easy to obtain the user behaviors on multimedia resources.
- special staffs and systems are needed for traditional quality assessment devices which are based on native properties of multimedia resource to complete collecting and measuring related indicators.
- Fig. 7 is a structural block diagram showing the quality assessment apparatus for multimedia resource in an additional example of the present disclosure.
- the quality assessment apparatus 1100 for multimedia resource can be a host server, a personal computer PC, or a portable computer or terminal and so on. There is no restriction in the examples of the present disclosure on the specific realization of compute nodes.
- the quality assessment apparatus 1100 for multimedia resource comprises: a processor 1110, a communication interface 1120, a memory 1130 and a bus 1140, wherein intercommunications between the processor 1110, the communication interface 1120 and the memory is accomplished via the bus 1140.
- the communication interface 1120 is configured to communicate with network equipment including, e.g. the virtual machine management center, the shared memory or the like.
- the processor 1110 is configured to execute programs.
- the processor 1110 can be a CPU, or an ASIC (Application Specific Integrated Circuit), or can be configured to be one or more integrated circuits for implementing the examples of the present disclosure.
- ASIC Application Specific Integrated Circuit
- the memory 1130 is configured to store files.
- the memory 1130 may comprise a high-speed RAM memory, and may also comprise a non-volatile memory such as at least one disk memory.
- the memory 1130 may also be a memory array.
- the memory 1130 may also be blocked, and the blocks can be combined into a virtual volume according to certain rules.
- the above program may be a program code including computer operation instructions.
- This program can be specifically used for realizing the operations in each step of the methods in Examples 1, 2 or 3.
- This computer software product is generally stored in computer-readable non-volatile memory medium, and includes several instructions so that the computer equipment (which can be a personal computer, a server, or a network equipment and so on) can execute all or a part of the steps of the method in each example of the present disclosure.
- the afore-mentioned memory medium includes all kinds of medium capable of storing program codes, such as U disk, mobile hard disk, ROM (Read-Only Memory), RAM (Random Access Memory), diskette, optical disk and so on.
- the methods and devices for assessing quality of multimedia resource in the examples of the present disclosure can better describe the quality of multimedia resource, and have a great operability. Moreover, after the quality of multimedia resource is assessed by using the quality assessment method of multimedia resource in the examples of the present disclosure, the feedback of online behaviors can be reflected on the final dynamic and optimal ranking and recommendation of multimedia resource.
Landscapes
- Engineering & Computer Science (AREA)
- Theoretical Computer Science (AREA)
- Databases & Information Systems (AREA)
- Data Mining & Analysis (AREA)
- Physics & Mathematics (AREA)
- General Engineering & Computer Science (AREA)
- General Physics & Mathematics (AREA)
- Multimedia (AREA)
- Library & Information Science (AREA)
- Testing, Inspecting, Measuring Of Stereoscopic Televisions And Televisions (AREA)
- Two-Way Televisions, Distribution Of Moving Picture Or The Like (AREA)
Applications Claiming Priority (2)
| Application Number | Priority Date | Filing Date | Title |
|---|---|---|---|
| CN201610159190.0A CN105843876B (zh) | 2016-03-18 | 2016-03-18 | 多媒体资源的质量评估方法和装置 |
| PCT/CN2016/099358 WO2017156994A1 (zh) | 2016-03-18 | 2016-09-19 | 多媒体资源的质量评估方法和装置 |
Publications (2)
| Publication Number | Publication Date |
|---|---|
| EP3346396A1 true EP3346396A1 (de) | 2018-07-11 |
| EP3346396A4 EP3346396A4 (de) | 2018-09-26 |
Family
ID=56587563
Family Applications (1)
| Application Number | Title | Priority Date | Filing Date |
|---|---|---|---|
| EP16894153.2A Ceased EP3346396A4 (de) | 2016-03-18 | 2016-09-19 | Verfahren und vorrichtung zur beurteilung der qualität von multimedia-ressourcen |
Country Status (5)
| Country | Link |
|---|---|
| US (1) | US10762122B2 (de) |
| EP (1) | EP3346396A4 (de) |
| CN (1) | CN105843876B (de) |
| TW (1) | TWI629899B (de) |
| WO (1) | WO2017156994A1 (de) |
Families Citing this family (7)
| Publication number | Priority date | Publication date | Assignee | Title |
|---|---|---|---|---|
| CN105843876B (zh) | 2016-03-18 | 2020-07-14 | 阿里巴巴(中国)有限公司 | 多媒体资源的质量评估方法和装置 |
| CN108200471B (zh) * | 2018-01-08 | 2019-08-16 | 中国科学技术大学 | 一种评测加密视频QoE的标准数据集的构建方法 |
| CN108632670B (zh) * | 2018-03-15 | 2021-03-26 | 北京奇艺世纪科技有限公司 | 一种视频满意度确定方法及装置 |
| US11176654B2 (en) * | 2019-03-27 | 2021-11-16 | Sharif University Of Technology | Quality assessment of a video |
| CN110366043B (zh) * | 2019-08-20 | 2022-02-18 | 北京字节跳动网络技术有限公司 | 视频处理方法、装置、电子设备及可读介质 |
| CN113742564B (zh) * | 2020-05-29 | 2025-01-14 | 北京沃东天骏信息技术有限公司 | 目标资源的推送方法和装置 |
| CN118312639B (zh) * | 2024-06-05 | 2024-08-23 | 河源职业技术学院 | 一种用于多媒体教学的音频管理系统 |
Family Cites Families (26)
| Publication number | Priority date | Publication date | Assignee | Title |
|---|---|---|---|---|
| US8063295B2 (en) * | 2002-10-03 | 2011-11-22 | Polyphonic Human Media Interface, S.L. | Method and system for video and film recommendation |
| US7933338B1 (en) * | 2004-11-10 | 2011-04-26 | Google Inc. | Ranking video articles |
| US20150052155A1 (en) * | 2006-10-26 | 2015-02-19 | Cortica, Ltd. | Method and system for ranking multimedia content elements |
| US20080127280A1 (en) * | 2006-11-27 | 2008-05-29 | Shaobo Kuang | Method and system for ranking videos / movies or other objects, and inserting commercial advertisements in the objects |
| US8565228B1 (en) * | 2007-03-28 | 2013-10-22 | Control4 Corporation | Systems and methods for selecting and ranking video streams |
| US20100299303A1 (en) * | 2009-05-21 | 2010-11-25 | Yahoo! Inc. | Automatically Ranking Multimedia Objects Identified in Response to Search Queries |
| CN101887460A (zh) * | 2010-07-14 | 2010-11-17 | 北京大学 | 一种文献质量评估方法及应用 |
| TWI449410B (zh) * | 2011-07-29 | 2014-08-11 | Nat Univ Chung Cheng | Personalized Sorting Method of Internet Audio and Video Data |
| US8719854B2 (en) * | 2011-10-28 | 2014-05-06 | Google Inc. | User viewing data collection for generating media viewing achievements |
| CN103188236B (zh) * | 2011-12-30 | 2015-12-16 | 华为技术有限公司 | 媒体传输质量的评估方法和装置 |
| US8935581B2 (en) * | 2012-04-19 | 2015-01-13 | Netflix, Inc. | Upstream fault detection |
| CN103379358B (zh) * | 2012-04-23 | 2015-03-18 | 华为技术有限公司 | 评估多媒体质量的方法和装置 |
| CN102740143B (zh) * | 2012-07-03 | 2014-08-20 | 合一网络技术(北京)有限公司 | 一种基于用户行为的网络视频榜单生成系统及其方法 |
| US20140074857A1 (en) * | 2012-09-07 | 2014-03-13 | International Business Machines Corporation | Weighted ranking of video data |
| CN103870454A (zh) * | 2012-12-07 | 2014-06-18 | 盛乐信息技术(上海)有限公司 | 数据推荐方法及系统 |
| US9165069B2 (en) * | 2013-03-04 | 2015-10-20 | Facebook, Inc. | Ranking videos for a user |
| US9405775B1 (en) * | 2013-03-15 | 2016-08-02 | Google Inc. | Ranking videos based on experimental data |
| CN103209342B (zh) * | 2013-04-01 | 2016-06-01 | 电子科技大学 | 一种引入视频流行度和用户兴趣变化的协作过滤推荐方法 |
| US20150095320A1 (en) * | 2013-09-27 | 2015-04-02 | Trooclick France | Apparatus, systems and methods for scoring the reliability of online information |
| CN104035982B (zh) * | 2014-05-28 | 2017-10-20 | 小米科技有限责任公司 | 多媒体资源推荐方法及装置 |
| CN104182816A (zh) * | 2014-07-09 | 2014-12-03 | 浙江大学 | 基于Vague集和改进逼近理想解的电能质量综合评估方法及其应用 |
| CN104123467A (zh) * | 2014-07-24 | 2014-10-29 | 合肥工业大学 | 一种基于专家偏好的gra—topsis模型的评价方法 |
| CN104506894A (zh) * | 2014-12-22 | 2015-04-08 | 合一网络技术(北京)有限公司 | 多媒体资源评估方法及其装置 |
| CN104616215A (zh) * | 2015-03-05 | 2015-05-13 | 华北电力大学 | 一种火电厂能效综合评价方法 |
| US10180968B2 (en) * | 2015-07-23 | 2019-01-15 | Netflix, Inc. | Gaussian ranking using matrix factorization |
| CN105843876B (zh) * | 2016-03-18 | 2020-07-14 | 阿里巴巴(中国)有限公司 | 多媒体资源的质量评估方法和装置 |
-
2016
- 2016-03-18 CN CN201610159190.0A patent/CN105843876B/zh active Active
- 2016-09-19 US US15/758,836 patent/US10762122B2/en active Active
- 2016-09-19 EP EP16894153.2A patent/EP3346396A4/de not_active Ceased
- 2016-09-19 WO PCT/CN2016/099358 patent/WO2017156994A1/zh not_active Ceased
-
2017
- 2017-03-08 TW TW106107501A patent/TWI629899B/zh active
Also Published As
| Publication number | Publication date |
|---|---|
| WO2017156994A1 (zh) | 2017-09-21 |
| TWI629899B (zh) | 2018-07-11 |
| US10762122B2 (en) | 2020-09-01 |
| CN105843876A (zh) | 2016-08-10 |
| CN105843876B (zh) | 2020-07-14 |
| US20200192930A1 (en) | 2020-06-18 |
| EP3346396A4 (de) | 2018-09-26 |
| TW201735654A (zh) | 2017-10-01 |
Similar Documents
| Publication | Publication Date | Title |
|---|---|---|
| EP3346396A1 (de) | Verfahren und vorrichtung zur beurteilung der qualität von multimedia-ressourcen | |
| US11914639B2 (en) | Multimedia resource matching method and apparatus, storage medium, and electronic apparatus | |
| CN110309795B (zh) | 视频检测方法、装置、电子设备及存储介质 | |
| US9251406B2 (en) | Method and system for detecting users' emotions when experiencing a media program | |
| KR101571443B1 (ko) | 동영상 동시발생 통계에 기반한 동영상 추천 | |
| US11190821B2 (en) | Methods and apparatus for alerting users to media events of interest using social media analysis | |
| CN1538351B (zh) | 为视频序列生成视频缩略图的方法和计算机 | |
| CN106326391B (zh) | 多媒体资源推荐方法及装置 | |
| EP3322194A1 (de) | Videoempfehlungsverfahren, server und speichermedium | |
| CN106339507B (zh) | 流媒体消息推送方法和装置 | |
| Ma et al. | No-reference retargeted image quality assessment based on pairwise rank learning | |
| US20170169040A1 (en) | Method and electronic device for recommending video | |
| WO2017181612A1 (zh) | 个性化视频推荐方法及装置 | |
| CN104053023B (zh) | 一种确定视频相似度的方法及装置 | |
| CN114747227A (zh) | 跨人口统计群体估计普查级受众规模和总印象持续时间的方法、系统和装置 | |
| CN108062692B (zh) | 一种录音推荐方法、装置、设备及计算机可读存储介质 | |
| US20130212105A1 (en) | Information processing apparatus, information processing method, and program | |
| CN110110206B (zh) | 物品间关系挖掘及推荐方法、装置、计算设备、存储介质 | |
| WO2022007626A1 (zh) | 视频内容推荐方法、装置及计算机设备 | |
| CN103634623A (zh) | 一种用于分享目标视频的方法与设备 | |
| CN110309361B (zh) | 一种视频评分的确定方法、推荐方法、装置及电子设备 | |
| CN105956061A (zh) | 一种用户间相似度确定方法及装置 | |
| US8306992B2 (en) | System for determining content topicality, and method and program thereof | |
| CN107733874A (zh) | 信息处理方法、装置、计算机设备和存储介质 | |
| CN113779369A (zh) | 匹配方法、匹配装置、电子设备及存储介质 |
Legal Events
| Date | Code | Title | Description |
|---|---|---|---|
| PUAI | Public reference made under article 153(3) epc to a published international application that has entered the european phase |
Free format text: ORIGINAL CODE: 0009012 |
|
| 17P | Request for examination filed |
Effective date: 20180404 |
|
| AK | Designated contracting states |
Kind code of ref document: A1 Designated state(s): AL AT BE BG CH CY CZ DE DK EE ES FI FR GB GR HR HU IE IS IT LI LT LU LV MC MK MT NL NO PL PT RO RS SE SI SK SM TR |
|
| AX | Request for extension of the european patent |
Extension state: BA ME |
|
| A4 | Supplementary search report drawn up and despatched |
Effective date: 20180827 |
|
| RIC1 | Information provided on ipc code assigned before grant |
Ipc: G06F 17/30 20060101AFI20180821BHEP |
|
| 17Q | First examination report despatched |
Effective date: 20190503 |
|
| DAV | Request for validation of the european patent (deleted) | ||
| DAX | Request for extension of the european patent (deleted) | ||
| REG | Reference to a national code |
Ref country code: DE Ref legal event code: R003 |
|
| STAA | Information on the status of an ep patent application or granted ep patent |
Free format text: STATUS: THE APPLICATION HAS BEEN REFUSED |
|
| 18R | Application refused |
Effective date: 20200424 |