EP3349078A1 - Dispositif de diagnostic et procédé de surveillance et/ou d'optimisation d'un dispositif de réglage - Google Patents
Dispositif de diagnostic et procédé de surveillance et/ou d'optimisation d'un dispositif de réglage Download PDFInfo
- Publication number
- EP3349078A1 EP3349078A1 EP17151001.9A EP17151001A EP3349078A1 EP 3349078 A1 EP3349078 A1 EP 3349078A1 EP 17151001 A EP17151001 A EP 17151001A EP 3349078 A1 EP3349078 A1 EP 3349078A1
- Authority
- EP
- European Patent Office
- Prior art keywords
- variable
- control
- model
- control device
- setpoint
- Prior art date
- Legal status (The legal status is an assumption and is not a legal conclusion. Google has not performed a legal analysis and makes no representation as to the accuracy of the status listed.)
- Withdrawn
Links
Images


Classifications
-
- G—PHYSICS
- G05—CONTROLLING; REGULATING
- G05B—CONTROL OR REGULATING SYSTEMS IN GENERAL; FUNCTIONAL ELEMENTS OF SUCH SYSTEMS; MONITORING OR TESTING ARRANGEMENTS FOR SUCH SYSTEMS OR ELEMENTS
- G05B13/00—Adaptive control systems, i.e. systems automatically adjusting themselves to have a performance which is optimum according to some preassigned criterion
- G05B13/02—Adaptive control systems, i.e. systems automatically adjusting themselves to have a performance which is optimum according to some preassigned criterion electric
- G05B13/04—Adaptive control systems, i.e. systems automatically adjusting themselves to have a performance which is optimum according to some preassigned criterion electric involving the use of models or simulators
-
- G—PHYSICS
- G05—CONTROLLING; REGULATING
- G05B—CONTROL OR REGULATING SYSTEMS IN GENERAL; FUNCTIONAL ELEMENTS OF SUCH SYSTEMS; MONITORING OR TESTING ARRANGEMENTS FOR SUCH SYSTEMS OR ELEMENTS
- G05B19/00—Program-control systems
- G05B19/02—Program-control systems electric
- G05B19/04—Program control other than numerical control, i.e. in sequence controllers or logic controllers
- G05B19/042—Program control other than numerical control, i.e. in sequence controllers or logic controllers using digital processors
- G05B19/0428—Safety, monitoring
Definitions
- the invention relates to a diagnostic device and a method for monitoring and / or optimization of a control device for a controlled system, wherein the diagnostic device is adapted to store at least one record with recorded during operation of the control device temporal data sequences of the process variable setpoint, manipulated variable and controlled variable of the controlled system and Determining determination and / or display of a diagnostic statement. If necessary, an optimization of the control device to improve the control quality can be made.
- Process or process plants use a variety of control loops for influencing physical or chemical parameters in technical processes.
- a permanent and automatic monitoring of the control loops with regard to their control quality is advantageous, so that in case of decreasing efficiency of individual control loops intervention can take place in a timely and targeted manner at the right point of the plant with measures for maintenance and / or controller optimization.
- a controller optimization can be carried out on the basis of a system model, for the identification of which values of the process variable manipulated variable and controlled variable are recorded on the basis of a real controlled system. For example, from the EP 0 520 233 A2 It is known how parameters of a linear system model can be identified and a classic PID controller can be parameterized as a function of this. For routes with non-linear properties whose behavior depends on the respective operating point, however, the known method often yields only insufficient results.
- the invention has for its object to provide a diagnostic device and a method for monitoring and / or optimization of a control device for a controlled system, which gives better results in control circuits with controlled systems whose behavior depends on the respective operating point of the control loop.
- a diagnosis of control circuits is particularly advantageous in batch processes, which are also referred to as batch processes, as well as in continuous processes, which are accompanied by load changes or variety changes.
- batch processes which are also referred to as batch processes
- continuous processes which are accompanied by load changes or variety changes.
- an operating point-dependent diagnosis is usually not required.
- Causes for an operating point dependency can be a time-variant and / or a non-linear process behavior.
- Non-linear process behavior occurs, for example, in the case of a non-linear characteristic curve of an actuator, for example in the case of a non-linear valve characteristic, pump characteristic curve, heat exchanger characteristic curve, etc.
- Mechanical effects such as friction or slack in actuators can also be the cause of nonlinear behavior.
- a "historical" database which was recorded and stored in an installation in a previous operation of the plant, can be evaluated or it can be used a possibility, a controlled system, for example by applying a jump-shaped control variable course active in manual mode.
- the determination of the simulation model can, for example, with the aid of the above-mentioned EP 0 520 233 A2 done known method.
- a data set acquired and stored during operation of the control device which represents the database underlying the further evaluation, is divided into different time sections.
- This division preferably takes place automatically on the basis of predetermined selection criteria or, for example, by an operator by means of a graphical editor, which graphically displays time profiles of various process variables occurring in the control loop and allows manual selection of suitable time segments by the operator.
- time segments which are particularly suitable for determining a parameter of a system model that depends on the respective operating point are selected from the data set.
- time segments which each contain the following: a setpoint step with pre- and post-run, an automatic mode with constant setpoint, a manual mode with manual presetting of the manipulated variable, operating phases with a setpoint ramp or other ranges with permanently variable setpoint.
- process identification in the different Time intervals leads to almost unchanged parameters of the route model can be determined as a diagnostic statement, for example, and displayed that the behavior of the route can be described sufficiently well with a single, point-independent model.
- time segments are selected according to a first criterion in which at least approximately a stationary state of the control loop can be determined.
- a first criterion in which at least approximately a stationary state of the control loop can be determined.
- the process variables manipulated variable and controlled variable temporal average values are calculated, based on which a steady state characteristic curve of the controlled system can be determined.
- the local process gain is determined. If the local process gain is almost the same everywhere, it can be determined as a diagnostic statement and indicated that a non-linear characteristic is to be excluded.
- the system amplification already represents a variable that is meaningful for the diagnosis, since it can be used in particular for characterizing a behaviorally varying behavior of the route due to nonlinearities.
- the range of values of the process variable setpoint is determined and divided into several sections.
- This so-called clustering takes place in up to five groups, to each of which a subarea of the range of values is assigned, for example with a so-called k-means algorithm.
- the time segments selected according to the first criterion are assigned to their respective mean value of the process variable desired value corresponding to the partial regions.
- a differentiated diagnosis can now follow.
- the respective control quality in the areas with a constant desired value can be determined cluster-specific, or a detection of oscillations whose occurrence is cluster-dependent can follow.
- the record is searched for periods of time, each having a setpoint jump. If the start and end values lie within the same cluster, the time periods found can be assigned to the respective cluster. For larger setpoint jumps, whose start and end values are not within the same cluster, such assignment to a single cluster is not possible. On the basis of a cluster associated with a time period with the largest setpoint jump can be made due to the then particularly good Stör- / Nutzsignal ratio advantageous identification of a dynamic system model, which in turn is assigned to the respective cluster.
- time intervals from the data set with different, still sufficient excitation of the process dynamics for example with a ramped setpoint course
- time sections with a strongly variable setpoint or time sections in which control value jumps are manually generated in manual mode of the controller are also suitable
- the identification of a dynamic system model can be followed by its validation by simulation of the closed control loop from the beginning of a time segment allocated to the respective cluster up to its end. If an insufficient quality of the track model was found in the simulation, another or a longer period of time for a new identification of a dynamic track model for the respective cluster are used. For time periods with smaller setpoint jumps within the same cluster, the control quality can also be determined with the existing controller to carry out a further diagnosis.
- a suitable method is, for example, in the article of Bernd-Markus Pfeiffer, "Control Performance Monitoring with a combination of stochastic and deterministic features", GMA Congress 2005, Baden-Baden, VDI reports 1883, VDI-Verlag, Dusseldorf, pages 411-420, described s.
- a so-called Hammerstein model can be used as common track model for all clusters, which consists of a nonlinear characteristic of the process gain and one of the average dynamics of the different track models corresponding dynamic model is composed.
- a method suitable for the identification of such a Hammerstein model is disclosed, for example, in the European patent application with the filing symbol 15177789.3 proposed.
- To check the quality of the identified Hammerstein model it is then possible to calculate a value of a quality function for evaluating the quantitative deviations between the virtual model and the real controlled system, in particular over the entire data set.
- the inverse of the steady-state characteristic which is determined by the non-linear process gain, can then be formed as part of an optimization of the control device, and a compensating element corresponding thereto can be connected, for example, in the form of a polygon between the controller and the controlled system become.
- dynamic models are additionally determined for the different clusters.
- a value of a predefined or predefinable quality criterion can be calculated in each case when using the previous control device for determining a diagnostic statement for the clusters. If the control quality in all clusters is sufficiently high and does not differ greatly, the deviations between the dynamic models are so small that they do not interfere with the process behavior. It is thus obtained the diagnosis statement that there is no further need for action to optimize the control device.
- a robust controller can be automatically model-based on the basis of the dynamic distance models obtained for the clusters with a method of Pol Hochsvorgabe be determined by quality vector optimization, which will be explained later. With this rugged controller design, you may get a controller with a set of parameters that will allow satisfactory performance with all models.
- Gain scheduling a controller is designed separately for each cluster and a parameter timetable with linear interpolation is created for the cluster transitions.
- the dynamic route model previously obtained for the respective cluster serves as the basis for the design of the the respective cluster used regulator.
- Gain scheduling is known, for example, from the Siemens Industry Online Support application example with entry ID: 38755162, "PID control with operating point-dependent parameter control (gain scheduling) and PID tuning".
- a diagnostic device and a diagnostic method for monitoring and / or optimizing a control device for a controlled system can be implemented, for example, by means of an engineering tool of a process control system or advantageously in a software environment for cloud-based system monitoring.
- a software environment represents, for example, the data-based remote service "Control Performance Analytics” from Siemens AG.
- Data from a customer system is collected with the help of software agents, aggregated and sent to a Siemens Service Operation Center, in which they are stored on a Remote service computers are stored. There, the data is semi-automatically evaluated with the aid of various "Data Analytics" software applications. If required, specially trained experts can work very efficiently on this database for remote service.
- the results of the diagnosis and the optimization of the control can be displayed on a monitor of the remote service computer and / or provided on a Sharepoint so that it is viewed by the end customer, that is the operator of the automated process plant, for example in a browser can be. If a comparison of the newly designed control device with the system already existing in the system offers advantages for the user, this can be offered to the acquisition and use of the new control device.
- the diagnostic device and the method for monitoring and / or optimizing a control device are thus preferably implemented in software or in a combination of software / hardware, so that the invention also provides a computer program with computer-executable program code instructions for implementing the method on a suitable computer Computing unit concerns.
- the invention also relates to a computer program product, in particular a data carrier or a storage medium, with a computer program executable by a computer.
- a computer program can for example be held in or loaded into a memory of a control system of an automated process plant, so that the method for monitoring the control device and optionally for optimizing it is automatically executed during operation of the system, or the computer program can be used in a cloud system. based environment in a memory of a remote service computer held or be loadable in this.
- the computer program can also be kept in a computer connected to the control system and the remote service computer, which communicates via networks with the other two systems.
- FIG. 1 forms a controlled system 1 with a control device 2 is part of an automated process plant whose behavior is monitored and optionally optimized.
- a control variable y is measured on the controlled system 1 and fed back to the control device 2 for adjustment to a desired value w, which is predetermined for example by an operating unit 3.
- the structure of the control device 2 can also be selected by means of a control signal s, and the controller type determined thereby can be provided with the respectively required parameters p. This can be automated or corresponding to the input of an operator 4.
- control signal s By means of the control signal s, the structure of a conventional P, PD, PI or PID controller, a conventional controller with a downstream characteristic element for compensating an operating-point-dependent process gain or a controller, designed according to the gain-scheduling method, can be selected in particular.
- the parameters p of the respectively selected controller are automatically determined by a device 5, which is designed for monitoring and optimizing the control device 2, and offered to the operator 4 by display on the operating unit 3 for optional transfer to the control device 2.
- the device 5 has a data memory 6 in which one or more data sets are stored with temporal data sequences of different process variables detected during operation of the control device 2, in particular the desired value w, a manipulated variable u and the controlled variable y. This may be, for example, historical process data that was recorded during a previous operation of the plant in the sense of a non-invasive diagnosis.
- the data stored in the memory 6 may be process variable traces obtained by active excitation of the controlled system 1 in manual mode, for example in the case of sudden excitation for better identification of a simulation model for the controlled system 1.
- An evaluation device 7 identifies by means of or the data stored in the data memory 6 records the structure and the parameters of one or more suitable simulation models, which in the case of multiple simulation models this also each determined by the evaluation 7 and operating points of the control device 2 are assigned. On the basis of the simulation model (s) obtained as well as taking into account various specifications v of the operator 4, for example a specification of secondary conditions to be taken into account in a parameter optimization, the parameters p are also determined by the evaluation device 7.
- the device 5 for monitoring and / or optimizing the control device 2 can be implemented, for example, by an engineering tool of a control system or by a remote service computer of a cloud-based system monitoring.
- FIG. 2 By way of example, a structure of a control device 10 is shown, which is obtained when, as a controller type of the control device 2 (FIG. FIG. 1 ) a conventional controller 11, for example a PID controller, with downstream element 12 for compensation of a nonlinearity of a controlled system. 1 ( FIG. 1 ) is selected.
- the controlled system 1 is in the in FIG. 2 shown embodiment modeled by a Hammerstein model 13, which is composed of a characteristic element 14 for modeling an operating point-dependent process gain and a downstream linear dynamic model 15.
- a disturbance d which may be designed, for example, as colored noise, is additionally applied to the model output.
- Control value u, controlled variable y and setpoint w have already been determined FIG. 1 explained.
- compensating member 12 is formed from the manipulated variable u a compensated manipulated variable uk, which in a control loop simulation on the Hammerstein model 13 or in the application of the control device 10 in the real system on the controlled system 1 ( FIG. 1 ) is given.
- a polygon of the member 12 is an inverse of the characteristic of the member 14, so that the controller 11 gets to see a total linear behavior again.
- FIGS. 3 and 4 an optimization of a control device for the case will be explained in more detail that a controlled system 1 ( FIG. 1 ) through a Hammerstein model 13 ( FIG. 2 ) can be approximated well.
- the abscissa the compensated manipulated variable uk in percent (%) and plotted on the ordinate the controlled variable y in degrees Celsius (° C).
- a characteristic curve 30 was determined pointwise; the respective calculated points are marked on the curve 30 by stars.
- the control variable u is plotted on the abscissa and the compensated control variable uk is plotted on the ordinate.
- the stationary characteristic curve 30 represents the steady-state amplification of the route and therefore forms an adjustment range, for example 0 to 100 percent of a valve position, over a value range of a controlled variable, for example 20 to 300 ° C.
- the characteristic curve 30 is first inverted point by point. However, the inverse characteristic curve would map the value range of the controlled variable to the setting range. It is therefore preceded by a linear transformation, which maps the setting range to the control range. The concatenation of this transformation with the inverse characteristic overall forms the compensation characteristic 40.
- the compensation characteristic 40 which already contains the linear transformation, therefore maps the manipulated variable u originally output by the controller to a compensated manipulated variable uk which comprises the same setting range, so that the Manipulated variable limits on the controller 11 ( FIG.
- a compensation element 12 ( FIG. 2 ) in a control device 2 can be done, for example, in the SIMATIC PCS 7 control system using the Polygon function block from the Advanced Process Library.
- a controller 11 ( FIG. 2 ) in a control device 2, 10 downstream compensation member 12 a model-based design of the controller 11 is based on a linear dynamic model 15 with medium gain factor.
- a robust controller design may be a suitable means of optimizing the controller 2.
- a robust controller design will look for a parameter set for the controller that will provide satisfactory control over the entire data set using the models identified for the clusters.
- the method of Pol Schemevorgabe by means of quality vector optimization according to Steinhauser is particularly suitable.
- the poles of the closed loop are specified for a model.
- the poles determine the dynamic behavior of the controlled system. If the model changes, using the same slider, the poles shift and the dynamic behavior changes. As a rule, this leads to a deterioration of the control quality.
- the controller design takes place in such a way that the poles of all closed-loop control circuits of the model family controlled by the same controller lie in a predefined or predefinable area.
- FIG. 5 should a Pol Schl.vorgabe be explained in more detail. Shown in FIG. 5 is an s-plane with a real part ⁇ on the abscissa and an imaginary part ⁇ on the ordinate.
- a pole region r is defined, wherein an edge C 1 specifies a minimum dynamics, ie a minimum velocity of the closed loop, and edges C 2 and C 4 specify a minimum damping of the closed loop.
- An edge C 3 limits the smallest time constant of the closed loop, which corresponds to the specification of a maximum bandwidth and is especially important for the realization as a digital controller. Since the poles of the closed loop for all identified track models are in the predetermined pole area,, thus possess all the minimum dynamics and the minimum damping.
- a quality function can be defined, which assumes a very small value close to zero for poles within the pole region ⁇ and a very large value, for example significantly greater than one, for poles outside.
- an optimization can now be carried out with respect to the quality function. It is advantageous that, with a suitable choice of the quality function, its gradient with respect to the controller parameters of a stationary or dynamic output feedback can be formed analytically, so that advantageously gradient-based optimization methods can be used. Instead of a static or dynamic output feedback, this method can also be applied to the application of a conventional PID controller. Failure to find a controller that will loop the closed loop poles into the pole region for the full model family is easily detected by a large value of the goodness criterion at the end of the optimization. However, to design a robust regulator, for example, the pole region can be increased or the regulator structure, for example, selection of a PID controller instead of a PI controller, changed.
- a controller design according to the so-called gain-scheduling method can be used in an automated manner, in which a controller is determined for each cluster and where the dynamic system model obtained for the respective cluster is used as the basis for the controller design is used.
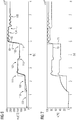
- FIGS. 6 and 7 are shown as examples a profile 60 of a setpoint value, a profile 61 of a controlled variable or a profile 70 of a manipulated variable that corresponds to a data set stored in the data memory 6 (FIG. FIG. 1 ).
- the abscissa represents time t in seconds (s), ordinate setpoint w and controlled variable y in degrees Celsius and manipulated variable u in percent.
- the data record is searched for time segments in which the control loop is in an automatic mode was driven with at least approximately constant setpoint w. In this case, time intervals 100... 105 can be found, which each begin approximately when a stationary state is reached and end shortly before the occurrence of the respectively next setpoint change.
- a time average of the controlled variable y and the manipulated variable u is determined and converted into a diagram according to FIG FIG. 8 entered.
- a stationary point 200 is obtained for the period 100, a stationary point 201 for the period 101, and so forth.
- the connection of all sorted stationary points 200... 205 delivers a steady-state characteristic 80 of the controlled system.
- FIGS. 6 and 7 is not the complete, the evaluation underlying data set shown. Further, in FIG. 8 Stationary points not referenced are based on stationary states found outside the display area.
- the local line gain is then calculated.
- the results of a line gain K which is dependent on the respective operating point, are shown in the diagram in FIG. 9 plotted over the manipulated variable u. It can be seen that the largest and the smallest value of the path gain K differ by more than a factor of 10. Because of this significant difference in the model parameter line gain K can already be obtained the diagnosis that there is a significant nonlinearity of the controlled system and with a conventional controller alone hardly a control quality can be obtained, which is sufficient over the entire control range. If, on the other hand, the local system gain K were almost the same everywhere, a non-linear characteristic could be excluded and the diagnostic statement made that a sufficient control quality could possibly already be obtained with a conventional controller alone.
- periods 100 ... 105 ( FIG. 6 ) and others, in FIG. 6 not shown periods of time, which meet the same selection criterion, are averages for recorded Values of process variable setpoint calculated.
- the evaluation device 7 ( FIG. 1 ) on the basis of the memory 6 ( FIG. 1 ) stored dataset of the range of values of the process variable setpoint determined and divided on the basis of the calculated average values in a plurality of clusters, the number of which preferably does not exceed the number five.
- FIG. 10 shows the result of this so-called clustering, which was obtained in the illustrated embodiment with a k-means algorithm.
- Three calculated cluster centers 130, 131 and 132 are marked as stars over a found value range of the manipulated variable w in degrees Celsius on the abscissa.
- Calculated mean values 133 ... 143 are marked as points.
- the mean values 133... 143 as well as the time segments from the data set used for their calculation and the respectively associated time segments of the data sequences are assigned to the clusters formed during clustering with the cluster centers 130, 131 and 132.
- the record of which a section in FIG. 6 is shown searched according to a second selection criterion for setpoint jumps.
- the start and end values of the found setpoint jumps are checked for their cluster membership and jumps found, whose start and end values belong to the same cluster, are assigned to the respective cluster. Large setpoint jumps whose start and end values belong to different clusters can not be assigned to a single cluster.
- setpoint jumps 110 ... 114 Based on the in FIG. 6 shown section of the data set can be found in this way setpoint jumps 110 ... 114.
- time segments are selected from the data set, whereby these begin a certain time before the setpoint jump occurs and end a certain time after the setpoint jump.
- the time range From 19,692 seconds to 34,770 seconds with sub-runs 600 and 610 of the in FIG. 6 illustrated curves 60 and 61 of the process variable setpoint or controlled variable shown.
- branch 111 Since branch 111 is a large one, its initial value in the cluster of cluster center 130 (FIG. FIG. 10 ) and its final value in cluster cluster 131 ( FIG. 10 ), the jump 111 and thus the corresponding time segment can not be assigned to any of the previously formed clusters.
- Partial course 610 shows a certain overshoot of the controlled variable y, which in most applications can be regarded as permissible control loop behavior.
- the transient response is only in FIG. 6 Plotted setpoint jumps 110 and 113 significantly damped or undamped.
- significant differences in the transient response in the case of setpoint jumps can be recognized, which can be regarded as the effects of non-linearity on the control behavior during setpoint jumps.
- the setpoint jumps 110, 112 and 114 are comparatively small, so that the start and end values of the jumps each come to lie in the same cluster.
- the respective time segments and corresponding data sequences of the process variables are assigned to the position of the initial and final values corresponding to the respective cluster, and a dynamic segment model is identified by evaluating the data sequences of the process variables manipulated variable and controlled variable for the clusters. Further, in the FIGS. 6 and 7 not shown, according to the second selection criterion found evaluable periods of the existing data set are also assigned according to the values of the process variable setpoint the clusters. Even time ranges with variable setpoint, which are completely in a cluster, can be assigned to the respective cluster become.
- the route models previously identified for the various clusters are validated by simulation from the beginning of the first hop in the cluster until the first exit from the cluster, or by a maximum simulation duration specified in another suitable manner. If a model quality obtained in this case is not sufficient, a renewed identification of the relevant model may follow, using a different, for example longer, time period for model identification.
- a simulation of the complete control loop is carried out using the previous controller and the respective operating point-dependent selected model for the respective cluster. If the control performance calculated in this simulation is sufficiently high across all clusters and is not very different between the clusters, a possible nonlinearity of the plant model and differences in the path dynamics are so small that they do not interfere with the behavior of the control. In this case, the diagnosis is that there is no further need for action.
- control quality differs considerably in different clusters, but amplification factors and time constants of the models respectively identified for the clusters are not too far apart, a design of a robust controller can be carried out in the automatic manner already described in detail above, possibly with parameters be found for a conventional controller, which give a satisfactory quality of control with all models.
- the use of a controller is proposed for optimizing the control device, which according to the gain Scheduling method, that is, a controller that is automatically designed separately for each cluster and provided with a parameter timetable with linear interpolation for the transitions between the clusters.
- a diagnostic device and a method which advantageously make it possible to carry out automatic monitoring of the control quality even in the case of non-linear processes and, if appropriate, automatically derive suggestions for improving the control quality or for optimizing the control device.
- the provision of three different optimization methods, of which the most suitable one can be selected automatically depending on the identified route model, has the advantage that an appropriate solution can be found for most practice-relevant problems.
- the design of a robust controller is associated with the least effort in the implementation and can always be used in the context of an optimization, if the achievable control quality already meets the requirements.
Landscapes
- Engineering & Computer Science (AREA)
- Physics & Mathematics (AREA)
- General Physics & Mathematics (AREA)
- Automation & Control Theory (AREA)
- Health & Medical Sciences (AREA)
- Artificial Intelligence (AREA)
- Computer Vision & Pattern Recognition (AREA)
- Evolutionary Computation (AREA)
- Medical Informatics (AREA)
- Software Systems (AREA)
- Testing And Monitoring For Control Systems (AREA)
Priority Applications (1)
| Application Number | Priority Date | Filing Date | Title |
|---|---|---|---|
| EP17151001.9A EP3349078A1 (fr) | 2017-01-11 | 2017-01-11 | Dispositif de diagnostic et procédé de surveillance et/ou d'optimisation d'un dispositif de réglage |
Applications Claiming Priority (1)
| Application Number | Priority Date | Filing Date | Title |
|---|---|---|---|
| EP17151001.9A EP3349078A1 (fr) | 2017-01-11 | 2017-01-11 | Dispositif de diagnostic et procédé de surveillance et/ou d'optimisation d'un dispositif de réglage |
Publications (1)
| Publication Number | Publication Date |
|---|---|
| EP3349078A1 true EP3349078A1 (fr) | 2018-07-18 |
Family
ID=57794154
Family Applications (1)
| Application Number | Title | Priority Date | Filing Date |
|---|---|---|---|
| EP17151001.9A Withdrawn EP3349078A1 (fr) | 2017-01-11 | 2017-01-11 | Dispositif de diagnostic et procédé de surveillance et/ou d'optimisation d'un dispositif de réglage |
Country Status (1)
| Country | Link |
|---|---|
| EP (1) | EP3349078A1 (fr) |
Cited By (4)
| Publication number | Priority date | Publication date | Assignee | Title |
|---|---|---|---|---|
| CN115356970A (zh) * | 2022-09-25 | 2022-11-18 | 湖北鑫英泰系统技术股份有限公司 | 一种基于实时数据和运维数据的动环监控系统及方法 |
| EP4300219A1 (fr) * | 2022-06-30 | 2024-01-03 | Siemens Aktiengesellschaft | Procédé de détermination d'une configuration de régulateur pour un système d'entraînement, programme informatique, support lisible par ordinateur, dispositif et système d'entraînement |
| DE102023135750A1 (de) * | 2023-12-19 | 2025-06-26 | KSB SE & Co. KGaA | Verfahren zur Optimierung wenigstens eines Reglerparameters einer Pumpenregelung und/oder wenigstens einer verwendeten physikalischen Größe |
| CN120491439A (zh) * | 2025-07-21 | 2025-08-15 | 浙江易锻精密机械有限公司 | 基于机器学习的模具高度自适应调节方法及系统 |
Citations (2)
| Publication number | Priority date | Publication date | Assignee | Title |
|---|---|---|---|---|
| EP0520233A2 (fr) | 1991-06-24 | 1992-12-30 | Siemens Aktiengesellschaft | Dispositif pour l'identification d'un système commandé |
| US20070078533A1 (en) * | 2005-10-04 | 2007-04-05 | Fisher-Rosemount Systems, Inc. | Process model identification in a process control system |
-
2017
- 2017-01-11 EP EP17151001.9A patent/EP3349078A1/fr not_active Withdrawn
Patent Citations (2)
| Publication number | Priority date | Publication date | Assignee | Title |
|---|---|---|---|---|
| EP0520233A2 (fr) | 1991-06-24 | 1992-12-30 | Siemens Aktiengesellschaft | Dispositif pour l'identification d'un système commandé |
| US20070078533A1 (en) * | 2005-10-04 | 2007-04-05 | Fisher-Rosemount Systems, Inc. | Process model identification in a process control system |
Non-Patent Citations (5)
| Title |
|---|
| ANONYMOUS: "Control Valve Linearization | Control Notes", 26 November 2011 (2011-11-26), XP055383600, Retrieved from the Internet <URL:http://blog.opticontrols.com/archives/689> [retrieved on 20170621] * |
| BERND-MARKUS PFEIFFER: "GMA-Kongress", vol. 1883, 2005, VDI-VERLAG, article "Control Performance Monitoring mit einer Kombination aus stochastischen und deterministischen Merkmalen", pages: 411 - 420 |
| BERND-MARKUS PFEIFFER; CHRISTIAN HECK: "Cloud-basierter Service ermöglicht flexible Überwachung von Regelkreisen im Anlagenbetrieb", May 2015, pages: 18 - 21 |
| DR B ING ET AL: "Control Performance Monitoring mit einer Kombination aus stochastischen und deterministischen Merkmalen (Control performance monitoring using a combination of stochastic and deterministic signal features)", VDI-BERICHTE, 1 January 1883 (1883-01-01), pages 411 - 420, XP055383846, Retrieved from the Internet <URL:https://w3.siemens.com/mcms/process-control-systems/SiteCollectionDocuments/efiles/pcs7/pdf/GMA-Kongress-2005_ControlPerfomMonitoring.pdf> * |
| SUTANTO E L ET AL: "Multivariable cluster analysis for high-speed industrial machinery", IEE PROCEEDINGS: SCIENCE, MEASUREMENT AND TECHNOL, IEE, STEVENAGE, HERTS, GB, vol. 142, no. 5, 1 January 1995 (1995-01-01), pages 417 - 23, XP006004440, ISSN: 1350-2344, DOI: 10.1049/IP-SMT:19952161 * |
Cited By (5)
| Publication number | Priority date | Publication date | Assignee | Title |
|---|---|---|---|---|
| EP4300219A1 (fr) * | 2022-06-30 | 2024-01-03 | Siemens Aktiengesellschaft | Procédé de détermination d'une configuration de régulateur pour un système d'entraînement, programme informatique, support lisible par ordinateur, dispositif et système d'entraînement |
| WO2024002705A1 (fr) | 2022-06-30 | 2024-01-04 | Siemens Aktiengesellschaft | Procédé de détermination d'une configuration de régulateur pour un système d'entraînement, programme informatique, support lisible par ordinateur, dispositif et système d'entraînement |
| CN115356970A (zh) * | 2022-09-25 | 2022-11-18 | 湖北鑫英泰系统技术股份有限公司 | 一种基于实时数据和运维数据的动环监控系统及方法 |
| DE102023135750A1 (de) * | 2023-12-19 | 2025-06-26 | KSB SE & Co. KGaA | Verfahren zur Optimierung wenigstens eines Reglerparameters einer Pumpenregelung und/oder wenigstens einer verwendeten physikalischen Größe |
| CN120491439A (zh) * | 2025-07-21 | 2025-08-15 | 浙江易锻精密机械有限公司 | 基于机器学习的模具高度自适应调节方法及系统 |
Similar Documents
| Publication | Publication Date | Title |
|---|---|---|
| EP3982211A1 (fr) | Procédé et dispositif de simulation d'un usinage sur une machine-outil au moyen d'un système d'apprentissage automatique | |
| DE102007001024A1 (de) | Verfahren zur rechnergestützten Regelung und/oder Steuerung eines technischen Systems insbesondere einer Gasturbine | |
| DE10341764A1 (de) | Integrierte Modell-Vorhersagesteuerung und -Optimierung innerhalb eines Prozesssteuerungssystems | |
| DE10241746B4 (de) | Verfahren zur zyklischen Qualitätsbewertung und Prozessüberwachung bei periodischen Produktionsprozessen | |
| DE102011076779A1 (de) | Verfahren und Vorrichtung zur Vorhersage des Zustands einer Komponente oder eines Systems, Computerprogrammprodukt | |
| EP3349078A1 (fr) | Dispositif de diagnostic et procédé de surveillance et/ou d'optimisation d'un dispositif de réglage | |
| DE112012006178T5 (de) | Parametereinstellvorrichtung | |
| EP0756219A2 (fr) | Procédé de surveillance des propriétés de produits et procédé de contrÔle d'un procédé de fabrication | |
| EP3056957B1 (fr) | Procédé et dispositif de diagnostic destinés à la surveillance du fonctionnement d'un circuit régulateur | |
| EP3035281A1 (fr) | Analyse d'efficacite energetique d'une installation technique a partir de simulation et utilisation | |
| EP3542229B1 (fr) | Dispositif et procédé de détermination des paramètres d'un dispositif de réglage | |
| EP1055180B1 (fr) | Procede et dispositif de conception d'un systeme technique | |
| EP3121672B1 (fr) | Procede et dispositif de diagnostic destines a la surveillance du fonctionnement d'un circuit regulateur | |
| DE4039620A1 (de) | Verfahren zur ermittlung von vorsteuerparametern fuer eine lageregelung | |
| EP1431927A1 (fr) | Méthode pour estimer la durée de vie résiduelle d'un appareil | |
| AT522639A1 (de) | Vorrichtung und Verfahren zum Visualisieren oder Beurteilen eines Prozesszustandes | |
| EP4459392A1 (fr) | Procédés et systèmes pour concevoir des systèmes d'entraînement | |
| WO2021063568A1 (fr) | Procédé d'identification de paramètres d'un modèle de boîte noire pour une ou plusieurs installations énergétiques dans un système énergétique | |
| EP3785091B1 (fr) | Procédé de fabrication automatique de signatures marquées | |
| DE112021003279T5 (de) | Informationsverarbeitungsvorrichtung, Steuervorrichtung und ein Optimierungsverfahren | |
| DE102021203321A1 (de) | Prädiktive Verfahren zum Bestimmen eines Werts einer veränderlichen Größe | |
| DE20117191U1 (de) | Vorrichtung zum Betrieb einer technischen Anlage | |
| DE4317538A1 (de) | Regeleinrichtung | |
| DE102023209638B4 (de) | Ansteuerung eines Aktors basierend auf bestärkendem Lernen | |
| EP3736518A1 (fr) | Procédé de fonctionnement d'une installation technique |
Legal Events
| Date | Code | Title | Description |
|---|---|---|---|
| PUAI | Public reference made under article 153(3) epc to a published international application that has entered the european phase |
Free format text: ORIGINAL CODE: 0009012 |
|
| AK | Designated contracting states |
Kind code of ref document: A1 Designated state(s): AL AT BE BG CH CY CZ DE DK EE ES FI FR GB GR HR HU IE IS IT LI LT LU LV MC MK MT NL NO PL PT RO RS SE SI SK SM TR |
|
| AX | Request for extension of the european patent |
Extension state: BA ME |
|
| STAA | Information on the status of an ep patent application or granted ep patent |
Free format text: STATUS: THE APPLICATION IS DEEMED TO BE WITHDRAWN |
|
| 18D | Application deemed to be withdrawn |
Effective date: 20190119 |