EP3444604A1 - Massenspektrometer und massenspektrometrieverfahren - Google Patents
Massenspektrometer und massenspektrometrieverfahren Download PDFInfo
- Publication number
- EP3444604A1 EP3444604A1 EP16898556.2A EP16898556A EP3444604A1 EP 3444604 A1 EP3444604 A1 EP 3444604A1 EP 16898556 A EP16898556 A EP 16898556A EP 3444604 A1 EP3444604 A1 EP 3444604A1
- Authority
- EP
- European Patent Office
- Prior art keywords
- mass
- reference value
- range
- data
- sample
- Prior art date
- Legal status (The legal status is an assumption and is not a legal conclusion. Google has not performed a legal analysis and makes no representation as to the accuracy of the status listed.)
- Withdrawn
Links
- 238000004949 mass spectrometry Methods 0.000 title claims description 104
- 238000000034 method Methods 0.000 title claims description 19
- 239000013074 reference sample Substances 0.000 claims abstract description 125
- 238000004458 analytical method Methods 0.000 claims abstract description 98
- 238000001819 mass spectrum Methods 0.000 claims abstract description 76
- 239000000523 sample Substances 0.000 claims description 50
- 150000002500 ions Chemical class 0.000 description 10
- 238000010586 diagram Methods 0.000 description 7
- 238000001228 spectrum Methods 0.000 description 2
- 238000003795 desorption Methods 0.000 description 1
- 230000005684 electric field Effects 0.000 description 1
- 239000004973 liquid crystal related substance Substances 0.000 description 1
- 239000011159 matrix material Substances 0.000 description 1
Images

Classifications
-
- H—ELECTRICITY
- H01—ELECTRIC ELEMENTS
- H01J—ELECTRIC DISCHARGE TUBES OR DISCHARGE LAMPS
- H01J49/00—Particle spectrometers or separator tubes
- H01J49/0009—Calibration of the apparatus
-
- H—ELECTRICITY
- H01—ELECTRIC ELEMENTS
- H01J—ELECTRIC DISCHARGE TUBES OR DISCHARGE LAMPS
- H01J49/00—Particle spectrometers or separator tubes
- H01J49/0027—Methods for using particle spectrometers
-
- H—ELECTRICITY
- H01—ELECTRIC ELEMENTS
- H01J—ELECTRIC DISCHARGE TUBES OR DISCHARGE LAMPS
- H01J49/00—Particle spectrometers or separator tubes
- H01J49/0027—Methods for using particle spectrometers
- H01J49/0031—Step by step routines describing the use of the apparatus
-
- H—ELECTRICITY
- H01—ELECTRIC ELEMENTS
- H01J—ELECTRIC DISCHARGE TUBES OR DISCHARGE LAMPS
- H01J49/00—Particle spectrometers or separator tubes
- H01J49/26—Mass spectrometers or separator tubes
- H01J49/34—Dynamic spectrometers
- H01J49/40—Time-of-flight spectrometers
Definitions
- the present invention relates to a mass spectrometer that performs mass spectrometry analysis on a to-be-measured sample including a reference sample, the reference sample having a known reference value of a mass-to-charge ratio of a peak obtained through mass spectrometry analysis, and further relates to a mass spectrometry method for performing the mass spectrometry analysis.
- mass spectrometers having an ability to perform mass spectrometry analysis on a to-be-measured sample including a reference sample with high accuracy have been used.
- a sample having a known reference value of a mass-to-charge ratio of a peak obtained through mass spectrometry analysis is used as a reference sample.
- mass spectrometry analysis is performed on a to-be-measured sample including a reference sample, thereby generating mass spectrum data.
- an actual measured value of a mass-to-charge ratio of a peak of the reference sample included in the mass spectrum data is detected, and a deviation (error) caused in the analysis operation is calculated as a correction value by comparison between the actual measured value and the reference value.
- the mass spectrum data is corrected based on the correction value, thereby generating accurate mass spectrum data.
- a user causes analysis to be performed based on such corrected mass spectrum data to achieve analysis with high accuracy (see, for example, Patent Document 1 below).
- the user presets a mass-to-charge ratio range corresponding to an analysis range. Then, the mass spectrometer generates (acquires) mass spectrum data in the mass-to-charge ratio range thus set.
- Patent Document 1 JP 2015-121500 A
- the conventional mass spectrometer as described above causes inconvenience that the user is required to make the setting of the mass-to-charge ratio range corresponding to the analysis range in consideration of peaks of the reference sample obtained through mass spectrometry analysis.
- the mass spectrum data needs to include the peaks of the reference sample. This requires the user to confirm in advance values of mass-to-charge ratios of the peaks of the reference sample obtained through mass spectrometry analysis and to set the analysis range to cause the values to lie in the analysis range.
- the present invention has been made in view of the above circumstances, and an object of the present invention is to provide a mass spectrometer and a mass spectrometry method that allow work for correcting mass spectrum data to be performed more efficiently.
- the present invention allows the user to simply set the mass-to-charge ratio range required for analysis as an analysis range without considering the peaks of the reference sample obtained through mass spectrometry analysis, which facilitates user's work.
- This configuration further allows acquisition of mass spectrum data that lies in a minimum range required for correction of the mass spectrum data. This allows work for correcting the mass spectrum data to be performed more efficiently.
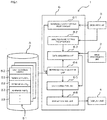
- FIG. 1 is a block diagram showing a specific configuration of a mass spectrometer 1 according to an embodiment of the present invention.
- the mass spectrometer 1 is a device that performs mass spectrometry analysis on a to-be-measured sample including a reference sample (internal standard).
- the mass spectrometer 1 includes a mass spectrometry unit 2, an operation unit 3, a display unit 4, a storage unit 5, and a control unit 6.
- the mass spectrometry unit 2 includes, for example, an ionization chamber and a time-of-flight mass spectrometer (TOFMS) (not shown).
- TOFMS time-of-flight mass spectrometer
- the to-be-measured sample is supplied to the ionization chamber to be ionized by ionization technique such as matrix assisted laser desorption/ionization (MALDI).
- MALDI matrix assisted laser desorption/ionization
- the ionization technique for ionizing sample components is not limited to the MALDI, and other various techniques can be used.
- an ion detector detects ions flying in a flight space. Specifically, ions accelerated by an electric field formed in the flight space are temporally separated in accordance with mass-to-charge ratios of the ions while flying in the flight space, and are sequentially detected by the ion detector. As a result, a relationship between a mass-to-charge ratio (m/z value) and an intensity detected by the ion detector is measured as a spectrum. In this manner, mass spectrometry analysis is performed.
- the operation unit 3 includes, for example, a keyboard and a mouse. A user can operate the operation unit 3 to input various pieces of information such as an analysis condition (setting) to the control unit 6.
- the display unit 4 includes, for example, a liquid crystal display.
- the display unit 4 displays various pieces of information such as an analysis result under control of the control unit 6.
- the storage unit 5 includes, for example, a read only memory (ROM), a random access memory (RAM), a hard disk, and the like.
- the storage unit 5 stores a plurality of pieces of reference sample data 51.
- Each of the pieces of reference sample data 51 corresponds to a piece of data on a reference sample usable in mass spectrometry analysis and is provided in accordance with a corresponding type of reference sample.
- index data 52 and a plurality of pieces of reference value data 53 are associated with each other.
- the index data 52 is data used for identification of a type of reference sample.
- the index data 52 corresponding to an index used for selection of one of the plurality of pieces of reference sample data 51.
- Each of the pieces of reference value data 53 corresponds to information on a reference value of a mass-to-charge ratio of a peak obtained through mass spectrometry analysis performed on a reference sample. Specifically, when reference samples undergo mass spectrometry analysis, a plurality of peaks are obtained for each of the reference samples.
- the pieces of reference value data 53 correspond to information on reference values of mass-to-charge ratios of peaks for each reference sample.
- the number of the pieces of reference value data 53 included in each of the pieces of reference sample data 51 varies depending on a type of reference sample, but in this example, the number is at least two.
- the control unit 6 includes, for example, a central processing unit (CPU).
- the control unit 6 is capable of receiving or sending electric signals from or to the mass spectrometry unit 2, the operation unit 3, and the display unit 4.
- the control unit 6 reads information stored in the storage unit 5 as necessary.
- a program executed by the CPU causes the control unit 6 to function as a reference sample setting reception unit 61, an analysis range setting reception unit 62, a data acquisition unit 63, a reference value selection unit 64, a data correction unit 65, a display control unit 66, and the like.
- the reference sample setting reception unit 61 receives a setting of a type of reference sample input to the operation unit 3. Note that such a type of reference sample corresponds to a type of reference sample data 51 stored in the storage unit 5.
- the analysis range setting reception unit 62 receives a setting of an analysis range input to the operation unit 3. Specifically, the analysis range setting reception unit 62 receives a setting of a mass-to-charge ratio range as a range in which analysis is performed.
- the data acquisition unit 63 acquires (generates) mass spectrum data based on a result of mass spectrometry analysis performed by the mass spectrometry unit 2 and the mass-to-charge ratio range whose setting has been received by the analysis range setting reception unit 62. Specifically, the data acquisition unit 63 acquires mass spectrum data obtained through mass spectrometry analysis performed by the mass spectrometry unit 2 in a range including the mass-to-charge ratio range whose setting has been received by the analysis range setting reception unit 62 and a margin added to the mass-to-charge ratio range.
- the margin corresponds to a region that results from taking into consideration an error (deviation) in the acquired data, the error caused in the analysis operation and is provided for expanding the analysis range (mass-to-charge ratio range) to allow data including the error to be acquired. Further, the margin corresponds to a region provided for expanding the analysis range (mass-to-charge ratio range) to allow data lying near a boundary of the mass-to-charge ratio range whose setting has been received by the analysis range setting reception unit 62 to be correctly acquired. As will be described in detail later, this margin is determined based on selection contents of the reference value selection unit 64.
- the reference value selection unit 64 reads the plurality of pieces of reference value data 53 from the pieces of reference sample data 51 stored in the storage unit 5 and selects a specific piece of reference value data 53 from among the pieces of reference value data 53. Specifically, the reference value selection unit 64 selects, from storage unit 5, a value (reference value) of a designated piece of reference value data 53 associated with the reference sample whose setting has been received by the reference sample setting reception unit 61.
- the data correction unit 65 corrects the mass spectrum data acquired by the data acquisition unit 63. Specifically, the data correction unit 65 corrects the mass spectrum data based on the reference value (reference value data 53) selected by the reference value selection unit 64 and an actual measured value of a peak of the reference sample included in the mass spectrum data.
- the display control unit 66 causes the display unit 4 to display a mass spectrum based on the mass spectrum data corrected by the data correction unit 65.
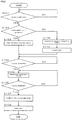
- FIG. 2 is a flowchart showing an example of processing performed by the control unit 6.
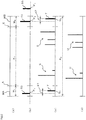
- FIGS. 3(a) to 3(d) are diagrams schematically showing data that is processed by the control unit 6, more specifically, showing a series of data until the corrected mass spectrum data is generated in a case where a value of a piece of reference value data 53 stored in the storage unit 5 lies in the range of the margin. Note that, in each of FIGS. 3(a) to 3(d) , a value of a mass-to-charge ratio is shown in a horizontal direction, and a value of signal intensity (a length in a vertical direction of a graph) is shown in the vertical direction.
- control operation to be performed by the control unit 6 will be described with reference to the flowchart and the data schematic diagrams.
- a user When using the mass spectrometer 1, a user first prepares a to-be-measured sample and a reference sample.
- the reference sample corresponds to a sample having a known reference value of a mass-to-charge ratio of a peak obtained through mass spectrometry analysis.
- data on such usable reference samples is stored in advance as the reference sample data 51.
- the user sets the to-be-measured sample including a sample and a reference sample into the mass spectrometry unit 2 and operates the operation unit 3 to set a type of the reference sample and an analysis range (YES in step S101). Specifically, the user operates the operation unit 3 to make a setting for specifying the reference sample set in the mass spectrometry unit 2 (reference sample setting step), and sets the mass-to-charge ratio range in which analysis is performed (analysis range setting step).
- the reference sample setting reception unit 61 receives the setting on the reference sample. Further, the analysis range setting reception unit 62 receives the setting on the mass-to-charge ratio range corresponding to the analysis range.
- FIG. 3(a) shows a range including an analysis range X 1 , and margins MA and MB provided adjacent to both ends of the analysis range X 1 .
- the analysis range X 1 corresponds to the mass-to-charge ratio range received by the analysis range setting reception unit 62.
- a region from the lower limit value A to the upper limit value B corresponds to the analysis range X 1 .
- respective widths of the margins MA and MB are predetermined.
- the mass spectrometer 1 based on the range including the analysis range X 1 and the margins MA and MB provided adjacent to both the ends of the analysis range X 1 (the range including the analysis range X 1 , the margin MA provided adjacent to a front end of the analysis range X 1 , and the margin MB provided adjacent to a rear end of the analysis range X 1 ), data is processed as described below.
- a region from the lower limit value A of the analysis range X 1 to a point (value) located forward by the margin MA is defined as a first margin region M 1
- a region from the upper limit value B of the analysis range X 1 to a point (value) located rearward by the margin MB is defined as a second margin region M 2 .
- the reference value selection unit 64 reads a piece of reference sample data 51 including the index data 52 indicating the reference sample from the storage unit 5, the piece of reference sample data 51 being associated with the reference sample whose setting has been received by the reference sample setting reception unit 61.
- the reference value selection unit 64 selects the reference value (reference value selection step).
- FIG. 3(b) shows pieces of reference value data 53 denoted as reference values P 1 to P 3 are superimposed on the data (range) shown in FIG. 3(a) .
- Each of the reference values P 1 to P 3 corresponds to a value of a piece of reference value data 53 included in a piece of reference sample data 51 read from the storage unit 5 by the reference value selection unit 64.
- the reference value P 1 lies in the first margin region M 1
- the reference value P 2 lies in the second margin region M 2
- the reference value P 3 lies in a region located behind the second margin region M 2 .
- the reference value selection unit 64 selects the reference value P 1 and the reference value P 2 (step S103).
- the reference value selection unit 64 selects at least two reference values from pieces of reference value data 53 included in a piece of reference sample data 51. Specifically, the reference value selection unit 64 selects reference values such that at least one reference value lies in each of regions adjacent to both sides (front side and back side) of the analysis range X 1 .
- the user operates the operation unit 3 to cause the mass spectrometry unit 2 to start mass spectrometry analysis (YES in step S104).
- the mass spectrometry unit 2 starts the mass spectrometry analysis in response to the operation (step S105: mass spectrometry analysis step). Specifically, the mass spectrometry unit 2 ionizes a to-be-measured sample including a sample and a reference sample, causes ions thus obtained to fly in a flight space, and then detects the ions with an ion detector. Then, the mass spectrometry unit 2 measures a relationship between a mass-to-charge ratio and an intensity detected by the ion detector as a spectrum.
- the data acquisition unit 63 Upon completion of the mass spectrometry analysis performed by the mass spectrometry unit 2 (YES in step S106), the data acquisition unit 63 acquires mass spectrum data in a range including the analysis range and the margin.
- the reference value P 1 and the reference value P 2 lie in the first margin region M 1 and the second margin region M 2 , respectively. Therefore, as shown in FIG.
- the data acquisition unit 63 sets a range including the analysis range X 1 , and the margins MA and MB provided adjacent to both ends of the analysis range X 1 as a data acquisition range X 2 , and acquires mass spectrum data in this data acquisition range X 2 (step S107: data acquisition step), the mass spectrum data being obtained through mass spectrometry analysis performed by the mass spectrometry unit 2.
- This mass spectrum data includes sample data S corresponding to data on the sample and actual measured data T corresponding to data of actual measured values on the reference sample.
- Values of mass-to-charge ratios of the actual measured data T are an actual measured value Q 1 and an actual measured value Q 2 .
- the actual measured value Q 1 of the actual measured data T corresponds to the reference value P 1 of a piece of reference value data 53
- the actual measured value Q 2 of the actual measured data T corresponds to the reference value P 2 of a piece of reference value data 53.
- the sample data S and the actual measured data T include a deviation (error) caused in the analysis operation. Therefore, the data correction unit 65 corrects the sample data S based on the reference value on the reference sample and the actual measured value on the reference sample. Specifically, a deviation d1 is present between the actual measured value Q 1 of the actual measured data T and the reference value P 1 of the piece of the reference value data 53. Further, a deviation d2 is present between the actual measured value Q 2 of the actual measured data T and the reference value P 2 of the piece of the reference value data 53. Therefore, the data correction unit 65 determines a correction value (correction expression) for correcting data based on the fact. Then, the data correction unit 65 applies the correction value to the sample data S to generate sample data U corresponding to corrected mass spectrum data as shown in FIG. 3(d) (step S108: data correction step).
- examples of the method for correcting the sample data S include a method in which a straight line based on the reference values and the actual measured values on the reference sample is created in an area with the reference value as the horizontal axis and the actual measured value as the vertical axis, and the sample data U is created based on the created straight line and the values of the sample data S (based on reference values corresponding to the sample data S on the created straight line), and another method of mass correction.
- the display control unit 66 causes the display unit 4 to display the corrected mass spectrum data (sample data U).
- FIGS. 4(a) to 4(d) are diagrams schematically showing data that is processed by the control unit 6, more specifically, showing a series of data until the corrected mass spectrum data is generated in a case where none of values of pieces of reference value data 53 stored in the storage unit 5 lies in the range of the margin.
- FIGS. 4(a) to 4(d) are different from FIGS. 3(a) to (d) in that, in FIG. 4(b) , pieces of reference value data 53 of reference values P 2 and P 3 lie outside the second margin region M 2 , and in FIG. 4(c) , actual measured data T lies outside the second margin region M 2 .
- the reference value selection unit 64 selects a reference value that lies outside the analysis range X 1 but closest to the margin (step S109).
- a piece of reference value data 53 corresponding to the reference value P 2 lies outside the analysis range X 1 and closest to the second margin region M 2 .
- the reference value selection unit 64 selects the piece of reference value data 53 corresponding to the reference value P 1 as described above.
- the data acquisition unit 63 expands the margin adjacent to both ends of the analysis range X 1 to allow the reference value thus selected to lie in the margin.
- the data acquisition unit 63 provides (generates) a third margin region M 3 adjacent to the rear side of the analysis range X 1 to allow the piece of reference value data 53 corresponding to the reference value P 2 to lie in the third margin region M 3 .
- a piece of reference value data 53 corresponding to the reference value P 1 lies in the first margin region M 1 . Therefore, the data acquisition unit 63 provides the first margin region M 1 adjacent to the front side of the analysis range X 1 in the same manner as described above.
- mass spectrometry analysis in the mass spectrometry unit 2 is started based on the operation on the operation unit 3 performed by the user.
- the data acquisition unit 63 sets a range including the analysis range X 1 and margin regions provided adjacent to both sides of the analysis range X 1 (the first margin region M 1 and the third margin region M 3 ) as a data acquisition range X 3 , and acquires mass spectrum data obtained through mass spectrometry analysis performed in this data acquisition range X 3 by the mass spectrometry unit 2.
- sample data U corresponding to corrected mass spectrum data is generated by the data correction unit 65, and the display control unit 66 causes the display unit 4 to display the corrected mass spectrum data (sample data U).
- This configuration allows mass spectrum data to be corrected with higher accuracy.
- the reference value selection unit 64 selects at least two reference values from among the pieces of reference value data 53 included in the piece of reference sample data 51 stored in the storage unit 5.
- the reference value selection unit 64 may select one reference value from among the pieces of reference value data 53 included in the piece of reference sample data 51 stored in the storage unit 5.
- the reference value selection unit 64 may select a reference value such that one reference value lies in a region adjacent to either the front side or the back side of the analysis range.
Landscapes
- Chemical & Material Sciences (AREA)
- Analytical Chemistry (AREA)
- Other Investigation Or Analysis Of Materials By Electrical Means (AREA)
- Life Sciences & Earth Sciences (AREA)
- Physics & Mathematics (AREA)
- Health & Medical Sciences (AREA)
- Electrochemistry (AREA)
- Biochemistry (AREA)
- General Health & Medical Sciences (AREA)
- General Physics & Mathematics (AREA)
- Immunology (AREA)
- Pathology (AREA)
- Chemical Kinetics & Catalysis (AREA)
- Electron Tubes For Measurement (AREA)
Applications Claiming Priority (1)
| Application Number | Priority Date | Filing Date | Title |
|---|---|---|---|
| PCT/JP2016/061688 WO2017179096A1 (ja) | 2016-04-11 | 2016-04-11 | 質量分析装置及び質量分析方法 |
Publications (1)
| Publication Number | Publication Date |
|---|---|
| EP3444604A1 true EP3444604A1 (de) | 2019-02-20 |
Family
ID=60042391
Family Applications (1)
| Application Number | Title | Priority Date | Filing Date |
|---|---|---|---|
| EP16898556.2A Withdrawn EP3444604A1 (de) | 2016-04-11 | 2016-04-11 | Massenspektrometer und massenspektrometrieverfahren |
Country Status (5)
| Country | Link |
|---|---|
| US (1) | US10444185B2 (de) |
| EP (1) | EP3444604A1 (de) |
| JP (1) | JP6583544B2 (de) |
| CN (1) | CN109073592B (de) |
| WO (1) | WO2017179096A1 (de) |
Families Citing this family (1)
| Publication number | Priority date | Publication date | Assignee | Title |
|---|---|---|---|---|
| JP7586024B2 (ja) * | 2021-08-03 | 2024-11-19 | 株式会社島津製作所 | 質量分析装置及び質量較正方法 |
Family Cites Families (13)
| Publication number | Priority date | Publication date | Assignee | Title |
|---|---|---|---|---|
| JPS62124456A (ja) * | 1985-11-26 | 1987-06-05 | Jeol Ltd | 質量分析デ−タのオ−トキヤリブレ−シヨン・システム |
| JPH10132786A (ja) * | 1996-10-30 | 1998-05-22 | Shimadzu Corp | 質量分析装置 |
| JP3791198B2 (ja) * | 1998-08-03 | 2006-06-28 | 株式会社島津製作所 | 質量分析装置 |
| GB0624679D0 (en) * | 2006-12-11 | 2007-01-17 | Shimadzu Corp | A time-of-flight mass spectrometer and a method of analysing ions in a time-of-flight mass spectrometer |
| CN101918826B (zh) * | 2007-12-20 | 2013-06-05 | 株式会社岛津制作所 | 质量分析系统 |
| GB0809488D0 (en) * | 2008-05-23 | 2008-07-02 | Electrophoretics Ltd | Mass spectrometric analysis |
| WO2009144765A1 (ja) * | 2008-05-26 | 2009-12-03 | 株式会社島津製作所 | 四重極型質量分析装置 |
| US9673030B2 (en) * | 2010-05-17 | 2017-06-06 | Emory University | Computer readable storage mediums, methods and systems for normalizing chemical profiles in biological or medical samples detected by mass spectrometry |
| JP5505224B2 (ja) * | 2010-09-16 | 2014-05-28 | 株式会社島津製作所 | 飛行時間型質量分析装置 |
| US9514360B2 (en) * | 2012-01-31 | 2016-12-06 | Thermo Scientific Portable Analytical Instruments Inc. | Management of reference spectral information and searching |
| EP2741312A1 (de) * | 2012-12-05 | 2014-06-11 | Tofwerk AG | Verfahren zur Kalibrierung von Messungen des Masse-zu-Ladung-Verhältnisses aus einem Spektrometer, das in Fluidverbindung mit einem Analysesystem verbunden ist welches eine zeitlich wechselnde Probe bereitstellt |
| JP6160471B2 (ja) * | 2013-12-19 | 2017-07-12 | 株式会社島津製作所 | 飛行時間型質量分析装置及び該装置を用いた質量分析方法 |
| JP2015121500A (ja) | 2013-12-25 | 2015-07-02 | 株式会社島津製作所 | 質量分析方法及び質量分析装置 |
-
2016
- 2016-04-11 EP EP16898556.2A patent/EP3444604A1/de not_active Withdrawn
- 2016-04-11 CN CN201680084525.5A patent/CN109073592B/zh active Active
- 2016-04-11 WO PCT/JP2016/061688 patent/WO2017179096A1/ja not_active Ceased
- 2016-04-11 US US16/092,466 patent/US10444185B2/en active Active
- 2016-04-11 JP JP2018511553A patent/JP6583544B2/ja active Active
Also Published As
| Publication number | Publication date |
|---|---|
| JP6583544B2 (ja) | 2019-10-02 |
| US20190170688A1 (en) | 2019-06-06 |
| CN109073592A (zh) | 2018-12-21 |
| US10444185B2 (en) | 2019-10-15 |
| JPWO2017179096A1 (ja) | 2018-11-29 |
| CN109073592B (zh) | 2020-11-10 |
| WO2017179096A1 (ja) | 2017-10-19 |
Similar Documents
| Publication | Publication Date | Title |
|---|---|---|
| EP3435404B1 (de) | Abstimmung einer mehrpoligen hf-amplitude für ionen, die nicht in einer kalibriersubstanz präsent sind | |
| JP5862794B2 (ja) | 質量分析装置及び質量較正方法 | |
| JP7063342B2 (ja) | 質量分析装置及び質量分析装置における質量較正方法 | |
| US11031226B2 (en) | Mass spectrometer and mass spectrometry | |
| EP3382738A1 (de) | Reduzierung des detektorverschleisses während der kalibrierung und abstimmung | |
| EP3254298B1 (de) | Schnelle abtastung von breiten vierpoligen rf-fenstern bei umschaltung der fragmentierungsenergie | |
| US10788469B2 (en) | Mass spectrometry data processor, mass spectrometry data processing method, and mass spectrometry data processing program | |
| US10564135B2 (en) | Chromatograph mass spectrometer | |
| EP3335237B1 (de) | Dekonvolution von gemischten spektren | |
| JPWO2017158770A1 (ja) | 質量分析装置 | |
| EP4280254A2 (de) | Verbesserungen für quadrupol-massenspektrometerdaten zur ermöglichung neuer hardwarebetriebsschemata | |
| CN108027346B (zh) | 质谱分析装置、质谱分析方法以及质谱分析用程序 | |
| US10444185B2 (en) | Mass spectrometer and mass spectrometry method | |
| EP3341737B1 (de) | Schnelle bewertung von lc-ms/ms-proteinpeptiddaten | |
| EP2798658B1 (de) | Systeme und verfahren zur sequenzierung von peptiden mittels massenspektrometrie | |
| JP2019124610A (ja) | クロマトグラフ質量分析装置 | |
| JP4921302B2 (ja) | 質量分析システム | |
| US11527392B2 (en) | Mass spectrometry device and mass spectrometry method | |
| US11527393B2 (en) | Spectrum calculation processing device, spectrum calculation processing method, ion trap mass spectrometry system, ion trap mass spectrometry method and non-transitory computer readable medium storing spectrum calculation processing program | |
| WO2017025893A2 (en) | Library search tolerant to isotopes | |
| JP6477332B2 (ja) | 質量分析方法、質量分析装置、及び質量分析用プログラム | |
| WO2012165024A1 (ja) | 解析装置、解析方法、及び記憶媒体 | |
| WO2019215910A1 (ja) | 質量分析装置及び質量分析方法 |
Legal Events
| Date | Code | Title | Description |
|---|---|---|---|
| STAA | Information on the status of an ep patent application or granted ep patent |
Free format text: STATUS: THE INTERNATIONAL PUBLICATION HAS BEEN MADE |
|
| PUAI | Public reference made under article 153(3) epc to a published international application that has entered the european phase |
Free format text: ORIGINAL CODE: 0009012 |
|
| STAA | Information on the status of an ep patent application or granted ep patent |
Free format text: STATUS: REQUEST FOR EXAMINATION WAS MADE |
|
| 17P | Request for examination filed |
Effective date: 20181105 |
|
| AK | Designated contracting states |
Kind code of ref document: A1 Designated state(s): AL AT BE BG CH CY CZ DE DK EE ES FI FR GB GR HR HU IE IS IT LI LT LU LV MC MK MT NL NO PL PT RO RS SE SI SK SM TR |
|
| AX | Request for extension of the european patent |
Extension state: BA ME |
|
| DAV | Request for validation of the european patent (deleted) | ||
| DAX | Request for extension of the european patent (deleted) | ||
| STAA | Information on the status of an ep patent application or granted ep patent |
Free format text: STATUS: THE APPLICATION HAS BEEN WITHDRAWN |
|
| 18W | Application withdrawn |
Effective date: 20191009 |