EP3555562B1 - Dispositif de balayage de cultures - Google Patents
Dispositif de balayage de cultures Download PDFInfo
- Publication number
- EP3555562B1 EP3555562B1 EP17882012.2A EP17882012A EP3555562B1 EP 3555562 B1 EP3555562 B1 EP 3555562B1 EP 17882012 A EP17882012 A EP 17882012A EP 3555562 B1 EP3555562 B1 EP 3555562B1
- Authority
- EP
- European Patent Office
- Prior art keywords
- distance
- data
- sensor
- crops
- biomass
- Prior art date
- Legal status (The legal status is an assumption and is not a legal conclusion. Google has not performed a legal analysis and makes no representation as to the accuracy of the status listed.)
- Active
Links
Images




Classifications
-
- G—PHYSICS
- G01—MEASURING; TESTING
- G01C—MEASURING DISTANCES, LEVELS OR BEARINGS; SURVEYING; NAVIGATION; GYROSCOPIC INSTRUMENTS; PHOTOGRAMMETRY OR VIDEOGRAMMETRY
- G01C3/00—Measuring distances in line of sight; Optical rangefinders
- G01C3/02—Details
- G01C3/06—Use of electric means to obtain final indication
- G01C3/08—Use of electric radiation detectors
-
- A—HUMAN NECESSITIES
- A01—AGRICULTURE; FORESTRY; ANIMAL HUSBANDRY; HUNTING; TRAPPING; FISHING
- A01B—SOIL WORKING IN AGRICULTURE OR FORESTRY; PARTS, DETAILS, OR ACCESSORIES OF AGRICULTURAL MACHINES OR IMPLEMENTS, IN GENERAL
- A01B79/00—Methods for working soil
- A01B79/005—Precision agriculture
-
- A—HUMAN NECESSITIES
- A01—AGRICULTURE; FORESTRY; ANIMAL HUSBANDRY; HUNTING; TRAPPING; FISHING
- A01D—HARVESTING; MOWING
- A01D46/00—Picking of fruits, vegetables, hops, or the like; Devices for shaking trees or shrubs
- A01D46/30—Robotic devices for individually picking crops
-
- A—HUMAN NECESSITIES
- A01—AGRICULTURE; FORESTRY; ANIMAL HUSBANDRY; HUNTING; TRAPPING; FISHING
- A01G—HORTICULTURE; CULTIVATION OF VEGETABLES, FLOWERS, RICE, FRUIT, VINES, HOPS OR SEAWEED; FORESTRY; WATERING
- A01G22/00—Cultivation of specific crops or plants not otherwise provided for
-
- G—PHYSICS
- G01—MEASURING; TESTING
- G01B—MEASURING LENGTH, THICKNESS OR SIMILAR LINEAR DIMENSIONS; MEASURING ANGLES; MEASURING AREAS; MEASURING IRREGULARITIES OF SURFACES OR CONTOURS
- G01B11/00—Measuring arrangements characterised by the use of optical techniques
- G01B11/02—Measuring arrangements characterised by the use of optical techniques for measuring length, width or thickness
- G01B11/06—Measuring arrangements characterised by the use of optical techniques for measuring length, width or thickness for measuring thickness ; e.g. of sheet material
- G01B11/0608—Height gauges
-
- G—PHYSICS
- G01—MEASURING; TESTING
- G01S—RADIO DIRECTION-FINDING; RADIO NAVIGATION; DETERMINING DISTANCE OR VELOCITY BY USE OF RADIO WAVES; LOCATING OR PRESENCE-DETECTING BY USE OF THE REFLECTION OR RERADIATION OF RADIO WAVES; ANALOGOUS ARRANGEMENTS USING OTHER WAVES
- G01S17/00—Systems using the reflection or reradiation of electromagnetic waves other than radio waves, e.g. lidar systems
- G01S17/88—Lidar systems specially adapted for specific applications
-
- G—PHYSICS
- G01—MEASURING; TESTING
- G01S—RADIO DIRECTION-FINDING; RADIO NAVIGATION; DETERMINING DISTANCE OR VELOCITY BY USE OF RADIO WAVES; LOCATING OR PRESENCE-DETECTING BY USE OF THE REFLECTION OR RERADIATION OF RADIO WAVES; ANALOGOUS ARRANGEMENTS USING OTHER WAVES
- G01S17/00—Systems using the reflection or reradiation of electromagnetic waves other than radio waves, e.g. lidar systems
- G01S17/88—Lidar systems specially adapted for specific applications
- G01S17/89—Lidar systems specially adapted for specific applications for mapping or imaging
-
- G—PHYSICS
- G01—MEASURING; TESTING
- G01S—RADIO DIRECTION-FINDING; RADIO NAVIGATION; DETERMINING DISTANCE OR VELOCITY BY USE OF RADIO WAVES; LOCATING OR PRESENCE-DETECTING BY USE OF THE REFLECTION OR RERADIATION OF RADIO WAVES; ANALOGOUS ARRANGEMENTS USING OTHER WAVES
- G01S7/00—Details of systems according to groups G01S13/00, G01S15/00, G01S17/00
- G01S7/48—Details of systems according to groups G01S13/00, G01S15/00, G01S17/00 of systems according to group G01S17/00
- G01S7/481—Constructional features, e.g. arrangements of optical elements
- G01S7/4817—Constructional features, e.g. arrangements of optical elements relating to scanning
Definitions
- This disclosure is related to systems and methods for scanning crops.
- this disclosure relates to scanning crops to determine crop trait values (i.e. biophysical parameters), including biomass and growth, for artificial selection.
- Crop traits may include biomass and canopy height and the determination of biomass and canopy height may involve destructive testing and/or LIDAR measurements.
- LIDAR measurements are performed by directing a laser beam at the crop and measuring the return time of the reflection off the crop. Based on the return time a distance to the LIDAR sensor can be determined, which, in turn, can be used to estimate biomass and canopy height.
- Chen discloses systems for LiDAR Remote Sensing of Vegetation Biomass ( Chen, Q. Lidar remote sensing of vegetation biomass. In Remote Sensing of Natural Resources; Wang, G., Weng, Q., Eds.; CRC Press, Taylor & Francis Group: Boca Raton, FL, USA, 2013; pp. 399-420 .). Chen further discloses that the 3D coordinates of laser returns collected at individual scanning positions are local and relative to the scanners. Further, according to Chen the individual datasets have to be georeferenced to a common coordinate system based on features visible to multiple positions, which is not a trivial task.
- ground-based LiDAR systems can acquire data with point densities 100-1000 times higher than the average point density of airborne small-footprint LiDAR systems.
- Such massive volumes of data pose a significant challenge in developing fast, automatic, and memory-efficient software for data processing and information extraction.
- Biber et al. disclose an autonomous agricultural robot comprising a 3D MEMS LIDAR providing a full scan at 59x29 pixels across the field of view of 50x60 degrees ( Peter Biber, Ulrich Weiss, Michael Doma, Amos Albert. Navigation System of the Autonomous Agricultural Robot "BoniRob". Workshop on Agricultural Robotics: Enabling Safe, Efficient, and Affordable Robots for Food Production (Collocated with IROS 2012), Vilamoura, Portugal) .
- a RANSAC algorithm is used to fit a Hessian plane equation to the data. The detected plane is then refined by a Least Squares fit. Number of inliers and residuals of the Least Squares are then considered to detect failed ground detection.
- a Kalman filter tracks the state of the plane over time. If the ground detection failed the state is just propagated. Depending on the field the detected ground can correspond to soil or the canopy. Also the thresholds for plane detection have to be set according to the application. Further, as a side effect of ground detection it is possible to derive the height and the tilt angle of the scanner so only the x/y position of the scanner are defined manually in the configuration.
- US 2015/0015697 A1 discloses a system for plant parameter detection, including: a plant morphology sensor having a first field of view and configured to record a morphology measurement of a plant portion and an ambient environment adj acent the plant, a plant physiology sensor having a second field of view and configured to record a plant physiology parameter measurement of a plant portion and an ambient environment adjacent the plant; and a computing system configured to: identify a plant set of pixels within the physiology measurement based on the morphology measurement; determine physiology values for each pixel of the plant set of pixels; and extract a growth parameter based on the physiology values.
- US 2014/0180549 A1 discloses systems for identifying a plant in a field with pixel-level precision and taking an action on the identified plant, also with pixel level precision.
- a system for calculating biomass of crops is provided according to claim 1.
- the mover may be a vehicle.
- the mover may be a gantry.
- the line scan distance sensor may be downwardly directed towards the ground.
- the line scan distance sensor may be directed sidewardly.
- the relative positioning data may have an accuracy of 1 cm or higher.
- the rotary encoder may be configured to generate detection signals at an encoder rate that is higher than a scanning rate of line scans from the line scan distance sensor when the mover moves the line scan distance sensor at a scanning speed.
- the scanning speed may be 1 m/s or faster.
- the scanning rate may be 500 Hz or less.
- the encoder rate may be at least ten times higher than the scanning rate.
- the line scan distance sensor may be further configured to generate intensity data indicative of an intensity of the reflected light and the data collector may be configured to associate the intensity data from the distance sensor with relative positioning data based on the movement data from the rotary encoder and to store the intensity data associated with the relative positioning data on the data store.
- the light may be laser light.
- the laser light may be red laser light having a wavelength between 625 nm and 740 nm.
- the system may further comprise a second line scan distance sensor to measure a distance of the crops from the second line scan distance sensor along the line, wherein the second line scan distance sensor is offset or tilted relative to the first line scan distance sensor.
- the line scan distance sensor may be configured to repeatedly measure the distance of the crops from the sensor along multiple lines to generate distance data for each of the multiple lines, and the data collector may be configured to associate the distance data from each of the multiple lines with relative positioning data indicative of a relative position of that line.
- a method for calculating biomass of crops is provided according to claim 8.
- the method may further comprise uploading the distance data associated with the relative positioning data to a processing server to cause the processing server to calculate an absolute measure of biomass.
- Uploading the distance data may comprise uploading more than 5,000 distance data points to the processing server to cause the processing server to calculate the absolute measure of biomass based on the more than 5,000 distance data points.
- Measuring the distance of the crops from the distance sensor may comprise providing a scan angle value associated with a distance value and generating the distance data may comprise calculating a crop height above ground based on the distance value and the scan angle value.
- Calculating the crop height above ground may be based on a predetermined sensor height above ground.
- the distance data may further comprise intensity data.
- the distance data may comprise a scan angle value associated with a distance value.
- Calculating the crop height above ground may be based on a predetermined sensor height above ground.
- the distance data may comprise multiple line scans of multiple monitoring areas.
- Each of the multiple monitoring areas may be associated with a different crop population.
- the method may further comprise automatically detecting the multiple monitoring areas based on the distance data and the relative positioning data.
- the method may further comprise generating a display to indicate a highly performing monitoring area out of the multiple monitoring areas based on the absolute measure of biomass.
- the method may further comprise selecting a population associated with one of the multiple monitoring areas based on the absolute measure of biomass for further breeding.
- This disclosure provides systems and methods for accurate and high-throughput crop phenotyping.
- the disclosed systems associate line scanner data with a high resolution rotary encoder to provide distance data with high local alignment accuracy. This allows for a more accurate, faster and non-destructive determination of crop traits, which can be used to select the best performing crops from a larger number of populations, such as plots, for future breeding.
- Fig. 1 schematically illustrates a field 100 of crops comprising multiple plots, such as plot 101 and a crop scanner 102.
- the crops or plants in one plot may be referred to as group of individuals or a population and the aim is a genetic gain in that population without genetic testing or assisted by genetic testing.
- the crops may be wheat, rice cereal and other crops such as canola and grapevines.
- Crop scanner 102 comprises a line scan distance sensor 103, a mover system 104, a rotary encoder 105 and a data collector 106. It is noted that some examples herein relate to a vehicle as crop scanner 102. However, in other examples, crop scanner may be a fixed gantry and the crops are moved through the gantry, such as on a conveyor belt.
- Fig. 2 illustrates line scan distance sensor 103 mounted on the crop scanner 102 (not shown in Fig. 2 ) as seen from the front.
- a possible device may be LMS400, 70 ⁇ FOV, SICK AG, Waldkirch, Germany.
- Line scan distance sensor 103 measures a distance 201 of the crops 202 from the sensor along a line 203.
- Line scan distance sensor 103 illuminates the crops 202 with a laser beam 204 at a measurement angle 205.
- the measurement angle 205 is taken between a vertical line 206 and the laser beam 204.
- the measurement angle 205 defines the line 203 in the sense that as the measurement angle 205 increases, the laser beam 204 is directed at points along the line 203. In other words, if the measurement angle 205 is increased rapidly so that the laser beam 204 rotates around the sensor 103, a person would be able to see a red line on the ground in the case of a red laser.
- Sensor 103 detects reflected light 207 and measures the time of flight, that is, the time between sending the laser beam 204 and receiving the reflected light 207. Sensor 103 can then calculate distance 201 by multiplying the time of flight by the speed of light. In another example, sensor 103 detects a phase shift and calculates the distance based on the phase shift. This way, sensor 103 generates distance data indicative of the distance 201 of the crops from the sensor 103 at the measurement angle 205. Sensor 103 pulses laser beam 204 while increasing angle 205 to generate distance data for multiple points along line 203.
- scanner 103 may comprise a rotating mirror, prism or MEMS device to increase angle 205 and may generate distance data at measurement angle increments of between 0.1 degrees and 1 degree, that is, for an aperture angle of 70 degrees there would be 70 to 700 distance data points along line 203 where the number of data points may be configurable. It is noted that the multiple values for the measurement angle may vary from one scan line to the next. In other words, the points where the crop is scanned may not be aligned across different scan lines. In the proposed solution, this has the advantage that further data becomes available since regions that may have been overstepped in one scan line are scanned in the next scan line.
- the line scan distance sensor generates intensity data indicative of an intensity of the reflected light.
- the intensity is indicative of the reflectance of the illuminated material and changes between fresh green leaves, dry brown leaves and soil. This distinction can be emphasised by using red laser light.
- the data collector 106 in this example processes the intensity data from the distance sensor 103 together with or separately to the distance data as described further below.
- the distance sensor 103 may scan the crops 202 at a constant rate of laser pulses, which means that the distance between data points (spatial sampling rate) is minimal directly under the sensor 103 (in the direction of vertical 206) and maximal at the distal ends of line 203. In other words, the data points are further apart from each other towards the end of scan line 203 than in the middle of it.
- crop scanner 102 comprises mover system 104.
- Mover system 104 moves the line scan distance sensor 103 substantially perpendicular to the distance 201 of the crops from the sensor. In Fig. 2 , the movement would be into the plane of the drawing keeping a constant distance 210 from the ground as defined by the geometry of the mover system 104.
- mover system 104 comprises three wheels, where two wheels are arranged in parallel to line 203 and the third wheel is arranged behind and in line with the left wheel of the two front wheels.
- the mover system 104 may be moved by an operator, such as by pushing the mover system 104.
- mover system 104 comprises one or more motors and autonomous navigation system based on GPS and/or inertial navigation systems.
- Crop scanner 102 further comprises rotary encoder 105.
- the rotary encoder 105 may be associated with the mover system such as by being mounted onto one of the wheels.
- Rotary encoder 105 generates movement data indicative of a movement of the distance sensor substantially perpendicular to the distance 201 of the crops from the sensor as defined by the mover system 104.
- Fig. 3 illustrates an example rotary encoder 105 mounted on a shaft 301, which may be the axle of the wheel.
- Rotary encoder 105 comprises a quadrature encoder 302 connected to shaft 301, a light source 303, such as an LED, a lens 304 and a photo detector 305.
- Quadrature encoder 302 comprises alternating transparent sections (shown in white) and occluding sections (shown in black).
- An outer ring 306 comprises 40 sections, while an inner ring 307 comprises 80 sections.
- Light from the LED 303 is focussed by lens 304 and passes through the quadrature encoder 302.
- the quadrature encoder 302 rotates together with shaft 301 the light is alternatingly blocked or transmitted, which results in a square waveform at the output of the photo detector 305.
- the frequency of the square waveform is directly related to the rotation speed of the shaft 301.
- the photo detector 305 outputs two square waveforms where one square waveform has twice the frequency of the other square waveform.
- Data collector 106 in Fig. 1 is connected to photo detector 305 and receives the square waveforms. By detecting the relationship between the two square waveforms processor data collector 106 can determine the direction of rotation as well as the speed of rotation.
- the data collector 106 determines that the crop scanner 102 has moved by a predefined distance.
- the circumference of the wheels of the crop scanner 102 is 0.8 m and as a result, each rotation of the shaft relates to a moved distance of 0.8 m.
- the inner ring 307 comprises 80 transitions between transparent and occluding sectors, each edge of the square waveform associated with the inner ring 307 corresponds to a movement of 0.01 m, that is, the rotary encoder 105 provides a quadrature pulse every 0.01 m travel. For 1.5 m/s, this would result in 150 pulses per second.
- the rotary encoder 105 may be a DFV60A-22PC65536 (SICK AG, Waldkirch, Germany) providing 65,536 pulses per revolution which leads to a pulse every 12 ⁇ m (at a wheel circumference of 0.8 m).
- the rotary encoder may be mounted on the driving wheel of a conveyor belt or similar mover.
- the line scan distance sensor 103 is downwardly directed to the ground, which is suitable for vertically growing crops such as grain including wheat and rice. In other examples, the line scan distance sensor is directed sidewardly, which is suitable for fruit crops including grape vines.
- Fig. 4 is a plan view of plot 101 in Fig. 1 .
- scan lines 402 comprising scan line 203 as shown in Fig. 2 .
- scanner 102 scans plot 101 along further scanlines, such as further scanline 403.
- the scanning rate is 100 Hz, which means that scanner 103 creates 100 scan lines per second. At a speed of 1.5 m/s this would result in 0.015 m between scan lines.
- pulses 404 from the rotary encoder 105. As can be seen in Fig.
- the indications of pulses 403 are significantly more frequent than the indication of scan lines 402, which improves the overall accuracy of the system and in particular, the location reference of the scan lines 402.
- the accuracy of that position is limited by the distance between pulses 404. That is, if the distance between pulses is 0.001 m, then the accuracy of the location of the scan lines 402 is also 0.001 m in the example where the data collector 106 counts the number of pulses 404 between scan lines 402.
- the aim is to calculate an absolute quantitative measure, such as biomass, it is important that the location of the scan lines is accurate.
- Fig. 4 also shows a leaf 410, which is part of the biomass of plot 101.
- Leaf 401 is scanned by three scanlines 203, 403 and 411 and the accurate distance between the scan lines 203/403 and 403/411 is indicated by the number of pulses 404 from rotary encoder 105. Due to the accurate distance measure, the size of the leaf and therefore the absolute measure of biomass can be accurately calculated.
- the absolute measure of biomass may be biomass per square meter or per another fixed surface area.
- the following table provides further example configurations of the encoder rate and scan rate: speed [m/s] # sectors pulses [1/s] enc. resolution [mm] scan rate [1/s] line dist [mm] 1 800 1000 1 100 10 1.5 800 1500 1 100 15 3 800 3000 1 100 30 5 800 5000 1 100 50 10 800 10000 1 100 100 1 1600 2000 0.5 200 5 1.5 1600 3000 0.5 200 7.5 3 1600 6000 0.5 200 15 5 1600 10000 0.5 200 25 10 1600 20000 0.5 200 50 1 1600 2000 0.5 500 2 1.5 1600 3000 0.5 500 3 3 1600 6000 0.5 500 6 5 1600 10000 0.5 500 10 10 1600 20000 0.5 500 20
- the line distance is greater than the encoder resolution, which means that multiple encoder pulses are received between scan lines, which enables accurate relative local positioning of the scan lines.
- the encoder rate is at least ten times higher than the scanning rate. It is further shown that a large speed of 10 m/s can be used, which enables scanning of large plots in acceptable time or scanning of a larger number of plots to select from a larger number of individuals or groups of individuals, such as plots. This leads to higher genetic gain, that is higher performing crops, than with existing methods over the same time period.
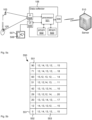
- Fig. 5a illustrates data collector 106 in more detail.
- data collector 106 comprises processor 501 connected to program memory 502, data memory 503, data input port 504 and user interface port 505.
- the program memory 502 is a non-transitory computer readable medium, such as a hard drive, a solid state disk or CD-ROM.
- Software, that is, an executable program stored on program memory 502 causes the processor 501 to perform the method in Fig. 6 , that is, processor 501 controls scanner 103 to measure a distance and generate distance data, controls the mover system 102 to move the scanner and generate movement data, associates the distance data with positioning data and stores the result on data memory 503.
- Processor 501 may also send the determined positioning data associated with the distance data via communication port 506 to a server 510, which may then calculate a quantitative trait of the plant on the current plot 101. This allows more complex calculations that would be difficult to perform on the data collector 106 due to hardware limitations of mobile computing systems.
- the processor 501 may receive data, such as distance data, from data memory 503 as well as from input port 504 and the user port 505, which is connected to a display 507 that shows a visual representation 508 of the plot 101 to a user.
- the processor 501 receives distance data from rotary encoder via input port 504, such as by using a Wi-Fi network according to IEEE 802.11 or a CAN bus.
- the processor 501 receives and processes the distance data in real time. This means that the processor 501 associates and stores the distance data every time distance data of a line scan is received from rotary encoder 105 and completes this calculation before the rotary encoder 105 sends the next line scan update.
- data collector 106 is implemented as a microcontroller, such as an Atmel ATmega328.
- Data collector 106 may comprise a counter that is incremented each time a pulse from rotary encoder 105 is detected on a pin of the microcontroller.
- the microcontroller reads the value of the counter, stores the value of the counter associated with the data from the scanner 103 and resets the counter to zero.
- data collector 106 is implemented as a tablet computer that collects the data and may readily upload the data to server 510 using a cellular or Wifi network.
- Fig. 5b illustrates an example data format. It is noted that the sensor 103 repeatedly measures the distance of the crops 202 from the sensor 103 along multiple lines to generate distance data for each of the multiple lines.
- the data collector 106 associates the distance data from each of the multiple lines with relative positioning data indicative of a relative position of that line.
- data collector 106 stores the distance values as rows, such as first row 551.
- First row 551 has a first data field 552 for the relative positioning data and a second data field 553 for the distance data points from sensor 103.
- the first data fields 552 holds the number of pulses from rotary encoder 105 from the start of the plot 101.
- first data field may hold the distance in metres or millimetres from the start of the plot.
- Fig. 6 illustrates a method 600 as performed by processor 501 for scanning crops.
- Processor 501 generates control signals to control the distance sensor 103 to illuminate 601 the crops with laser light at a measurement angle that defines a line.
- Processor 501 measures a distance of the crops from the distance sensor 103 at one or more points along the line by detecting reflected light and measuring the time of flight between illuminating the crops at step 601 and receiving the reflected light in step 602.
- Processor 501 uses the measurement to generate 603 distance data indicative of the distance of the crops from the sensor at the measurement angle.
- the distance data is generated by the distance sensor 103.
- Processor 501 then generates control signals to move 604 the distance sensor substantially perpendicular to the distance of the crops from the distance sensor.
- an operator may move the distance sensor.
- Processor 501 may generate a user interface to guide the operator, such as by creating a graphical representation of the current speed in relation to the optimal speed.
- Processor 501 may also indicate the relative location within the plot 101 or a GPS location within the field 100.
- Rotary encoder 105 generates 605 movement data indicative of a movement of the distance sensor 103 substantially perpendicular to the distance of the crops from the sensor.
- Processor 501 associates 606 the distance data from the distance sensor with relative positioning data based on the movement data.
- the relative positioning data may be the number of pulses as described above or may be derived value, such as a relative distance.
- Processor 501 finally stores 607 the distance data associated with the relative positioning data on a data store.
- processor 501 stores the distance data associated with the relative positioning data on an SD card that can be removed and inserted into a computer to read-out and process the data.
- processor 501 stores the distance data associated with the relative positioning data on a cloud storage, which causes server 510 to process the distance data to calculate a crop trait value, namely an absolute measure of biomass.
- Uploading the distance data may comprise uploading more than 5,000 distance data points to the processing server 510 to cause the processing server 510 to calculate one crop trait value based on the more than 5,000 distance data points.
- This may relate to a plot size of 7000 mm, such that all data points of one plot are uploaded to calculate a single crop trait value.
- the uploading of the large number of distance data points means that only a small amount of processing power is required in the data collector 106 and the bulk of the processing for aggregating the data points can be performed on the server 510.
- server 510 calculates from the large number of distance data points a single crop trait value for each plot 101.
- server 510 may be hosted on desktops, laptops or mobile devices.
- server 510 is implemented in a distributed (cloud) computing environment, such as Amazon AWS.
- a supervisor may determine a number of virtual machines and instantiate those virtual machines on the cloud to process the distance data points as described herein. Once the distance data points are processed, the supervisor destroys the virtual machines. This allows for highly computationally expensive calculations to be performed relatively quickly without the need for investing into expensive hardware. Since the distance data from each plot can be processed separately, the specific processing task can be parallelised on multiple virtual machines effectively. In one example, the supervisor instantiates one virtual machine for each plot.
- Fig. 7a illustrates a single crop 700 growing on ground 701 and having leaves 702 and seeds 703.
- Solid dots indicate the locations where the laser light 204 hits the crop or the ground. That is, each dot represents one distance data point.
- Server 510 can calculate for each distance data point a height measurement.
- Server 510 then calculates a histogram by counting the number of height measurements in each of multiple bins.
- Fig. 7b illustrates a histogram 750 of the height of the dots in Fig. 7a .
- Histogram 750 includes a first peak 751 for height measurements around zero indicating reflections off the ground 701.
- Histogram 750 further includes a second peak 752 indicating reflections off the leaves 702 of crop 700 and a third peak 753 indicating reflections off the seeds 703. While the histogram 750 for a single crop may be irregular, server 510 creates a similar histogram for all data points of the plot 101.
- Fig. 8 illustrates a histogram for the entire plot 101. Compared to Fig. 7b , the histogram in Fig. 8 is more regular.
- Server 510 can now extract features from the histogram. For example, server 510 may identify a first peak or maximum 801 and use a height value 802 of the first peak 801 as a feature.
- Server 510 may further receive historical crop trait values of sampled crops. For example, workers can cut samples from multiple plots and manually measure the biomass in these sample.
- Server 510 calculates the feature for each of the multiple plots and correlates the feature to the sampled biomass measurement.
- server 510 may use a linear regression model to calculate a linear relationship between the feature, that is the height of the first peak 801, and the biomass based on the historical sample data. Server 510 can then apply this correlation, that is the linear relationship, to plot 101. This allows the server 510 to calculate an estimated biomass as a crop trait value without the need for manually and destructively sampling the plot 101.
- the parameters for the relationship between sampled biomass and histogram features are specific to each crop. That is, wheat would have a different relationship than rice, for example.
- Server 510 may automatically detect the edges of each plot by detecting that the majority of data points have a ground value of about zero height. In one example, it is assumed that the scan line 203 spans a single plot, such that for each line all points belong to the same plot. Server 510 can then iterate over all scan lines and calculate the histogram of the current scan line. If the histogram has more peaks than the ground peak 751 then the scan line is added to the data for that plot. If the histogram has only the ground peak 751, server 510 concludes that the end of the current plot has been reached and a new plot can be started for the next scan line that shows more peaks than the ground peak 751.
- server 510 can select out of multiple plots those with the highest estimated biomass, which means the plot is a highly performing plot.
- server 510 may generate a user interface that shows the estimated biomass for each plot such that an operator can see which plot should be selected for further breeding.
- Server 510 may also generate and display a ranking of plots such that the operator can select the plot at the top of the ranking for further breeding.
- Each plot may be associated with a plot identifier, population or genotype and the server 510 may automatically select the plot identifier, population or genotype with the highest estimated biomass for further breeding. That is, server 510 creates a display or a digital document comprising an indication of the selected plot identifier or genotype.
- Map 900 comprises a rectangle for each plot and the fill of each rectangle, such as colour, shading or pattern, indicates the estimated biomass or other crop trait value. For example, darker rectangles indicate plots with a higher crop trait value while lighter rectangles indicate plots with a lower crop trait value.
- the crops in all plots are of the same variety and the variation in crop trait values is caused by a variation in environmental conditions, such as water supply.
- the frequent scanning of the crops which is enabled by this disclosure, allows the monitoring of the influence of those conditions by monitoring the crop trait value directly. Irrigation, for example, can then be automatically actuated for those plots with a lower crop trait value.
- Fig. 10 illustrates an image 1000 that server 510 may create.
- server 510 adds a dot for each of the data points of the current plot into the image considering only the height and the location along the scan line 203 but disregarding the location of the data points along the direction of movement 401 (shown in Fig. 4 ).
- the image 1000 clearly shows the structure of the crop and can be considered as an accumulated cross-section through the plot. This gives the operator additional insight which makes the selection of plots or genotypes or other resulting actions more accurate.
- the dots may also be colour coded to indicated the intensity. Since fresh leaves, dry leaves and soil have different reflectance and therefore lead to different intensities of reflected light, the colour code can graphically distinguish between these materials.
- biomass production While some examples above relate to biomass production, other traits may be possible that were difficult to ascertain with existing methods. For example, biomass production during increased irrigation or other change in environment. Other time dependent traits may also be considered including change of canopy height over two weeks, for example. In further examples, traits may include Water use efficiency, Nutrient use efficiency (particularly nitrogen and phosphorus), Weed competitiveness, Tolerance of mechanical weed control, Pest/disease resistance, Early maturity (as a mechanism for avoidance of particular stresses) and Abiotic stress tolerance (i.e. drought, salinity, etc).
- the artificial selection method of the present invention is useful for selecting an individual or a population of individuals or reproductive or regenerative material from the individuals for use in breeding or transgenic approach. Accordingly, the present invention also provides a process for improving the rate of genetic gain in a population comprising performing the method of the present invention according to any embodiment described herein and selecting an individual or population of individuals, such as a plot, based on one or more phenotypes, that is, a desirable estimated crop trait value.
- a low crop trait value means a crop trait value sufficient to improve a genetic gain in the population if the selected individual or population of individuals is mated to another individual or group of individuals e.g., an individual or population of individuals that also has a desirable estimated crop trait value as determined against the same or different parameter(s). It is noted that a low crop trait value may be desirable, such as water use.
- the process comprises obtaining reproductive or regenerative material from the selected individual.
- the term "obtaining reproductive or regenerative material” shall be taken to include collecting and/or storing and/or maintaining germplasm such as the selected individual pollen from the selected individual, seed etc. produced using the germplasm of the selected individual, such as for use in conventional breeding programs; and collecting and/or storing and/or maintaining cells such as embryonic stem cells, pluripotent or multipotent stem cells, fibroblasts, or organelles such as nuclei, mitochondria or chloroplasts from the selected individual, optionally transformed to include one or more genes or nucleic acids for conferring a desired attribute on an organism, for the production of transformed organisms carrying the genetic material of the selected individual.
- the present invention clearly extends to any reproductive or regenerative material obtained by performing the process of the present invention and an organism produced therefrom.
- This organism may produce a genetic gain in the population that is substantially the same as the expected genetic gain or actual genetic gain from the entire germplasm of the selected individual.
- expected genetic gain is a theoretical value
- actual genetic gain is a value determined from test matings in a population.
- the reproductive or regenerative material is generally stored for a prolonged period for subsequent use and it is desirable in such circumstances to maintain records of the material. Accordingly, the present invention also provides a computer-readable medium for use in artificial selection said computer-readable medium comprising a database of reproductive or regenerative material obtained by performing a process of the invention according to any embodiment described herein.
- Crop scanner 103 may be an adaptable mobile platform for the deployment and testing of proximal imaging sensors in vineyards.
- a SICK LMS-400 light radar (LiDAR) mounted on scanner 103 is capable of producing precise ( ⁇ 3mm) 3D point clouds of vine rows. Scans of multiple grapevine varieties and management systems have demonstrated that scanner 103 can be useful in a variety of vineyards.
- the frame may include more instruments.
- computational processes can be improved and automated as more correlations between growth features and LiDAR scans are developed.
- This disclosure provides an adaptable proximal sensing scanner 103and demonstrates how it is able to use light radar (LiDAR) to capture point clouds of vine size and structure at a number of different growth stages with differing canopy management systems. Beyond producing 3D scans there is provided a computational method that uses LiDAR scans to estimate pruning weight, an indicator of vegetative vine vigour which requires considerable labour costs to measure.
- LiDAR light radar
- the frame for scanner 103 is made of lightweight structural-aluminium and weighs -200 kg. It is 3 m long, and has a wheelbase that can be adjusted between 1.2 and 3 m to enable operation in a variety of row spacings with maximum stability.
- the mast can be raised for measuring taller canopies and lowered for transportation. When raised, the mast is 3.2 m tall and stabilized by an additional aluminium support beam that is stored on the frame.
- Scanner 103 measures 2.1 m tall when the mast is lowered.
- Scanner 103's principle sensor, the LMS-400 LiDAR ( Figure 1a) can be mounted in virtually any position on the frame.
- the LiDAR can be rotated to scan anywhere from zero degrees, pointing straight at the ground, 90 degrees, pointed straight at the canopy, or 180 degrees, positioned underneath the canopy, aimed skyward. For all the scans presented here the LiDAR was mounted 2.25 m above the ground, on the centre mast and angled 45 degrees.
- the frame is equipped with three wheels: the front two wheels have built-in electric motors and there was one free-pivoting wheel in the rear.
- the rear tire is 21 inches in diameter and allows scanner 103 to have a zero degree turn radius, which was important for two reasons: First, looping between vineyard rows may be difficult if the platform was less manoeuvrable. Second, since the front two wheels are powered independently, scanner 103 can be programmed to operate autonomously.
- the two wheels in the front are 16 inch MagicPie 4 eBike-motors (Golden Motor Technology Co. Ltd., Changzhou, China). Each wheel is powered independently by a 48v lithium ion battery (Golden Motor Technology Co. Ltd., Changzhou, China).
- the wheels are operated and driving speed is controlled by two thumb-throttle controllers mounted on scanner 103's rear handle bars.
- Scanner 103 is also equipped with a 24v lithium ion battery (Golden Motor Technology Co. Ltd., Changzhou, China) which is used to power the instruments.
- the power from the battery is converted into four separate outputs: a 5v output, two 12v outputs and a 24v output (Helios Power Solutions Pty. Ltd., Sydney, Australia).
- a variety of voltages is created to power and test different sensors.
- the LiDAR mounted to scanner 103 is a SICK model LMS-400-2000 ( Figure 1a; SICK AG, Waldkirch, Germany).
- the laser is an eye-safe red laser (650 nm) and scans a 70 degree field of view.
- the LMS-400 has a range of 0.7 m to 3 m and can be programmed to scan between speeds of 250 to 500 Hz.
- the LiDAR produces polar coordinates (distance and angle) from the resolved time of flight from the laser, which are then converted to xyz coordinates to generate a point cloud. Additionally, the LiDAR produces information about the reflectance of the scanned surface.
- the reflectance value is related to the ability of a material to reflect the LiDAR signal back to the sensor: the higher the reflectance value, the more reflective the surface.
- the linear distance travelled by -scanner 103 is measured with a wheel encoder which provides sub-millimetre distance resolution. Viewed from the handlebars, the wheel encoder is in contact with the front left tire. (DFV60A-22PC65536, SICK AG, Waldkirch, Germany).
- the LiDAR and encoder data are integrated via a junction box (SICK CMD490-0103; SICK AG, Waldkirch, Germany).
- a Spatial GPS/IMU (Advanced Navigation, Sydney Australia) unit is attached with double-sided tape to the top of the LiDAR. The Spatial unit is used to record data about the angle of the LiDAR and scanner 103's spatial position ( ⁇ 2 m).
- the LiDAR, GPS and encoder data are captured using the field laptop running bespoke java software, which provides a user interface presenting a map of the GPS, input dialogs for the experiment name and run number.
- the LiDAR data is stored in a custom binary format (.PLF), while the GPS and encoder are combined and stored as text comma separated values (CSV) file format (.GPS).
- .PLF custom binary format
- CSV text comma separated values
- a custom-made piece of java software converts the .PLF and GPS data to a standard point cloud format such as the Stanford triangle format (.PLY).
- the integrated point cloud and encoder data, saved as a .PLY file, are visualized using the open-source software CloudCompare.
- Point clouds are processed and cleaned using two applications. First the points are filtered by their reflective intensity, or reflectance values, using an intensity selection plugin built into CloudCompare. All points with reflective intensities less than or equal to 1 are removed. Second, PCL wrapper plugin is used, which employs a nearest neighbour filtering algorithm. In detail, 10 points are used for mean point distance estimation and the standard deviation multiplier threshold is 1.00.
- Scanner 103 is capable of being wheeled onto a trailer by one person, anchored and ready for transport in ⁇ 30 minutes.
- the ease of transport gives the platform an advantage over some previous phenotyping platforms which are more cumbersome and difficult to transport.
- Scanner 103 is driven at an average speed of 1 m/s . Given that both sides of the vine had to be scanned, a one km vineyard-row is able to be scanned every hour.
- the first step in the workflow is choosing an area to scan. Because of the adjustable wheel base, scanner 103 could be used in almost any commercial vineyard. Vines in an test were of the variety Shiraz grown at a research vineyard in Sydney, South Australia. The smallest units identified for scans were single, ⁇ 3.6 m panels (3 vines per panel, with spacing between vines of 1.8 m) and the largest area scanned, to date, was a 500 m row containing 93 similar sized panels (data not shown). The 500 m row produced ⁇ 1 GB .PLY files for visualization.
- the point cloud was cleared of erroneous data points.
- the LMS-400 gives precise spatial and reflectance data at a high rate, it is designed to operate below 2000 lux and not under high light conditions.
- Lux values in indirect sunlight commonly range between 1 thousand lux on an overcast day to 130 thousand in direct sunlight.
- High light levels are the cause of spurious, low-intensity blue points seen between the LiDAR and the vines.
- the erroneous measurements are all low reflectance values and can be removed by filtering the scan based on a set reflectance value.
- Points with reflectance values ⁇ 1.0 were removed from the scan using the ⁇ filter points by value' plugin in CloudCompare. There are 1.49 million total points, and 28 % of those points were ⁇ 1.0.
- the reflectance threshold was chosen qualitatively and removed spurious points without significantly affecting the biological interpretation of the scan. Green leaf material had a reflectance value between one and five.
- the nearest neighbor statistical outlier plugin in CloudCompare removed sparse outliers based off the distance of an individual point from its neighbors. By applying these filters, point-clouds were reduced to only the scanned objects. There may be 1.12 million points. After the filter removing statistical outliers is applied there are 1.04 million points in the final point cloud on which any computational analysis would be performed.
- LiDAR is able to capture vine size and structure at all growth stages
- scanner 103 was used to scan a diversity of vine growth throughout 2015 growing season. Vines differ remarkably in size, age, management style and variety, which ultimately affects fruit quality and productivity. Thus, it was important to test the practical limitations of LiDAR on a variety of vines and growth-stages.
- the LiDAR may be able to distinguish leaves from bunches and estimate yield.
- This disclosure provides scanner 103 as a proximal sensing platform for use in Australian vineyards. Its frame will provide a flexible platform for testing multiple sensors in a variety of regions, management styles and grape varieties.
- the principal sensor on the frame is a LiDAR scanner.
- the 2D line scanner can scan one side of the vine canopy at a time and produce high definition 3D point clouds of vine growth.
- the ability of the LiDAR to capture growth features has not been limited to any specific variety of vine or management style It may be possible to achieve ground-truthing LiDAR scans and include data from any additional instruments - with conventional measurements of vine growth.
- other types of sensors such as stereo-RGB cameras and hyperspectral scanners.
Landscapes
- Engineering & Computer Science (AREA)
- Physics & Mathematics (AREA)
- General Physics & Mathematics (AREA)
- Radar, Positioning & Navigation (AREA)
- Remote Sensing (AREA)
- Computer Networks & Wireless Communication (AREA)
- Electromagnetism (AREA)
- Life Sciences & Earth Sciences (AREA)
- Environmental Sciences (AREA)
- Robotics (AREA)
- Botany (AREA)
- Mechanical Engineering (AREA)
- Soil Sciences (AREA)
- Management, Administration, Business Operations System, And Electronic Commerce (AREA)
- Cultivation Of Plants (AREA)
- Arrangement Or Mounting Of Control Devices For Change-Speed Gearing (AREA)
- Soil Working Implements (AREA)
- Massaging Devices (AREA)
Claims (15)
- Système pour calculer la biomasse de cultures (101), le système comprenant :un capteur de distance à balayage linéaire (103) pour mesurer une distance des cultures par rapport au capteur à un ou plusieurs points le long d'une ligne (203) en éclairant les cultures avec une lumière à un angle de mesure (205) qui définit la ligne et en détectant la lumière réfléchie, et pour générer des données de distance indiquant la distance (201) des cultures par rapport au capteur à l'angle de mesure à une vitesse de balayage de balayages linéaires ; etun système de déplacement (104) pour déplacer le capteur de distance à balayage linéaire ou les cultures sensiblement perpendiculairement à la distance des cultures par rapport au capteur ; caractérisé en ce que le système comprend en outre :un codeur rotatif (105) associé au système de déplacement pour générer des données de déplacement indiquant un déplacement du capteur de distance ou des cultures sensiblement perpendiculairement à la distance des cultures par rapport au capteur à une vitesse de codeur qui est supérieure à la vitesse de balayage des balayages linéaires provenant du capteur de distance à balayage linéaire quand le dispositif de déplacement déplace le capteur de distance à balayage linéaire à une vitesse de déplacement telle que de multiples impulsions de codeur sont générées entre les lignes de balayage ;un collecteur de données (106) pour associer les données de distance provenant du capteur de distance aux données de positionnement relatif sur la base des données de déplacement provenant du codeur rotatif et pour stocker les données de distance associées aux données de positionnement relatif sur un stockage de données ; etun serveur de traitement (510) configuré pour calculer, à partir des données de distance, une mesure absolue de biomasse.
- Système selon la revendication 1, dans lequel le dispositif de déplacement est un véhicule ou un portique.
- Système selon l'une quelconque des revendications précédentes, dans lequel le capteur de distance à balayage linéaire est dirigé vers le bas vers le sol ou le capteur de distance à balayage linéaire est dirigé latéralement.
- Système selon l'une quelconque des revendications précédentes, dans lequel les données de positionnement relatif présentent une précision de 1 cm ou plus, facultativement la vitesse de déplacement est de 1 m/s ou plus, facultativement la vitesse de balayage est de 500 Hz ou moins, et facultativement la vitesse du codeur est au moins dix fois supérieure à la vitesse de balayage.
- Système selon l'une quelconque des revendications précédentes, dans lequel le capteur de distance à balayage linéaire est configuré en outre pour générer des données d'intensité indiquant une intensité de la lumière réfléchie et le collecteur de données est configuré pour associer les données d'intensité provenant du capteur de distance à des données de positionnement relatif sur la base des données de déplacement provenant du codeur rotatif et pour stocker les données d'intensité associées aux données de positionnement relatif sur le stockage de données.
- Système selon l'une quelconque des revendications précédentes, dans lequel la lumière est une lumière laser et facultativement la lumière laser est une lumière laser rouge présentant une longueur d'onde entre 625 nm et 740 nm.
- Système selon l'une quelconque des revendications précédentes, dans lequelle capteur de distance à balayage linéaire est configuré pour mesurer à plusieurs reprises la distance des cultures par rapport au capteur le long de multiples lignes afin de générer des données de distance pour chacune des multiples lignes, etle collecteur de données est configuré pour associer les données de distance provenant de chacune des multiples lignes à des données de positionnement relatif indiquant une position relative de cette ligne.
- Procédé (600) pour calculer la biomasse de cultures (101), le procédé comprenant les étapes consistant à :éclairer les cultures avec une lumière à un angle de mesure qui définit une ligne (203) ;mesurer une distance (201) des cultures par rapport à un capteur de distance (103) à un ou plusieurs points le long de la ligne en détectant la lumière réfléchie ;générer des données de distance indiquant la distance des cultures par rapport au capteur à l'angle de mesure (205) à une vitesse de balayage ;déplacer le capteur de distance ou les cultures sensiblement perpendiculairement à la distance des cultures par rapport au capteur de distance ;caractérisé en ce que le procédé comprend en outre les étapes consistant à :générer des données de déplacement indiquant un déplacement du capteur de distance ou des cultures sensiblement perpendiculairement à la distance des cultures par rapport au capteur à une vitesse de codeur qui est supérieure à la vitesse de balayage des balayages linéaires provenant du capteur de distance quand le capteur de distance se déplace à une vitesse de déplacement telle que de multiples impulsions de codeur sont générées entre les lignes de balayage ;associer les données de distance provenant du capteur de distance à des données de positionnement relatif sur la base des données de déplacement ;stocker les données de distance associées aux données de positionnement relatif sur un stockage de données ; etcalculer, à partir des données de distance, une mesure absolue de la biomasse.
- Procédé selon la revendication 8, dans lequel le procédé comprend en outre le téléchargement des données de distance associées aux données de positionnement relatif vers un serveur de traitement pour amener le serveur de traitement à calculer la mesure absolue de la biomasse à partir des données de distance, dans lequel facultativement le téléchargement des données de distance comprend le téléchargement de plus de 5000 points de données de distance vers le serveur de traitement pour amener le serveur de traitement à calculer la mesure absolue de la biomasse sur la base des plus de 5000 points de données de distance.
- Procédé selon la revendication 8 ou 9, dans lequel la mesure de la distance des cultures par rapport au capteur de distance comprend la fourniture d'une valeur d'angle de balayage associée à une valeur de distance et la génération des données de distance comprend le calcul d'une hauteur de culture au-dessus du sol sur la base de la valeur de distance et de la valeur d'angle de balayage, dans lequel facultativement le calcul de la hauteur de culture au-dessus du sol est basé sur une hauteur de capteur prédéterminée au-dessus du sol.
- Procédé selon l'une quelconque des revendications 8 à 10, comprenant en outre :
le calcul de la mesure absolue de la biomasse pour une zone de surveillance, dans lequel facultativement les données de distance sont associées à des données d'intensité et le calcul de la mesure absolue de la biomasse comprend en outre le calcul de la mesure absolue de la biomasse à partir des données d'intensité. - Procédé selon l'une quelconque des revendications 8 à 11, dans lequel les données de distance comprennent de multiples balayages linéaires de multiples zones de surveillance et le calcul à partir des données de distance comprend le calcul à partir des données de distance pour chacune des multiples zones de surveillance, de la mesure absolue de la biomasse pour chacune des multiples zones de surveillance, dans lequel facultativement chacune des multiples zones de surveillance est associée à une population différente de cultures, dans lequel facultativement le procédé comprend en outre la détection automatique des multiples zones de surveillance sur la base des données de distance et des données de positionnement relatif.
- Procédé selon la revendication 12, comprenant en outre la sélection d'une population associée à l'une des multiples zones de surveillance sur la base de la mesure absolue de la biomasse pour une reproduction ultérieure.
- Procédé selon l'une quelconque des revendications 11 à 13, dans lequel le calcul, à partir des données de distance, de la mesure absolue de la biomasse est basé sur des données de corrélation indiquant une corrélation entre des données historiques de distance et des mesures absolues historiques de biomasse, dans lequel les mesures absolues historiques de biomasse indiquent des mesures absolues historiques mesurées de biomasse de cultures échantillonnées, dans lequel le procédé comprend en outre la détermination des données de corrélation en effectuant un apprentissage automatique sur les données historiques de distance et les mesures absolues historiques de biomasse.
- Procédé selon l'une quelconque des revendications 8 à 13, dans lequel les multiples impulsions de codeur présentent une résolution de 1 mm ou moins et les balayages linéaires présentent une distance de ligne de 100 mm ou moins.
Applications Claiming Priority (3)
| Application Number | Priority Date | Filing Date | Title |
|---|---|---|---|
| AU2016905220A AU2016905220A0 (en) | 2016-12-16 | Crop Scanner | |
| AU2017903379A AU2017903379A0 (en) | 2017-08-22 | Crop Scanner | |
| PCT/AU2017/051400 WO2018107242A1 (fr) | 2016-12-16 | 2017-12-15 | Dispositif de balayage de cultures |
Publications (4)
| Publication Number | Publication Date |
|---|---|
| EP3555562A1 EP3555562A1 (fr) | 2019-10-23 |
| EP3555562A4 EP3555562A4 (fr) | 2020-08-19 |
| EP3555562C0 EP3555562C0 (fr) | 2023-07-26 |
| EP3555562B1 true EP3555562B1 (fr) | 2023-07-26 |
Family
ID=62557660
Family Applications (1)
| Application Number | Title | Priority Date | Filing Date |
|---|---|---|---|
| EP17882012.2A Active EP3555562B1 (fr) | 2016-12-16 | 2017-12-15 | Dispositif de balayage de cultures |
Country Status (5)
| Country | Link |
|---|---|
| US (1) | US10959377B2 (fr) |
| EP (1) | EP3555562B1 (fr) |
| AU (1) | AU2017377676B2 (fr) |
| ES (1) | ES2951738T3 (fr) |
| WO (1) | WO2018107242A1 (fr) |
Families Citing this family (14)
| Publication number | Priority date | Publication date | Assignee | Title |
|---|---|---|---|---|
| CA3109715A1 (fr) * | 2018-08-17 | 2020-02-20 | Hortau Inc. | Systemes et procedes de surveillance et de et de regulation de productivite de plantes |
| US11559004B2 (en) * | 2019-01-10 | 2023-01-24 | Fluence Bioengineering, Inc. | Horticultural luminaire with LiDAR sensing |
| US20210342713A1 (en) * | 2020-05-04 | 2021-11-04 | Bioverse Labs Corp | Environmental and crop monitoring system |
| CA3163802A1 (fr) * | 2020-01-06 | 2021-07-15 | Thomas James MATARAZZO | Systeme de detection mobile pour surveillance de recolte |
| CN111489388A (zh) * | 2020-04-20 | 2020-08-04 | 黑龙江工程学院 | 一种基于有效冠信息的生物量反演方法 |
| CN112014330B (zh) * | 2020-07-30 | 2024-09-10 | 北京农业智能装备技术研究中心 | 作物近地光谱数据采集方法及装置 |
| GB2601557B (en) * | 2020-12-04 | 2023-02-22 | Canon Res Centre France | Generating characteristics data of an agricultural field adapted for precision farming |
| CN113607906B (zh) * | 2021-08-02 | 2024-06-14 | 北华航天工业学院 | 水体底栖初级生产力测量仪 |
| US12408577B2 (en) | 2021-12-29 | 2025-09-09 | Cnh Industrial America Llc | Systems and methods for soil clod detection |
| IT202200003395A1 (it) * | 2022-02-23 | 2023-08-23 | Cnh Ind Italia Spa | Sistema di controllo autonomo di un attrezzo per diserbo connesso ad un veicolo agricolo |
| CN115830972B (zh) * | 2022-11-08 | 2026-03-17 | 南京林业大学 | 基于3d扫描的植物生长动态演示装置 |
| CN118209965B (zh) * | 2022-12-15 | 2025-05-16 | 深圳市速腾聚创科技有限公司 | 雷达控制方法、装置、终端设备及计算机可读存储介质 |
| CN117063714B (zh) * | 2023-06-16 | 2026-03-27 | 石河子大学 | 一种基于点云图像联合的辣椒收获机运动参数控制方法 |
| CN118542162B (zh) * | 2023-08-21 | 2025-12-30 | 南京农业大学 | 基于机器视觉的果树自动修剪系统 |
Family Cites Families (8)
| Publication number | Priority date | Publication date | Assignee | Title |
|---|---|---|---|---|
| US5585626A (en) | 1992-07-28 | 1996-12-17 | Patchen, Inc. | Apparatus and method for determining a distance to an object in a field for the controlled release of chemicals on plants, weeds, trees or soil and/or guidance of farm vehicles |
| EP0801885B1 (fr) * | 1996-04-19 | 2002-01-09 | Carnegie-Mellon University | Guidage par rapport à ligne de récolte basé sur la vision |
| US7337733B2 (en) * | 2005-06-09 | 2008-03-04 | Gary W. Clem, Inc. | Distance measuring device for planter |
| US8121345B2 (en) * | 2006-05-18 | 2012-02-21 | Applied Perception, Inc. | Vision guidance system and method for identifying the position of crop rows in a field |
| US20110041399A1 (en) * | 2009-08-21 | 2011-02-24 | Syngenta Participations Ag | Automated system for analyzing plant vigor |
| BR112012030008B1 (pt) * | 2010-05-27 | 2019-07-02 | Syngenta Participations Ag | Sistema para avaliação de fitotoxicidade e/ou lesão de plantas, método de seleção de planta tratada com pesticida e método para triagem quanto a pesticidas |
| WO2012094116A1 (fr) | 2011-01-07 | 2012-07-12 | Siemens Mark C | Machine automatisée pour manipulation in situ sélective de plantes |
| US9658201B2 (en) * | 2013-03-07 | 2017-05-23 | Blue River Technology Inc. | Method for automatic phenotype measurement and selection |
-
2017
- 2017-12-15 AU AU2017377676A patent/AU2017377676B2/en active Active
- 2017-12-15 ES ES17882012T patent/ES2951738T3/es active Active
- 2017-12-15 EP EP17882012.2A patent/EP3555562B1/fr active Active
- 2017-12-15 US US16/469,869 patent/US10959377B2/en active Active
- 2017-12-15 WO PCT/AU2017/051400 patent/WO2018107242A1/fr not_active Ceased
Also Published As
| Publication number | Publication date |
|---|---|
| US20200077588A1 (en) | 2020-03-12 |
| US10959377B2 (en) | 2021-03-30 |
| EP3555562C0 (fr) | 2023-07-26 |
| AU2017377676B2 (en) | 2022-05-12 |
| AU2017377676A1 (en) | 2019-06-20 |
| AU2017377676A9 (en) | 2019-07-11 |
| EP3555562A4 (fr) | 2020-08-19 |
| ES2951738T3 (es) | 2023-10-24 |
| EP3555562A1 (fr) | 2019-10-23 |
| WO2018107242A1 (fr) | 2018-06-21 |
Similar Documents
| Publication | Publication Date | Title |
|---|---|---|
| EP3555562B1 (fr) | Dispositif de balayage de cultures | |
| CN104718874B (zh) | 用于收割机的产量测量和根部切割器高度控制系统 | |
| Andujar et al. | Using depth cameras to extract structural parameters to assess the growth state and yield of cauliflower crops | |
| Bai et al. | A multi-sensor system for high throughput field phenotyping in soybean and wheat breeding | |
| JP5020444B2 (ja) | 作物生育量測定装置、作物生育量測定方法、作物生育量測定プログラム及びその作物生育量測定プログラムを記録したコンピュータ読取可能な記録媒体 | |
| US9423249B2 (en) | Biometric measurement systems and methods | |
| EP3467702A1 (fr) | Procédé et système pour effectuer une analyse de données pour un phénotypage de plantes | |
| EP1777486A1 (fr) | Système capteur, méthode et produit logiciel pour mesurer le phenotype de plantes dans des environnements agricoles | |
| CN113920106B (zh) | 一种基于rgb-d相机的玉米长势三维重构及茎粗测量方法 | |
| US10602665B2 (en) | Two armed robotic system for adjusting the height of an agricultural tool | |
| Tao et al. | Heritable variation in tree growth and needle vegetation indices of slash pine (Pinus elliottii) using unmanned aerial vehicles (UAVs) | |
| Atkinson et al. | Field phenotyping for the future | |
| US20230152249A1 (en) | Systems and Methods for Using Backscatter Imaging in Precision Agriculture | |
| EP4108082A1 (fr) | Appareil et procédé pour mesurer l'activité des insectes | |
| CN116887955B (zh) | 在精确农业中使用反向散射成像的系统和方法 | |
| Rui et al. | A review of field plant phenotyping platform, sensing and navigation technology | |
| Han et al. | Effects of different ground segmentation methods on the accuracy of UAV-based canopy volume measurements | |
| Tsoulias et al. | In-situ detection of apple fruit using a 2D LiDAR laser scanner | |
| Hoffmeister | Laser scanning approaches for crop Monitoring | |
| CN121241782B (zh) | 基于图像识别定位的菠萝采摘控制方法、系统及采摘机 | |
| McCarthy | Automatic non-destructive dimensional measurement of cotton plants in real-time by machine vision | |
| He et al. | High-Throughput Field-Based Phenotyping and Its Application in Tomato Improvement | |
| Andújar et al. | Using depth cameras for biomass estimation–a multi-angle approach | |
| KR101386397B1 (ko) | 콤바인의 동작 제어 장치 및 그 방법 | |
| Ampatzidis et al. | UAV-and cloud-based application for high throughput phenotyping utilizing deep learning |
Legal Events
| Date | Code | Title | Description |
|---|---|---|---|
| STAA | Information on the status of an ep patent application or granted ep patent |
Free format text: STATUS: THE INTERNATIONAL PUBLICATION HAS BEEN MADE |
|
| PUAI | Public reference made under article 153(3) epc to a published international application that has entered the european phase |
Free format text: ORIGINAL CODE: 0009012 |
|
| STAA | Information on the status of an ep patent application or granted ep patent |
Free format text: STATUS: REQUEST FOR EXAMINATION WAS MADE |
|
| 17P | Request for examination filed |
Effective date: 20190715 |
|
| AK | Designated contracting states |
Kind code of ref document: A1 Designated state(s): AL AT BE BG CH CY CZ DE DK EE ES FI FR GB GR HR HU IE IS IT LI LT LU LV MC MK MT NL NO PL PT RO RS SE SI SK SM TR |
|
| AX | Request for extension of the european patent |
Extension state: BA ME |
|
| DAV | Request for validation of the european patent (deleted) | ||
| DAX | Request for extension of the european patent (deleted) | ||
| REG | Reference to a national code |
Ref country code: DE Ref legal event code: R079 Free format text: PREVIOUS MAIN CLASS: G01C0003080000 Ipc: A01B0079000000 Ref document number: 602017071953 Country of ref document: DE |
|
| A4 | Supplementary search report drawn up and despatched |
Effective date: 20200721 |
|
| RIC1 | Information provided on ipc code assigned before grant |
Ipc: G01S 17/88 20060101ALI20200715BHEP Ipc: G01B 11/14 20060101ALI20200715BHEP Ipc: A01B 79/00 20060101AFI20200715BHEP Ipc: G01S 17/89 20200101ALI20200715BHEP Ipc: G01C 3/08 20060101ALI20200715BHEP |
|
| STAA | Information on the status of an ep patent application or granted ep patent |
Free format text: STATUS: EXAMINATION IS IN PROGRESS |
|
| 17Q | First examination report despatched |
Effective date: 20211022 |
|
| GRAP | Despatch of communication of intention to grant a patent |
Free format text: ORIGINAL CODE: EPIDOSNIGR1 |
|
| STAA | Information on the status of an ep patent application or granted ep patent |
Free format text: STATUS: GRANT OF PATENT IS INTENDED |
|
| INTG | Intention to grant announced |
Effective date: 20220920 |
|
| GRAJ | Information related to disapproval of communication of intention to grant by the applicant or resumption of examination proceedings by the epo deleted |
Free format text: ORIGINAL CODE: EPIDOSDIGR1 |
|
| STAA | Information on the status of an ep patent application or granted ep patent |
Free format text: STATUS: EXAMINATION IS IN PROGRESS |
|
| INTC | Intention to grant announced (deleted) | ||
| GRAP | Despatch of communication of intention to grant a patent |
Free format text: ORIGINAL CODE: EPIDOSNIGR1 |
|
| STAA | Information on the status of an ep patent application or granted ep patent |
Free format text: STATUS: GRANT OF PATENT IS INTENDED |
|
| INTG | Intention to grant announced |
Effective date: 20230314 |
|
| GRAS | Grant fee paid |
Free format text: ORIGINAL CODE: EPIDOSNIGR3 |
|
| GRAA | (expected) grant |
Free format text: ORIGINAL CODE: 0009210 |
|
| STAA | Information on the status of an ep patent application or granted ep patent |
Free format text: STATUS: THE PATENT HAS BEEN GRANTED |
|
| AK | Designated contracting states |
Kind code of ref document: B1 Designated state(s): AL AT BE BG CH CY CZ DE DK EE ES FI FR GB GR HR HU IE IS IT LI LT LU LV MC MK MT NL NO PL PT RO RS SE SI SK SM TR |
|
| REG | Reference to a national code |
Ref country code: CH Ref legal event code: EP |
|
| REG | Reference to a national code |
Ref country code: DE Ref legal event code: R096 Ref document number: 602017071953 Country of ref document: DE |
|
| REG | Reference to a national code |
Ref country code: IE Ref legal event code: FG4D |
|
| U01 | Request for unitary effect filed |
Effective date: 20230807 |
|
| U07 | Unitary effect registered |
Designated state(s): AT BE BG DE DK EE FI FR IT LT LU LV MT NL PT SE SI Effective date: 20230811 |
|
| REG | Reference to a national code |
Ref country code: ES Ref legal event code: FG2A Ref document number: 2951738 Country of ref document: ES Kind code of ref document: T3 Effective date: 20231024 |
|
| REG | Reference to a national code |
Ref country code: LT Ref legal event code: MG9D |
|
| PG25 | Lapsed in a contracting state [announced via postgrant information from national office to epo] |
Ref country code: GR Free format text: LAPSE BECAUSE OF FAILURE TO SUBMIT A TRANSLATION OF THE DESCRIPTION OR TO PAY THE FEE WITHIN THE PRESCRIBED TIME-LIMIT Effective date: 20231027 |
|
| PG25 | Lapsed in a contracting state [announced via postgrant information from national office to epo] |
Ref country code: IS Free format text: LAPSE BECAUSE OF FAILURE TO SUBMIT A TRANSLATION OF THE DESCRIPTION OR TO PAY THE FEE WITHIN THE PRESCRIBED TIME-LIMIT Effective date: 20231126 |
|
| PG25 | Lapsed in a contracting state [announced via postgrant information from national office to epo] |
Ref country code: RS Free format text: LAPSE BECAUSE OF FAILURE TO SUBMIT A TRANSLATION OF THE DESCRIPTION OR TO PAY THE FEE WITHIN THE PRESCRIBED TIME-LIMIT Effective date: 20230726 Ref country code: NO Free format text: LAPSE BECAUSE OF FAILURE TO SUBMIT A TRANSLATION OF THE DESCRIPTION OR TO PAY THE FEE WITHIN THE PRESCRIBED TIME-LIMIT Effective date: 20231026 Ref country code: IS Free format text: LAPSE BECAUSE OF FAILURE TO SUBMIT A TRANSLATION OF THE DESCRIPTION OR TO PAY THE FEE WITHIN THE PRESCRIBED TIME-LIMIT Effective date: 20231126 Ref country code: HR Free format text: LAPSE BECAUSE OF FAILURE TO SUBMIT A TRANSLATION OF THE DESCRIPTION OR TO PAY THE FEE WITHIN THE PRESCRIBED TIME-LIMIT Effective date: 20230726 Ref country code: GR Free format text: LAPSE BECAUSE OF FAILURE TO SUBMIT A TRANSLATION OF THE DESCRIPTION OR TO PAY THE FEE WITHIN THE PRESCRIBED TIME-LIMIT Effective date: 20231027 |
|
| PG25 | Lapsed in a contracting state [announced via postgrant information from national office to epo] |
Ref country code: PL Free format text: LAPSE BECAUSE OF FAILURE TO SUBMIT A TRANSLATION OF THE DESCRIPTION OR TO PAY THE FEE WITHIN THE PRESCRIBED TIME-LIMIT Effective date: 20230726 |
|
| U21 | Renewal fee for the european patent with unitary effect paid with additional fee |
Year of fee payment: 7 Effective date: 20240129 |
|
| REG | Reference to a national code |
Ref country code: DE Ref legal event code: R097 Ref document number: 602017071953 Country of ref document: DE |
|
| PG25 | Lapsed in a contracting state [announced via postgrant information from national office to epo] |
Ref country code: SM Free format text: LAPSE BECAUSE OF FAILURE TO SUBMIT A TRANSLATION OF THE DESCRIPTION OR TO PAY THE FEE WITHIN THE PRESCRIBED TIME-LIMIT Effective date: 20230726 Ref country code: RO Free format text: LAPSE BECAUSE OF FAILURE TO SUBMIT A TRANSLATION OF THE DESCRIPTION OR TO PAY THE FEE WITHIN THE PRESCRIBED TIME-LIMIT Effective date: 20230726 Ref country code: CZ Free format text: LAPSE BECAUSE OF FAILURE TO SUBMIT A TRANSLATION OF THE DESCRIPTION OR TO PAY THE FEE WITHIN THE PRESCRIBED TIME-LIMIT Effective date: 20230726 Ref country code: SK Free format text: LAPSE BECAUSE OF FAILURE TO SUBMIT A TRANSLATION OF THE DESCRIPTION OR TO PAY THE FEE WITHIN THE PRESCRIBED TIME-LIMIT Effective date: 20230726 |
|
| PLBE | No opposition filed within time limit |
Free format text: ORIGINAL CODE: 0009261 |
|
| STAA | Information on the status of an ep patent application or granted ep patent |
Free format text: STATUS: NO OPPOSITION FILED WITHIN TIME LIMIT |
|
| 26N | No opposition filed |
Effective date: 20240429 |
|
| REG | Reference to a national code |
Ref country code: CH Ref legal event code: PL |
|
| PG25 | Lapsed in a contracting state [announced via postgrant information from national office to epo] |
Ref country code: MC Free format text: LAPSE BECAUSE OF FAILURE TO SUBMIT A TRANSLATION OF THE DESCRIPTION OR TO PAY THE FEE WITHIN THE PRESCRIBED TIME-LIMIT Effective date: 20230726 |
|
| PG25 | Lapsed in a contracting state [announced via postgrant information from national office to epo] |
Ref country code: MC Free format text: LAPSE BECAUSE OF FAILURE TO SUBMIT A TRANSLATION OF THE DESCRIPTION OR TO PAY THE FEE WITHIN THE PRESCRIBED TIME-LIMIT Effective date: 20230726 |
|
| REG | Reference to a national code |
Ref country code: IE Ref legal event code: MM4A |
|
| PG25 | Lapsed in a contracting state [announced via postgrant information from national office to epo] |
Ref country code: IE Free format text: LAPSE BECAUSE OF NON-PAYMENT OF DUE FEES Effective date: 20231215 |
|
| PG25 | Lapsed in a contracting state [announced via postgrant information from national office to epo] |
Ref country code: CH Free format text: LAPSE BECAUSE OF NON-PAYMENT OF DUE FEES Effective date: 20231231 |
|
| PG25 | Lapsed in a contracting state [announced via postgrant information from national office to epo] |
Ref country code: IE Free format text: LAPSE BECAUSE OF NON-PAYMENT OF DUE FEES Effective date: 20231215 Ref country code: CH Free format text: LAPSE BECAUSE OF NON-PAYMENT OF DUE FEES Effective date: 20231231 |
|
| PGFP | Annual fee paid to national office [announced via postgrant information from national office to epo] |
Ref country code: GB Payment date: 20241205 Year of fee payment: 8 |
|
| U20 | Renewal fee for the european patent with unitary effect paid |
Year of fee payment: 8 Effective date: 20241219 |
|
| PGFP | Annual fee paid to national office [announced via postgrant information from national office to epo] |
Ref country code: ES Payment date: 20250117 Year of fee payment: 8 |
|
| PG25 | Lapsed in a contracting state [announced via postgrant information from national office to epo] |
Ref country code: CY Free format text: LAPSE BECAUSE OF FAILURE TO SUBMIT A TRANSLATION OF THE DESCRIPTION OR TO PAY THE FEE WITHIN THE PRESCRIBED TIME-LIMIT; INVALID AB INITIO Effective date: 20171215 |
|
| PG25 | Lapsed in a contracting state [announced via postgrant information from national office to epo] |
Ref country code: HU Free format text: LAPSE BECAUSE OF FAILURE TO SUBMIT A TRANSLATION OF THE DESCRIPTION OR TO PAY THE FEE WITHIN THE PRESCRIBED TIME-LIMIT; INVALID AB INITIO Effective date: 20171215 |
|
| PG25 | Lapsed in a contracting state [announced via postgrant information from national office to epo] |
Ref country code: TR Free format text: LAPSE BECAUSE OF FAILURE TO SUBMIT A TRANSLATION OF THE DESCRIPTION OR TO PAY THE FEE WITHIN THE PRESCRIBED TIME-LIMIT Effective date: 20230726 |