EP3576096A1 - Empfindlichkeitsanalyse für digitale pathologie - Google Patents
Empfindlichkeitsanalyse für digitale pathologie Download PDFInfo
- Publication number
- EP3576096A1 EP3576096A1 EP18175126.4A EP18175126A EP3576096A1 EP 3576096 A1 EP3576096 A1 EP 3576096A1 EP 18175126 A EP18175126 A EP 18175126A EP 3576096 A1 EP3576096 A1 EP 3576096A1
- Authority
- EP
- European Patent Office
- Prior art keywords
- pathology
- digital
- detection
- data
- score
- Prior art date
- Legal status (The legal status is an assumption and is not a legal conclusion. Google has not performed a legal analysis and makes no representation as to the accuracy of the status listed.)
- Withdrawn
Links
Images
Classifications
-
- G—PHYSICS
- G06—COMPUTING OR CALCULATING; COUNTING
- G06T—IMAGE DATA PROCESSING OR GENERATION, IN GENERAL
- G06T7/00—Image analysis
- G06T7/0002—Inspection of images, e.g. flaw detection
- G06T7/0012—Biomedical image inspection
-
- G—PHYSICS
- G16—INFORMATION AND COMMUNICATION TECHNOLOGY [ICT] SPECIALLY ADAPTED FOR SPECIFIC APPLICATION FIELDS
- G16H—HEALTHCARE INFORMATICS, i.e. INFORMATION AND COMMUNICATION TECHNOLOGY [ICT] SPECIALLY ADAPTED FOR THE HANDLING OR PROCESSING OF MEDICAL OR HEALTHCARE DATA
- G16H30/00—ICT specially adapted for the handling or processing of medical images
-
- G—PHYSICS
- G01—MEASURING; TESTING
- G01N—INVESTIGATING OR ANALYSING MATERIALS BY DETERMINING THEIR CHEMICAL OR PHYSICAL PROPERTIES
- G01N21/00—Investigating or analysing materials by the use of optical means, i.e. using sub-millimetre waves, infrared, visible or ultraviolet light
- G01N21/17—Systems in which incident light is modified in accordance with the properties of the material investigated
- G01N21/25—Colour; Spectral properties, i.e. comparison of effect of material on the light at two or more different wavelengths or wavelength bands
- G01N21/31—Investigating relative effect of material at wavelengths characteristic of specific elements or molecules, e.g. atomic absorption spectrometry
-
- G—PHYSICS
- G01—MEASURING; TESTING
- G01N—INVESTIGATING OR ANALYSING MATERIALS BY DETERMINING THEIR CHEMICAL OR PHYSICAL PROPERTIES
- G01N21/00—Investigating or analysing materials by the use of optical means, i.e. using sub-millimetre waves, infrared, visible or ultraviolet light
- G01N21/62—Systems in which the material investigated is excited whereby it emits light or causes a change in wavelength of the incident light
- G01N21/63—Systems in which the material investigated is excited whereby it emits light or causes a change in wavelength of the incident light optically excited
- G01N21/64—Fluorescence; Phosphorescence
- G01N21/6486—Measuring fluorescence of biological material, e.g. DNA, RNA, cells
-
- G—PHYSICS
- G16—INFORMATION AND COMMUNICATION TECHNOLOGY [ICT] SPECIALLY ADAPTED FOR SPECIFIC APPLICATION FIELDS
- G16H—HEALTHCARE INFORMATICS, i.e. INFORMATION AND COMMUNICATION TECHNOLOGY [ICT] SPECIALLY ADAPTED FOR THE HANDLING OR PROCESSING OF MEDICAL OR HEALTHCARE DATA
- G16H10/00—ICT specially adapted for the handling or processing of patient-related medical or healthcare data
- G16H10/40—ICT specially adapted for the handling or processing of patient-related medical or healthcare data for data related to laboratory analysis, e.g. patient specimen analysis
-
- G—PHYSICS
- G01—MEASURING; TESTING
- G01N—INVESTIGATING OR ANALYSING MATERIALS BY DETERMINING THEIR CHEMICAL OR PHYSICAL PROPERTIES
- G01N21/00—Investigating or analysing materials by the use of optical means, i.e. using sub-millimetre waves, infrared, visible or ultraviolet light
- G01N21/17—Systems in which incident light is modified in accordance with the properties of the material investigated
- G01N2021/1765—Method using an image detector and processing of image signal
-
- G—PHYSICS
- G06—COMPUTING OR CALCULATING; COUNTING
- G06T—IMAGE DATA PROCESSING OR GENERATION, IN GENERAL
- G06T2207/00—Indexing scheme for image analysis or image enhancement
- G06T2207/10—Image acquisition modality
- G06T2207/10064—Fluorescence image
-
- G—PHYSICS
- G06—COMPUTING OR CALCULATING; COUNTING
- G06T—IMAGE DATA PROCESSING OR GENERATION, IN GENERAL
- G06T2207/00—Indexing scheme for image analysis or image enhancement
- G06T2207/20—Special algorithmic details
- G06T2207/20076—Probabilistic image processing
Definitions
- the present invention relates to an apparatus for processing digital pathology image data to generate pathology score data and the sensitivity analysis of the pathology score data, and an associated method, a digital pathology system, a computer program element, and a computer readable medium.
- an apparatus for digitally processing digital pathology image data to generate pathology score data, and a sensitivity analysis of the pathology score data comprises:
- the input unit is configured to obtain digital pathology image data comprising an image of a pathology sample.
- the processing unit is configured to classify objects in the digital pathology image data into a plurality of candidate objects, to assign a first pathological state to at least one candidate object in the plurality of candidate objects according to one or more detection thresholds and/or detection probabilities, to obtain initial pathology score data of the pathology sample based on the candidate objects in the plurality of candidate objects having been assigned the first pathological state, to perturb the one or more detection thresholds and/or the detection probabilities according to a perturbation function to generate a perturbed detection threshold and/or a perturbed detection probability, to reassign the first pathological state to at least one candidate object in the plurality of candidate objects according to the one or more perturbed detection thresholds and/or perturbed detection probabilities, to obtain updated pathology score data of the pathology sample based on the candidate objects having been reassigned the first pathological state according to the one or more perturbed detection thresholds and/or the perturbed detection probabilities, and to compare the initial pathology score data and the updated pathology score data to obtain
- the thresholds may, for example, be related to the probability of pixel or area classification of an object in a digital pathology image.
- the thresholds may be related to the intensities and/or wavelengths that represent the expression of a biomarker in a pathological sample.
- a medical professional may be provided with an assessment of how sensitive the pathology score is to minor changes in the analysis. This may be particularly important when an output pathology score is at or near a boundary value, where a pathology score slightly above or slightly below the boundary value could lead to alternative treatment options.
- a medical professional may use the information about the sensitivity of the pathological technique in decision-making and reporting, and optionally may perform a manual inspection of indicated problematic areas. Therefore, the pathology process is made faster and more reliable.
- the one or more detection thresholds and/or detection probabilities characterise a variation in automatic morphological feature detection when determining the presence of a candidate object in the digital pathology image data.
- a morphological feature detection algorithm such as "morphological closing" may have several input arguments altering its effectiveness.
- the sensitivity of the pathological scoring approach to the morphological feature detection algorithm when considered with a specific digital pathology image may be considered.
- the one or more detection thresholds characterise a probability of automatic classification of the objects in the digital pathology image data into the plurality of candidate objects.
- the detection threshold and/or the detection probability characterise an intensity level and/or a wavelength range of light emitted from a pathology sample and represented in the digital pathology image data.
- a pathology sample is treated with a biomarker that stains a sample a first colour when the biomarker is in contact with a material target, and that stains a sample a second colour (or does not stain) when the biomarker is not in contact with material target.
- staining may be observed for example using a light microscope and/or a fluorescence microscope (in the case of a fluorescently tagged biomarker).
- Changes in the biomarker application protocol, sample preparation, storage and/or viewing all lead to sensitivity in the provision of a pathological score. Accordingly, in this optional embodiment it is possible to assess the effect of changes in an intensity level and/or a wavelength range of light emitted from a pathology sample on the final pathological score relating to that sample.
- the intensity level and/or the wavelength range emitted from the pathology sample and represented in the digital pathology image data indicate a relative level of the expression of a biomarker.
- the processing unit is further configured to obtain a plurality of perturbed detection thresholds and/or perturbed detection probabilities forming a sensitivity function of the pathology score of the digital pathology image data and optionally, and to compute a relative detection threshold change necessary to provide a change in the pathology score.
- generating a sensitivity function based on a plurality of perturbed detection thresholds enables a rate of change of a sensitivity function to be assessed as a rate of change of one, or more of the detection thresholds and/or probabilities, rather than at discrete thresholded points. From this, optimum thresholds for specific sample types and other analysis settings can be provided which are the least likely to lead to unpredictable changes in the pathology score, for example
- the processing unit is further configured to obtain the initial pathology score data and/or the updated pathology score data by counting the number of candidate objects in a field of interest of the digital pathology data having been assigned the first pathological state before and/or after perturbation, or by calculating a percentage score of the number of candidate objects in a field of interest of the digital pathology data having been assigned the first pathological state before and/or after perturbation.
- the processing unit is further configured to assign a second pathological state to at least one candidate object showing positive expression of a first biomarker of interest, to assign a third pathological state to at least one candidate object showing negative expression of the first biomarker of interest, to obtain the initial pathology score data by performing a calculation using the candidate objects in the field of interest of the digital pathology data in the second and third pathological states, to perturb the detection thresholds used to assign the second and third pathological states to the candidate objects and to reassign the second and third pathological states to the candidate objects after perturbation, and to obtain updated pathology score data by performing a calculation using the candidate objects in the second and third pathological states after perturbation.
- Histopathology protocols involving the measurement of negative and positive biomarker expression are complicated to perform, and thus the effect of variable measurement thresholds in the sample preparation and digital image processing of the digital pathology images may lead to more accurate assessment of the results of such complicated protocols.
- the apparatus further comprises:
- the output unit is configured to output the sensitivity of the pathology score data to a user, optionally in combination with the initial and/or updated pathology score data and/or outputting the sensitivity of the pathology score relative to a clinical threshold.
- the medical professional is quickly and conveniently provided with an assessment of the sensitivity of a pathological test to internal test variations. Hitherto, the effect of threshold variations on pathological tests have been difficult to perceive.
- the processing unit is further configured to spatially sub-sample the digital pathology image data into a plurality of sectors, and to obtain initial pathology score data and updated pathology score for each sector, to generate a spatial sensitivity mask of the digital pathology image data using the initial pathology score data and updated pathology score for the each sector.
- the output unit is configured to display the spatial sensitivity mask to a user, optionally as a semi-transparent overlay in spatial alignment superimposed over the digital pathology image data.
- the pathology sample is a histopathology sample or a cyto(path)ology sample.
- a digital pathology system According to a second aspect, there is provided a digital pathology system.
- the digital pathology system comprises:
- a method for digitally processing digital pathology image data to generate pathology score data, and a sensitivity analysis of the pathology score data comprises:
- the method is method for processing digital histopathology image data to generate histopathology score data, and a sensitivity analysis of the histopathology score data.
- the method is method for processing digital cytopathology image data to generate cytopathology score data, and a sensitivity analysis of the cytopathology score data.
- a computer program element comprising instructions which, when the program is executed by a computer or a processing unit, cause the computer to carry out the method of the third aspect.
- a computer readable medium having stored thereon the computer program element of the fourth aspect.
- digital pathology image data means a digital representation of a pathology slide obtained using a digital light microscope or a digital fluorescent microscope, for example. Many scanners can support resolutions of between 10x and 40x magnification.
- An image file associated with a 20x scan of a 15mm x 20mm specimen is as large as 3.6 GB.
- the images may be compressed to more manageable sizes using JPEG-2000 compression, for example.
- the images are typically accompanied with meta data containing a scan parameters, scan plan, and the like.
- identifiers defining sections of the part, block and stain type may be comprised in the meta data.
- pathology refers to the diagnosis of medical conditions by examining tissue, cell, and body fluid samples.
- histopathology refers to the preparation of a biopsy tissue specimen in, for example, a resin block which is then cleaved into successive slices prepared on glass slides.
- Cytopathology refers the examination of free cells or tissue micro fragments.
- pathology score data means the examination of pathology (histopathological, cytopathological) images to provide a likelihood of a certain medical condition being present.
- a pathology score may be derived by examining a histopathology slide and counting a number of objects of interest, such as cells or cell nuclei meeting a condition for some disease to present, as opposed to the number of cells that do not meet the condition.
- a pathology score can be provided as a cell count per unit area of a digital pathology image, or as a percentage, for example.
- clinical threshold means that a pathology score indicates that a medical condition is present based upon the counting of objects of interest identified in the digital pathology image data.
- achievement of a clinical threshold may be used to decide upon different forms of medical treatment.
- sensitivity analysis means an assessment of how a pathology score changes, and/or the rate at which pathology score changes, when internal thresholds in an algorithm used to determine or to generate the pathology score are changed (or perturbed). Such internal thresholds may not be visible to an end-user of a digital pathology system. In addition, in complicated protocols, there may be so many internal thresholds that the complexity of changes to those thresholds, and their effects on the digital pathology image data processing pipeline quickly overwhelms even an experienced user. A sensitivity analysis therefore provides a realistic assessment of how changes (perturbations) to parameters used in the analysis pipeline can affect the pathology score.
- sensitivity function means the relationship between the level of internal thresholds in the analysis pipeline, and their effect on the pathology score as applied to the same input digital pathology image data.
- the term "perturbation" means a change made to one or more of the internal thresholds of the digital pathology image analysis pipeline.
- Skilled reader will appreciate that the number and type of internal thresholds of a digital pathology image analysis pipeline is highly dependent on the protocol being performed by the analysis pipeline.
- an image analysis pipeline may receive as an input a digital histopathology image stained with haematoxylin conventionally thresholded at an absorption level of 0.1.
- a simple example of a perturbation would be to change the threshold used to threshold the digital histopathology image at a level of 0.095, or 0.15. This simple perturbation will cause more or fewer features in the input digital histopathology image to be present, and so any subsequent classification or morphology algorithm will detect a greater or lesser number of cells, for example, leading to a change in the eventual pathology score.
- a complicated analysis pipeline might have 10 or 100 individual thresholds or decision probabilities capable of variation, leading to a highly-dimensioned possible perturbation space.
- One approach to providing the perturbations is the sensitivity analysis approach of varying one decision threshold or decision probabilities out of many over a given uncertainty range, and recording the effect on the pathology score. This process may be repeated for the other thresholds or decision abilities. Although this technique is simple, it does not analyse the full input space because it does not assess the simultaneous variation of thresholds.
- other more complicated sensitivity analysis techniques such as regression analysis or partial derivative analysis across the entire perturbation space could also be applied.
- automated morphological feature detection means an algorithm capable of identifying candidate objects in a digital pathology image such as cells, cell nuclei, cell membranes (whether complete or partial), and the like.
- Techniques such as morphological opening or morphological closing, may be used to perform automatic morphological feature detection.
- these algorithms have many input parameters defining their performance, and all or some of these input parameters may be perturbed as part of a sensitivity analysis.
- biomarker in the context of this application means an object or molecule detected in a pathology (histopathology, cytopathology) sample enabling the specific detection (isolation) of a particular expressed protein or other biological signal.
- the object or molecule may, for example, be detected by means of the binding of a fluoro-active protein to a biomarker target, or by the staining of a biomarker target with a stain targeting the biomarker.
- digital pathology image acquisition device means a specialised and automated digital optical analysis system capable of providing high-resolution and high-quality digital images of pathology slides, for example, histopathologically prepared slides or alternatively cytopathology samples.
- a digital pathology image acquisition device may be connected via a computer network to a PACS system, for example to enable further analysis of the images acquired on remote computers in a computer network.
- Immunohistochemical staining is widely used in the diagnosis of abnormal cells such as those found in cancerous tumours. Specific molecular markers are characteristic of particular cellular events such as proliferation or cell death (apoptosis).
- Visualising an antibody antigen interaction can be accomplished in a number of ways. In the most common instance, an antibody is conjugated to an enzyme, such as peroxidase, that can catalyse a colour-producing reaction (immunoperoxidase staining) alternatively, the antibody can also be tagged to a fluorophore such as fluorescein or rhodamine (immunofluorescence).
- FIG. 21 of the "Interpretation Manual for PD-L1 IHC 22C3 pharmDx is CE-IVD-Marked" there is shown an example of PD-L1 stained tissue.
- the brown colour indicates overexpression of the PD-L1 marker at the cell membrane.
- the arrows indicate local variation in the strength of expression of the marker.
- the blue cells are coloured using a counter stain.
- the scoring of immunohistochemical markers involves two steps. Firstly, the segmentation of cells or regions of interest is performed (for example, based on their appearance). Secondly, quantification of the stain colour intensity in the region of interest is performed. Typically, a distinction is made between two or more levels of intensity. As an example, in the case of "Her2" staining, four levels (0, 1+, 2+, and 3+) are distinguished based on an amount of the colour intensity at the membrane of tumour cells, and which area fraction of the membrane is stained. Similar principles are applied to nuclear staining protocols like ER and PR.
- a typical immunohistochemical assessment has a number of critical steps. For example, viable tumour cells may need to be distinguished from other cell types. Alternatively or in combination, cells expressing a certain biomarker need to be distinguished from cells not expressing a certain biomarker.
- These assessments may be performed digitally by analysing a digital pathology image using image processing algorithms. However, the image processing algorithms may have one or more decision thresholds.
- detection thresholds and/or detection probabilities applied in the digital imaging algorithms may be set according to benchmarking using expert judgement.
- a machine learning algorithm deep learning algorithm
- a corpus of example digital pathology images of a target condition where the annotation has been performed by an expert.
- the third aspect provides a method for digitally processing digital pathology image data to generate pathology score data, and a sensitivity analysis of the pathology score data comprising:
- step a) the initial image data required for generating pathology score data and an associated sensitivity analysis is acquired.
- the digital pathology image may be acquired from a digital light microscope, or a digital fluorescence microscope as part of a digital pathology system, for example.
- original digital pathology images stored in a PACS archive may be acquired from a PACS system via a computer network of a medical facility and transmitted to a PC terminal, a handheld computer, or another computer processing means, for example. Accordingly, the technique is applicable to archived digital pathology images as well as at the time of image acquisition.
- An unprocessed digital pathology image contains visual representations of many objects such as cell nuclei, partial cell nuclei, cell membranes, cancer cells, fibroblasts, immune cells, and the like. For a certain immunohistological protocol, it is likely that a subset of these objects will be stained and analysed. In the specific example of the "PD-L1 IHC 22C3" test referenced earlier, it is generally necessary to identify viable tumour cells in the digital pathology image.
- a pre-processing step may be provided comprising smoothing the original digital pathology image to suppress noise.
- the pixels of the original digital pathology image obtained in step a) are also subjected to colour characterization to remove pixels having a colour component less than 10% of the full-scale intensity, for example.
- colour characterization algorithm has configuration parameters that may be thresholded according to the present approach.
- a morphological closing algorithm is subsequently applied to the smoothed and colour-characterized digital pathology image to correct for bright spots in the chromatin pattern.
- step b) there is accordingly a process of classifying objects in the digital pathology image data into candidate objects (which will be required in subsequent analysis) and other objects which are not required in the subsequent analysis.
- candidate objects are viable tumour cells. Therefore, cytoplasmic staining artefacts, immune cells, normal cells, necrotic cells, and debris are excluded from the analysis.
- the classification process may be partially, or entirely performed according to a deep-learning approach.
- various types of deep-learning approaches that can be applied to the present technique are broadly defined as supervised learning, unsupervised learning, semi-supervised learning, and multiple instance learning.
- a deep learning algorithm comprises a cascade of layers taking the output of the previous layer as the input to a subsequent layer.
- the components in each layer are typically non-linear functions that perform the task of feature extraction, for example.
- Deep learning algorithms may comprise unsupervised and/or supervised learning stages.
- critical parameters are typically thresholds on probability (output of a soft-max layer) or thresholds on derived uncertainty/confidence measure(s) in the output of the network.
- the classification process may be partially, or entirely performed using a supervised learning algorithm.
- Supervised learning techniques infer a function representing a mapping between items in the digital input image data to their appropriate labels (such as "T-cell").
- Examples of a supervised learning algorithm are Convolutional Neural Networks (CNNs), or Support Vector Machines (SVM).
- the classification process may be partially, or entirely performed using an unsupervised learning algorithm.
- Unsupervised learning techniques infer a function describing hidden structures in unlabelled images. Examples of unsupervised learning approaches are principal component analysis and k-means analysis.
- the classification process may be partially, or entirely performed using a semi-supervised learning algorithm.
- the classification process may be partially, or entirely performed using a multiple instance learning algorithm.
- the technique to discover viable tumour cells and to assign them a status as candidate objects is to apply a morphological opening algorithm over the digital pathology image to remove small cells and fibroblasts. Then, a morphological closing algorithm is applied to expand neighbouring nuclei in the digital pathology image to form one object. Subsequently, a hole filling algorithm is applied in the tumour area to remove background areas. Finally, a further iteration of the morphological opening algorithm is applied to smooth the border of the tumour area, thus compensating for artefacts resulting from previous morphological algorithm operations.
- a wide range of image processing techniques can be used to perform the classification of objects in the digital pathology image data into candidate objects such as deep learning, segmentation, feature extraction, unsupervised learning, clustering, K-means, principal component analysis, or supervised learning approaches such as support vector machines or convolutional neural networks.
- the optional pre-processing step may threshold pixels of a digital pathology image at intensity value of 10%, but instead a value of 5% or 15% could be chosen.
- the thresholding value chosen may eventually be classified as candidate objects in step b) for example.
- the morphological algorithms and classification algorithms used for classifying objects in step b) also have a completed range of set of configuration parameters which affect the classification of the candidate objects.
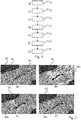
- Figure 2a illustrates a digital pathology image 20 in which a solid mask 22 has been used to indicate areas that belong to connective tissue or background areas which are therefore not viable tumour cells 24.
- a first pathological state (histopathological state, cytopathological state) is assigned to one or more candidate objects in the plurality of candidate objects according to one or more detection thresholds and/or detection probabilities.
- the assignment the first pathological state to a candidate object may be considered to be a small step in determining a subsequent diagnostic result.
- part of the "PD-L1 IHC 22C3" protocol is a requirement to count the number of viable tumour cells in a given area showing positive cell membrane staining for the PD-L1 biomarker.
- a candidate object is a viable tumour cell
- the assignment of a first pathological state is that the considered candid object is "positive for PD-L1 biomarker", or its equivalent digital representation.
- the candidate objects could be represented in data structure by a column vector, with a logic "zero" representing no PD-L1 biomarker expression and a logic "one" representing PD-L1 biomarker expression.
- the data structure can comprise a column vector representing the relative proportion of PD-L1 biomarker expression.
- an initial pathology score (or initial histopathlogy score, initial cytopathology score) on the pathology sample is generated.
- this step comprises calculating the "tumour proportion score” as the initial pathology score which is the percentage of viable tumour cells (candidate objects) showing partial or complete membrane staining relative to all viable tumour cells present in the sample (positive and negative).
- the skilled person will appreciate that for a different protocol, different types of cell may be identified as candidate objects, and a different calculation may be made to obtain the initial pathology score.
- the initial pathology score may be displayed to a user by a graphical user interface (GUI) one of the technique to be discussed subsequently in relation to output methods.
- GUI graphical user interface
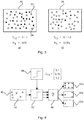
- Figure 3a schematically illustrates a digital pathology image 30 which steps a), b), and c) have been applied.
- the hollow circles 32 i represent non-viable tumour cells (relative to the specific example) and the filled circles 34 i illustrate viable tumour cells.
- I T2 0.15
- a perturbation is applied to a detection threshold and/or a detection probability according to a perturbation function.
- a perturbation function is thus a positive step function of 0.05.
- Figure 4 illustrates the generation of a simple perturbation function for one variable (initial pixel thresholding) of a digital pathology image analysis pipeline.
- a perturbation function generator 44 provides the column vector I T3 comprising three values of an image level threshold.
- An initial digital pathology image 40 comprising objects which may or may not be classified as candidate objects 42 is input, and the thresholding function 46 is applied three times to generate three intermediate images generated at the three different threshold levels generated by the perturbation function.
- the three intermediate images are input to an image classifier 48 to yield digital pathology output images 50a, 50b, and 50c comprising differing numbers of candidate objects dependent upon the level of the perturbation function applied to the initial threshold.
- the perturbation function generator 44 may generate the perturbation function in many different ways. The skilled person will appreciate that the output of the perturbation function would be scaled to a range of values appropriate to the stage in the analysis pipeline and the particular function to which the perturbation is applied.
- the perturbation function generator 44 is configured to select the detection threshold and/or the detection probability randomly from a probability distribution, such as a Gaussian distribution, a uniform distribution, a chi-squared distribution, or the like.
- the perturbation function generator 44 may be configured to select the detection threshold from a pre-provided range of values, an algebraic function, a random number generator operating within a predetermined scaling, a chaotic attractor function, or the like.
- a perturbation function may be based on historically obtained calibration and training data. For example, a population of pathologists could be used to classify test slides, and this would enable the derivation of realistic ranges of perturbation values from the variations observed in the results from the population of pathologists. The derived realistic ranges could then be provided as the perturbation function.
- step f) there is provided the step of reassigning the first pathological state to one or more candidate objects in the plurality of candidate objects, or to at least one candidate object in a perturbed plurality of candidate objects, according to the one or more perturbed detection thresholds and/or perturbed detection probabilities.
- the first pathological state may be used to detect a smaller or greater number of candidate objects in the plurality of candidate objects, dependent on the amplitude of the perturbation and the sensitivity of the analysis pipeline to that perturbation.
- parameters applied in the pre-processing and/or classification steps are perturbed, meaning that a perturbed plurality of candidate objects is generated.
- perturbation of algorithms applied in steps a) and b) may lead to some objects originally included in the plurality of candidate objects to be excluded from the perturbed plurality of candidate objects, and vice versa.
- algorithms used to assign a first pathological state to one or more viable tumour cells (candidate objects) may be sensitive to a variation in the detection thresholds and/or detection abilities as well.
- an updated pathology score of the pathology (histopathlogy, cytopathology) sample is provided based upon the changed number of candidate objects having been assigned the first pathological state. Because the updated pathology score has been calculated according to a perturbed section threshold and/or probability, it is likely that it will be slightly (or significantly) different to the initial pathology score. Accordingly, a comparison between the initial pathology score data and the updated pathology score data defines a sensitivity of pathology score data obtained using a particular analysis pipeline.
- the detection threshold and/or detection probability may be considered a detection condition.
- Figures 2b - 2d illustrate results of the specific example of the use of the PD-L1 biomarker (negative and positive expression) in determining the Tumour Proportion Score (TPS) present in digital pathology image slide 20.
- a grey shaded area indicated as 26b, 26c, and 26d respectively shows areas with overexpression of the PD-L1 biomarker for three different intensity thresholds.
- a pixel intensity threshold of 0.2 is applied, resulting in an overall TPS of 1%.
- a TPS of 1% is the boundary for a condition in which no PD-L1 expression occurs, representing a critical clinical decision boundary for treatment with certain compounds. Therefore, the sensitivity analysis and variable TPS scores represented by the illustrations of Figure 2 may automatically provide results that enable a medical professional to more accurately and confidently assess the sensitivity of a digital pathology score in a clinical context.
- the one or more detection thresholds are associated with testing the sensitivity of a "PD-L1" pathology score.
- the "CD3" test is often used as a marker of T-cells to classify lymphomas.
- digital pathology image data of a sample according to the CD3 protocol After obtaining digital pathology image data of a sample according to the CD3 protocol, using, for example, a digital light microscope to capture the stained sections, package, digital pathology image data of the sample at different magnifications is obtained (4x, 10x, 20x, 40x) either using a software imaging package, or a plurality of digital pathology images at different magnifications may be captured by the digital light microscope itself. Then, the image is segmented into different tissue areas of interest which contain tumour cells, the objects of interest, by one or more critical detection thresholds (parameters). Following this segmentation procedure, a differentiation may be made between different amounts of staining (expression levels) in the tumour tissue, comprising tumour cells, the objects of interest.
- critical detection thresholds critical detection thresholds
- tumour heterogeneity This difference between different areas of the same tumour is known as tumour heterogeneity.
- a specific expression pattern or first pathological state is assigned to certain areas of the tumour tissue, while another expression pattern and second pathological state can be assigned to another area of the tumour tissue and even another expression pattern and at least pathological state can be assigned to another area.
- CD3 staining accounts for i) intra-tumoural lymphocytes which are lymphocytes located in the stroma of the tumour mass or inside the tumour cell nests and ii) peri-tumoral lymphocytes which are lymphocytes surrounding the tumour mass.
- a distribution and density score is applied for the lymphocytes. Scores ranged from 0 to 6.
- This acquired data can be used for sensitivity analysis, the parameters of the algorithm used to segment and/or identify lymphocytes being one detection threshold (parameter) that is suitable for perturbation according to the algorithm described.
- the defined detection threshold can be adjusted manually, too. This definition aids the pathologist during the evaluation of the tissue to prove whether the evaluation of the tissue is reasonable and within an objectively-defined range.
- the one or more detection thresholds are associated with testing the sensitivity of a "CD3" pathology score.
- the "CD8" protocol can be used to identify effector T-cells in the tumour tissue.
- digital pathology image data of a sample according to the CD8 protocol After obtaining digital pathology image data of a sample according to the CD8 protocol, using, for example, a digital light microscope to capture the stained sections, package, digital pathology image data of the sample at different magnifications is obtained (4x, 10x, 20x, 40x) either using a software imaging package, or a plurality of digital pathology images at different magnifications may be captured by the digital light microscope itself.
- the image is digitally segmented into different tissue areas of interest which contain tumour cells, the objects of interest, by one or more critical threshold parameters.
- a digital differentiation is made between different concentrations of stain (expression levels) in the tumour tissue, comprising tumour cells, the objects of interest.
- This difference between different areas of the same tumour is known as tumour heterogeneity.
- a specific expression pattern or first pathological state is assigned to certain areas of the tumour tissue, while another expression pattern and second pathological state can be assigned to another area of the tumour tissue and even another expression pattern and at least pathological state can be assigned to another area.
- CD8 staining accounts for i) intratumoural lymphocytes which are lymphocytes located in the stroma of the tumour mass or inside the tumour cell nests and ii) peritumoural lymphocytes which lymphocytes surround a tumour mass.
- a factor that affects the lymphocyte distribution and density scores is how precisely stromal areas are segmented, for example, and/or the detection thresholds for CD8 positive calling, and/or the thresholds for nucleus detection. Scores range from 0 to 6.
- This acquired data can be used for sensitivity analysis according to the algorithm described in this application, with the criterion for the assignment of the first and second pathological states being an example of one threshold (parameter) suitable for perturbation.
- one threshold value is defined.
- the defined detection threshold can be adjusted manually, too. This definition aids the pathologist during the evaluation of the tissue to prove whether the evaluation of the tissue is reasonable and within an objectively-defined range.
- the one or more detection thresholds are associated with testing the sensitivity of a "CD8" pathology score.
- the "ER" protocol (Oestrogen Receptor) is often used in association with mammography screening programmes.
- digital pathology image data of a sample according to the ER protocol using, for example, a digital light microscope to capture the stained sections, package
- digital pathology image data of the sample at different magnifications is obtained (4x, 10x, 20x, 40x) either using a software imaging package, or a plurality of digital pathology images at different magnifications may be captured by the digital light microscope itself.
- tumour heterogeneity This difference between different areas of the same tumour is known as tumour heterogeneity.
- a specific expression pattern or first pathological state is assigned to certain areas of the tumour tissue, while another expression pattern and second pathological state can be assigned to another area of the tumour tissue and even another expression pattern and at least pathological state can be assigned to another area.
- a total score is the sum of the proportion score (PS) and the intensity score (IS), ranging from 0; 2-8.
- a positive result for both ER and PR is defined as TS ⁇ 3.
- This acquired data can be used for sensitivity analysis, the proportion score being an example of one threshold (parameter) suitable for perturbation according to the algorithm described herein and the intensity score being an example of another threshold (parameter) suitable for perturbation.
- one threshold value is defined.
- the defined detection threshold can be adjusted manually, too. This definition aids the pathologist during the evaluation of the tissue to prove whether the evaluation of the tissue is reasonable and within an objectively-defined range.
- the one or more detection thresholds are associated with testing the sensitivity of a "ER" pathology score.
- digital pathology image data of a sample according to the PR protocol After obtaining digital pathology image data of a sample according to the PR protocol, using, for example, a digital light microscope to capture the stained sections, package, digital pathology image data of the sample at different magnifications is obtained (4x, 10x, 20x, 40x) either using a software imaging package, or a plurality of digital pathology images at different magnifications may be captured by the digital light microscope itself.
- tumour heterogeneity a specific expression pattern or first pathological state is assigned to certain areas of the tumour tissue, while another expression pattern and second pathological state can be assigned to another area of the tumour tissue and even another expression pattern and at least pathological state can be assigned to another area.
- a total score is the sum of the proportion score (PS) and the intensity score (IS), ranging from 0; 2-8.
- a positive result for both ER and PR is defined as TS ⁇ 3.
- the proportion score is one threshold (parameter) suitable for perturbation and the intensity score is an example of another parameter suitable for perturbation.
- one threshold value is defined.
- the defined detection threshold can be adjusted manually, too. This definition aids the pathologist during the evaluation of the tissue to prove whether the evaluation of the tissue is reasonable and within an objectively-defined range.
- the one or more detection thresholds are associated with testing the sensitivity of a "PR" pathology score.
- the "HER2" protocol (Herceptin) is used to detect the presence of abnormal levels of Herceptin in mammary tissue, a predictive biomarker for breast cancer.
- digital pathology image data of a sample according to the HER2 protocol After obtaining digital pathology image data of a sample according to the HER2 protocol, using, for example, a digital light microscope to capture the stained sections, package, digital pathology image data of the sample at different magnifications is obtained (4x, 10x, 20x, 40x) either using a software imaging package, or a plurality of digital pathology images at different magnifications may be captured by the digital light microscope itself.
- the image is segmented into different tissue areas of interest which contain tumour cells, the objects of interest, by one or more critical threshold parameters. Following this segmentation procedure, it is differentiated between different expression levels in the tumour tissue, comprising tumour cells, the objects of interest. This difference between different areas of the same tumour is known as tumour heterogeneity.
- tumour heterogeneity This difference between different areas of the same tumour is known as tumour heterogeneity.
- a specific expression pattern or first pathological state is assigned to certain areas of the tumour tissue, while another expression pattern and second pathological state can be assigned to another area of the tumour tissue and even another expression pattern and at least pathological state can be assigned to another area.
- HER2-negative tumours harbour membranous HER2 expression ⁇ 10% of the tumour cells.
- a score of +1 corresponds to membranous HER2 expression in >10% of tumour cells, while a score of +2 corresponds to tumour cells with a weak to moderate HER2 expression in the membrane of >10% of tumour cells.
- a strong complete membrane staining in >10% of tumour cells corresponds to a score of +3.
- one threshold value is defined.
- the defined detection threshold can be adjusted manually, too. This definition aids the pathologist during the evaluation of the tissue to prove whether the evaluation of the tissue is reasonable and within an objectively-defined range.
- the one or more detection thresholds are associated with testing the sensitivity of a "HER2" pathology score.
- EGFR epidermal growth factor receptor
- digital pathology image data of a sample according to the EGFR protocol After obtaining digital pathology image data of a sample according to the EGFR protocol, using, for example, a digital light microscope to capture the stained sections, package, digital pathology image data of the sample at different magnifications is obtained (4x, 10x, 20x, 40x) either using a software imaging package, or a plurality of digital pathology images at different magnifications may be captured by the digital light microscope itself.
- the image is segmented into different tissue areas of interest which contain tumour cells, the objects of interest, by one or more critical threshold parameters. Following this segmentation procedure, it is differentiated between different expression levels in the tumour tissue, comprising tumour cells, the objects of interest. This difference between different areas of the same tumour is known as tumour heterogeneity.
- tumour heterogeneity This difference between different areas of the same tumour is known as tumour heterogeneity.
- a specific expression pattern or first pathological state is assigned to certain areas of the tumour tissue, while another expression pattern and second pathological state can be assigned to another area of the tumour tissue and even another expression pattern and at least pathological state can be assigned to another area.
- EGFR expression of preferably colorectal tumours is evaluated as the following: EGFR-negative tumours do not possess membranous staining above background in all tumour cells. Contrarily, EGFR-positive staining and therefore, expression is defined as any IHC staining of tumour cell membranes above background level; whether it is complete or incomplete circumferential staining.
- the staining intensity and hence, expression is a score of +1, +2 or +3, where more than 0% of tumour cells are stained and therefore, positive for EGFR.
- This acquired data can be used for sensitivity analysis according to the algorithm described in this application, the intensity score being the threshold (parameter) for perturbation. By comparing the different areas of the tumour, therefore obtaining different threshold values, one threshold value is defined. Moreover, the defined detection threshold can be adjusted manually, too. This definition aids the pathologist during the evaluation of the tissue to prove whether the evaluation of the tissue is reasonable and within an objectively-defined range.
- the one or more detection thresholds are associated with testing the sensitivity of a "EGFR" pathology score.
- the "Ki67” protocol detects the Ki7 antigen. After following the standard procedure to obtain digital pathology of a sample prepared according to the "Ki67" protocol.
- digital pathology image data of a sample according to the Ki67 protocol After obtaining digital pathology image data of a sample according to the Ki67 protocol, using, for example, a digital light microscope to capture the stained sections, package, digital pathology image data of the sample at different magnifications is obtained (4x, 10x, 20x, 40x) either using a software imaging package, or a plurality of digital pathology images at different magnifications may be captured by the digital light microscope itself.
- the image is segmented into different tissue areas of interest which contain tumour cells, the objects of interest, by one or more critical threshold parameters. Following this segmentation procedure, it is differentiated between different expression levels in the tumour tissue, comprising tumour cells, the objects of interest. This difference between different areas of the same tumour is known as tumour heterogeneity.
- tumour heterogeneity This difference between different areas of the same tumour is known as tumour heterogeneity.
- a specific expression pattern or first pathological state is assigned to certain areas of the tumour tissue, while another expression pattern and second pathological state can be assigned to another area of the tumour tissue and even another expression pattern and at least pathological state can be assigned to another area.
- Ki67 score There are different approaches to obtain the Ki67 score.
- One method involves selecting five different areas of the tumour, where 100 tumour cells in every area are evaluated. The percentage of positive Ki67 cells (stained nuclei) out of 100 cells is taken into account and the results of the five areas are summed up.
- This acquired data can be used for sensitivity analysis, the spatial information, i.e. nuclear staining being the threshold (parameter) undergoing perturbation.
- the threshold parameter
- the defined detection threshold can be adjusted manually, too. This definition aids the pathologist during the evaluation of the tissue to prove whether the evaluation of the tissue is reasonable and within an objectively-defined range.
- the one or more detection thresholds are associated with testing the sensitivity of a "Ki67" pathology score.
- the one or more detection thresholds and/or detection probabilities represent a variation in automatic morphological feature detection when determining the presence of a candidate object in the digital pathology image data.
- the one or more detection thresholds represent a probability of automatic classification of the objects in the digital pathology image data into the plurality of candidate objects.
- the detection threshold and/or the detection probability characterise an intensity level and/or a wavelength range of light emitted from a pathology sample and represented in the digital pathology image data.
- the intensity level and/or the wavelength range emitted from the pathology sample and represented in the digital pathology image data indicate a relative level of the expression of a biomarker.
- the method further comprises:
- the method further comprises: d1) obtaining the initial pathology score data and/or the updated pathology score data by counting the number of candidate objects in a field of interest of the digital pathology data having been assigned the first pathological state before and/or after perturbation, or by calculating a percentage score of the number of candidate objects in a field of interest of the digital pathology data having been assigned the first pathological state before and/or after perturbation.
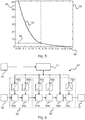
- Figure 5 illustrates a plot 52 showing a specific example of a sensitivity function 54 of the Tumour Proportion Score (TPS) obtained using the "PD-L1 IHC 22C3".
- the X-axis represents the threshold value for the assessment of the presence of the PD-L1 stain.
- the X-axis 58 represents a range of potential perturbation values.
- the Y-axis 60 represents the percentage value of the TPS.
- an optimum value of the pathology score data in this case the dotted line 56 representing an X-axis TPS intercept at 5%
- a threshold value of PD-L1 intensity at 0.15 provides a updated pathology score close to this clinical threshold.
- multi-biomarker imaging may be supported by this technique.
- a second pathological state may be assigned to at least one candidate object showing positive expression of a second biomarker of interest.
- a third pathological state may be assigned to at least one candidate showing positive expression of a third biomarker of interest.
- the first, second, and third biomarkers are immunofluorescence biomarkers.
- An immunohistochemistry example of more complicated analysis pipeline relating to the derivation of the TPS (tumour proportion score) in PD-L1 stained tissue comprises optional steps of:
- a deep-learning or machine-learning approach may optionally be applied.
- colour deconvolution may be performed to separate the absorption of haematoxylin from the absorption of the DAB marker using a method as discussed in the paper " A Method for Normalizing Histology Slides for Quantitative Analysis” by Macenko , et al.” referenced in the "Background” section above.
- the location of nuclei in the deconvolved image is obtained by the following steps:
- the nominator of the TPS is obtained after thresholding the DAB (PD-L1) stain absorption data.
- DAB absorption (within the area with viable tumour cells) above a certain threshold value indicates the area with overexpression, in other words, the PD-L1 tumour cells.
- these images are sensitive to the perturbations in threshold parameters in the analysis pipeline.
- Figure 5 illustrates the TPS as a function (y-axis) of perturbation of the detection threshold on DAB absorption (x-axis).
- the "optimal threshold" for assessment of the PD-L1 stain in the case of Fig 5 is indicated by the vertical dashed line.
- a detection threshold value 0.05 lower would have included more tumour cells, resulting in a significantly higher estimate of the TPS.
- a detection threshold 0.05 higher would have included many fewer tumour cells causing the TPS to drop to the critical clinical decision level of 1%.
- Figure 6 illustrates an example of a complicated analysis pipeline 61 for implementation of the specific example given above.
- a digital pathology image data input unit 62 receives and pre-processes digital pathology image data.
- a user provides perturbation configuration data 63 (for example, via a input graphical user interface on a digital pathology system and/or image analysis software).
- the analysis pipeline in this particular example is divided into a nuclei location determiner 63 and a tumour cell identifier 64.
- a preparation unit 64a smooths haematoxylin stain data (to suppress noise) and thresholds at a given absorption level.
- a first morphological closing unit 66a corrects for bright spots in the chromatin pattern.
- a morphological opening unit 67a is configured to remove images of small cells and fibroblasts in the digital pathology image.
- a morphological closing unit 68a is configured to grow neighbouring nuclei together to form one object.
- a hole filling unit 69a is configured to apply hole filling to the tumour area and remove background areas recognised by the low absorption value.
- a morphological opening unit 70a is applied to smoothen the border of the tumour area to thus compensate artefacts resulting from previous morphological operations.
- each processing sub-unit 65a to 70a is connected to a respective perturbation determination units 65b to 70b.
- perturbation unit 70b selects perturbation values of a morphological closing algorithm based on a Gaussian distribution. The rest of the perturbation units provide perturbation values based on a step function.
- Perturbation control unit 71 receives the perturbation configuration data 63 input by the user and determines a perturbation specification likely to give sufficient coverage over the total search space of perturbation options. Having determined the perturbation specification, perturbation settings for each of the perturbation units are calculated and transmitted to the perturbation units 65b to 70b.
- steps of an analysis pipeline need be characterized by adjustable detection thresholds and/or probabilities, and one or more settings of the analysis pipeline may be "hard-coded" or fixed, without being subject to perturbation.
- the perturbation control unit 71 may, for reasons of computational simplicity, operate a "one at a time" sensitivity analysis protocol in which one or more of the perturbation units 65b to 70b is adjusted at a time, with the other perturbation units being held at a constant perturbation value.
- the perturbation control unit 71 may apply a "random sampling" sensitivity analysis protocol in which one or more of the perturbation units 65b to 70b are addressed with randomly generated perturbation values (optionally within fixed boundary ranges).
- a large sample space of perturbation values may be sampled in a computationally efficient way, and also cross-correlations between perturbation settings of the perturbation units 65b to 70b may be assessed in a way that is not possible with a "one at a time" sensitivity analysis protocol.
- the perturbation control unit 71 may apply a "brute force" sensitivity analysis protocol in which one or more of the perturbation units 65b to 70b are addressed all combinations of their respective perturbation thresholds.
- This has the advantage that the sensitivity analysis is exhaustive, although may occupy so much computational time that the technique can only be applied with a powerful computer, or a simple analysis pipeline.
- the perturbation control unit 71 may apply a "gradient descent” algorithm, or another optimisation algorithm, to compute an optimal sensitivity.
- Result collection unit 72 obtains and saves the pathology scores generated by the application of various combinations of perturbation setting to the analysis pipeline for the same input digital pathology image.
- the tumour proportion score may be calculated as the number of PD-L1 positive tumour cells present in a plurality of candidate objects divided by the total number of PD-L1 positive and PD-L1 negative tumour cells present in a plurality of candidate objects (viable tumour cells).
- the tumour proportion score may be used to differentiate between the three levels of no PD-L1 expression (partial or complete cell membrane staining in less than 1% of viable tumour cells), PD-L1 expression (partial or complete cell membrane staining in between 1 and 49% of viable tumour cells), and high PD-L1 expression (partial or complete cell membrane staining in greater than or equal to 50% of viable tumour cells).
- a perturbation of detection thresholds and/or detection abilities used in the analysis pipeline can provide a medical professional with warning that a pathology protocol is so sensitive that it could affect the overall treatment indication.
- the method further comprises: h1) outputting the sensitivity of the pathology score data to a user, optionally in combination with the initial and/or updated pathology score data and/or outputting the sensitivity of the pathology score relative to a clinical threshold.
- the sensitivity of the pathology score data may be displayed on a graphical user interface (GUI) of a digital pathology system, or digital pathology software used on a personal computer (PC) or other digital display device.
- GUI graphical user interface
- the pathology score data may be reported to a user as a numerical string, or as a colour map or heat map, for example. This provides the user of a digital pathology system and/or analysis software with immediate and intuitive feedback about the sensitivity of a given result in context with the original digital pathology slide image.
- the method further comprises:
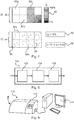
- Figure 7a illustrates a possible display format in which the digital pathology image data 80 has been divided into a plurality of sub-sectors 80a, 80b, 80c....
- an initial pathology score an updated pathology score
- an overall sensitivity for each sub-sector has been calculated.
- a display legend 82 provides a guide to interpretation of the GUI. Saturated sub-sectors represent a low sensitivity to perturbation in the analysis pipeline, and non-saturated sub-sectors represent a high-sensitivity to perturbation in the analysis pipeline.
- Figure 7b illustrates another possible display format in which the digital pathology image data 84 has been divided into sub-sectors 84a, 84b, ....
- an initial pathology score, an updated pathology score, and an overall sensitivity for each sub-sector has been calculated.
- a user may move a mouse cursor 86 around the displayed digital pathology image data 84.
- An optional dialogue box 88 reports the current spatial position of the cursor in relation to the origin 90 of the displayed digital pathology image data 84.
- a sensitivity feedback dialogue box displays the calculated sensitivity of the pathology score at the location of the mouse cursor.
- a message may be provided to a user in an output step that indicates the sensitivity of the analysis.
- a calculation of the relative thresholds change necessary for relative change in score may be provided.
- the required threshold change that would result in a different diagnostic result may be provided.
- the pathology sample is a histopathology sample or a cytopathology sample.
- Figure 8 illustrates an apparatus 100 according to the first aspect.
- the apparatus 100 comprises:
- the input unit 102 is configured to obtain digital pathology image data comprising an image of a pathology sample.
- the processing unit 104 is configured to classify objects in the digital pathology image data into a plurality of candidate objects, to assign a first pathological state to at least one candidate object in the plurality of candidate objects according to one or more detection thresholds and/or detection probabilities, to obtain initial pathology score data of the pathology sample based on the candidate objects in the plurality of candidate objects having been assigned the first pathological state, to perturb the one or more detection thresholds and/or the detection probabilities according to a perturbation function to generate a perturbed detection threshold and/or a perturbed detection probability, to reassign the first pathological state to at least one candidate object in the plurality of candidate objects, or to at least one candidate object in a perturbed plurality of candidate objects, according to the one or more perturbed detection thresholds and/or perturbed detection probabilities, to obtain updated pathology score data of the pathology sample based on the candidate objects having been reassigned the first pathological state according to the one or more perturbed detection thresholds and/or the perturbed detection
- the apparatus may further comprise an output unit 106.
- the input unit 102 may comprise a data communications modem capable of transferring digital pathology image data, for example a USB (TM) connection, a FireWire (TM) connection, a DICOM connection, and the like.
- Input unit 102 may comprise a hard disk drive and/or a removable hard disk drive, a USB drive, a DVD drive, or another means of transferring stored data. Data may be received over a secure communication network such as a LAN or WAN, or a secure wireless means.
- the processing unit 102 may be practically implemented as any data processor capable of processing image data.
- the apparatus 100 can be implemented on a personal computer, a smart phone processor, an embedded processor, a digital signal processor (DSP) or a processing unit instantiated on a field programmable gate array (FPGA).
- DSP digital signal processor
- FPGA field programmable gate array
- part or all of the functions performed by the processing unit 100 may be performed using the acceleration capabilities available using a graphical processing unit GPU.
- the output unit 106 may be provided with a similar range of modalities as discussed in respect of the input unit 102 in the case that the data output is raw data to be interpreted by another component.
- the output unit 16 may also comprise a graphics interface to display the results of a sensitivity analysis on a graphical user interface (GUI).
- GUI graphical user interface
- Figure 9 illustrates a digital pathology system 110.
- the digital pathology system 110 comprises:
- a computer program element may be stored on a computer unit, which might also be an embodiment of the present invention.
- This computing unit may be adapted to perform or induce performance of the steps of the method described above. Moreover, it may be adapted to operate the components of the above-described apparatus.
- the computing unit can be adapted to operate automatically and/or to execute orders of a user.
- a computer program may be loaded into a working memory of a data processor. The data processor may thus be equipped to carry out the method of the invention.
- This exemplary embodiment of the invention covers both the computer program that has the intervention installed from the beginning, and a computer program that by means of an update turns an existing program into a program that uses the invention.
- the slide image data could be uploaded to a "PACS" system or local hospital server over a Local Area Network.
- the slide images could be saved on physical media such as a Digital Versatile Disk (DVD), a tape drive, or a USB stick and physically sent to a location hosting the server, where the physical media could be loaded onto the server.
- DVD Digital Versatile Disk
- the slide images could be saved on physical media such as a Digital Versatile Disk (DVD), a tape drive, or a USB stick and physically sent to a location hosting the server, where the physical media could be loaded onto the server.
- the slide image data are processed according to the second aspect, or its optional embodiments.
- the multi-view data of the field of view of the biological sample is then transmitted to a client device for use, for example by a graphical user interface capable of interpreting the multi-view data.
- the multi-view data is interpreted into a display format (such as .JPG, .GIF, or another imaging format) on the server, and the GUI display of the multi-view data is transmitted to the client (an example of a "web-based application").
- a computer program may be stored and/or distributed on a suitable medium, such as optical storage media, or a solid state medium supplied together with, or as a part of other hardware, but may also be distributed in other forms, such as via the Internet or other wired or wireless telecommunication systems.
- the computer program may also be presented over a network like the World Wide Web, and can also be downloaded into the working memory of a data processor from such a network. The image processing method according to the second aspect would then be performed on the
- a medium for making a computer program element available for downloading is provided, which computer program element is arranged to perform a method according to one of the previously described embodiments of the invention.
Landscapes
- Health & Medical Sciences (AREA)
- Engineering & Computer Science (AREA)
- General Health & Medical Sciences (AREA)
- Physics & Mathematics (AREA)
- Nuclear Medicine, Radiotherapy & Molecular Imaging (AREA)
- Medical Informatics (AREA)
- Life Sciences & Earth Sciences (AREA)
- General Physics & Mathematics (AREA)
- Epidemiology (AREA)
- Radiology & Medical Imaging (AREA)
- Public Health (AREA)
- Primary Health Care (AREA)
- Biochemistry (AREA)
- Pathology (AREA)
- Immunology (AREA)
- Analytical Chemistry (AREA)
- Chemical & Material Sciences (AREA)
- Spectroscopy & Molecular Physics (AREA)
- Molecular Biology (AREA)
- Biomedical Technology (AREA)
- Quality & Reliability (AREA)
- Computer Vision & Pattern Recognition (AREA)
- Theoretical Computer Science (AREA)
- Investigating Or Analysing Biological Materials (AREA)
- Image Analysis (AREA)
- Medical Treatment And Welfare Office Work (AREA)
Priority Applications (6)
| Application Number | Priority Date | Filing Date | Title |
|---|---|---|---|
| EP18175126.4A EP3576096A1 (de) | 2018-05-30 | 2018-05-30 | Empfindlichkeitsanalyse für digitale pathologie |
| JP2020566284A JP7431753B2 (ja) | 2018-05-30 | 2019-05-29 | デジタルパソロジーのための感度分析 |
| PCT/EP2019/063972 WO2019229126A1 (en) | 2018-05-30 | 2019-05-29 | Sensitivity analysis for digital pathology |
| US17/057,787 US12229948B2 (en) | 2018-05-30 | 2019-05-29 | Sensitivity analysis for digital pathology |
| EP19726440.1A EP3803892A1 (de) | 2018-05-30 | 2019-05-29 | Empfindlichkeitsanalyse für digitale pathologie |
| CN201980036575.XA CN112236827B (zh) | 2018-05-30 | 2019-05-29 | 用于数字病理学的灵敏度分析 |
Applications Claiming Priority (1)
| Application Number | Priority Date | Filing Date | Title |
|---|---|---|---|
| EP18175126.4A EP3576096A1 (de) | 2018-05-30 | 2018-05-30 | Empfindlichkeitsanalyse für digitale pathologie |
Publications (1)
| Publication Number | Publication Date |
|---|---|
| EP3576096A1 true EP3576096A1 (de) | 2019-12-04 |
Family
ID=62492480
Family Applications (2)
| Application Number | Title | Priority Date | Filing Date |
|---|---|---|---|
| EP18175126.4A Withdrawn EP3576096A1 (de) | 2018-05-30 | 2018-05-30 | Empfindlichkeitsanalyse für digitale pathologie |
| EP19726440.1A Pending EP3803892A1 (de) | 2018-05-30 | 2019-05-29 | Empfindlichkeitsanalyse für digitale pathologie |
Family Applications After (1)
| Application Number | Title | Priority Date | Filing Date |
|---|---|---|---|
| EP19726440.1A Pending EP3803892A1 (de) | 2018-05-30 | 2019-05-29 | Empfindlichkeitsanalyse für digitale pathologie |
Country Status (5)
| Country | Link |
|---|---|
| US (1) | US12229948B2 (de) |
| EP (2) | EP3576096A1 (de) |
| JP (1) | JP7431753B2 (de) |
| CN (1) | CN112236827B (de) |
| WO (1) | WO2019229126A1 (de) |
Cited By (1)
| Publication number | Priority date | Publication date | Assignee | Title |
|---|---|---|---|---|
| EP4341964A1 (de) | 2021-05-18 | 2024-03-27 | Pathai, Inc. | Systeme und verfahren für diagnostische beurteilungen eines maschinenlernmodells auf basis digitaler pathologiedaten |
Families Citing this family (2)
| Publication number | Priority date | Publication date | Assignee | Title |
|---|---|---|---|---|
| AU2021275995B2 (en) * | 2020-05-22 | 2026-02-12 | Insitro, Inc. | Predicting disease outcomes using machine learned models |
| EP4205143B1 (de) | 2021-09-16 | 2025-11-05 | Owkin, Inc. | Systeme und verfahren zur bestimmung der brustkrebsprognose und zugehörige merkmale |
Citations (2)
| Publication number | Priority date | Publication date | Assignee | Title |
|---|---|---|---|---|
| US20130030305A1 (en) * | 2010-03-31 | 2013-01-31 | Hanry Yu | Method and system for determining a stage of fibrosis in a liver |
| WO2016138041A2 (en) * | 2015-02-23 | 2016-09-01 | Cellanyx Diagnostics, Llc | Cell imaging and analysis to differentiate clinically relevant sub-populations of cells |
Family Cites Families (15)
| Publication number | Priority date | Publication date | Assignee | Title |
|---|---|---|---|---|
| WO1997029447A2 (en) | 1996-02-09 | 1997-08-14 | Adeza Biomedical Corporation | Method for selecting medical and biochemical diagnostic tests using neural network-related applications |
| US5792660A (en) | 1996-10-02 | 1998-08-11 | University Of Medicine And Dentistry Of New Jersey | Comparative determinants of viscosity in body fluids obtained with probes providing increased sensitivity |
| NZ545911A (en) | 2003-09-11 | 2008-12-24 | Entelos Inc | Apparatus and method for identifying therapeutic targets using a computer model |
| US20070270707A1 (en) | 2006-05-18 | 2007-11-22 | Andres Belalcazar | Monitoring fluid in a subject using a weight scale |
| CN101489480A (zh) | 2006-06-29 | 2009-07-22 | 费米斯肯澳大利亚私人有限公司 | 改进方法 |
| JP2011501982A (ja) | 2007-09-12 | 2011-01-20 | ノベル バイオケア サーヴィシィズ アーゲー | 医療処置を計画し前記医療処置に関連するデータを生成するための方法およびシステム |
| EP2720192B1 (de) | 2012-10-12 | 2015-04-08 | General Electric Company | Verfahren, System und computerlesbares Medium zur Leberdiagnose |
| CN105359161A (zh) * | 2013-04-13 | 2016-02-24 | 宾夕法尼亚大学托管会 | 用于医学图像分析和概率诊断的系统和方法 |
| US9224098B2 (en) | 2014-01-10 | 2015-12-29 | Optibrium Ltd. | Sensitivity analysis tool for multi-parameter selection |
| CN103841411B (zh) | 2014-02-26 | 2015-10-28 | 宁波大学 | 一种基于双目信息处理的立体图像质量评价方法 |
| JP6893877B2 (ja) | 2014-10-29 | 2021-06-23 | スペクトラル エムディー, インコーポレイテッドSpectral Md, Inc. | 組織を分類するための反射モードマルチスペクトル時間分解型光学イメージングの方法および装置 |
| US9754383B1 (en) | 2014-12-22 | 2017-09-05 | Flagship Biosciences, Inc. | Automated methods for assessment of celiac disease |
| CN107850586B (zh) | 2015-07-15 | 2019-11-12 | 国立大学法人大阪大学 | 图像解析装置、图像解析方法、图像解析系统、以及存储介质 |
| WO2017053739A1 (en) * | 2015-09-25 | 2017-03-30 | Steen Judith | Methods and compositions for tauopathy diagnosis and treatment |
| CN105550651B (zh) | 2015-12-14 | 2019-12-24 | 中国科学院深圳先进技术研究院 | 一种数字病理切片全景图像自动分析方法及系统 |
-
2018
- 2018-05-30 EP EP18175126.4A patent/EP3576096A1/de not_active Withdrawn
-
2019
- 2019-05-29 WO PCT/EP2019/063972 patent/WO2019229126A1/en not_active Ceased
- 2019-05-29 JP JP2020566284A patent/JP7431753B2/ja active Active
- 2019-05-29 EP EP19726440.1A patent/EP3803892A1/de active Pending
- 2019-05-29 US US17/057,787 patent/US12229948B2/en active Active
- 2019-05-29 CN CN201980036575.XA patent/CN112236827B/zh active Active
Patent Citations (2)
| Publication number | Priority date | Publication date | Assignee | Title |
|---|---|---|---|---|
| US20130030305A1 (en) * | 2010-03-31 | 2013-01-31 | Hanry Yu | Method and system for determining a stage of fibrosis in a liver |
| WO2016138041A2 (en) * | 2015-02-23 | 2016-09-01 | Cellanyx Diagnostics, Llc | Cell imaging and analysis to differentiate clinically relevant sub-populations of cells |
Non-Patent Citations (5)
| Title |
|---|
| ANONYMOUS: "Otsu's method - Wikipedia", 12 January 2017 (2017-01-12), XP055468978, Retrieved from the Internet <URL:https://en.wikipedia.org/w/index.php?title=Otsu's_method&oldid=759649503> [retrieved on 20180420] * |
| ANONYMOUS: "Sensitivity (control systems) - Wikipedia", WIKIPEDIA, 23 May 2018 (2018-05-23), XP055526790, Retrieved from the Internet <URL:https://en.wikipedia.org/w/index.php?title=Sensitivity_(control_systems)&oldid=842648446> [retrieved on 20181126] * |
| ANONYMOUS: "Thresholding (image processing) - Wikipedia", WIKIPEDIA, 8 May 2018 (2018-05-08), XP055526471, Retrieved from the Internet <URL:https://en.wikipedia.org/w/index.php?title=Thresholding_(image_processing)&oldid=840213467> [retrieved on 20181123] * |
| HIRSCH: "PD-L1 Immunohistochemistry Assays for Lung Cancer: Results from Phase 1 of the Blueprint PD-L1 IHC Assay Comparison Project", JOURNAL OF THORACIC ONCOLOGY, vol. 12, no. 2, pages 208 - 222 |
| MACENKO ET AL.: "proceedings of ISBI", 2009, IEEE, article "A Method for Normalizing Histology Slides for Quantitative Analysis", pages: 1107 - 1110 |
Cited By (2)
| Publication number | Priority date | Publication date | Assignee | Title |
|---|---|---|---|---|
| EP4341964A1 (de) | 2021-05-18 | 2024-03-27 | Pathai, Inc. | Systeme und verfahren für diagnostische beurteilungen eines maschinenlernmodells auf basis digitaler pathologiedaten |
| EP4341964A4 (de) * | 2021-05-18 | 2025-04-16 | Pathai, Inc. | Systeme und verfahren für diagnostische beurteilungen eines maschinenlernmodells auf basis digitaler pathologiedaten |
Also Published As
| Publication number | Publication date |
|---|---|
| JP7431753B2 (ja) | 2024-02-15 |
| WO2019229126A1 (en) | 2019-12-05 |
| US12229948B2 (en) | 2025-02-18 |
| US20210366107A1 (en) | 2021-11-25 |
| EP3803892A1 (de) | 2021-04-14 |
| JP2021525913A (ja) | 2021-09-27 |
| CN112236827B (zh) | 2025-02-11 |
| CN112236827A (zh) | 2021-01-15 |
Similar Documents
| Publication | Publication Date | Title |
|---|---|---|
| US12530912B2 (en) | Image analysis method, apparatus, program, and learned deep learning algorithm | |
| US12094105B2 (en) | System and method for automatic labeling of pathology images | |
| Hekler et al. | Pathologist-level classification of histopathological melanoma images with deep neural networks | |
| CN109791693B (zh) | 用于提供可视化全切片图像分析的数字病理学系统及相关工作流程 | |
| US10489904B2 (en) | Assessing risk of breast cancer recurrence | |
| CA2966555C (en) | Systems and methods for co-expression analysis in immunoscore computation | |
| JP6604960B2 (ja) | バイオマーカー陽性の腫瘍細胞を識別するための医用画像解析 | |
| US9355445B2 (en) | Breast cancer pathological image diagnosis support system, breast cancer pathological image diagnosis support method, and recording medium recording breast cancer pathological image diagnosis support program | |
| US11861881B2 (en) | Critical component detection using deep learning and attention | |
| JP2021506003A (ja) | デジタル病理学分析結果の格納および読み出し方法 | |
| JP2017529513A (ja) | 複数の染色で染色されている生物組織サンプルから取得されるマルチチャネル画像を分析するための画像処理方法及びシステム | |
| US10586376B2 (en) | Automated method of predicting efficacy of immunotherapy approaches | |
| CN110168561B (zh) | 用于确定一个或多个组织样本中的细胞组成信息的装置 | |
| US20230162485A1 (en) | Digital analysis of preanalytical factors in tissues used for histological staining | |
| US12229948B2 (en) | Sensitivity analysis for digital pathology | |
| US20250209622A1 (en) | Expression-level prediction for biomarkers in digital pathology images |
Legal Events
| Date | Code | Title | Description |
|---|---|---|---|
| PUAI | Public reference made under article 153(3) epc to a published international application that has entered the european phase |
Free format text: ORIGINAL CODE: 0009012 |
|
| AK | Designated contracting states |
Kind code of ref document: A1 Designated state(s): AL AT BE BG CH CY CZ DE DK EE ES FI FR GB GR HR HU IE IS IT LI LT LU LV MC MK MT NL NO PL PT RO RS SE SI SK SM TR |
|
| AX | Request for extension of the european patent |
Extension state: BA ME |
|
| RAP1 | Party data changed (applicant data changed or rights of an application transferred) |
Owner name: KONINKLIJKE PHILIPS N.V. |
|
| STAA | Information on the status of an ep patent application or granted ep patent |
Free format text: STATUS: THE APPLICATION IS DEEMED TO BE WITHDRAWN |
|
| 18D | Application deemed to be withdrawn |
Effective date: 20200605 |