EP3588009A1 - Verfahren zur lieferung einer kartographischen anzeige in einem fahrzeug, und entsprechendes kartographisches anzeigesystem - Google Patents
Verfahren zur lieferung einer kartographischen anzeige in einem fahrzeug, und entsprechendes kartographisches anzeigesystem Download PDFInfo
- Publication number
- EP3588009A1 EP3588009A1 EP19171016.9A EP19171016A EP3588009A1 EP 3588009 A1 EP3588009 A1 EP 3588009A1 EP 19171016 A EP19171016 A EP 19171016A EP 3588009 A1 EP3588009 A1 EP 3588009A1
- Authority
- EP
- European Patent Office
- Prior art keywords
- vehicle
- display
- distance
- coefficient
- zone
- Prior art date
- Legal status (The legal status is an assumption and is not a legal conclusion. Google has not performed a legal analysis and makes no representation as to the accuracy of the status listed.)
- Withdrawn
Links
Images

Classifications
-
- G—PHYSICS
- G01—MEASURING; TESTING
- G01C—MEASURING DISTANCES, LEVELS OR BEARINGS; SURVEYING; NAVIGATION; GYROSCOPIC INSTRUMENTS; PHOTOGRAMMETRY OR VIDEOGRAMMETRY
- G01C21/00—Navigation; Navigational instruments not provided for in groups G01C1/00 - G01C19/00
- G01C21/26—Navigation; Navigational instruments not provided for in groups G01C1/00 - G01C19/00 specially adapted for navigation in a road network
- G01C21/34—Route searching; Route guidance
- G01C21/36—Input/output arrangements for on-board computers
- G01C21/3667—Display of a road map
- G01C21/367—Details, e.g. road map scale, orientation, zooming, illumination, level of detail, scrolling of road map or positioning of current position marker
-
- G—PHYSICS
- G06—COMPUTING OR CALCULATING; COUNTING
- G06T—IMAGE DATA PROCESSING OR GENERATION, IN GENERAL
- G06T3/00—Geometric image transformations in the plane of the image
- G06T3/04—Context-preserving transformations, e.g. by using an importance map
- G06T3/053—Detail-in-context presentations
Definitions
- the invention relates to the field of navigation systems for motor vehicles.
- Navigation systems are known. It is known to display in a vehicle cartographic data representing the environment of the vehicle as well as to allow the user to find his route from the current position of the vehicle and from an arrival position corresponding to his destination. .
- the display image of the navigation systems represents the vehicle environment on a predetermined scale. The environment near the vehicle is displayed on the same scale as the environment near the vehicle. Thus, no area of the vehicle environment is privileged.
- there is a need to inform the user about the environment close to the vehicle for example to warn him of a change of direction, of a danger zone, of a maximum speed change authorized on a stretch of road, of a vehicle parked on the side of the road or simply to make the environment near the vehicle more visible.
- the display image of known navigation systems does not make it possible to satisfy this need in an acceptable manner because the entire display image is on the same scale, without favoring the environment close to the vehicle.
- Driver assistance systems are known. They provide information coming from sensors located in various places of the vehicle and making it possible to improve driving comfort as well as safety.
- the information provided by the driving assistance systems is environmental data concerning the environment close to the vehicle, generally between 100 meters and 200 meters around the vehicle. If information from driving assistance systems is displayed on a cartographic image of a navigation system known from the state of the art, the resulting display image is not very legible. If the display image represents both the immediate environment and the distant environment of the vehicle, the display of driving assistance information is either very small font, or hides part of the routes shown in the display image. If the scale of the display image represents only the near environment of the vehicle, the information is readable but the user does not have the information about the distant environment of the vehicle.
- the near environment is the vehicle environment located within a radius of a few tens or hundreds of meters from the vehicle, typically 200 meters.
- the distant environment is the vehicle environment located beyond the close environment, up to a radius of a few thousand meters from the vehicle, typically between 500 meters and 4000 meters depending, for example, on whether the vehicle is in city or country.
- the third part is located in the lower half of the display image.
- the detection distance is less than the display distance.
- the detection distance is between 50 meters and 300 meters.
- the detection distance is between 100 meters and 200 meters.
- the display distance is between 400 meters and 5000 meters.
- the display distance is between 500 meters and 4000 meters.
- the method of providing a cartographic display comprises a step of determining the detection distance as a function of the precision of the driving assistance system.
- the method of providing cartographic display comprises a step of determining the detection distance as a function of the ability of the driving assistance system to detect or not environmental information.
- the method of providing a map display comprises a step of determining the detection distance as a function of the distance at which the driving assistance system is able to detect environmental information.
- the predefined magnification coefficient is between 0.4% and 2% of the display distance in meters.
- the third part comprises a main part and a transition part, the predefined magnification coefficient being constant and equal to a main magnification coefficient on the main part, the predefined magnification coefficient varying decreasingly on the transition part.
- the predefined magnification coefficient varies linearly over the transition part.
- the predefined enlargement coefficient of the transition part varies between the main enlargement coefficient and a detection enlargement coefficient equal to a value between 70% and 90% of the coefficient of main extension.
- the main part represents a map of a main area extending from the vehicle to a main distance from the vehicle, the main distance being equal to a value between 50% and 75 % of detection distance.
- the main magnification coefficient is between 0.5% and 2% of the display distance in meters.
- the second part comprises a decrease part and a growth part, the intermediate magnification coefficient varying decreasingly on the decrease part between the predefined magnification coefficient and a magnification coefficient of densification, the intermediate magnification coefficient varying increasingly over the growth part between the densification magnification coefficient and the value 1.
- the intermediate magnification coefficient varies linearly over the decreasing part.
- the intermediate magnification coefficient varies linearly over the growth portion.
- the densification enlargement coefficient is less than 1.
- the densification enlargement coefficient is between 0.6 and 0.8.
- the growth part represents a map of a growth zone extending from a densification distance relative to the vehicle to the display distance relative to the vehicle, the densification distance being equal to a value between 20% and 40% of the display distance.
- the method of providing a map display comprises a step of determining the display distance as a function of the position geographic location of the vehicle, the display distance varying depending on the geographic location of the vehicle.
- the method of providing a map display includes a step of determining the display distance as a function of the type of road for the vehicle.
- the method of providing a map display comprises a step of determining the display distance as a function of a road event.
- a road event is, for example, the approach or crossing of a roundabout, an intersection, a motorway toll, an exit from a motorway, a school area, a show or gymnasium, change of direction, signaling of a vehicle parked on the side of the vehicle traffic road, the presence of an obstacle on the road ...
- the method of providing a map display comprises a step of determining the display distance as a function of a density of information to be indicated on the display image.
- the invention also relates to a computer program product comprising program instructions implementing at least the step of generating a display image, when the program instructions are executed by a computer.
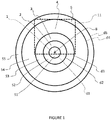
- the figure 1 represents the environment of the vehicle 8.
- the display distance d4 delimits a distant environment to be displayed to a user of the vehicle.
- the display distance d4 is between 400 meters and 5000 meters, typically between 500 meters and 4000 meters.
- the horizon distance d5 is the maximum distance to the vehicle which is represented on the display image.
- more than the display distance d4 is represented, for example because the display screen capable of displaying the display image is of rectangular shape and the display distance d4 is a curved line with radius d4 and center the vehicle.
- the vehicle environment displayed in the first zone does not include information useful to the driver for driving the vehicle.
- the detection distance d2 of the vehicle corresponds to the limit of detection of environmental information by the driving assistance system.
- the main distance d1 delimits the immediate environment of the vehicle and in which the main driving assistance information to be displayed is found.
- the densification distance d3 corresponds to the distance from the vehicle whose representation on the display image is displayed in the most dense manner.
- the distances d1-d5 are measured from the vehicle 8 and delimit the aforementioned zones 1-5 of the vehicle environment which are concentric with respect to the vehicle 8.
- the circles formed by the distances d1-d5 all around the vehicle 8 define concentric sectors S1-S5.
- Region 11 is the environment of the vehicle whose mapping is to be displayed to the user.
- Zones 1-5 are the pieces of sectors S1-S5 included in region 11.
- the main distance d1 is less than the detection distance d2.
- the detection distance d2 is less than the densification distance d3.
- the densification distance d3 is less than the display distance d4.
- the display distance d4 is less than the horizon distance d5.
- the vehicle includes a driving assistance system capable of detecting environmental information around the vehicle up to the detection distance d2.
- the third zone 1, 2 is the detection zone of the driving assistance system.
- the detection distance d2 associated with the third zone 1,2 is equal to a value between 50 meters and 300 meters, preferably between 100 meters and 200 meters.
- the detection distance d2 is chosen to be close to the minimum value of the above-mentioned range of values, that is to say for example between 50 meters and 100 meters.
- the method of the invention can be deactivated and a standard display image can be generated, in accordance for example with the figure 4b .
- the detection distance d2 is chosen close to the maximum value of the above-mentioned range of values, that is to say for example between 200 meters and 300 meters.
- the main distance d1 is equal to a value between 50% and 75% of the detection distance d2.
- the main distance d1 is equal to a value between 50 meters and 75 meters when the detection distance d2 is equal to 100 meters.
- the main distance d1 is equal to a value between 100 meters and 150 meters when the detection distance d2 is equal to 200 meters.
- the display distance d4 is between 400 meters and 5000 meters, preferably between 500 meters and 4000 meters.
- the display distance d4 is chosen as a function of the geographic position of the vehicle 8.
- the display distance d4 is chosen in the low range of values, for example between 400 meters and 1000 meters.
- the display distance d4 is chosen in the high range of values, for example between 1000 meters and 5000 meters.
- the densification distance d3 is equal to a value between 20% and 40% of the display distance d4.
- the densification distance d3 is therefore equal to a value between 100 meters and 200 meters when the display distance d4 is equal to 500 meters.
- the densification distance d3 is therefore equal to a value between 800 meters and 1600 meters when the display distance d4 is equal to 4000 meters.
- the horizon distance d5 is greater than the display distance d4. It is the maximum distance from the vehicle in region 11.
- the horizon distance d5 depends on the shape and size of the display image 100.
- the horizon distance d5 is set thanks to the positioning in space of a virtual camera and its angle of inclination.
- the virtual camera is placed behind the vehicle, at an altitude and with a tilt angle defining a field of vision on the ground with a horizon distance d5.
- the virtual camera is placed above and behind the vehicle, the angle of inclination varying between 15 ° and 35 ° to vary the horizon distance from 400 meters to 6000 meters.
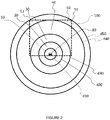
- the figure 2 represents a display image 100 comprising several parts 10-50.
- the display image 100 represents a cartography of the region 11 of the vehicle environment of the figure 1 .
- Parts 10-50 of the display image 100 represent a map of zones 1-5 of the vehicle environment.
- the first part 50 of the display image 100 represents a map of the first area 5 of the vehicle environment.
- the second part 30, 40 of the display image 100 represents a map of the second zone 3, 4 of the vehicle environment.
- the third part 10, 20 of the display image 100 represents a cartography of the third zone 1, 2 of the vehicle environment.
- the decreasing part 30 of the display image 100 represents a map of the decreasing zone 3 of the vehicle environment.
- the increasing part 40 of the display image 100 represents a map of the increasing zone 4 of the vehicle environment.
- the transition part 20 of the display image 100 represents a map of the transition zone 2 of the vehicle environment.
- the main part 10 of the display image 100 represents a map of the main area 1 of the vehicle environment.
- the distances d1-d5 all around vehicle 8 delimiting sectors S1-S50 and zones 1-5 in region 11 on the figure 1 correspond to the main lines d10, detection d20, densification d30, minimum display d40, horizon d50 on the figure 2 .
- Lines d10-d50 are boundaries between parts 1-5 in display image 100.
- the first part 50 is split into two sub-parts 51, 52. This is the consequence of the position and the shape of the display image 100 relative to the minimum display line d40.
- the first part 50 of the display image 100 may be continuous.
- the display image 100 and the corresponding region 11 are rectangular. This form is not limiting.
- the display image 100 and the corresponding region 11 can for example be trapezoidal, round or triangular.
- the vehicle 8 is represented on the display image 100 by a symbol or a pictogram 80.
- the pictogram 80 is located substantially in the middle and at the bottom of the display image 100.
- the third part 10, 20 is located substantially in the middle and at the bottom of the display image 100, in particular in the lower half of the display image 100.
- the terms bottom and bottom are to be interpreted by compared to the vehicle reference system when it is normally driving or parked.
- the first part 50 represents a cartography at a predefined scale of the first zone 5 of the vehicle environment. For example, 1000 meters in the vehicle environment correspond to 1 centimeter on the first part 50 of the display image 100.
- This first part 50 is associated with a reference enlargement coefficient equal to 1. This makes it possible to define in a relative manner to what extent the second part 30, 40 and third part 10, 20 are deformed, that is to say enlarged or narrowed, respectively with a coefficient of magnification greater than or less than 1, with respect to the first part 50.
- the cartographic scale is therefore not constant on the display image.
- the cartographic scale is predefined and equal to a constant value throughout the first part 50.
- the cartographic scale varies in the second part 30, 40 and third part 10, 20 according to a multiplying coefficient equal to the enlargement coefficient associated with said second part 30, 40 and third part 10, 20, with respect to the first part 50.
- the second part 30, 40 and the third part 10, 20 are deformed with respect to the first part 50.
- the magnification coefficient is equal to 1 on the first part 50, that is to say between the minimum display line d40 and the horizon line d50.
- the third part 10, 20 is enlarged relative to the first part 50 with a predefined enlargement coefficient z10.
- the third part 10, 20 is the part of the enlarged display image with the greatest magnification. This makes it possible to privilege the representation of the environment close to the vehicle 8 and to be able to add relevant information to the user.
- the predefined enlargement coefficient z10 is between 0.4% and 2% of the display distance d4 in meters.
- the predefined enlargement coefficient z10 is between 2 and 10 when the display distance d4 is equal to 500 meters. In this case, if 1000 meters in the vehicle environment correspond to 1 cm on the first part 50 of the display image 100, then 100 meters in the vehicle environment correspond to between 0.2 cm and 1 cm on the third part 10, 20 of the display image 100.
- the predefined enlargement coefficient z10 is between 16 and 80 when the display distance d4 is equal to 4000 meters. In this case, if 4000 meters in the vehicle environment correspond to 1 centimeter on the first part 50 of the image display 100, then 400 meters in the vehicle environment correspond to between 1.6 cm and 8 cm on the third part 10, 20 of the display image 100.
- the predefined magnification coefficient z10 is constant and equal to a main magnification coefficient z1 on the main part 10, the predefined magnification coefficient z10 varies decreasingly on the transition part 20.
- transition part 20 associated with a predefined enlargement coefficient z10 varying in decreasing fashion, makes it possible to ensure a good compromise between the display visibility and the display surface of the cartography at the end of the third zone 2 .
- the main enlargement coefficient z1 on the main part 10 is equal to a value between 0.5% and 2% of the display distance d4 in meters, more preferably equal to a value between 0, 8% and 1.2% of the display distance d4 in meters, typically equal to 1% of the display distance d4 in meters.
- the predefined enlargement coefficient z10 of the transition part 20 varies between the main enlargement coefficient z1 and a detection enlargement coefficient z2 equal to a value between 70% and 90% of the main enlargement coefficient z1, typically equal to 80% of the display distance d4 in meters.
- the main magnification coefficient z1 is equal to 5 and the detection magnification coefficient z2 is equal to 4.
- 100 meters in the vehicle environment correspond to 0.5 cm over the entire main part 10 and 0.4 cm on the line of detection d20 of the display image 100.
- the main magnification coefficient z1 is equal to 40 and the detection magnification coefficient z2 is equal to 32.
- 400 meters in the vehicle environment correspond to 4 centimeters over the entire main part 10 and 3.2 centimeters on the detection line d20 of the display image 100.
- the predefined enlargement coefficient z10 varies linearly on the transition part 20.
- the linear variation of the predefined enlargement coefficient z10 is not limiting.
- the variation can be logarithmic or exponential, for example.
- the second part 30, 40 is deformed with respect to the first part 50 with an intermediate enlargement coefficient z20.
- the intermediate enlargement coefficient z20 varies decreasingly on the decreasing part 30 between the predefined enlargement coefficient z10 and a densification enlargement coefficient z3 and the intermediate enlargement coefficient z20 varies increasing over the growth part 40 between the densification enlargement coefficient z3 and the value 1.
- the densification enlargement coefficient z3 is between 0.6 and 0.8, typically equal to 0.7. Since the densification enlargement coefficient z3 is less than 1, this corresponds to a reduction. The densification enlargement coefficient z3 is therefore equivalent to a reduction coefficient.
- the second part 30, 40 associated with an intermediate enlargement coefficient z20 varying decreasing then increasing and passing through a value less than 1, allows a condensed display of the second zone 3,4, in which the information is less useful. for the user, in particular where the intermediate magnification coefficient z20 is minimum, that is to say when it is equal to the densification magnification coefficient z3.
- 1000 meters in the vehicle environment correspond to 1 cm on the first part 50 of the display image 100
- 1000 meters in the vehicle environment correspond to 0.7 cm on the densification line d30 of the display image 100.
- the intermediate magnification coefficient z20 varies linearly over the decreasing part.
- the intermediate enlargement coefficient z20 varies linearly over the growth portion.
- the linear variation of the intermediate magnification coefficient z20 is not limiting.
- the variation can be logarithmic or exponential, for example.
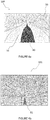
- the display image 100 of the invention is continuously distorted, as illustrated in the figure 4a .
- the display image 100 is distorted because the scale on which the vehicle environment is represented on the display image 100 is not constant.
- the display image 100 is continuous because the scale at which the environment is represented conveys on the display image 100, evolves progressively, and the parts 10-50 of the display image 100 represent adjacent zones 1-5.
- the vehicle is represented by a triangular symbol 80.
- the main part 10 is enlarged relative to the first part 50.
- the figure 4b represents a display image 101 of the state of the art.
- the vehicle is represented by a triangular symbol 81.
- the image 101 represents a vehicle environment at a predefined constant scale.
- the module for determining the geographic position of the vehicle 8 comprises a geolocator, for example a satellite location device.
- the module for accessing cartographic data of a vehicle environment 8 includes a transmitter and receiver module capable of accessing cartographic data stored on a computer server external to the vehicle 8, as a function of the geographic position of the vehicle 8.
- the module for generating a deformed continuous display image 100 comprises an electronic data processing module suitable for example for reconstructing a three-dimensional cartography from cartographic data and for moving mesh points of the cartography to create deformations.
- the display device is for example a screen of the vehicle dashboard 8, a screen separate from the vehicle dashboard 8 or a portion of the windshield.
- the modules and devices described above communicate with each other by wire connections, for example by a CAN type link (acronym for "Controller Area Network” in English), LIN (acronym for "Local Interconnect Network” in English), ethernet or by wireless communication means.
- the display image 100 of the invention makes it possible to highlight the elements most relevant to the user.
- the display image 100 of the invention is continuously deformed, which allows a more natural and more legible visual rendering for the user than a display image subdivided into several representations of the vehicle environment at different scales. .
- the display image 100 deformed according to the invention makes it possible to represent a mapping of a vehicle environment without loss of cartographic information between the vehicle and a target point, while visibly displaying environmental information originating from a driver assistance system.
Landscapes
- Engineering & Computer Science (AREA)
- Radar, Positioning & Navigation (AREA)
- Remote Sensing (AREA)
- Physics & Mathematics (AREA)
- General Physics & Mathematics (AREA)
- Automation & Control Theory (AREA)
- Theoretical Computer Science (AREA)
- Navigation (AREA)
- Traffic Control Systems (AREA)
- Image Processing (AREA)
Applications Claiming Priority (1)
| Application Number | Priority Date | Filing Date | Title |
|---|---|---|---|
| FR1855099A FR3082303B1 (fr) | 2018-06-12 | 2018-06-12 | Procede de fourniture d'affichage cartographique dans un vehicule et systeme d'affichage cartographique associe |
Publications (1)
| Publication Number | Publication Date |
|---|---|
| EP3588009A1 true EP3588009A1 (de) | 2020-01-01 |
Family
ID=63491664
Family Applications (1)
| Application Number | Title | Priority Date | Filing Date |
|---|---|---|---|
| EP19171016.9A Withdrawn EP3588009A1 (de) | 2018-06-12 | 2019-04-25 | Verfahren zur lieferung einer kartographischen anzeige in einem fahrzeug, und entsprechendes kartographisches anzeigesystem |
Country Status (2)
| Country | Link |
|---|---|
| EP (1) | EP3588009A1 (de) |
| FR (1) | FR3082303B1 (de) |
Citations (5)
| Publication number | Priority date | Publication date | Assignee | Title |
|---|---|---|---|---|
| US6282490B1 (en) * | 1997-08-08 | 2001-08-28 | Aisin Aw Co., Ltd. | Map display device and a recording medium |
| US20040204832A1 (en) * | 2002-08-10 | 2004-10-14 | Han Maung W. | Display method and apparatus for navigation system |
| EP2136185A2 (de) * | 2008-06-16 | 2009-12-23 | Samsung Electronics Co., Ltd. | Verfahren und Vorrichtung zur Anzeige einer Karte unter Verwendung nichtlinearer Kompression |
| DE102015005687A1 (de) * | 2015-05-06 | 2016-11-10 | Iav Gmbh Ingenieurgesellschaft Auto Und Verkehr | Kontinuierliche Kartenprojektion mit variabler Detaildarstellung |
| DE102016212428A1 (de) * | 2016-07-07 | 2018-01-11 | Audi Ag | Verfahren zur Information eines Fahrzeuginsassen |
-
2018
- 2018-06-12 FR FR1855099A patent/FR3082303B1/fr active Active
-
2019
- 2019-04-25 EP EP19171016.9A patent/EP3588009A1/de not_active Withdrawn
Patent Citations (6)
| Publication number | Priority date | Publication date | Assignee | Title |
|---|---|---|---|---|
| US6282490B1 (en) * | 1997-08-08 | 2001-08-28 | Aisin Aw Co., Ltd. | Map display device and a recording medium |
| US20040204832A1 (en) * | 2002-08-10 | 2004-10-14 | Han Maung W. | Display method and apparatus for navigation system |
| EP2136185A2 (de) * | 2008-06-16 | 2009-12-23 | Samsung Electronics Co., Ltd. | Verfahren und Vorrichtung zur Anzeige einer Karte unter Verwendung nichtlinearer Kompression |
| EP2136185B1 (de) * | 2008-06-16 | 2015-04-29 | Samsung Electronics Co., Ltd. | Verfahren und Vorrichtung zur Anzeige einer Karte unter Verwendung nichtlinearer Kompression |
| DE102015005687A1 (de) * | 2015-05-06 | 2016-11-10 | Iav Gmbh Ingenieurgesellschaft Auto Und Verkehr | Kontinuierliche Kartenprojektion mit variabler Detaildarstellung |
| DE102016212428A1 (de) * | 2016-07-07 | 2018-01-11 | Audi Ag | Verfahren zur Information eines Fahrzeuginsassen |
Also Published As
| Publication number | Publication date |
|---|---|
| FR3082303A1 (fr) | 2019-12-13 |
| FR3082303B1 (fr) | 2020-07-03 |
Similar Documents
| Publication | Publication Date | Title |
|---|---|---|
| US10627240B2 (en) | Data mining in a digital map database to identify decreasing radius of curvature along roads and enabling precautionary actions in a vehicle | |
| US8618923B2 (en) | Speed alarm system | |
| EP3051515B1 (de) | Verfahren und vorrichtung zur bereitstellung aggregierter benachrichtigungen für gefährliche kurven | |
| US10648818B2 (en) | Data mining in a digital map database to identify blind intersections along roads and enabling precautionary actions in a vehicle | |
| US9733093B2 (en) | Data mining to identify locations of potentially hazardous conditions for vehicle operation and use thereof | |
| US11928961B2 (en) | Phantom traffic jam detection and avoidance | |
| EP2162849B1 (de) | Spurbestimmungsvorrichtung, spurbestimmungsverfahren und navigationsvorrichtung damit | |
| US9909881B2 (en) | Data mining in a digital map database to identify insufficient superelevation along roads and enabling precautionary actions in a vehicle | |
| EP3037314A1 (de) | Verfahren und vorrichtung zur bereitstellung von fahrbahnreibungsdaten für eine reaktionsmassnahme | |
| US9222795B1 (en) | Apparatus, system and method for detour guidance in a navigation system | |
| US11227420B2 (en) | Hazard warning polygons constrained based on end-use device | |
| US11320819B2 (en) | Method, apparatus and computer program product for estimating accuracy of local hazard warnings | |
| EP2159777A2 (de) | Datenfilterung zur Identifizierung von Orten potentiell gefährlicher Bedingungen zum Fahrzeugbetrieb und deren Verwendung | |
| US8364392B2 (en) | Navigation system with speed monitoring mechanism and method of operation thereof | |
| JP2010102575A (ja) | 交通情報生成装置および交通情報生成方法 | |
| US11225263B2 (en) | Driver assistance system | |
| US20100057353A1 (en) | GPS Map for Commercial Vehicle Industry | |
| JP4936070B2 (ja) | ナビゲーション装置及びナビゲーションプログラム | |
| EP4056399A1 (de) | Fahrzeuganzeigevorrichtung | |
| WO2012019729A2 (fr) | Procede et dispositif d'aide a la conduite et a l'anticipation d'un profil de route | |
| US20180204454A1 (en) | Method and system for displaying speed information | |
| US11697432B2 (en) | Method, apparatus and computer program product for creating hazard probability boundaries with confidence bands | |
| EP3588009A1 (de) | Verfahren zur lieferung einer kartographischen anzeige in einem fahrzeug, und entsprechendes kartographisches anzeigesystem | |
| JP7784068B2 (ja) | 車両表示装置 | |
| US20230061528A1 (en) | Method, apparatus and computer program product for aggregating hazard polygons |
Legal Events
| Date | Code | Title | Description |
|---|---|---|---|
| PUAI | Public reference made under article 153(3) epc to a published international application that has entered the european phase |
Free format text: ORIGINAL CODE: 0009012 |
|
| STAA | Information on the status of an ep patent application or granted ep patent |
Free format text: STATUS: THE APPLICATION HAS BEEN PUBLISHED |
|
| AK | Designated contracting states |
Kind code of ref document: A1 Designated state(s): AL AT BE BG CH CY CZ DE DK EE ES FI FR GB GR HR HU IE IS IT LI LT LU LV MC MK MT NL NO PL PT RO RS SE SI SK SM TR |
|
| AX | Request for extension of the european patent |
Extension state: BA ME |
|
| STAA | Information on the status of an ep patent application or granted ep patent |
Free format text: STATUS: REQUEST FOR EXAMINATION WAS MADE |
|
| 17P | Request for examination filed |
Effective date: 20200504 |
|
| RBV | Designated contracting states (corrected) |
Designated state(s): AL AT BE BG CH CY CZ DE DK EE ES FI FR GB GR HR HU IE IS IT LI LT LU LV MC MK MT NL NO PL PT RO RS SE SI SK SM TR |
|
| RAP3 | Party data changed (applicant data changed or rights of an application transferred) |
Owner name: RENAULT S.A.S |
|
| STAA | Information on the status of an ep patent application or granted ep patent |
Free format text: STATUS: EXAMINATION IS IN PROGRESS |
|
| 17Q | First examination report despatched |
Effective date: 20220518 |
|
| RAP3 | Party data changed (applicant data changed or rights of an application transferred) |
Owner name: RENAULT S.A.S |
|
| P01 | Opt-out of the competence of the unified patent court (upc) registered |
Effective date: 20230608 |
|
| GRAP | Despatch of communication of intention to grant a patent |
Free format text: ORIGINAL CODE: EPIDOSNIGR1 |
|
| STAA | Information on the status of an ep patent application or granted ep patent |
Free format text: STATUS: GRANT OF PATENT IS INTENDED |
|
| INTG | Intention to grant announced |
Effective date: 20240229 |
|
| RAP1 | Party data changed (applicant data changed or rights of an application transferred) |
Owner name: AMPERE SAS |
|
| STAA | Information on the status of an ep patent application or granted ep patent |
Free format text: STATUS: THE APPLICATION IS DEEMED TO BE WITHDRAWN |
|
| 18D | Application deemed to be withdrawn |
Effective date: 20240702 |