EP3674711A2 - Biomarqueurs et procédés permettant de déterminer les facteurs de risque de la maladie d'alzheimer - Google Patents
Biomarqueurs et procédés permettant de déterminer les facteurs de risque de la maladie d'alzheimer Download PDFInfo
- Publication number
- EP3674711A2 EP3674711A2 EP19201752.3A EP19201752A EP3674711A2 EP 3674711 A2 EP3674711 A2 EP 3674711A2 EP 19201752 A EP19201752 A EP 19201752A EP 3674711 A2 EP3674711 A2 EP 3674711A2
- Authority
- EP
- European Patent Office
- Prior art keywords
- biomarker
- biomarkers
- mass
- charge state
- peptide
- Prior art date
- Legal status (The legal status is an assumption and is not a legal conclusion. Google has not performed a legal analysis and makes no representation as to the accuracy of the status listed.)
- Withdrawn
Links
- 239000000090 biomarker Substances 0.000 title claims abstract description 333
- 208000024827 Alzheimer disease Diseases 0.000 title claims abstract description 86
- 238000000034 method Methods 0.000 title claims abstract description 37
- 238000004949 mass spectrometry Methods 0.000 claims description 39
- 108090000765 processed proteins & peptides Proteins 0.000 claims description 32
- 210000002966 serum Anatomy 0.000 claims description 30
- 238000004885 tandem mass spectrometry Methods 0.000 claims description 23
- 125000003275 alpha amino acid group Chemical group 0.000 claims description 13
- 239000013060 biological fluid Substances 0.000 claims description 6
- WEVYAHXRMPXWCK-UHFFFAOYSA-N Acetonitrile Chemical compound CC#N WEVYAHXRMPXWCK-UHFFFAOYSA-N 0.000 description 27
- 150000002500 ions Chemical class 0.000 description 27
- 150000002632 lipids Chemical class 0.000 description 26
- 239000003550 marker Substances 0.000 description 23
- 238000013467 fragmentation Methods 0.000 description 22
- 238000006062 fragmentation reaction Methods 0.000 description 22
- 241000894007 species Species 0.000 description 20
- 238000004458 analytical method Methods 0.000 description 18
- 239000000091 biomarker candidate Substances 0.000 description 18
- 239000012634 fragment Substances 0.000 description 18
- 238000001228 spectrum Methods 0.000 description 17
- 235000014113 dietary fatty acids Nutrition 0.000 description 16
- 229930195729 fatty acid Natural products 0.000 description 16
- 239000000194 fatty acid Substances 0.000 description 16
- 150000004665 fatty acids Chemical class 0.000 description 16
- 238000013459 approach Methods 0.000 description 15
- 238000003556 assay Methods 0.000 description 15
- 102000004169 proteins and genes Human genes 0.000 description 15
- 108090000623 proteins and genes Proteins 0.000 description 15
- 230000035945 sensitivity Effects 0.000 description 13
- SUHOQUVVVLNYQR-MRVPVSSYSA-N choline alfoscerate Chemical compound C[N+](C)(C)CCOP([O-])(=O)OC[C@H](O)CO SUHOQUVVVLNYQR-MRVPVSSYSA-N 0.000 description 12
- 238000010828 elution Methods 0.000 description 12
- 239000000203 mixture Substances 0.000 description 11
- BDAGIHXWWSANSR-UHFFFAOYSA-N methanoic acid Natural products OC=O BDAGIHXWWSANSR-UHFFFAOYSA-N 0.000 description 10
- 150000001413 amino acids Chemical class 0.000 description 9
- 239000007789 gas Substances 0.000 description 9
- 238000010200 validation analysis Methods 0.000 description 9
- XLYOFNOQVPJJNP-UHFFFAOYSA-N water Chemical compound O XLYOFNOQVPJJNP-UHFFFAOYSA-N 0.000 description 9
- 206010012289 Dementia Diseases 0.000 description 8
- PEDCQBHIVMGVHV-UHFFFAOYSA-N glycerol group Chemical group OCC(O)CO PEDCQBHIVMGVHV-UHFFFAOYSA-N 0.000 description 8
- IPCSVZSSVZVIGE-UHFFFAOYSA-N hexadecanoic acid Chemical compound CCCCCCCCCCCCCCCC(O)=O IPCSVZSSVZVIGE-UHFFFAOYSA-N 0.000 description 8
- 150000001875 compounds Chemical class 0.000 description 7
- 238000003745 diagnosis Methods 0.000 description 7
- 239000012074 organic phase Substances 0.000 description 7
- 230000003647 oxidation Effects 0.000 description 7
- 238000007254 oxidation reaction Methods 0.000 description 7
- 230000007935 neutral effect Effects 0.000 description 6
- 239000012071 phase Substances 0.000 description 6
- 102000004196 processed proteins & peptides Human genes 0.000 description 6
- 238000012545 processing Methods 0.000 description 6
- OSWFIVFLDKOXQC-UHFFFAOYSA-N 4-(3-methoxyphenyl)aniline Chemical compound COC1=CC=CC(C=2C=CC(N)=CC=2)=C1 OSWFIVFLDKOXQC-UHFFFAOYSA-N 0.000 description 5
- 238000000692 Student's t-test Methods 0.000 description 5
- 238000003981 capillary liquid chromatography Methods 0.000 description 5
- 210000001175 cerebrospinal fluid Anatomy 0.000 description 5
- 235000019253 formic acid Nutrition 0.000 description 5
- 238000004128 high performance liquid chromatography Methods 0.000 description 5
- 230000010076 replication Effects 0.000 description 5
- 239000000126 substance Substances 0.000 description 5
- 239000008346 aqueous phase Substances 0.000 description 4
- QVGXLLKOCUKJST-UHFFFAOYSA-N atomic oxygen Chemical compound [O] QVGXLLKOCUKJST-UHFFFAOYSA-N 0.000 description 4
- 230000000694 effects Effects 0.000 description 4
- 238000002474 experimental method Methods 0.000 description 4
- 230000006870 function Effects 0.000 description 4
- 238000007477 logistic regression Methods 0.000 description 4
- 238000012986 modification Methods 0.000 description 4
- 230000004048 modification Effects 0.000 description 4
- 238000010606 normalization Methods 0.000 description 4
- 239000001301 oxygen Substances 0.000 description 4
- 229910052760 oxygen Inorganic materials 0.000 description 4
- 239000002245 particle Substances 0.000 description 4
- 238000000575 proteomic method Methods 0.000 description 4
- 108010060159 Apolipoprotein E4 Proteins 0.000 description 3
- 230000000295 complement effect Effects 0.000 description 3
- 238000013480 data collection Methods 0.000 description 3
- 239000000539 dimer Substances 0.000 description 3
- 201000010099 disease Diseases 0.000 description 3
- 208000037265 diseases, disorders, signs and symptoms Diseases 0.000 description 3
- 239000003814 drug Substances 0.000 description 3
- 229940079593 drug Drugs 0.000 description 3
- 230000009977 dual effect Effects 0.000 description 3
- 238000004895 liquid chromatography mass spectrometry Methods 0.000 description 3
- 239000000463 material Substances 0.000 description 3
- 239000006199 nebulizer Substances 0.000 description 3
- 238000001556 precipitation Methods 0.000 description 3
- 239000002243 precursor Substances 0.000 description 3
- 230000008569 process Effects 0.000 description 3
- 238000012163 sequencing technique Methods 0.000 description 3
- 239000000243 solution Substances 0.000 description 3
- 230000003595 spectral effect Effects 0.000 description 3
- 238000007619 statistical method Methods 0.000 description 3
- 210000001519 tissue Anatomy 0.000 description 3
- 238000011282 treatment Methods 0.000 description 3
- XKRFYHLGVUSROY-UHFFFAOYSA-N Argon Chemical compound [Ar] XKRFYHLGVUSROY-UHFFFAOYSA-N 0.000 description 2
- IJGRMHOSHXDMSA-UHFFFAOYSA-N Atomic nitrogen Chemical compound N#N IJGRMHOSHXDMSA-UHFFFAOYSA-N 0.000 description 2
- CURLTUGMZLYLDI-UHFFFAOYSA-N Carbon dioxide Chemical compound O=C=O CURLTUGMZLYLDI-UHFFFAOYSA-N 0.000 description 2
- 235000021314 Palmitic acid Nutrition 0.000 description 2
- 230000009471 action Effects 0.000 description 2
- 238000013103 analytical ultracentrifugation Methods 0.000 description 2
- 239000007864 aqueous solution Substances 0.000 description 2
- 230000008901 benefit Effects 0.000 description 2
- 125000004432 carbon atom Chemical group C* 0.000 description 2
- 235000011089 carbon dioxide Nutrition 0.000 description 2
- 238000012512 characterization method Methods 0.000 description 2
- 238000013375 chromatographic separation Methods 0.000 description 2
- 208000010877 cognitive disease Diseases 0.000 description 2
- 239000002131 composite material Substances 0.000 description 2
- 238000010276 construction Methods 0.000 description 2
- 238000007405 data analysis Methods 0.000 description 2
- 238000001514 detection method Methods 0.000 description 2
- 238000011068 loading method Methods 0.000 description 2
- 230000014759 maintenance of location Effects 0.000 description 2
- 208000027061 mild cognitive impairment Diseases 0.000 description 2
- 238000002552 multiple reaction monitoring Methods 0.000 description 2
- WQEPLUUGTLDZJY-UHFFFAOYSA-N n-Pentadecanoic acid Natural products CCCCCCCCCCCCCCC(O)=O WQEPLUUGTLDZJY-UHFFFAOYSA-N 0.000 description 2
- WTJKGGKOPKCXLL-RRHRGVEJSA-N phosphatidylcholine Chemical group CCCCCCCCCCCCCCCC(=O)OC[C@H](COP([O-])(=O)OCC[N+](C)(C)C)OC(=O)CCCCCCCC=CCCCCCCCC WTJKGGKOPKCXLL-RRHRGVEJSA-N 0.000 description 2
- 238000004451 qualitative analysis Methods 0.000 description 2
- 238000002553 single reaction monitoring Methods 0.000 description 2
- 230000001629 suppression Effects 0.000 description 2
- 102000013498 tau Proteins Human genes 0.000 description 2
- 108010026424 tau Proteins Proteins 0.000 description 2
- HNSDLXPSAYFUHK-UHFFFAOYSA-N 1,4-bis(2-ethylhexyl) sulfosuccinate Chemical compound CCCCC(CC)COC(=O)CC(S(O)(=O)=O)C(=O)OCC(CC)CCCC HNSDLXPSAYFUHK-UHFFFAOYSA-N 0.000 description 1
- 238000004780 2D liquid chromatography Methods 0.000 description 1
- 102000009027 Albumins Human genes 0.000 description 1
- 108010088751 Albumins Proteins 0.000 description 1
- 108010025628 Apolipoproteins E Proteins 0.000 description 1
- 102000013918 Apolipoproteins E Human genes 0.000 description 1
- OKTJSMMVPCPJKN-UHFFFAOYSA-N Carbon Chemical compound [C] OKTJSMMVPCPJKN-UHFFFAOYSA-N 0.000 description 1
- 102000014914 Carrier Proteins Human genes 0.000 description 1
- 108010078791 Carrier Proteins Proteins 0.000 description 1
- 206010061818 Disease progression Diseases 0.000 description 1
- 238000002965 ELISA Methods 0.000 description 1
- JAZBEHYOTPTENJ-JLNKQSITSA-N all-cis-5,8,11,14,17-icosapentaenoic acid Chemical compound CC\C=C/C\C=C/C\C=C/C\C=C/C\C=C/CCCC(O)=O JAZBEHYOTPTENJ-JLNKQSITSA-N 0.000 description 1
- 230000004075 alteration Effects 0.000 description 1
- 125000000539 amino acid group Chemical group 0.000 description 1
- 108010064539 amyloid beta-protein (1-42) Proteins 0.000 description 1
- 238000004164 analytical calibration Methods 0.000 description 1
- 229910052786 argon Inorganic materials 0.000 description 1
- 239000012620 biological material Substances 0.000 description 1
- 210000004369 blood Anatomy 0.000 description 1
- 239000008280 blood Substances 0.000 description 1
- 210000001124 body fluid Anatomy 0.000 description 1
- 238000004364 calculation method Methods 0.000 description 1
- 238000004850 capillary HPLC Methods 0.000 description 1
- 229910052799 carbon Inorganic materials 0.000 description 1
- 238000005119 centrifugation Methods 0.000 description 1
- 238000007705 chemical test Methods 0.000 description 1
- 238000001360 collision-induced dissociation Methods 0.000 description 1
- 238000012790 confirmation Methods 0.000 description 1
- 238000010219 correlation analysis Methods 0.000 description 1
- 238000013211 curve analysis Methods 0.000 description 1
- 230000006378 damage Effects 0.000 description 1
- 230000003247 decreasing effect Effects 0.000 description 1
- 230000001419 dependent effect Effects 0.000 description 1
- 206010012601 diabetes mellitus Diseases 0.000 description 1
- 239000000104 diagnostic biomarker Substances 0.000 description 1
- 238000012631 diagnostic technique Methods 0.000 description 1
- 230000004069 differentiation Effects 0.000 description 1
- 238000006471 dimerization reaction Methods 0.000 description 1
- 230000005750 disease progression Effects 0.000 description 1
- 239000000975 dye Substances 0.000 description 1
- 229960005135 eicosapentaenoic acid Drugs 0.000 description 1
- JAZBEHYOTPTENJ-UHFFFAOYSA-N eicosapentaenoic acid Natural products CCC=CCC=CCC=CCC=CCC=CCCCC(O)=O JAZBEHYOTPTENJ-UHFFFAOYSA-N 0.000 description 1
- 235000020673 eicosapentaenoic acid Nutrition 0.000 description 1
- 238000005516 engineering process Methods 0.000 description 1
- 238000001976 enzyme digestion Methods 0.000 description 1
- 238000011156 evaluation Methods 0.000 description 1
- 230000003203 everyday effect Effects 0.000 description 1
- 230000029142 excretion Effects 0.000 description 1
- 238000000605 extraction Methods 0.000 description 1
- XUFQPHANEAPEMJ-UHFFFAOYSA-N famotidine Chemical compound NC(N)=NC1=NC(CSCCC(N)=NS(N)(=O)=O)=CS1 XUFQPHANEAPEMJ-UHFFFAOYSA-N 0.000 description 1
- 150000002316 glycerophosphocholines Chemical class 0.000 description 1
- 150000002327 glycerophospholipids Chemical class 0.000 description 1
- 230000002209 hydrophobic effect Effects 0.000 description 1
- 238000003384 imaging method Methods 0.000 description 1
- 239000004615 ingredient Substances 0.000 description 1
- 238000002347 injection Methods 0.000 description 1
- 239000007924 injection Substances 0.000 description 1
- 238000011835 investigation Methods 0.000 description 1
- 238000002955 isolation Methods 0.000 description 1
- 125000000468 ketone group Chemical group 0.000 description 1
- 238000004811 liquid chromatography Methods 0.000 description 1
- 210000002751 lymph Anatomy 0.000 description 1
- 238000001819 mass spectrum Methods 0.000 description 1
- 238000005259 measurement Methods 0.000 description 1
- 238000002156 mixing Methods 0.000 description 1
- 239000013642 negative control Substances 0.000 description 1
- 230000001537 neural effect Effects 0.000 description 1
- 229910052757 nitrogen Inorganic materials 0.000 description 1
- 230000036542 oxidative stress Effects 0.000 description 1
- 238000012856 packing Methods 0.000 description 1
- 230000007170 pathology Effects 0.000 description 1
- -1 peptides Chemical class 0.000 description 1
- 210000002381 plasma Anatomy 0.000 description 1
- 238000013105 post hoc analysis Methods 0.000 description 1
- 238000012805 post-processing Methods 0.000 description 1
- 238000007781 pre-processing Methods 0.000 description 1
- 239000000047 product Substances 0.000 description 1
- 238000002731 protein assay Methods 0.000 description 1
- 239000003642 reactive oxygen metabolite Substances 0.000 description 1
- 239000012088 reference solution Substances 0.000 description 1
- 230000001105 regulatory effect Effects 0.000 description 1
- 238000011160 research Methods 0.000 description 1
- 230000000717 retained effect Effects 0.000 description 1
- 150000003839 salts Chemical class 0.000 description 1
- 238000012216 screening Methods 0.000 description 1
- 230000028327 secretion Effects 0.000 description 1
- 238000000926 separation method Methods 0.000 description 1
- 239000002002 slurry Substances 0.000 description 1
- 150000003384 small molecules Chemical class 0.000 description 1
- 239000002904 solvent Substances 0.000 description 1
- 238000012109 statistical procedure Methods 0.000 description 1
- 238000000528 statistical test Methods 0.000 description 1
- 239000006228 supernatant Substances 0.000 description 1
- 238000012360 testing method Methods 0.000 description 1
- 235000013619 trace mineral Nutrition 0.000 description 1
- 239000011573 trace mineral Substances 0.000 description 1
- 230000007704 transition Effects 0.000 description 1
- 235000021122 unsaturated fatty acids Nutrition 0.000 description 1
- 150000004670 unsaturated fatty acids Chemical class 0.000 description 1
- 210000002700 urine Anatomy 0.000 description 1
- 238000012418 validation experiment Methods 0.000 description 1
- 230000000007 visual effect Effects 0.000 description 1
- 239000011800 void material Substances 0.000 description 1
Images
Classifications
-
- G—PHYSICS
- G01—MEASURING; TESTING
- G01N—INVESTIGATING OR ANALYSING MATERIALS BY DETERMINING THEIR CHEMICAL OR PHYSICAL PROPERTIES
- G01N33/00—Investigating or analysing materials by specific methods not covered by groups G01N1/00 - G01N31/00
- G01N33/48—Biological material, e.g. blood, urine; Haemocytometers
- G01N33/50—Chemical analysis of biological material, e.g. blood, urine; Testing involving biospecific ligand binding methods; Immunological testing
- G01N33/68—Chemical analysis of biological material, e.g. blood, urine; Testing involving biospecific ligand binding methods; Immunological testing involving proteins, peptides or amino acids
- G01N33/6893—Chemical analysis of biological material, e.g. blood, urine; Testing involving biospecific ligand binding methods; Immunological testing involving proteins, peptides or amino acids related to diseases not provided for elsewhere
- G01N33/6896—Neurological disorders, e.g. Alzheimer's disease
-
- G—PHYSICS
- G01—MEASURING; TESTING
- G01N—INVESTIGATING OR ANALYSING MATERIALS BY DETERMINING THEIR CHEMICAL OR PHYSICAL PROPERTIES
- G01N33/00—Investigating or analysing materials by specific methods not covered by groups G01N1/00 - G01N31/00
- G01N33/48—Biological material, e.g. blood, urine; Haemocytometers
- G01N33/50—Chemical analysis of biological material, e.g. blood, urine; Testing involving biospecific ligand binding methods; Immunological testing
- G01N33/68—Chemical analysis of biological material, e.g. blood, urine; Testing involving biospecific ligand binding methods; Immunological testing involving proteins, peptides or amino acids
- G01N33/6803—General methods of protein analysis not limited to specific proteins or families of proteins
- G01N33/6848—Methods of protein analysis involving mass spectrometry
-
- G—PHYSICS
- G01—MEASURING; TESTING
- G01N—INVESTIGATING OR ANALYSING MATERIALS BY DETERMINING THEIR CHEMICAL OR PHYSICAL PROPERTIES
- G01N33/00—Investigating or analysing materials by specific methods not covered by groups G01N1/00 - G01N31/00
- G01N33/48—Biological material, e.g. blood, urine; Haemocytometers
- G01N33/50—Chemical analysis of biological material, e.g. blood, urine; Testing involving biospecific ligand binding methods; Immunological testing
- G01N33/92—Chemical analysis of biological material, e.g. blood, urine; Testing involving biospecific ligand binding methods; Immunological testing involving lipids, e.g. cholesterol, lipoproteins, or their receptors
-
- G—PHYSICS
- G01—MEASURING; TESTING
- G01N—INVESTIGATING OR ANALYSING MATERIALS BY DETERMINING THEIR CHEMICAL OR PHYSICAL PROPERTIES
- G01N2800/00—Detection or diagnosis of diseases
- G01N2800/28—Neurological disorders
- G01N2800/2814—Dementia; Cognitive disorders
- G01N2800/2821—Alzheimer
Definitions
- AD Alzheimer's disease
- CSF cerebrospinal fluid
- the term “substantially” refers to the complete or nearly complete extent or degree of an action, characteristic, property, state, structure, item, or result.
- an object that is “substantially” enclosed would mean that the object is either completely enclosed or nearly completely enclosed.
- the exact allowable degree of deviation from absolute completeness may in some cases depend on the specific context. However, generally speaking the nearness of completion will be so as to have the same overall result as if absolute and total completion were obtained.
- the use of “substantially” is equally applicable when used in a negative connotation to refer to the complete or near complete lack of an action, characteristic, property, state, structure, item, or result.
- compositions that is "substantially free of' particles would either completely lack particles, or so nearly completely lack particles that the effect would be the same as if it completely lacked particles.
- a composition that is "substantially free of' an ingredient or element may still actually contain such item as long as there is no measurable effect thereof.
- biomarkers and biomarker assays that can identify an individual with risk factors for Alzheimer's disease (AD), particularly those that rely on easily and inexpensively obtained specimens. Such an identification and subsequent diagnosis can greatly improve the treatment of AD by allowing available treatments to begin as soon as possible. Additionally, biomarkers and biomarker assays capable of detecting very early stage AD can allow for drug studies, especially in non-familial, sporadic AD, which represents 99% of cases.
- the present disclosure has utilized a novel serum proteomics approach to elucidate serum biomarkers and biomarker combinations that are linked to AD, including those capable of identifying very early stage AD.
- An initial serum proteomics study (Biomarker Study I, below) was performed to discover novel molecular biomarkers that were quantitatively different between patients with AD and age, gender, and ApoE4 matched controls, and thus could potentially be used in determining risk factors of AD.
- serum was utilized as the biological medium for the discovery of the biomarkers, thus allowing for easy and inexpensive specimen acquisition in assays developed to screen for such biomarkers. It is noted, however, that the present scope is not limited to serum, and such biomarkers can be assayed for using any biological medium.
- the 13 candidate biomarkers were subjected to chemical characterization. Two were initially found to be lipid dimers, and were excluded as described below. Six were excluded as they did not replicate, and two more had such low abundances or were so conflated with other peaks that it was difficult to reliably perform quantitation in the follow up study. Three candidates had continued usefulness in the follow up study. Upon closer analysis it was discovered that one of these candidates was actually two distinct compounds, both having very similar masses and both still significantly different in the replication study.
- Biomarker 1 is a peptide having the sequence L/IAENR
- Biomarker 2 is a glycerophosphatidylcholine
- Biomarkers 3 and 4 are oxidized glycerophosphatidylcholines, as is described in more detail in the Biomarker II Study below.
- one or more of biomarkers 1-4 can be utilized in the diagnosis of AD in a subject.
- one or more of the biomarkers can diagnose the presence or absence of AD in the subject.
- the one or more biomarkers can diagnose subjects at a very early stage of AD (e.g. CDR 0.5).
- one or more biomarkers can be used to diagnose the absence of AD in an individual.
- a method for determining whether an individual is at risk for AD can include assaying a biological medium obtained from the individual for one or more biomarkers shown in Table 1 (Biomarker 1, Biomarker 2, Biomarker 3, and Biomarker 4), where Biomarker 1 has a mass-to-charge ratio (m/z) of 602.3, Biomarker 2 has a m/z of 804.6, Biomarker 3 has a m/z of 874.6, and Biomarker 4 has a m/z of 804.5.
- the presence of the one or more biomarkers in the individual can be diagnostic of AD, or in other aspects can indicate a risk factor for Alzheimer's disease.
- a method for determining whether an individual is at risk for AD can include assaying a biological medium obtained from the individual for two or more biomarkers shown in Table 1 (Biomarker 1, Biomarker 2, Biomarker 3, and Biomarker 4), where Biomarker 1 has a m/z of 602.3, Biomarker 2 has a m/z of 804.6, Biomarker 3 has a m/z of 874.6, and Biomarker 4 has a m/z of 804.5.
- the presence of the two or more biomarkers in the individual can be diagnostic of AD, or in other aspects can indicate a risk factor for Alzheimer's disease.
- the biological medium is assayed for three or more of Biomarkers 1-4. In yet another example, the biological medium is assayed for each of Biomarkers 1-4. In a further example, the biological medium is assayed for Biomarkers 1 and 2. It is thus to be understood that the present scope includes assaying all combinations of Biomarkers 1-4 as any of a number of biomarker panels, including all pairs of biomarkers, all combinations of 3 biomarkers, and all 4 biomarkers together. Furthermore, a biomarker panel can consist of any number of biomarkers from Biomarker 1-4, all combinations of biomarker pairs, all combinations of 3 biomarkers, and all 4 biomarkers together. Such biomarker panels represent novel collections of biomarkers that can be used to detect AD in a subject.
- m/z values are used in the present example to describe each biomarker, any distinguishing characteristic of a biomarker can be utilized, either in addition to or as an alternative for the m/z values.
- the description of each biomarker by m/z value is for convenience, and should not be construed as an indication that an assay need necessarily utilize MS. Rather, any type of diagnostic technique, device, system, etc., capable of identifying any of the biomarkers in a biological medium is considered to be within the present scope.
- MS can be useful as an assay or as a component to an assay for determining the presence of any of the biomarkers in the biological medium.
- the method can further include assaying the biological medium using MS for at least one of the biomarkers.
- tandem MS MS/MS
- SRM Selected Reaction Monitoring
- MRM Multiple Reaction Monitoring
- chromatographic separation by any of several separation methods coupled to a MS system or used in conjunction with a MS can be considered, e.g. nano-liquid chromatography coupled to a MS instrument or two dimensional liquid chromatography coupled to MS.
- assays can additionally be used, either in conjunction with or as a replacement to a MS procedure.
- the other type of assay can be used as a confirmation of a biomarker identified by MS, or as a stand-alone assay in the identification of one or more biomarker.
- any assay that can be utilized to detect a peptide sequence can be used to detect Biomarker 1, either alone or in conjunction with the MS.
- Various peptide assays are well known in the art, and those of ordinary skill are well versed in their use.
- One non-limiting example of such an assay can include an antibody assay, such as an ELISA.
- any assay capable of detecting a glycerophosphatidylcholine or an oxidized glycerophosphatidylcholine is considered to be within the present scope, and can be used to detect any of Biomarkers 2-4.
- one possibility is the use of an antibody assay designed to detect a glycerophosphatidylcholine, or an oxidized group of a glycerophosphatidylcholine.
- the biological medium can be any biological component of the subject that can include any of the biomarkers of interest. Such can include any tissue, liquefied tissue, bodily fluid, excretion, secretion, and the like.
- the biological medium can be a biological fluid. Examples can include whole blood, serum, plasma, urine, lymph, cerebrospinal fluid (CSF), and the like.
- the biological fluid can be serum.
- the following study is one example of obtaining a number of potential AD biomarkers and generating potentially useful multi-marker panels from subject samples. It should be understood that this is merely one approach, and that the methodologies, techniques, and results should not be seen as limiting to the overall scope of the disclosure. That being said, the following study provided data to suggest that at least 82 different observed mass spectrometer peaks might contribute to the diagnosis of AD. These 82 markers were used to investigate multi-marker panels, some of which are described herein. In one example, 13 markers occurred in at least 10% of the panels. Additional investigation of these 13 markers is as follows.
- CDR clinical dementia rating
- the 58 cases and 55 controls did not have co-morbidities, including diabetes.
- Specimens were collected and processed into serum according to a uniform method and were stored at -80 °C as serum prior to shipment to Brigham Young University (BYU), before processing at BYU, and after processing at BYU. Specimens were transferred on dry ice.
- Serum contains many highly abundant proteins like albumin. Highly abundant proteins lead to ion suppression of low abundance biomolecules when analyzed by mass spectrometry (MS). This prevents hundreds or thousands of molecular species from appearing in the MS. Hence, in the novel approach used here, these larger proteins are removed using an acetonitrile precipitation protocol. This substantially increases the number of biomolecules observable by MS. It also displaces many small molecules, particularly peptides, from large carrier proteins.
- MS mass spectrometry
- Apparent protein concentration was determined by Bio-Rad microplate protein assay performed according to manufacturer's instructions (Bio-Rad Laboratories, Hercules, CA). An aliquot containing an apparent protein concentration of 2 ⁇ g was transferred to a new microcentrifuge tube and brought down to ⁇ 10 ⁇ L in a vacuum centrifuge. Samples were brought up to 10 ⁇ L with HPLC water and acidified with addition of 10 ⁇ L 88% formic acid.
- the protein-depleted, acidified sample was loaded onto a capillary liquid chromatography (cLC) system capable of gradient elution to separate compounds according to their polarities.
- the column is interfaced with a tandem mass spectrometer. Samples were randomized to keep bias to a minimum and sample sets were run in as short a time as possible to maintain reproducibility.
- the pump used was an LC Packings Ultimate Capillary HPLC pump system, with a FAMOS autosampler (Dionex Corporation, Sunnyvale, CA) maintained at 4°C.
- the quaternary pump delivers two different solutions: an aqueous solution (98% HPLC grade H 2 O, 2% acetonitrile and 0.1% formic acid) and an organic solution (2% H 2 O, 98% acetonitrile and 0.1% formic acid) at a specified composition via a mixing device situated prior to the pump.
- a 1 mm (16.2 ⁇ L) microbore guard column from Upchurch Scientific, Oak Harbor, WA and a 15 cm x 250 ⁇ m i.d. capillary analytical column made in-house were utilized for bringing about chromatographic separation. While the capillary column was slurry packed, the guard column was dry-packed. Both columns used POROS R1 reversed-phase media from Applied Biosystems, Framingham, MA.
- the protein-depleted sample was introduced and retained on the guard column and then placed in series with the analytical capillary column and fractionated using the following gradient: 3 min of 95% aqueous and 5% organic phase, followed by a linear rise in organic phase to 60% over the next 24 min. Thereafter, the solvent mix was increased linearly to 95% organic phase and 5% aqueous phase over the next 7 min, then held at 95% organic phase for 7 min, and returned to 95% aqueous phase over 5 min. The column was allowed to re-equilibrate until the end time of the run (58 min). The flow rate used was 5.0 ⁇ L/min.
- the cLC system was interfaced via an IonSpray source from Applied Biosystems to a QSTAR Pulsar I quadrupole/orthogonal time-of-flight mass spectrometer set at 4800V. MS data was collected for m/z range of 500 to 2500 starting at 5 min and ending at 55 min of gradient elution. The positive ion mode was used with the scan rate of 1 spectrum/sec.
- the software package of Analyst QS® permitted effective data collection, preliminary formatting, MS spectral comparison, extraction of specific ion chromatograms and analysis.
- MS spectra taken from 1 min before to 1 min after each endogenous time marker were compiled for each sample to generate a composite spectrum.
- spectra from AD cases and normal controls were color coded and overlaid to allow for direct visual analysis of each individual molecular species. Peaks that appeared quantitatively different between cases and controls were then further evaluated. This involved the determination of peak height by extracting the ion counts of the desired peak specifying an m/z range to capture the peak envelope maximum using the "XIC" function of the MS instrument software for each of the samples. The peak heights were then recorded for all the samples for each of the potential AD biomarkers and the data tested for statistical significance by Student's t-test. A p-value ⁇ 0.05 was considered statistically different.
- Non-biological variability is part of proteomic studies. Sources include variability in specimen processing, specimen stability, ionization efficiency, and instrument sensitivity, among other things. To reduce variability, a previously tested approach was used. A set of native serum molecules was selected as internal references. The ideal reference was present in the same time window, had similar m/z, was consistently there, well separated from other peaks, was easily measured and quantitatively comparable between cases and controls. Each of these was then used to normalize a potential biomarker to compensate for the non-biologic variability between samples. The peak intensity of a candidate biomarker species was ratioed to the intensity of a co-eluting species. Normalization with the use of such an endogenous control typically improved the statistical difference between cases and controls for candidate peaks. Unnormalized raw and log normalized values were calculated for each of the potential biomarker candidates and retested statistically. Again, a p-value ⁇ 0.05 was used to define candidate serum biomarkers.
- Sensitivity is defined as the fraction of cases correctly identified by a given biomarker.
- the cases represent the AD diagnosis given to the subjects that provided the samples, and such diagnosis was made by clinicians and researchers at the Knight ADRC.
- Specificity reflects the fraction of controls correctly defined by a given biomarker, or in other words, the fraction of controls that were true negative controls correctly identified by the biomarker. Then two or more candidate markers were modeled to obtain combinations that provided better diagnostic discrimination.
- biomarker candidates with p-values less than 0.10 were considered because there is likelihood that some of these may be complementary to other candidate biomarkers even if they themselves do not satisfy criteria for statistical significance.
- Logistic regression analysis was also used to evaluate combinations of biomarkers to model the log-odds of developing AD.
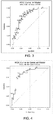
- a forward-selection statistical procedure was used. In this approach, the candidate markers were added to the model one at a time, beginning with each individual marker. The inclusion of other markers on a one by one basis was tested to see if the combination of the markers increased the area under the receiver operator curve (AUC, a measure of overall diagnostic utility) of at least 0.03. In this way it was possible to obtain combinations of biomarkers giving the highest possible AUCs. This defines our 'leave-one out' prediction approach. Several potentially useful panels of AD biomarkers were obtained this way. ROC curves were plotted once again to study the combined sensitivities and specificities of these multi-marker models.
- Biomarkers considered for biostatistical analysis in the initial study having significant ( ⁇ 0.05) or near significant ( ⁇ 0.1) p-values.
- each model was considered final when no additional marker improved the AUC by more than 0.03.
- the construction of these several models one for each biomarker as the starting point, it was also possible to determine which of those candidate markers showed up in more than one model. Markers occurring in several panels were considered to be the more promising biomarkers and these were considered further.
- There were 13 biomarkers that appeared in 10% or more of all the multi-marker models See Table 3).
- Table 3. A Set of 13 biomarkers that appeared in 10% or more of all the multi-marker models.
- the 13 candidate biomarkers that appeared in multiple panels in the first study were initially analyzed. After beginning chemical characterization of the 13 candidate biomarkers, two were found to be lipid dimers. While it is possible that dimerization may happen in the body, studies suggest that it can occur outside the body, perhaps even as part of instrumental analysis. Because of this, these two were considered potentially unreliable and have not been considered further at this time. It is noted, however, that these lipid dimers may be reevaluated in the future and determined to be useful multi-marker panel components, and as such continue to be considered to be within the present scope. Two compounds had such low abundances or were so conflated with other peaks that we could not reliably perform quantitation in the follow up study. Further analysis might be possible, and as such these may be reevaluated and reconsidered in the future. Six other candidate biomarkers were excluded for various reasons.
- POROS R1 reversed-phase capillary column media obtained from Applied Biosystems, Framingham, MA and columns were packed in house
- Mobile phase A was an aqueous solution water/acetonitrile/formic acid (98/2/0.1, v/v/v)
- mobile phase B was an organic solution acetonitrile/water/formic acid (98/2/0.1, v/v/v) respectively.
- the gradient elution began at 100% A for 2 min followed by a 1 min transition from 100% A to 95% A. This in turn was succeeded by a linear increase in organic phase (B) to 60% over the next 24 min.
- the mobile phase mix was increased linearly to 95% organic phase B/ 5% aqueous phase A over the next 7 min, then held at 95% organic phase B for 7 min and returned to 95% aqueous phase A over 5 min.
- the column was allowed to re-equilibrate until the end of the 58 min run.
- the cLC was interfaced with an Agilent 6530 Accurate-Mass Quadrupole Time-of-Flight mass spectrometer (QToF MS) equipped by means of an Agilent Dual ESI source.
- the Dual ESI source was operated in positive ion mode, and instrument parameters were set as follows: sheath gas temperature, 300°C; sheath gas flow, 5 L/min; nebulizer, 15 psi; dry gas temperature, 300°C; dry gas flow, 5 L/min; and capillary entrance voltage (VCap), 3500 V. Fragmentor and Skimmer1 were operated at 175 V and 65 V, respectively.
- the auto sampler temperature was maintained at 4°C.
- MS scan data were collected at a rate of 8 spectra/s over the range of m/z 400-3200. Data was acquired in profile mode.
- the instrument software MassHunter Data Acquisition B.05.01 (Agilent) and MassHunter Qualitative Analysis B.06.00 (Agilent) permitted effective data collection, extracting specific ion chromatograms and post hoc analysis.
- the cLC system was interfaced to a QSTAR Pulsar I quadrupole orthogonal time-of-flight mass spectrometer through an ESI IonSpray source (Applied Biosystems) set at 4800V. All experiments were carried out in positive ion mode. Samples run earlier were examined to find samples that naturally had a high concentration of the biomarker of interest. Samples were processed using acetonitrile precipitation and loaded as described above. Prior to MS2 runs, MS1 runs were undertaken to determine the elution time. For MS2 runs, 2-3 times the original amount of protein-depleted serum was loaded to enable easier detection of the lower intensity fragment peaks.
- the '.mgf file was uploaded and the parameters used for Mascot searches were: no enzyme digestion, Uni_human database, no modifications, peptide tolerance of 1.2 Da, and MS/MS tolerance of 0.6 Da. Protein Blast search was also used for peptides in an effort to identify the parent protein compound from which the peptide originated.
- Fragmentation studies for lipids and their identification were carried out using the same instrument parameters as described in peptide identification studies above. The primary difference was that 1 or 2 collision energies were sufficient for fragmenting lipids. The peaks produced by fragmentation remained quite consistent across different collision energies but rather showed differences in intensities.
- both instruments were used for fragmentation studies, each providing somewhat different information.
- the Dual ESI source was operated in positive ion mode and instrument parameters were set as follows: sheath gas temperature, 300°C; sheath gas flow, 5 L/min; nebulizer, 15 psi; dry gas temperature, 300°C; dry gas flow, 5 L/min; and capillary entrance voltage, 3500 V.
- Fragmentor and Skimmer1 were operated at 150 V and 65 V, respectively.
- the autosampler temperature was maintained at 4 °C.
- the MS scan data were collected at a rate of 1 spectra/s over a range of m/z 110-2000. Data was acquired in both profile and centroid modes.
- a reference solution having ions at m/z 121.050873 and 922.009798 was used during these experiments to calibrate the MS.
- Reference nebulizer pressure was maintained at 5 psi while auto calibration reference parameters were detection window, 20 ppm and minimum height, 1000 counts.
- the reference standards allowed us to correct unknown masses and also allowed us to determine the day-to-day drift in mass accuracy to insure no instrument adjustment needed to be made. In the case of lipids, where exact mass matters more, this can be an important control.
- the software, MassHunter Data Acquisition B.06.00 (Agilent), MassHunter Qualitative Analysis B.05.01 (Agilent) permitted direct on-line data collection, extracting specific ion chromatograms and analysis.
- MS scan rates and MS/MS scan rates were 1 spectra/sec although in a few cases scan rates of 2 spectra/sec were used. With a lower scan rate, more of the transients hit the detector, hence there was an increase in the gain, which helped in obtaining higher signal/noise ratio of the fragment ions. Data was collected in both centroid and profile modes.
- lipid biomarkers To further characterize lipid biomarkers, a search was performed on Lipidmaps, the primary database of known lipids using the mass of the neutral precursor ion ((M+H+) - H+). Fragmentation data are not available, and fragmentation spectra cannot be compared with archived fragmentation patterns. Consequently, the database provided a selection of elemental compositions having similar masses to the experimentally observed parent mass, from very similar m/z values to others that were more unlikely. Those closest in m/z to the molecule of interest were specifically focused on. Second, only those classes of lipids that contained the phosphatidylcholine, as seen for the AD biomarkers described here, were considered.
- Fragments were also found indicative of a glycerophosphatidylcholine. This indicated the general category of lipid. These measures limited the pool of candidates dramatically. Then a more careful analysis of the MS2 fragments was conducted, looking for fragments representing the 2 fatty acids that modified the glycerol backbone. This was often successful, but did not allow assignment of fatty acids to the sn1 or sn2 positions on the glycerol. In cases of lipid oxidation, chemically unsaturated fatty acids would be those predominantly modified, however in the MS2 fragmentation, the oxygen containing fatty acid may or may not remain intact.
- the class and elemental composition of a lipid can be determined, and the length and double bond character of fatty acids can be provided without knowing the location of the double bonds.
- the location of the fatty acids on the glycerol backbone cannot be determined as to which fatty acid is attached to sn1 and which to sn2.
- Oxidation of lipids can be determined including the general nature of the oxygen containing side group. Again, while oxidations will occur predominantly at double bonds, if there are more than one double bond present, which double bond(s) is involved cannot be conclusively determined by MS.
- Some biomarkers were oxidized lipid molecules and certain fragments indicative of loss of oxygen were observed. In case of hydroxylated species, fragment ions have odd number m/z value and show fragments representing neutral water loss (-18 mass units). For a neutral loss of 32 mass units, the likely explanation is the loss of -OOH. These oxidized lipids represent the effects of reactive oxygen species generated by oxidative stress processes in the human. Oxidized lipid molecules are not found in the Lipidmaps database.
- the extracted MS data obtained for the remaining biomarkers was sent to the independent arbiter who conducted the analyses and maintained the blind.
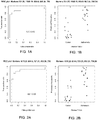
- m/z 602.3, 804.55 and 874.6 were significantly different between cases and controls for all 4 comparisons and followed the same trend as observed in Biomarker Study I.
- Table 4 shows results for of the validation of these biomarkers. Among the validated biomarkers, all were higher in the cases. This applied for comparisons between different stages of AD for these biomarkers as well.
- Table 4 - Student's t-test results Biomarker m / z Charge Retention Time (min) CDR 0 vs CDR >0 p-value CDR 0 vs CDR 0.5 p-value 602.3 1 19.5-22.5 0.0014 8.41x10 -5 804.55 1 33-35 3.60x10 -7 1.75x10 -8 874.59 1 40-44 6.37x10 -5 3.00x10 -5 804.53 1 39.5-41.5 9.48x10 -7 1.37x10 -6
- Table 4 provides the Student's t-test results showing p values obtained for the unnormalized validation data.
- Biomarker 602.3 Charge state 1 is a peptide with sequence of amino acids L/IAENR, data for which is shown in Table 5.
- Biomarker 804.55 (charge state 1, 33-35 min) is a glycerophosphatidylcholine with two fatty acid acyl side chains, one having 18 carbon atoms and 2 double bonds (18:2), and the other having 20 carbon atoms and 5 double bonds (20:5, very likely to be eicosapentaenoic acid). The positions of the double bonds can be difficult to determine with certainty.
- a fragment seen at m/z 542.3153 confirms the presence of a fatty acid (18:2) and a fragment observed at m/z 520.3815 confirms the presence of a second fatty acid (20:5).
- the molecular formula for its neutral and protonated states are as follows: [C 46 H 78 NO 8 P]+H + . 3.
- Biomarker 874.59 (charge state 1) is an oxidized glycerophosphatidylcholine.
- the molecular formula for the neutral and protonated species are [C 46 H 84 NO 12 P]+H + .
- the fatty acid side chains have 38 carbons total and 4 double bonds total.
- a peak in the MS2 is consistent with the presence of palmitic acid (C16:0). This indicates that the other fatty acid has 22 carbons and 4 double bonds.
- the second fatty acid has been oxidized, most likely as follows [22:4 + (-OOH) 2 ]+H + . Fragments show the loss of -OOH but not the loss of O or H 2 O (as would occur with a -OH group).
- Biomarker 804.53 Charge state 1 eluting at retention time 39.5-41.5 min is an oxidized glycerophosphatidylcholine having a neutral and protonated elemental composition of [C 42 H 78 NO 11 P+H + ].
- the glycerol molecule is modified by two fatty acids with total carbon number of 34 with 2 double bonds.
- One of the fatty acids is palmitic acid (C16:0) based on its fragment being present in the MS2 spectra.
- the other fatty acid is C18:2, and is the oxidized species. It likely contain one -OOH and one keto group.
- the second fatty acid, containing double bonds, has been oxidized and the same or similar oxidized lipid has been described (Pereira 2006).
Landscapes
- Life Sciences & Earth Sciences (AREA)
- Health & Medical Sciences (AREA)
- Engineering & Computer Science (AREA)
- Molecular Biology (AREA)
- Biomedical Technology (AREA)
- Immunology (AREA)
- Chemical & Material Sciences (AREA)
- Urology & Nephrology (AREA)
- Hematology (AREA)
- Physics & Mathematics (AREA)
- Food Science & Technology (AREA)
- Cell Biology (AREA)
- Biotechnology (AREA)
- Medicinal Chemistry (AREA)
- Microbiology (AREA)
- Analytical Chemistry (AREA)
- Biochemistry (AREA)
- General Health & Medical Sciences (AREA)
- General Physics & Mathematics (AREA)
- Pathology (AREA)
- Bioinformatics & Computational Biology (AREA)
- Proteomics, Peptides & Aminoacids (AREA)
- Bioinformatics & Cheminformatics (AREA)
- Biophysics (AREA)
- Spectroscopy & Molecular Physics (AREA)
- Neurology (AREA)
- Neurosurgery (AREA)
- Endocrinology (AREA)
- Investigating Or Analysing Biological Materials (AREA)
- Other Investigation Or Analysis Of Materials By Electrical Means (AREA)
- Measuring Or Testing Involving Enzymes Or Micro-Organisms (AREA)
Applications Claiming Priority (3)
| Application Number | Priority Date | Filing Date | Title |
|---|---|---|---|
| US201462019782P | 2014-07-01 | 2014-07-01 | |
| PCT/US2015/038914 WO2016004259A1 (fr) | 2014-07-01 | 2015-07-01 | Systèmes, essais et procédés de détermination de facteur de risque pour la maladie d'alzheimer |
| EP15814924.5A EP3164703B1 (fr) | 2014-07-01 | 2015-07-01 | Systèmes, essais et procédés de détermination de facteur de risque pour la maladie d'alzheimer |
Related Parent Applications (2)
| Application Number | Title | Priority Date | Filing Date |
|---|---|---|---|
| EP15814924.5A Division EP3164703B1 (fr) | 2014-07-01 | 2015-07-01 | Systèmes, essais et procédés de détermination de facteur de risque pour la maladie d'alzheimer |
| EP15814924.5A Division-Into EP3164703B1 (fr) | 2014-07-01 | 2015-07-01 | Systèmes, essais et procédés de détermination de facteur de risque pour la maladie d'alzheimer |
Publications (2)
| Publication Number | Publication Date |
|---|---|
| EP3674711A2 true EP3674711A2 (fr) | 2020-07-01 |
| EP3674711A3 EP3674711A3 (fr) | 2020-10-28 |
Family
ID=55019984
Family Applications (2)
| Application Number | Title | Priority Date | Filing Date |
|---|---|---|---|
| EP15814924.5A Not-in-force EP3164703B1 (fr) | 2014-07-01 | 2015-07-01 | Systèmes, essais et procédés de détermination de facteur de risque pour la maladie d'alzheimer |
| EP19201752.3A Withdrawn EP3674711A3 (fr) | 2014-07-01 | 2015-07-01 | Biomarqueurs et procédés permettant de déterminer les facteurs de risque de la maladie d'alzheimer |
Family Applications Before (1)
| Application Number | Title | Priority Date | Filing Date |
|---|---|---|---|
| EP15814924.5A Not-in-force EP3164703B1 (fr) | 2014-07-01 | 2015-07-01 | Systèmes, essais et procédés de détermination de facteur de risque pour la maladie d'alzheimer |
Country Status (3)
| Country | Link |
|---|---|
| US (1) | US10761100B2 (fr) |
| EP (2) | EP3164703B1 (fr) |
| WO (1) | WO2016004259A1 (fr) |
Families Citing this family (1)
| Publication number | Priority date | Publication date | Assignee | Title |
|---|---|---|---|---|
| KR20220062287A (ko) * | 2019-08-13 | 2022-05-16 | 워싱턴 유니버시티 | Mtbr 타우 아이소폼 검출 방법 및 이의 용도 |
Family Cites Families (3)
| Publication number | Priority date | Publication date | Assignee | Title |
|---|---|---|---|---|
| FI20115576A0 (fi) * | 2011-06-10 | 2011-06-10 | Teknologian Tutkimuskeskus Vtt Oy | Menetelmä Alzheimerin taudin diagnoimiseksi |
| US9091651B2 (en) | 2011-12-21 | 2015-07-28 | Integrated Diagnostics, Inc. | Selected reaction monitoring assays |
| WO2013151726A1 (fr) * | 2012-04-05 | 2013-10-10 | Integrated Diagnostics, Inc. | Procédés srm dans des essais de la maladie d'alzheimer et d'une maladie neurologique |
-
2015
- 2015-07-01 EP EP15814924.5A patent/EP3164703B1/fr not_active Not-in-force
- 2015-07-01 US US15/323,718 patent/US10761100B2/en active Active
- 2015-07-01 WO PCT/US2015/038914 patent/WO2016004259A1/fr not_active Ceased
- 2015-07-01 EP EP19201752.3A patent/EP3674711A3/fr not_active Withdrawn
Also Published As
| Publication number | Publication date |
|---|---|
| US20170138964A1 (en) | 2017-05-18 |
| EP3164703A1 (fr) | 2017-05-10 |
| WO2016004259A1 (fr) | 2016-01-07 |
| EP3674711A3 (fr) | 2020-10-28 |
| US10761100B2 (en) | 2020-09-01 |
| EP3164703B1 (fr) | 2020-10-28 |
| EP3164703A4 (fr) | 2017-11-08 |
Similar Documents
| Publication | Publication Date | Title |
|---|---|---|
| Gallien et al. | Selectivity of LC-MS/MS analysis: implication for proteomics experiments | |
| Cox et al. | The utility of metabolomics in natural product and biomarker characterization | |
| Angel et al. | Mass spectrometry-based proteomics: existing capabilities and future directions | |
| CN103392219B (zh) | 通过质谱法定量胰岛素 | |
| Ozohanics et al. | High-performance liquid chromatography coupled to mass spectrometry methodology for analyzing site-specific N-glycosylation patterns | |
| CN109946390B (zh) | 一种肺癌诊断标志物组合及应用 | |
| CN109564207B (zh) | 用于检测和定量代谢物的质谱方法 | |
| AU2007258970A1 (en) | Mass spectrometry biomarker assay | |
| JP2020517929A (ja) | 有機酸代謝物を検出かつ定量する質量分析法 | |
| Zellner et al. | The role of proteomics in dementia and Alzheimer’s disease | |
| CA3045022A1 (fr) | Methode de dosage par spectrometrie de masse permettant une detection et une quantification de metabolites de la fonction renale | |
| CN114624317A (zh) | 一种基于直接进样质谱的定性和定量分析方法 | |
| US11299555B2 (en) | Method for diagnosing alzheimer's disease using signal peptide as indicator | |
| Babaei et al. | Proteomics techniques in protein biomarker discovery | |
| US20080171394A1 (en) | Method For Diagnosing Multiple Sclerosis | |
| EP3164703B1 (fr) | Systèmes, essais et procédés de détermination de facteur de risque pour la maladie d'alzheimer | |
| CN120703370A (zh) | 一种预测非小细胞肺癌免疫治疗疗效的血浆生物标志物 | |
| KR20230169172A (ko) | 질량 분광법에 의한 인슐린-유사 성장 인자-i 변이체의 식별화 및 정량화 | |
| CN114062532A (zh) | 一种类风湿关节炎血液诊断试剂盒及其应用 | |
| EP2772759B1 (fr) | Composition pour diagnostic du cancer des poumons | |
| RU2673551C2 (ru) | Протеотипический пептид q9y4w6-02 и способ масс-спектрометрического анализа содержания afg3-подобного белка человека на его основе | |
| WO2013166343A2 (fr) | Essai de signature mrm-ms | |
| Baird | Clinical Chemistry, Including Therapeutic Drug Monitoring and Biomarkers for Diagnosis | |
| Rozek et al. | Proteomics and Genomics in Neuroimmunological Disorders | |
| Markhus et al. | Refining Platelet Purification Methods: Enhancing Proteomics for Clinical Applications |
Legal Events
| Date | Code | Title | Description |
|---|---|---|---|
| PUAI | Public reference made under article 153(3) epc to a published international application that has entered the european phase |
Free format text: ORIGINAL CODE: 0009012 |
|
| STAA | Information on the status of an ep patent application or granted ep patent |
Free format text: STATUS: THE APPLICATION HAS BEEN PUBLISHED |
|
| AC | Divisional application: reference to earlier application |
Ref document number: 3164703 Country of ref document: EP Kind code of ref document: P |
|
| AK | Designated contracting states |
Kind code of ref document: A2 Designated state(s): AL AT BE BG CH CY CZ DE DK EE ES FI FR GB GR HR HU IE IS IT LI LT LU LV MC MK MT NL NO PL PT RO RS SE SI SK SM TR |
|
| PUAL | Search report despatched |
Free format text: ORIGINAL CODE: 0009013 |
|
| AK | Designated contracting states |
Kind code of ref document: A3 Designated state(s): AL AT BE BG CH CY CZ DE DK EE ES FI FR GB GR HR HU IE IS IT LI LT LU LV MC MK MT NL NO PL PT RO RS SE SI SK SM TR |
|
| RIC1 | Information provided on ipc code assigned before grant |
Ipc: G01N 33/92 20060101ALI20200918BHEP Ipc: G01N 33/68 20060101AFI20200918BHEP |
|
| STAA | Information on the status of an ep patent application or granted ep patent |
Free format text: STATUS: REQUEST FOR EXAMINATION WAS MADE |
|
| 17P | Request for examination filed |
Effective date: 20210428 |
|
| RBV | Designated contracting states (corrected) |
Designated state(s): AL AT BE BG CH CY CZ DE DK EE ES FI FR GB GR HR HU IE IS IT LI LT LU LV MC MK MT NL NO PL PT RO RS SE SI SK SM TR |
|
| STAA | Information on the status of an ep patent application or granted ep patent |
Free format text: STATUS: THE APPLICATION HAS BEEN WITHDRAWN |
|
| 18W | Application withdrawn |
Effective date: 20230127 |