EP3689228A1 - Biosignalanalysevorrichtung mit verwendung von maschinenlernen und verfahren dafür - Google Patents
Biosignalanalysevorrichtung mit verwendung von maschinenlernen und verfahren dafür Download PDFInfo
- Publication number
- EP3689228A1 EP3689228A1 EP18930409.0A EP18930409A EP3689228A1 EP 3689228 A1 EP3689228 A1 EP 3689228A1 EP 18930409 A EP18930409 A EP 18930409A EP 3689228 A1 EP3689228 A1 EP 3689228A1
- Authority
- EP
- European Patent Office
- Prior art keywords
- bio
- concentration
- signal analysis
- chromophore
- output light
- Prior art date
- Legal status (The legal status is an assumption and is not a legal conclusion. Google has not performed a legal analysis and makes no representation as to the accuracy of the status listed.)
- Withdrawn
Links
- 238000004458 analytical method Methods 0.000 title claims abstract description 41
- 238000000034 method Methods 0.000 title description 16
- 238000010801 machine learning Methods 0.000 title description 5
- 238000005259 measurement Methods 0.000 claims abstract description 24
- 238000012549 training Methods 0.000 claims abstract description 21
- 239000000463 material Substances 0.000 claims abstract description 16
- 230000003287 optical effect Effects 0.000 claims description 17
- INGWEZCOABYORO-UHFFFAOYSA-N 2-(furan-2-yl)-7-methyl-1h-1,8-naphthyridin-4-one Chemical compound N=1C2=NC(C)=CC=C2C(O)=CC=1C1=CC=CO1 INGWEZCOABYORO-UHFFFAOYSA-N 0.000 claims description 10
- 108010002255 deoxyhemoglobin Proteins 0.000 claims description 10
- 108010064719 Oxyhemoglobins Proteins 0.000 claims description 9
- XLYOFNOQVPJJNP-UHFFFAOYSA-N water Substances O XLYOFNOQVPJJNP-UHFFFAOYSA-N 0.000 claims description 9
- 150000002632 lipids Chemical class 0.000 claims description 8
- 238000010586 diagram Methods 0.000 description 11
- 238000004364 calculation method Methods 0.000 description 9
- 238000004088 simulation Methods 0.000 description 9
- 238000000862 absorption spectrum Methods 0.000 description 7
- 108010054147 Hemoglobins Proteins 0.000 description 6
- 102000001554 Hemoglobins Human genes 0.000 description 6
- 238000005516 engineering process Methods 0.000 description 6
- 238000004422 calculation algorithm Methods 0.000 description 5
- 238000012545 processing Methods 0.000 description 5
- 238000002835 absorbance Methods 0.000 description 4
- 238000010521 absorption reaction Methods 0.000 description 4
- 230000006870 function Effects 0.000 description 3
- XUMBMVFBXHLACL-UHFFFAOYSA-N Melanin Chemical compound O=C1C(=O)C(C2=CNC3=C(C(C(=O)C4=C32)=O)C)=C2C4=CNC2=C1C XUMBMVFBXHLACL-UHFFFAOYSA-N 0.000 description 2
- 210000004556 brain Anatomy 0.000 description 2
- 230000000694 effects Effects 0.000 description 2
- 230000003595 spectral effect Effects 0.000 description 2
- UGFAIRIUMAVXCW-UHFFFAOYSA-N Carbon monoxide Chemical compound [O+]#[C-] UGFAIRIUMAVXCW-UHFFFAOYSA-N 0.000 description 1
- 102000008186 Collagen Human genes 0.000 description 1
- 108010035532 Collagen Proteins 0.000 description 1
- 108010061951 Methemoglobin Proteins 0.000 description 1
- 210000004204 blood vessel Anatomy 0.000 description 1
- 229910002091 carbon monoxide Inorganic materials 0.000 description 1
- 229920001436 collagen Polymers 0.000 description 1
- 238000004891 communication Methods 0.000 description 1
- 238000013135 deep learning Methods 0.000 description 1
- 238000011161 development Methods 0.000 description 1
- 230000005484 gravity Effects 0.000 description 1
- 210000002216 heart Anatomy 0.000 description 1
- 230000001678 irradiating effect Effects 0.000 description 1
- 238000004519 manufacturing process Methods 0.000 description 1
- 238000000691 measurement method Methods 0.000 description 1
- 210000000056 organ Anatomy 0.000 description 1
- 150000002894 organic compounds Chemical class 0.000 description 1
- 230000010363 phase shift Effects 0.000 description 1
- 238000012827 research and development Methods 0.000 description 1
- 238000001228 spectrum Methods 0.000 description 1
Images




Classifications
-
- A—HUMAN NECESSITIES
- A61—MEDICAL OR VETERINARY SCIENCE; HYGIENE
- A61B—DIAGNOSIS; SURGERY; IDENTIFICATION
- A61B5/00—Measuring for diagnostic purposes; Identification of persons
- A61B5/72—Signal processing specially adapted for physiological signals or for diagnostic purposes
- A61B5/7235—Details of waveform analysis
- A61B5/7264—Classification of physiological signals or data, e.g. using neural networks, statistical classifiers, expert systems or fuzzy systems
-
- A—HUMAN NECESSITIES
- A61—MEDICAL OR VETERINARY SCIENCE; HYGIENE
- A61B—DIAGNOSIS; SURGERY; IDENTIFICATION
- A61B5/00—Measuring for diagnostic purposes; Identification of persons
- A61B5/44—Detecting, measuring or recording for evaluating the integumentary system, e.g. skin, hair or nails
- A61B5/441—Skin evaluation, e.g. for skin disorder diagnosis
- A61B5/443—Evaluating skin constituents, e.g. elastin, melanin, water
-
- A—HUMAN NECESSITIES
- A61—MEDICAL OR VETERINARY SCIENCE; HYGIENE
- A61B—DIAGNOSIS; SURGERY; IDENTIFICATION
- A61B5/00—Measuring for diagnostic purposes; Identification of persons
- A61B5/0059—Measuring for diagnostic purposes; Identification of persons using light, e.g. diagnosis by transillumination, diascopy, fluorescence
-
- A—HUMAN NECESSITIES
- A61—MEDICAL OR VETERINARY SCIENCE; HYGIENE
- A61B—DIAGNOSIS; SURGERY; IDENTIFICATION
- A61B5/00—Measuring for diagnostic purposes; Identification of persons
- A61B5/0059—Measuring for diagnostic purposes; Identification of persons using light, e.g. diagnosis by transillumination, diascopy, fluorescence
- A61B5/0075—Measuring for diagnostic purposes; Identification of persons using light, e.g. diagnosis by transillumination, diascopy, fluorescence by spectroscopy, i.e. measuring spectra, e.g. Raman spectroscopy, infrared absorption spectroscopy
-
- A—HUMAN NECESSITIES
- A61—MEDICAL OR VETERINARY SCIENCE; HYGIENE
- A61B—DIAGNOSIS; SURGERY; IDENTIFICATION
- A61B5/00—Measuring for diagnostic purposes; Identification of persons
- A61B5/0059—Measuring for diagnostic purposes; Identification of persons using light, e.g. diagnosis by transillumination, diascopy, fluorescence
- A61B5/0082—Measuring for diagnostic purposes; Identification of persons using light, e.g. diagnosis by transillumination, diascopy, fluorescence adapted for particular medical purposes
-
- A—HUMAN NECESSITIES
- A61—MEDICAL OR VETERINARY SCIENCE; HYGIENE
- A61B—DIAGNOSIS; SURGERY; IDENTIFICATION
- A61B5/00—Measuring for diagnostic purposes; Identification of persons
- A61B5/145—Measuring characteristics of blood in vivo, e.g. gas concentration or pH-value ; Measuring characteristics of body fluids or tissues, e.g. interstitial fluid or cerebral tissue
- A61B5/1455—Measuring characteristics of blood in vivo, e.g. gas concentration or pH-value ; Measuring characteristics of body fluids or tissues, e.g. interstitial fluid or cerebral tissue using optical sensors, e.g. spectral photometrical oximeters
-
- A—HUMAN NECESSITIES
- A61—MEDICAL OR VETERINARY SCIENCE; HYGIENE
- A61B—DIAGNOSIS; SURGERY; IDENTIFICATION
- A61B5/00—Measuring for diagnostic purposes; Identification of persons
- A61B5/145—Measuring characteristics of blood in vivo, e.g. gas concentration or pH-value ; Measuring characteristics of body fluids or tissues, e.g. interstitial fluid or cerebral tissue
- A61B5/1455—Measuring characteristics of blood in vivo, e.g. gas concentration or pH-value ; Measuring characteristics of body fluids or tissues, e.g. interstitial fluid or cerebral tissue using optical sensors, e.g. spectral photometrical oximeters
- A61B5/14551—Measuring characteristics of blood in vivo, e.g. gas concentration or pH-value ; Measuring characteristics of body fluids or tissues, e.g. interstitial fluid or cerebral tissue using optical sensors, e.g. spectral photometrical oximeters for measuring blood gases
-
- A—HUMAN NECESSITIES
- A61—MEDICAL OR VETERINARY SCIENCE; HYGIENE
- A61B—DIAGNOSIS; SURGERY; IDENTIFICATION
- A61B5/00—Measuring for diagnostic purposes; Identification of persons
- A61B5/145—Measuring characteristics of blood in vivo, e.g. gas concentration or pH-value ; Measuring characteristics of body fluids or tissues, e.g. interstitial fluid or cerebral tissue
- A61B5/1455—Measuring characteristics of blood in vivo, e.g. gas concentration or pH-value ; Measuring characteristics of body fluids or tissues, e.g. interstitial fluid or cerebral tissue using optical sensors, e.g. spectral photometrical oximeters
- A61B5/14551—Measuring characteristics of blood in vivo, e.g. gas concentration or pH-value ; Measuring characteristics of body fluids or tissues, e.g. interstitial fluid or cerebral tissue using optical sensors, e.g. spectral photometrical oximeters for measuring blood gases
- A61B5/14552—Details of sensors specially adapted therefor
-
- A—HUMAN NECESSITIES
- A61—MEDICAL OR VETERINARY SCIENCE; HYGIENE
- A61B—DIAGNOSIS; SURGERY; IDENTIFICATION
- A61B5/00—Measuring for diagnostic purposes; Identification of persons
- A61B5/72—Signal processing specially adapted for physiological signals or for diagnostic purposes
- A61B5/7235—Details of waveform analysis
- A61B5/7264—Classification of physiological signals or data, e.g. using neural networks, statistical classifiers, expert systems or fuzzy systems
- A61B5/7267—Classification of physiological signals or data, e.g. using neural networks, statistical classifiers, expert systems or fuzzy systems involving training the classification device
-
- A—HUMAN NECESSITIES
- A61—MEDICAL OR VETERINARY SCIENCE; HYGIENE
- A61B—DIAGNOSIS; SURGERY; IDENTIFICATION
- A61B5/00—Measuring for diagnostic purposes; Identification of persons
- A61B5/72—Signal processing specially adapted for physiological signals or for diagnostic purposes
- A61B5/7271—Specific aspects of physiological measurement analysis
- A61B5/7275—Determining trends in physiological measurement data; Predicting development of a medical condition based on physiological measurements, e.g. determining a risk factor
Definitions
- the present invention relates to a bio-signal analysis apparatus using machine learning and a method therefor.
- SS steady-state
- FD frequency-domain
- TD time domain
- the bio-signal analysis apparatus calculates the concentration of chromophore concentration by generating a plurality of pieces of output light having different wavelengths by using an LD, a VCSEL or an LED as a light source, irradiating an object with the output light, and using measurement values for light emitted from the object.
- a calculation model that shows a relationship between the concentration of each chromophore in the object and characteristics of the output light such as an amplitude or a phase of the output light generated according thereto is used, and a fitting algorithm such as a least square method is performed based on the model, and thus, concentration of desirable chromophore is found out.
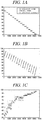
- FIGS. 1A, 1B and 1C illustrate diagrams for describing calculation results when a model for calculating the concentration of chromophore is applied to output light according to a general optical element type.
- Fig. 1A and Fig. 1B illustrate concentration of fat in the chromophore and are graphs illustrated by using a total of 6,400 pieces of simulation data.
- An X axis represents an identification number of each piece of experimental data, and an Y axis represents the concentration of chromophore.
- Fig. 1A illustrates results of using a VCSEL device, and it may be confirmed that concentration values (orange color) of fat obtained reversely again matches correctly by fitting simulation data for a concentration value (blue color) of fat in each case and VCSEL output light in the 6,400 pieces of data used in the simulation by using a calculation model.
- Fig. 1B illustrates a case of the LED, and it may be confirmed that the concentration value (blue color) of fat originally set in the simulation does not correctly match the concentration value (orange color) of fat fitted with the simulation data for the LED output light because the LED has a larger width of spectrum of wavelength than the VCSEL.
- Fig. 1C illustrates a simulation result for a VCSEL device and illustrates a result obtained by fitting concentration of hemoglobin rather than fat, and the same problem that prediction based on a current calculation model is not correct occurs even in the VCSEL device due to unique absorption characteristics of hemoglobin, in a case of chromophore such as the hemoglobin.
- An object of an embodiment of the present invention is to provide a bio-signal analysis apparatus and an operation method of the apparatus for performing bio-signal analysis by using a machine learning method without performing a fitting process of using a calculation model.
- an object to be achieved by the present embodiment is not limited to the objective described above, and other objectives may exist.
- a bio-signal analysis method uses a bio-signal analysis apparatus for analyzing a bio-signal based on output light emitted from an object after being output from a light source, and includes a step of providing a classification unit machine-trained based on training data in which measurement values for each wavelength of the output light and concentration for each of a plurality of chromophore materials match each other; a step of inputting the measurement values of the output light emitted from the object measured by the bio-signal analysis apparatus into the classification unit; and a step of outputting chromophore concentration output from the classification unit with respect to the input.
- the light source includes a plurality of light emitting elements for emitting output light having different wavelengths.
- a bio-signal analysis apparatus includes a plurality of light emitting elements that emit output light having different wavelengths to an object; at least one photodetector that detects the output light emitted from the object; and a control unit that is connected to the light emitting element and the photodetector to control operations of the light emitting element and the photodetector and calculates chromophore concentration based on a measurement value of an optical signal received through the photodetector.
- control unit includes a classification unit machine-trained based on training data in which measurement values for each wavelength of the output light and concentration for each of a plurality of chromophore materials match each other, and inputs the measurement values of the output light emitted from the object measured by the photodetector to the classification unit to calculate the chromophore concentration.
- a bio-signal analysis apparatus capable of providing classification results of the same performance as a VCSEL element may be implemented even when a relatively inexpensive LED element compared to a VCSEL element is used.
- improved classification performance for various chromophore materials may be provided.
- drawing number may change depending on drawings, drawing numbers are simply described for the sake of convenient explanation, and concepts, characteristics, functions, or effects of respective configurations are not limitedly interpreted by the corresponding drawing numbers.
- an "object” is a measurement target of a bio-signal analysis apparatus and may include a person, an animal, or a part thereof.
- the object may include various organs such as the heart, brain, or blood vessels, or various types of phantoms.
- FIG. 2 is a diagram illustrating a configuration of a bio-signal analysis apparatus according to an embodiment of the present invention.
- the bio-signal analysis apparatus 100 includes a plurality of light emitting elements 110, at least one photodetector 120, and a control unit 130.
- a laser diode (LD), a light emitting diode (LED), or a vertical cavity surface emitting laser (VCSEL) may be used as the light emitting element 110.
- Each light emitting element 110 may emit output light having different wavelengths.
- the light emitting element 110 may emit output light having a discrete wavelength.
- the discrete wavelength means a discontinuous wavelength and may be a wavelength in a near infrared ray region.
- eight light emitting elements 110 may be arranged to output eight wavelengths, and at this time, may emit in discrete wavelengths in a region of 650 to 1,100 nm (nano-meter).
- the number of the wavelengths may be changed depending on selection, but it is preferable that the number of wavelengths is equal to or greater than the number of chromophore materials.
- Each light emitting element 110 may emit light having different discrete wavelengths to an object 20 under a control of the control unit 130.
- the discrete wavelength emitted by each light emitting element 110 may be determined based on chromophore existing in the object 20, and specifically, may be determined based on the known light absorbance of each chromophore.
- the chromophore is an organic compound having an unsaturated bond and means an atom or an atomic group that absorbs light.
- the type of chromophores existing in a body is restrictive and known.
- water H 2 O
- lipid lipid
- oxy-hemoglobin O 2 Hb
- deoxy-hemoglobin HHb
- tissues such as the arms and legs
- FIG. 3 is a graph 200 illustrating an absorption spectrum of chromophores existing in the body.
- the chromophores have different absorption spectral characteristics in the near infrared region.
- water 201 has a peak characteristic in a wavelength region of approximately 980 nm
- lipid 202 has a peak characteristic in a wavelength region of approximately 930 nm
- oxy-hemoglobin 203 and deoxy-hemoglobin 204 intersect based on an isosbestic point 210 in a wavelength region of approximately 800 nm.
- the bio-signal analysis apparatus 100 includes at least four light emitting elements outputting four wavelengths and may emit light of four discrete wavelengths, which are determined based on light absorbance of water, lipid, oxy-hemoglobin, and deoxy-hemoglobin.
- the discrete wavelengths emitted by each light emitting element include a first discrete wavelength adjacent to a peak region of the water 201 and a second discrete wavelength adjacent to a peak region of the lipid 202, a third discrete wavelength prior to an isoabsorption point 210 of the known absorption spectra of the oxy-hemoglobin 203 and the deoxy-hemoglobin 204, and a fourth discrete wavelength in a region adjacent to the isoabsorption point 210.
- the third discrete wavelength may be selected in a region where a difference in absorbance between the oxy-hemoglobin 203 and the deoxy-hemoglobin 204 is great in consideration of the absorbance of the deoxy-hemoglobin 204.
- the first discrete wavelength may be approximately 975 nm
- the second discrete wavelength may be approximately 915 nm
- the third discrete wavelength and the fourth discrete wavelength may be approximately 688 nm and approximately 808 nm, respectively, and are not limited thereto.
- the bio-signal analysis apparatus 100 may include five, six, seven, or eight light emitting elements that emit additional discrete wavelengths in addition to the first to fourth discrete wavelengths described above.
- the fifth to eighth discrete wavelengths added accordingly may be determined according to peak characteristics of other chromophores other than the above-described chromophore (that is, water, lipid, oxy-hemoglobin, and deoxy-hemoglobin), and are not limited thereto.
- a multi-wavelength bio-signal analysis apparatus 100 may additionally select wavelengths in a region in which inclination of the absorption spectrum of each chromophore is relatively gentle, and may also additionally select wavelengths in a predetermined interval in a main region of the absorption spectrum of each chromophore.
- the fifth to eighth discrete wavelengths to be added may be determined according to the peak characteristics of the absorption spectrum of collagen, melanin, methemoglobin (methHb), carbon monoxide-binding hemoglobin (CO hemoglobin (COHb)), and the like other than the above-described chromophores.
- the fifth to eighth discrete wavelengths to be added may be determined based on the center of gravity of the absorption spectrum of the above-described chromophores, for example, a wavelength in a region of approximately 700 nm and/or approximately 800 nm.
- bio-signal analysis apparatus 100 is described as including four to eight light-emitting elements in the above description, the present invention is not limited to this, and may be implemented in a form including fewer or more light-emitting elements.
- the bio-signal analysis apparatus 100 may use a frequency-domain (FD) method of measuring changed amplitude and phase of a modulated light source, a bio-signal analysis method by emitting a continuous wave by using intensity of reflected light, or the like
- FD frequency-domain
- the photodetector 120 detects output light emitted from the object 200 and converts the detected output light into an electrical signal under a control of the control unit 130. At this time, the output light emitted from the object 200 includes output light emitted through the object.
- the photodetector 120 may amplify AC components of the converted electrical signal.
- the photodetector 120 may include at least one avalanche photodiode (APD) and is not limited thereto.
- APD avalanche photodiode
- the photodetector 120 may be implemented in various forms such as a photodiode, a photo transistor, a photo multiplier tube (PMT), and a photo cell.
- the photodetector may be implemented by including a new type of optical sensor according to development of technology.
- the photodetector 120 may digitize the amplified electrical signal and transmit digitized signal to the control unit 130.
- the photodetectors 120 may be arranged to be spaced apart from a plurality of light emitting elements 110 at a predetermined distance to receive output light emitted from the object.
- FIGS. 4A, 4B are diagrams illustrating optical characteristics of input light incident on an object by a light emitting element and output light detected by a photodetector.
- FIGS. 4A, 4B exemplarily illustrate a case of an FD method, and as illustrated in FIG. 4A , if the input light of the light emitting element is applied to the object 20, the input light is scattered and absorbed by various components including chromophore in the object 20.
- a graph 300 illustrated in FIG. 4B is a graph illustrating characteristics of input light L_ln and output light L-Out (that is, reflected light) in a frequency domain (FD).
- the input light L_ln of the light emitting element is applied to the object 20
- the reflected light L_Out detected by the photodetector 120 has characteristics of phase shift 301 and amplitude attenuation 302 with respect to the input light L_In.
- the control unit 130 controls overall operations of the bio-signal analysis apparatus 100.
- the control unit 130 may control a plurality of light emitting elements 110 and at least one photodetector 120 by executing a control program stored in a memory (not illustrated).
- the control unit 130 may be a processor used for a general-purpose computing device or may be implemented in the form of an embedded processor.
- the control unit 130 controls drive of the plurality of light emitting elements 110 by executing the control program and calculates concentration of the chromophore in the object 20, based on the digitized electric signal received from the at least one photodetector 120, and thus, a biological configuration of the object 20 is analyzed.
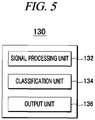
- FIG. 5 is a diagram illustrating a detailed configuration of the control unit according to an embodiment of the present invention.
- the control unit 130 includes configurations of a signal processing unit 132, a classification unit 134, and an output unit 136.
- each configuration element may be configured in the form of a software module, and functions of the signal processing unit 132, the classification unit 134, and the output unit 136 may be implemented through a memory and a processor of the control unit 130. That is, as the processor executes the bio-signal analysis program stored in the memory, the functions performed by the signal processing unit 132, the classification unit 134, and the output unit 136 are implemented.
- the signal processing unit 132 controls each light emitting element 110 to output light having a previously designated wavelength, and then receives and analyzes the optical signal sensed by the photodetector 120 to extract characteristic parameters of the optical signal. For example, optical characteristics such as a wavelength of the output light emitted from the object and intensity (amplitude) or phase of the output light for each wavelength are extracted. As such, measurement values for each wavelength of the output light emitted from the object is transmitted to the classification unit 134.
- the classification unit 134 is machine-learned based on training data in which the measurement values for each wavelength of the optical signal and concentration for each of a plurality of chromophore materials are matched each other based on a machine learning algorithm, and, and subsequently, if the measurement values for each wavelength of the output light emitted from the object is input, a concentration value for each chromophore material matching thereto is output.
- the classification unit 134 may be learned by using a machine learning algorithm such as multi-layer perceptron or deep learning. At this time, the training data used for learning of the classification unit 134 is obtained by matching the measurement values for each wavelength of the optical signal and concentration of the plurality of chromophore materials, respectively.
- a machine learning algorithm such as multi-layer perceptron or deep learning.
- FIG. 6 is a diagram illustrating an example of the training data used for the learning of the classification unit according to an embodiment of the present invention.
- one piece of unit training data is data in which the measurement value (for example, intensity of light) measured for each wavelength of the reflected output light and the concentration of the chromophore material matched with the measurement value are recorded.
- concentrations may be recorded by being separated from each other for each of the plurality of chromophore materials unlike this.
- the training data is collected according to a calculation model or other methods used for a conventional fitting algorithm, and the classification unit 134 which completes learning therethrough is mounted in each bio-signal analysis apparatus 100.
- the classification unit 134 may be updated by a manufacturing company or a user, and a data communication module therefor may be added to the bio-signal analysis apparatus 100.
- the output unit 136 receives the concentration for each chromophore material matching the optical signal measurement value from the classification unit 134 and outputs an appropriate bio-signal analysis result by using the concentration.
- FIGS. 7A, 7B , 8A, 8B , 9A and 9B are diagrams illustrating analysis results of the bio-signal analysis apparatus according to an embodiment of the present invention.
- FIG. 7A illustrates an example of the training data.
- An X axis represents an identification number of each training data and illustrates a total of 6,400 experimental data.
- An Y axis represents chromophore concentration matched to each training data, and in this example, concentration of water is illustrated.
- the classification unit 134 may be trained by using the training data.
- FIG. 7B illustrates classification results when measurement values for each wavelength band of an optical signal transmitted to the signal processing unit 132 are input to the classification unit 134 learned by using the training data described above. Unlike FIG. 1B , it may be confirmed that the values classified through the classification unit 134 matches the values of the training data.
- FIGS. 8A ,8B illustrate training data FIG. 8A for measuring concentration of fat in the chromophore and classification results FIG. 8B according thereto
- FIGS. 9A, 9B illustrate training data FIG. 9A for measuring concentration of hemoglobin in the chromophore and classification results FIG. 9B according thereto.
- an embodiment of the present invention may be implemented in the form of a recording medium including commands executable by a computer, such as program module operated by the computer.
- a computer readable medium may be any available medium that is accessible by the computer and may include both volatile and nonvolatile media and removable and non-removable media.
- the computer readable medium may include any computer storage medium.
- the computer storage medium includes both volatile and nonvolatile media and removable and non-removable media implemented in any method or technology for storing information such as computer readable commands, data structures, program modules, or other data.
Landscapes
- Health & Medical Sciences (AREA)
- Life Sciences & Earth Sciences (AREA)
- Physics & Mathematics (AREA)
- Engineering & Computer Science (AREA)
- Veterinary Medicine (AREA)
- Pathology (AREA)
- Biomedical Technology (AREA)
- Heart & Thoracic Surgery (AREA)
- Medical Informatics (AREA)
- Molecular Biology (AREA)
- Surgery (AREA)
- Animal Behavior & Ethology (AREA)
- General Health & Medical Sciences (AREA)
- Public Health (AREA)
- Biophysics (AREA)
- Artificial Intelligence (AREA)
- Computer Vision & Pattern Recognition (AREA)
- Physiology (AREA)
- Psychiatry (AREA)
- Signal Processing (AREA)
- Spectroscopy & Molecular Physics (AREA)
- Evolutionary Computation (AREA)
- Fuzzy Systems (AREA)
- Mathematical Physics (AREA)
- Optics & Photonics (AREA)
- Dermatology (AREA)
- Investigating Or Analysing Materials By Optical Means (AREA)
- Measurement Of The Respiration, Hearing Ability, Form, And Blood Characteristics Of Living Organisms (AREA)
Applications Claiming Priority (2)
| Application Number | Priority Date | Filing Date | Title |
|---|---|---|---|
| KR1020180095928A KR20200020341A (ko) | 2018-08-17 | 2018-08-17 | 기계 학습을 이용한 생체신호 분석 장치 및 그 방법 |
| PCT/KR2018/009808 WO2020036246A1 (ko) | 2018-08-17 | 2018-08-24 | 기계 학습을 이용한 생체신호 분석 장치 및 그 방법 |
Publications (2)
| Publication Number | Publication Date |
|---|---|
| EP3689228A1 true EP3689228A1 (de) | 2020-08-05 |
| EP3689228A4 EP3689228A4 (de) | 2021-09-29 |
Family
ID=69524807
Family Applications (1)
| Application Number | Title | Priority Date | Filing Date |
|---|---|---|---|
| EP18930409.0A Withdrawn EP3689228A4 (de) | 2018-08-17 | 2018-08-24 | Biosignalanalysevorrichtung mit verwendung von maschinenlernen und verfahren dafür |
Country Status (4)
| Country | Link |
|---|---|
| US (1) | US20200253561A1 (de) |
| EP (1) | EP3689228A4 (de) |
| KR (1) | KR20200020341A (de) |
| WO (1) | WO2020036246A1 (de) |
Cited By (1)
| Publication number | Priority date | Publication date | Assignee | Title |
|---|---|---|---|---|
| EP4162864A1 (de) * | 2021-10-07 | 2023-04-12 | Olive Healthcare Inc. | Verfahren zur analyse der körperzusammensetzung |
Families Citing this family (7)
| Publication number | Priority date | Publication date | Assignee | Title |
|---|---|---|---|---|
| US11466977B2 (en) | 2020-05-18 | 2022-10-11 | Massachusetts Institute Of Technology | Subcutaneous fat thickness measurement by Raman spectroscopy |
| KR102444393B1 (ko) * | 2020-09-25 | 2022-09-20 | 주식회사 올리브헬스케어 | 유방암 진단 시스템 |
| US12239422B2 (en) | 2020-10-22 | 2025-03-04 | Samsung Electronics Co., Ltd. | Apparatus for estimating biological-information and sensor for measuring multi-signal |
| KR102415949B1 (ko) * | 2021-08-24 | 2022-07-06 | (주)메디띵스 | 근적외선 기반 방광 상태 측정 장치 |
| KR102908194B1 (ko) | 2022-12-28 | 2026-01-05 | 전남대학교산학협력단 | 생체신호 모니터링에 의한 병원응급환자 신속대응 시스템 및 방법 |
| KR102716168B1 (ko) * | 2023-05-15 | 2024-10-15 | 주식회사 올리브헬스케어 | 유방암 진단 장치 및 방법 |
| KR20250076123A (ko) * | 2023-11-22 | 2025-05-29 | 주식회사 올리브헬스케어 | 유방암 진단 장치 및 방법 |
Family Cites Families (9)
| Publication number | Priority date | Publication date | Assignee | Title |
|---|---|---|---|---|
| US6124597A (en) * | 1997-07-07 | 2000-09-26 | Cedars-Sinai Medical Center | Method and devices for laser induced fluorescence attenuation spectroscopy |
| KR20090097904A (ko) * | 2007-01-05 | 2009-09-16 | 마이스킨 인크 | 피부 이미징을 위한 시스템, 디바이스 및 방법 |
| US20170176255A1 (en) * | 2012-05-09 | 2017-06-22 | Archimej Technology | Sample Analysis Methods |
| US9872621B2 (en) * | 2014-12-17 | 2018-01-23 | Intel Corporation | Multispectral measurement for improved biological signal acquisition |
| EP3302240A4 (de) * | 2015-05-26 | 2019-02-13 | BSX Athletics | Vorrichtung und verfahren zur bestimmung der konzentrationen an biologischen indikatoren in einem gewebe |
| US10888280B2 (en) * | 2016-09-24 | 2021-01-12 | Sanmina Corporation | System and method for obtaining health data using a neural network |
| KR102634161B1 (ko) * | 2015-10-28 | 2024-02-05 | 스펙트랄 엠디, 인크. | 조직 분류를 위한 반사 모드 멀티스펙트럴 시간 분해된 광학 이미징 방법들 및 장치들 |
| KR102002589B1 (ko) | 2016-07-21 | 2019-07-22 | 주식회사 올리브헬스케어 | 주파수 도메인 기반의 다파장 생체신호 분석 장치 및 그 방법 |
| WO2018112441A1 (en) * | 2016-12-15 | 2018-06-21 | Progenity Inc. | Ingestible device and associated methods |
-
2018
- 2018-08-17 KR KR1020180095928A patent/KR20200020341A/ko not_active Ceased
- 2018-08-24 WO PCT/KR2018/009808 patent/WO2020036246A1/ko not_active Ceased
- 2018-08-24 EP EP18930409.0A patent/EP3689228A4/de not_active Withdrawn
-
2020
- 2020-05-01 US US16/864,667 patent/US20200253561A1/en not_active Abandoned
Cited By (2)
| Publication number | Priority date | Publication date | Assignee | Title |
|---|---|---|---|---|
| EP4162864A1 (de) * | 2021-10-07 | 2023-04-12 | Olive Healthcare Inc. | Verfahren zur analyse der körperzusammensetzung |
| US12369854B2 (en) | 2021-10-07 | 2025-07-29 | Olive Healthcare Inc. | Methods for analyzing body composition |
Also Published As
| Publication number | Publication date |
|---|---|
| US20200253561A1 (en) | 2020-08-13 |
| EP3689228A4 (de) | 2021-09-29 |
| KR20200020341A (ko) | 2020-02-26 |
| WO2020036246A1 (ko) | 2020-02-20 |
Similar Documents
| Publication | Publication Date | Title |
|---|---|---|
| US20200253561A1 (en) | Bio-signal analysis apparatus using machine learning and method therefor | |
| KR102043330B1 (ko) | 주파수 도메인 기반의 다파장 생체신호 분석 장치 | |
| US11690513B2 (en) | Methods and system for multi-channel bio-optical sensing | |
| KR102033914B1 (ko) | 혈당 측정방법 및 이를 이용한 인체착용형 혈당 측정장치 | |
| US9279763B2 (en) | Apparatus and method for measuring an analyte such as bilirubin, using light | |
| KR102408951B1 (ko) | 글루코스 노출량 추정 장치 및 방법과, 글루코스 노출량 추정 모델 생성 장치 및 방법 | |
| JPWO2006040841A1 (ja) | 血糖値の非侵襲測定装置 | |
| CN103957793A (zh) | 测量装置、测量方法、程序和记录介质 | |
| JP6937927B2 (ja) | 生体信号を分析する信号処理装置及びこれを用いた生体信号分析装置 | |
| CN108814620A (zh) | 柔性生理信息监测装置 | |
| JP6613028B2 (ja) | 撮像装置 | |
| CN120514351A (zh) | 一种基于激光光源的健康检测装置及方法 | |
| CN102727219B (zh) | 非侵入式测量受检者的血液特性的校准方法和设置及传感器 | |
| KR20250092073A (ko) | 개선된 바이오센싱을 위해 개선된 관류 신호를 이용한 편광 광혈류 측정 | |
| KR102697426B1 (ko) | 생체정보 측정 장치 및 방법 | |
| KR100883153B1 (ko) | 혈당치의 비침습 측정 장치 | |
| CN115023185B (zh) | 用于确定光体积描记图的可穿戴设备和方法 | |
| Asare et al. | Multi-spectral photoplethysmography technique for parallel monitoring of pulse shapes at different tissue depths | |
| KR20240061731A (ko) | 중성지방 측정 장치 및 방법 | |
| JP2005169020A (ja) | 血中酸素飽和度検出装置 | |
| TW202527896A (zh) | 生理數值感測裝置及其感測方法 | |
| WO2026093938A1 (en) | Systems and methods for monitoring multiple tissue regions | |
| JP2019171012A (ja) | 生体情報測定装置及び生体情報測定方法、生体情報測定システム |
Legal Events
| Date | Code | Title | Description |
|---|---|---|---|
| STAA | Information on the status of an ep patent application or granted ep patent |
Free format text: STATUS: THE INTERNATIONAL PUBLICATION HAS BEEN MADE |
|
| PUAI | Public reference made under article 153(3) epc to a published international application that has entered the european phase |
Free format text: ORIGINAL CODE: 0009012 |
|
| STAA | Information on the status of an ep patent application or granted ep patent |
Free format text: STATUS: REQUEST FOR EXAMINATION WAS MADE |
|
| 17P | Request for examination filed |
Effective date: 20200429 |
|
| AK | Designated contracting states |
Kind code of ref document: A1 Designated state(s): AL AT BE BG CH CY CZ DE DK EE ES FI FR GB GR HR HU IE IS IT LI LT LU LV MC MK MT NL NO PL PT RO RS SE SI SK SM TR |
|
| AX | Request for extension of the european patent |
Extension state: BA ME |
|
| A4 | Supplementary search report drawn up and despatched |
Effective date: 20210826 |
|
| RIC1 | Information provided on ipc code assigned before grant |
Ipc: A61B 5/1455 20060101ALI20210820BHEP Ipc: A61B 5/00 20060101AFI20210820BHEP |
|
| DAV | Request for validation of the european patent (deleted) | ||
| DAX | Request for extension of the european patent (deleted) | ||
| STAA | Information on the status of an ep patent application or granted ep patent |
Free format text: STATUS: THE APPLICATION IS DEEMED TO BE WITHDRAWN |
|
| 18D | Application deemed to be withdrawn |
Effective date: 20220325 |