EP3746800B1 - Système de détection chimique - Google Patents
Système de détection chimique Download PDFInfo
- Publication number
- EP3746800B1 EP3746800B1 EP19743153.9A EP19743153A EP3746800B1 EP 3746800 B1 EP3746800 B1 EP 3746800B1 EP 19743153 A EP19743153 A EP 19743153A EP 3746800 B1 EP3746800 B1 EP 3746800B1
- Authority
- EP
- European Patent Office
- Prior art keywords
- representation
- model
- output
- sensing system
- analyte
- Prior art date
- Legal status (The legal status is an assumption and is not a legal conclusion. Google has not performed a legal analysis and makes no representation as to the accuracy of the status listed.)
- Active
Links
Images





Classifications
-
- G—PHYSICS
- G06—COMPUTING OR CALCULATING; COUNTING
- G06N—COMPUTING ARRANGEMENTS BASED ON SPECIFIC COMPUTATIONAL MODELS
- G06N3/00—Computing arrangements based on biological models
- G06N3/02—Neural networks
- G06N3/08—Learning methods
- G06N3/088—Non-supervised learning, e.g. competitive learning
-
- G—PHYSICS
- G01—MEASURING; TESTING
- G01N—INVESTIGATING OR ANALYSING MATERIALS BY DETERMINING THEIR CHEMICAL OR PHYSICAL PROPERTIES
- G01N35/00—Automatic analysis not limited to methods or materials provided for in any single one of groups G01N1/00 - G01N33/00; Handling materials therefor
- G01N35/00584—Control arrangements for automatic analysers
- G01N35/00722—Communications; Identification
-
- B—PERFORMING OPERATIONS; TRANSPORTING
- B82—NANOTECHNOLOGY
- B82Y—SPECIFIC USES OR APPLICATIONS OF NANOSTRUCTURES; MEASUREMENT OR ANALYSIS OF NANOSTRUCTURES; MANUFACTURE OR TREATMENT OF NANOSTRUCTURES
- B82Y15/00—Nanotechnology for interacting, sensing or actuating, e.g. quantum dots as markers in protein assays or molecular motors
-
- G—PHYSICS
- G01—MEASURING; TESTING
- G01N—INVESTIGATING OR ANALYSING MATERIALS BY DETERMINING THEIR CHEMICAL OR PHYSICAL PROPERTIES
- G01N33/00—Investigating or analysing materials by specific methods not covered by groups G01N1/00 - G01N31/00
- G01N33/0004—Gaseous mixtures, e.g. polluted air
- G01N33/0009—General constructional details of gas analysers, e.g. portable test equipment
- G01N33/0027—General constructional details of gas analysers, e.g. portable test equipment concerning the detector
- G01N33/0031—General constructional details of gas analysers, e.g. portable test equipment concerning the detector comprising two or more sensors, e.g. a sensor array
-
- G—PHYSICS
- G01—MEASURING; TESTING
- G01N—INVESTIGATING OR ANALYSING MATERIALS BY DETERMINING THEIR CHEMICAL OR PHYSICAL PROPERTIES
- G01N33/00—Investigating or analysing materials by specific methods not covered by groups G01N1/00 - G01N31/00
- G01N33/0004—Gaseous mixtures, e.g. polluted air
- G01N33/0009—General constructional details of gas analysers, e.g. portable test equipment
- G01N33/0027—General constructional details of gas analysers, e.g. portable test equipment concerning the detector
- G01N33/0031—General constructional details of gas analysers, e.g. portable test equipment concerning the detector comprising two or more sensors, e.g. a sensor array
- G01N33/0034—General constructional details of gas analysers, e.g. portable test equipment concerning the detector comprising two or more sensors, e.g. a sensor array comprising neural networks or related mathematical techniques
-
- G—PHYSICS
- G06—COMPUTING OR CALCULATING; COUNTING
- G06N—COMPUTING ARRANGEMENTS BASED ON SPECIFIC COMPUTATIONAL MODELS
- G06N3/00—Computing arrangements based on biological models
- G06N3/02—Neural networks
- G06N3/04—Architecture, e.g. interconnection topology
- G06N3/044—Recurrent networks, e.g. Hopfield networks
- G06N3/0442—Recurrent networks, e.g. Hopfield networks characterised by memory or gating, e.g. long short-term memory [LSTM] or gated recurrent units [GRU]
-
- G—PHYSICS
- G06—COMPUTING OR CALCULATING; COUNTING
- G06N—COMPUTING ARRANGEMENTS BASED ON SPECIFIC COMPUTATIONAL MODELS
- G06N3/00—Computing arrangements based on biological models
- G06N3/02—Neural networks
- G06N3/04—Architecture, e.g. interconnection topology
- G06N3/045—Combinations of networks
-
- G—PHYSICS
- G06—COMPUTING OR CALCULATING; COUNTING
- G06N—COMPUTING ARRANGEMENTS BASED ON SPECIFIC COMPUTATIONAL MODELS
- G06N3/00—Computing arrangements based on biological models
- G06N3/02—Neural networks
- G06N3/04—Architecture, e.g. interconnection topology
- G06N3/045—Combinations of networks
- G06N3/0455—Auto-encoder networks; Encoder-decoder networks
-
- G—PHYSICS
- G06—COMPUTING OR CALCULATING; COUNTING
- G06N—COMPUTING ARRANGEMENTS BASED ON SPECIFIC COMPUTATIONAL MODELS
- G06N3/00—Computing arrangements based on biological models
- G06N3/02—Neural networks
- G06N3/04—Architecture, e.g. interconnection topology
- G06N3/0464—Convolutional networks [CNN, ConvNet]
-
- G—PHYSICS
- G06—COMPUTING OR CALCULATING; COUNTING
- G06N—COMPUTING ARRANGEMENTS BASED ON SPECIFIC COMPUTATIONAL MODELS
- G06N3/00—Computing arrangements based on biological models
- G06N3/02—Neural networks
- G06N3/04—Architecture, e.g. interconnection topology
- G06N3/0475—Generative networks
-
- G—PHYSICS
- G06—COMPUTING OR CALCULATING; COUNTING
- G06N—COMPUTING ARRANGEMENTS BASED ON SPECIFIC COMPUTATIONAL MODELS
- G06N3/00—Computing arrangements based on biological models
- G06N3/02—Neural networks
- G06N3/08—Learning methods
- G06N3/0895—Weakly supervised learning, e.g. semi-supervised or self-supervised learning
-
- G—PHYSICS
- G06—COMPUTING OR CALCULATING; COUNTING
- G06N—COMPUTING ARRANGEMENTS BASED ON SPECIFIC COMPUTATIONAL MODELS
- G06N3/00—Computing arrangements based on biological models
- G06N3/02—Neural networks
- G06N3/08—Learning methods
- G06N3/09—Supervised learning
-
- G—PHYSICS
- G06—COMPUTING OR CALCULATING; COUNTING
- G06N—COMPUTING ARRANGEMENTS BASED ON SPECIFIC COMPUTATIONAL MODELS
- G06N3/00—Computing arrangements based on biological models
- G06N3/02—Neural networks
- G06N3/08—Learning methods
- G06N3/094—Adversarial learning
-
- G—PHYSICS
- G06—COMPUTING OR CALCULATING; COUNTING
- G06N—COMPUTING ARRANGEMENTS BASED ON SPECIFIC COMPUTATIONAL MODELS
- G06N3/00—Computing arrangements based on biological models
- G06N3/02—Neural networks
- G06N3/08—Learning methods
- G06N3/096—Transfer learning
-
- G—PHYSICS
- G01—MEASURING; TESTING
- G01N—INVESTIGATING OR ANALYSING MATERIALS BY DETERMINING THEIR CHEMICAL OR PHYSICAL PROPERTIES
- G01N35/00—Automatic analysis not limited to methods or materials provided for in any single one of groups G01N1/00 - G01N33/00; Handling materials therefor
- G01N35/00584—Control arrangements for automatic analysers
- G01N35/00722—Communications; Identification
- G01N2035/00891—Displaying information to the operator
-
- G—PHYSICS
- G06—COMPUTING OR CALCULATING; COUNTING
- G06N—COMPUTING ARRANGEMENTS BASED ON SPECIFIC COMPUTATIONAL MODELS
- G06N3/00—Computing arrangements based on biological models
- G06N3/02—Neural networks
- G06N3/04—Architecture, e.g. interconnection topology
- G06N3/044—Recurrent networks, e.g. Hopfield networks
Definitions
- Chemicals in the environment may include, for example, particulates and volatile organic compounds (“VOCs”) generated at hospitals, chemicals emanating from food spoilage, VOCs exhaled in breath, industrial and automobile exhausts, and early indications of processes such as disease, food spoilage, and combustion.
- VOCs volatile organic compounds
- Non patent literature publication " A comparative study of density models for gas identification using microelectronic gas sensor” by S. Brahim-Belhouari et al., Proceedings of the 3rd IEEE International Symposium on Signal Processing and Information Technology, ISSPIT 2003 , discloses the comparison of the accuracy of a range of advanced density models for gas identification from sensor array signals. Density estimation is applied in the construction of classifiers through the use of Bayes rule. The compared models are Gaussian mixture models, Generative topographic mapping, Probabilistic PCA mixture and K nearest neighbors.
- the system includes a component, which may be a sensor chip, that contains an array of nanocomposite sensors. These sensors are configured to produce a unique fingerprint for any given chemical or combination of chemicals.
- Each nanocomposite is, in general, sensitive to a particular chemical (e.g., ammonia), but is also cross-sensitive to other chemicals (e.g., acetone, carbon dioxide).
- individual sensors may lack high selectivity, an array of sensors formed from the combination of cross-sensitive polymers can generate a response pattern specific to a particular chemical combination.
- This approach allows for targeting a broad range of chemical analytes for identification and quantification. Additionally, this approach allows for creating large, centralized reference databases of chemical fingerprints, which can then be used to train machine-learning models capable of deconvolving the fingerprint of a complex mixture of chemicals.
- Some conventional chemical sensing systems are based on lock-and-key sensors responsive to only one chemical or are based on gas chromatography-mass spectrometry techniques that require equipment that is bulky and prohibitively expensive for many applications and are incapable of detecting chemicals in the environment in near real-time.
- the inventors have recognized and appreciated that conventional chemical sensing systems may be improved by providing a system that mitigates, at least in part, at least some of the limitations described above.
- Chemical sensors are physical devices that exhibit a measurable response to the presence of one or more chemical species.
- a chemical sensor array multiple chemical sensors are operated in the context of the same sensing application.
- chemical sensors are referred to as sensors and chemical sensor arrays are referred to as sensor arrays.
- a sensor can be operated in an environment that includes one or more chemical species. At least one of the chemical species in the environment may be present in a liquid phase and/or a gas phase.
- the concentration of the chemical species in the environment is quantified as a scalar value in conjunction with a chosen unit of measurement. For example, the concentration of gaseous methane in air can be quantified in terms of molar concentration.
- a sensor is configured to sense a concentration of one or more relevant chemical species (referred to herein as analytes) in the environment.
- concentration of analytes in the environment is referred to herein as the composition of the environment.
- a carbon monoxide detector can be configured to sense a concentration of carbon monoxide present in an environment also including other chemical species (e.g., oxygen and nitrogen).
- a sensor array is configured to detect M analytes, a unit of measurement defines an M-dimensional vector space V isomorphic to R M .
- the elements V' E V each uniquely describe a composition of the environment.
- the composition of the environment v as measured by a sensor may depend on a location of the sensor and may vary over time.
- FIGs. 1A and 1B depict views of an exemplary chemical sensing system 100.
- Chemical sensing system 100 includes a sensor array 120.
- Individual sensor outputs from a plurality of sensors in the array may exhibit incomplete information about the chemical species in the environment in which the chemical sensing system is placed. For example, each sensor output may exhibit a dependence on multiple, time varying extraneous variables (e.g., temperature, humidity, etc.) that are not well specified based on the output of that sensor alone.
- the chemical sensing system may be configured to estimate the chemical composition of an environment using multiple output signals generated by the multiple sensors in the array. As described in more detail below, some embodiments process the output from multiple sensors in an array using an inferential model to generate an estimate of a concentration of one or more chemical species in the environment.
- Chemical sensing system 100 includes a base 110 configured to support a sensor array 120.
- Base 110 may be implemented using any suitable substrate including, but not limited to, a circuit board.
- the sensor array 120 includes a plurality of sensors (e.g., sensor 121). The sensors may be arranged in rows and columns, as shown, or the sensors may be arranged in another arrangement (e.g., concentric circles, staggered rows, etc.). The described location and orientation of the sensors on chemical sensing system 100 are not intended to be limiting.
- Chemical sensing system 100 includes a controller 130.
- controller 130 is configured to provide power to the plurality of sensors.
- controller 130 is configured to acquire signals from the plurality of sensors.
- each of the sensors may include, or be a part of, a Wheatstone bridge or another circuit configured to measure changes in resistance.
- Controller 130 may be configured to provide power for the sensors and/or acquire signals from the sensors corresponding to changes in resistance measured by the sensors.
- controller 130 is further configured to provide one or more of signal conditioning, signal processing, and signal communication.
- controller 130 may be configured to filter and amplify signals received from the sensors.
- controller 130 is further configured to perform at least some of the mapping operations described in more detail below.
- controller 130 may be configured to implement one or more models relating the signals output by the sensors to a latent representation, or to an output representation having one or more axes corresponding to relevant analytes.
- controller 130 includes at least one storage device (e.g., a memory) configured to store parameters that define one or more of the mapping operations, described in more detail below.
- Chemical sensing system 100 includes a communications component 140, which can include hardware and/or software configured to enable chemical sensing system 100 to communicate with the chemical sensing system (or other devices).
- communications component 140 may include a network controller configured to provide local area network connectivity, a port controller configured to provide parallel port and/or serial port connectivity, and/or a wireless controller configured to provide WIFI, BLUETOOTH, ZIGBEE or similar connectivity.
- a sensor (e.g., sensor 121) includes a substrate 122 and one or more electrodes (e.g., electrodes 123a and 123b) disposed on substrate 122.
- a conductive thin film 124 is disposed on and between electrodes 123a and electrodes 123b as shown.
- thin film 124 can include conductive nanoparticles.
- thin film 124 is chemically sensitive.
- thin film 124 may undergo a physical change (e.g., swelling, contracting, and/or a change in composition or state) upon exposure to an analyte.
- Controller 130 may be configured to monitor the resistance between electrode 123a and electrode 123b, resulting in an output signal from the sensor that is detectable by controller 130.
- the output signal may include semantic information concerning one or more analytes introduced to the sensor.
- one or more of the sensors in sensor array 120 are configured with differing sensitivities to different analytes.
- thin films for different sensors in the array may be configured to provide different degrees of physical change in response to exposure to the same analyte.
- a thin film for a sensor can be configured to provide different degrees of physical change in response to exposure to different analytes.
- the output signals from different sensors in the array may differ in the presence of the same analyte and/or the output signal from the same sensor may differ in the presence of different analytes in the environment. These differences may include, but are not limited to, differences in amplitude and/or temporal characteristics of the output signal.
- FIG. 2A depicts an exemplary process 200 of mapping signals output by sensors (e.g., the sensors of chemical sensing system 100) to an output representation having bases corresponding to relevant analytes (e.g., the vector space V , described above).
- FIG. 2B depicts a sequence of exemplary representations (also referred to herein as models or sub-models) corresponding to the mappings of FIG. 2A .
- Process 200 can operate on input data (e.g., datasets, streaming data, files, or the like) divided into semantically separate partitions corresponding to different environmental and operational contexts. For example, the input data may be divided into multiple datasets, data streams, files, etc. corresponding to different sensors, times, contexts, environments, or the like.
- Such partitions may contain multiple input data entries, one input data entry, or no input data entries.
- the datasets and data streams may be viewed as composites of the individual semantic partitions, and the analyses applied to the datasets and data streams may be equivalently applied to semantic partitions and vice-versa.
- the input data may include output signals obtained from sensors (e.g., raw data output from the sensors) and/or data derived from the signals output from the sensors (e.g., one or more features extracted from the output signals).
- the output signals obtained from the sensors may be filtered to reduce noise in the output signals. Any suitable filtering technique may be used depending on the nature of the sensor response and the noise present in the output signals. Unless otherwise specified, the output signals described herein may be either filtered output signals or non-filtered output signals.
- the input data includes time values.
- the input data may include timestamps corresponding to output signal values.
- time values may be implicitly determined from the data.
- the input data may include an initial timestamp and a sampling frequency such that time values for input data following the initial timestamp may be determined based on the initial timestamp and the sampling frequency.
- the input data includes concentration information corresponding to the output signals.
- the input data When the input data lacks concentration information for all of the relevant analytes, the input data is referred to herein as “unlabeled data.”
- the input data When the input data lacks concentration information for some of the relevant analytes, the input data is referred to herein “partially labeled data.”
- the input data When the input data includes concentration information for all of the relevant analytes, the input data is referred to herein as “labeled data.”
- the input data includes contextual information.
- the contextual information may include, for example, information about the environment of the device such as the temperature of the environment, the application the system is employed in, explicit information about the presence or absence of irrelevant analytes, or other contextual information relating to the operation of the sensor array.
- process 200 is implemented by sequentially applying two models to the data.
- the one or more models may include parameters and hyper-parameters stored in a memory component of the chemical sensing system.
- the parameters are learned using machine learning techniques, examples of which are described in more detail below.
- a chemical sensing system configured to apply the sequence of two models according to the learned parameters and hyper-parameters to output signals may infer a chemical composition of an environment from the output signals.
- a sequence of models that collectively map the input data to the output representation (e.g., the vector space V , described above) is generated in place of a single model that performs the same function.
- Using a sequence of models may improve the flexibility of the chemical sensing system.
- the effect of each individual model may be more easily reviewed and/or interpreted when using a sequence of models that collectively map the input data to the output representation, allowing for convenient adjustment or debugging of individual models.
- the sequence of models includes a first model that relates the output signals to an intermediate representation (e.g., a feature representation, latent representation, or straightened orthogonal representation, as described herein) and a second model that relates the intermediate representation to the output representation.
- an intermediate representation e.g., a feature representation, latent representation, or straightened orthogonal representation, as described herein
- a second model that relates the intermediate representation to the output representation.
- Different versions of the first model may be specific to different implementations or instances of chemical sensing system 100.
- different versions of the second model may relate the intermediate representation to different output representations.
- an appropriate version of the first model may be used together with the appropriate version of the second model.
- the two models may be generated separately (e.g., at different times or locations, or by different devices), or applied separately.
- a first chemical sensing system can apply the first model to the output signals to generate the intermediate representation.
- a second chemical sensing system can subsequently apply the second model to the intermediate representation to generate the output representation.
- the first model can be specific to the first device.
- a first device-specific model can be trained to map input data acquired by the first device to the intermediate representation.
- the first device-specific model can subsequently be used to specify initial parameters for training additional device-specific models.
- the second model can be trained independent of any particular device. For example, when the second model is implemented as a device-independent model, it can be trained to map input data from intermediate representations generated by one or more device-specific models to the output representation.
- first and second models includes at least two sub-models, each of which divides the mapping for a model into multiple sub-mappings which may undergo a separate learning process.
- the second model is divided into a first sub-model relating the feature representation output from the first model to a latent representation, a second sub-model relating a latent representation to a straightened orthogonal representation, the second model may also comprise a third sub-model relating a straightened orthogonal representation to the output representation.
- one or more of the models or sub-models are trained using parametric techniques, such as support vector machines, random forests or deep neural networks.
- one or more of the models or sub-models are trained using non-parametric techniques, such as t-distributed stochastic neighbor embedding (t-SNE) or k-nearest neighbors techniques (k-NN).
- the corresponding elements of a ( t i ) may include an element (a "null element") indicating the unavailability of such information (e.g., a default value, a NaN, or the like).
- a ( t i ) may be a vector of null elements.
- a data entry D ( t i ) is referred to as "unlabeled" when all elements of a ( t i ) are null elements, partially labelled when some but not all elements of a ( t i ) are null elements, and D ( t i ) is referred to as "labelled" when none of the elements of a ( t i ) are null elements.
- C ( t i ) may include a vector of contextual information, such as the contextual information described above.
- sensors e.g., sensors in sensor array 120 of a sensing device (e.g., chemical sensing system 100) may transduce a chemical signal v dependent on the composition of the environment into electrical output signals x ( t ) (e.g., from chemical sensing system 100 to output signals 211, as depicted in FIG. 2B ).
- the values of output signals 211 may reflect changes in the composition of the environment over time.
- these output signals may include transient changes in value in response to a change in the composition of the environment. For example, a baseline value prior to the change in the composition of the environment may be approximately the same as a steady-state value reached after the change in the composition of the environment. In various embodiments, these output signals may reach a new steady-state value dependent on the changed composition of the environment.
- the output signals are applied to a model that relates output signals to a feature representation (e.g., a mapping from output signals 211 to feature representation 221, as depicted in FIG. 2B ) to generate feature vectors corresponding to the output signals.
- a feature representation e.g., a mapping from output signals 211 to feature representation 221, as depicted in FIG. 2B
- the model may de-convolve relevant information from the output signals.
- the relationship established by the model can be expressed, for an output signal x i ( t ), as a map to a feature representation, ⁇ i : R T i ⁇ R K i , where T i denotes some (possibly infinitely large) number of samples that span some time interval [ t 1 , t T i ], and K i denotes a number of features extracted from the output signal.
- the number of maps ⁇ i may not equal the number of output signals x i ( t ). For example, features may not be extracted from some output signals (resulting in fewer maps), or features may be extracted from combinations of output signals in addition to individual output signals (resulting in additional maps). In general, when the number of output signals is N, the number of maps ⁇ i will be equal to N'.
- such a composite feature vector is referred to as a feature vector.
- the span of all possible feature vectors z be denoted as the feature space Z , where Z ⁇ R K .
- N may be a large number
- K may be larger than N.
- numerical methods applied in Z may suffer from the curse of dimensionality.
- a change in concentration ⁇ v may yield a non-linear change ⁇ z in the feature vector, which may, in some cases, preclude the use of linear dimensionality reduction techniques.
- properties of the feature space Z may be used to associate feature vectors with analytes, without relying on vectors of concentrations of relevant analytes (e.g., without relying on a ( t i )).
- These associations may be used to train models that implement mappings imposing straightness and orthogonality conditions on the data. For example, an association can be created between feature vectors corresponding to varying concentrations of the same analyte.
- a model can be generated, using this association, that implements a mapping to a representation in which points corresponding to the feature vectors are aligned along a single vector.
- a first association can be created between first feature vectors corresponding to varying concentrations of a first analyte and a second association can be created between second feature vectors corresponding to varying concentrations of a second analyte.
- a model can be generated, using the first and second associations, that implements a mapping to a representation in which first points corresponding to the first feature vectors are aligned along a first vector, second points corresponding to the second feature vectors are aligned along a second vector, and the first vector and second vector are orthogonal.
- an iterative process is used to identify feature vectors corresponding to varying concentrations of a single analyte. This process can be performed automatically (e.g., without user direction or input). This approach assumes that feature vectors corresponding to varying concentrations of a single analyte are on the outside, or hull, of manifold Z' . Points in Z' corresponding to combinations of two or more analytes may lie between these exterior points, either on the hull of manifold Z' or in the interior of manifold Z' .
- a sequence of samples including a fixed concentration of a first analyte and decreasing concentrations of a second analyte approach a location in Z' corresponding to the fixed concentration of a first analyte along a first trajectory.
- a sequence of samples including the fixed concentration of the first analyte and decreasing concentrations of a third analyte approach the location in Z' corresponding to the fixed concentration of the first analyte along a second trajectory, distinct from the first trajectory.
- a space D is initialized to equal space Z and includes all of the points in space Z .
- a point z 1 in D is selected.
- Another point z 2 in a neighborhood of z 1 is selected and a vector z 1 z 2 is created.
- a sequence of points is then identified, each point in the sequence in a neighborhood of the preceding point in the sequence satisfying a directionality criterion with respect to z 1 z 2 . Satisfaction of this directionality criterion may indicate that a point is sufficiently aligned with the vector z 1 z 2 .
- the directionality criterion may depend on a vector between the preceding point in the sequence and the current point in the sequence.
- the directionality criterion may depend on a cosine value of the angle between z 1 z 2 and the vector. When the cosine value is less than a threshold, the directionality criterion may not be satisfied.
- a first point z 3 in the sequence may be in a neighborhood of z 2 and may satisfy the directionality criterion when a cosine value of the angle between z 1 z 2 and z 1 z 3 is greater than a threshold.
- the directionality criterion may depend on a distance from the next point in the sequence to a projection of the vector z 1 z 2 . The sequence may end when no further point can be identified along this direction.
- Additional sequences can be generated in this fashion for all points z 1 in Z and z 2 in the neighborhood of z 1 .
- the set of final points E for all of the sequences may then define a boundary space in D .
- the space D can be updated to include only the boundary points E .
- the process of identifying boundary points can then be repeated to generate a new set of final points E .
- E comprises a set of one-dimensional manifolds that cross an origin corresponding to an absence of a sensor response.
- Each of these one-dimensional manifolds comprises feature vectors corresponding to pure chemicals or base analytes.
- feature vectors can be associated with one-dimensional manifolds correspondent to the base analytes. This association can then be used to perform unsupervised learning in operations 241 and 251, without relying on labels for the samples.
- semi-supervised techniques partial availability of labels indicating concentrations associated with feature vectors can help validate the formation of each map and space by comparing a label for a sample with a position corresponding to the sample in each space. Partial labels can also be used to label an axis corresponding to base analytes. For example, when a sample lies on or near an axis and a label for the sample indicates concentrations of analytes, the axis can be labeled as corresponding to the analyte having the greatest concentration.
- x ( t ) may be continuous with respect to changes in v ( t ).
- Mapping ⁇ may be selected so as to preserve the continuity of ⁇ z ( t ) with respect to ⁇ v ( t ).
- the one-to-one mapping H -1 is a homeomorphism.
- a homeomorphism H then exists between Z' and V .
- Z' comprises a manifold of dimension M embedded in Z (as depicted in feature space 221 of FIG. 2B ).
- each dimension of V maps to a one-dimensional, potentially non-linear manifold embedded in Z' .
- the mapping ⁇ from Z' and V may thus be decomposed into sub-mappings.
- sub-models may implement these sub-mappings. Such sub-models may be easier to generate than a model that implements H, and may provide additional flexibility to the chemical sensing system.
- the feature vectors generated in operation 220 can be applied to a first sub-model that relates the feature representation Z to a latent representation ⁇ (e.g., from feature representation 221 to latent representation 231, as depicted in FIG. 2B ) to generate latent value vectors corresponding to the feature vectors.
- the latent representation ⁇ can be an inner product space.
- the latent representation ⁇ can be of the same dimension as the manifold Z' .
- the latent representation ⁇ may be a two-dimensional space (e.g., latent representation 231, as depicted in FIG. 2B ).
- the mapping ⁇ : Z ⁇ ⁇ fulfills the following conditions: ⁇ is a continuous mapping between Z' and ⁇ , ⁇ is bijective from Z' to ⁇ , ⁇ -1 is a continuous mapping between ⁇ and Z' , and ⁇ -1 is bijective from ⁇ and Z' .
- the above conditions may follow from the homeomorphism between Z' and ⁇ .
- the latent value vectors generated in operation 230 can be applied to a second sub-model that relates the latent representation ⁇ to a straightened, orthogonalized representation ⁇ .
- this second sub-model includes two component models. As described above, multiple component models may provide more flexibility and be more easily interpreted than a single model providing the same functionality.
- the latent value vectors generated in operation 230 can be applied to the first component model to generate aligned vectors corresponding to the latent value vectors (e.g., from latent representation 231 to straightened representation 241, as depicted in FIG. 2B ).
- the first component model may relate latent representation ⁇ to straightened representation ⁇ .
- latent representation ⁇ samples including varying concentrations of a single analyte may be described by a non-linear, one-dimensional manifold.
- the first component model may implement a mapping ⁇ : ⁇ ⁇ ⁇ that maps each such manifold to a straightened non-linear, one-dimensional manifold in ⁇ .
- two differing concentrations of the same analyte may map to two latent value vectors (e.g., p 1 , p 2 ⁇ ⁇ ).
- Mapping ⁇ may map p 1 and p 2 to s 1 , s 2 ⁇ ⁇ such that an angle between s 1 and s 2 is minimized.
- ⁇ may be determined such that cosine distance d ( s 1 , s 2 ) is maximized.
- ⁇ may reduce to the identity function.
- the mapping ⁇ : ⁇ ⁇ ⁇ fulfills the following conditions: ⁇ is a continuous mapping between ⁇ and ⁇ , ⁇ is bijective from ⁇ to ⁇ , ⁇ -1 is a continuous mapping between ⁇ and ⁇ , and ⁇ -1 is bijective from ⁇ to ⁇ .
- the above conditions may follow from the homeomorphism between ⁇ and ⁇ .
- function ⁇ may reduce the impact of noisy data, as ⁇ may align latent value vectors in ⁇ corresponding to noisy measurements of the same analyte along the same direction in ⁇ .
- the latent value vectors generated in operation 230 can be applied to the second component model to generate independent vectors corresponding to the aligned vectors (e.g., from straightened representation 241 to orthogonal, straightened representation 251, as depicted in FIG. 2B ).
- the second component model may relate straightened representation ⁇ to straightened, orthogonal representation ⁇ .
- straightened representation ⁇ varying concentrations of the same analyte may map to a straightened, non-linear, one-dimensional manifold (e.g., straightened representation 241, as depicted in FIG. 2B ).
- the second component model may implement a mapping ⁇ : ⁇ ⁇ ⁇ that maps such manifolds to orthogonal, straightened non-linear, one-dimensional manifolds in ⁇ .
- ⁇ two samples of two different analytes (e.g., v 2 ⁇ v 1 , v 1 , v 2 ⁇ V ) may map to two independent vectors (e.g., s 1 , s 2 ⁇ ⁇ ).
- Mapping ⁇ may map s 1 and s 2 to q 1 , q 2 ⁇ ⁇ such that an angle between q 1 and q 2 is maximized.
- ⁇ may be determined such that cosine distance d ( q 1 , q 2 ) is minimized.
- the mapping ⁇ : ⁇ ⁇ ⁇ fulfills the following conditions: ⁇ is a continuous mapping between ⁇ and ⁇ , ⁇ is bijective from ⁇ to ⁇ , ⁇ -1 is a continuous mapping between ⁇ and ⁇ , and ⁇ -1 is bijective from ⁇ to ⁇ .
- function ⁇ may reduce the impact of noisy data, as ⁇ may map aligned vectors in ⁇ corresponding to noisy measurements of different analyte along orthogonal directions in ⁇ .
- the independent, aligned vectors generated in operation 250 can be applied to a third sub-model that relates the orthogonal, straightened representation ⁇ to the output representation V .
- this third sub-model can include two component models. As described above, multiple component models may provide more flexibility and be easier to train than a single model providing the same functionality.
- the first component model can be configured to align the orthogonal, straightened manifolds corresponding to varying concentrations of differing analytes with the standard basis vectors of R M (e.g., from orthogonal, straightened representation 251 to standard basis representation 261, as depicted in FIG. 2B ).
- the first component model can be configured to implement a mapping ⁇ : ⁇ ⁇ U that maps manifolds corresponding to varying concentrations of a single base analyte to the standard basis vectors e i of R M .
- samples including varying concentrations of a first analyte can lie on a first one-dimensional, straightened manifold in ⁇ .
- Samples including varying concentrations of the second analyte can lie on a second one-dimensional, straightened manifold in ⁇ , orthogonal to the first one-dimensional, straightened manifold.
- ⁇ When the chemical system is configured to detect additional relevant analytes, the representation ⁇ will contain more manifolds corresponding to these additional relevant analytes, which will be mapped to additional standard basis vectors e i of R M .
- ⁇ may comprise one or more rotation matrices.
- the parameters comprising parameter set ⁇ may be values in the one or more rotation matrices.
- the second component model can be configured to map from the manifolds corresponding to single analytes in U to linearized manifolds corresponding to single analytes in V (e.g., from standard basis representation 261 to output representation 271, as depicted in FIG. 2B ).
- the first component model can be configured to implement a mapping ⁇ : U ⁇ V that maps the standard basis representation U to output representation V .
- the relationship between concentrations of analytes in the environment and values in output representation V may be linear.
- process 200 is intended to be exemplary and non-limiting.
- one or more acts of process 200 may be omitted.
- act 230 may be omitted when the Z' is not embedded in Z .
- acts 240 and 250 may be omitted when the one-dimensional manifolds corresponding to the varying concentrations of single analytes do not require straightening or orthogonalization.
- the association of one-dimensional manifolds in ⁇ with analytes and the generation of output representation V can be combined into a single act.
- each element of V may be described by a unique directional vector ⁇ k in ⁇ .
- the collection of M vectors ⁇ k may define a basis for ⁇ .
- G reduces to the identity function.
- v may be recovered by a mapping ⁇ 2 : U ⁇ V that maps to output representation V.
- FIGs. 3A to 3G depict an example of domain transfer between two instances of a chemical sensing system in accordance with some embodiments.
- the first instance of the chemical sensing system (depicted in FIG. 3A ) may gather input data using a first instance of chemical sensing system 100 and the second instance of the chemical sensing system (depicted in FIG. 3B ) may gather input data using a second instance of chemical sensing system 100.
- These two instances of chemical sensing system 100 may differ due to normal manufacturing variations, or may include differing types of chemical sensor or differing models or versions of the same type of chemical sensor.
- the input data gathered by the first instance of the chemical sensing system may differ from the input data gathered by the second instance of the chemical sensing system (depicted in FIG. 3D ) when exposed to the same stimulus under the same conditions.
- Unsupervised learning for example using the techniques described herein for identifying manifolds corresponding to varying concentrations of a single analyte, may be used to generate a representation ⁇ from the output signals obtained in each instance.
- Supervised learning techniques for domain adaptation may then be applied to map the representation ⁇ for each instance (e.g., as depicted in FIG. 3E and FIG. 3F ) to a common output representation V (e.g., as depicted in FIG. 3G ), instead of attempting to apply such techniques at the feature extraction step.
- the approach disclosed with regards to FIGs. 3A to 3G may enable a model trained using data acquired using a first chemical sensing system to be applied to data acquired using another chemical sensing system on which the model has not been trained.
- these two chemical sensing systems may differ due to normal manufacturing variations, or may include differing types of chemical sensor or differing models or versions of the same type of chemical sensor.
- the encoded information from the two chemical sensing systems can be processed through separate instances of the same learning process, determining the representation ⁇ for each chemical sensing system via unsupervised or semi-supervised learning techniques before mapping these non-linearized output representations to the common output representation V .
- FIG. 4 depicts an exemplary process 400 for learning mappings from signals output by sensors to a latent representation of these output signals.
- Process 400 can be performed on a chemical sensing system including a data repository 401, which may be a database hosted on a first computing device or any other suitable data structure stored on a storage device.
- the database may be configured to store output signals received from sensors.
- the database can also be configured to store intermediate values generated by the application of one of more mappings to the output signals.
- the chemical sensing system can include a model repository 406, which may be a database hosted on the first computing device or another computing device.
- the models stored can include at least some of the models described above, with regard to FIGs. 2A and 2B .
- model repository 406 can be configured to store a model implementing mapping ⁇ from output signals to feature vectors and a model implementing mapping ⁇ from feature vectors to latent vectors.
- the chemical sensing system can be configured to acquire data (e.g., output signals) using a chemical sensing system, such as chemical sensing system 100, described above with regard to FIG. 1 .
- the chemical sensing system is configured to acquire the data in batches in act 402.
- the chemical sensing system may be configured to determine whether an update criterion is satisfied. Satisfaction of this update criterion may indicate that the data in the new batch introduces new information.
- the chemical sensing system may therefore be configured to update one or more of mapping ⁇ and ⁇ to reflect this new information.
- satisfaction of the update criterion depends on a value of the mutual information between the new batch of data and the previously-received batch of data.
- the chemical sensing system when the update criterion is satisfied, is configured to update the feature extraction map ⁇ in act 403.
- the mapping ⁇ may be parameterized.
- the chemical sensing system may be configured to update mapping ⁇ by updating the parameters of mapping ⁇ using a machine learning technique in act 403. The updated parameters may then be stored in the model repository 406.
- the chemical sensing system may be configured to process the received output signals using the updating mapping ⁇ to update representation Z with updated feature vectors in act 404.
- the chemical sensing system can update the mapping ⁇ using feature vectors in updated representation Z .
- mapping ⁇ may be parameterized.
- the chemical sensing system may be configured to update mapping ⁇ by updating the parameters of mapping ⁇ using a machine learning technique in act 405.
- the updated parameters may then be stored in the model repository 406.
- the updated map ⁇ may introduce a new subspace, manifold ⁇ ' (updated latent representation 407), that is a representation of the information content of the dataset for the application of the learned maps.
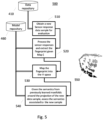
- FIG. 5 depicts an exemplary process 500 for using learned mappings to identify and quantify the chemicals within the sensor environment.
- a chemical sensing system may acquire output signals.
- the chemical sensing system may determine whether the acquired signals satisfy a storage criterion. Satisfaction of this storage criterion can indicate that the output signal introduces new information.
- the chemical sensing system may be configured to store the output signal, together with any contextual information, in data repository 410. In some embodiments, satisfaction of the storage criterion depends on a value of the mutual information between the acquired output signals and output signals already stored in data repository 410.
- the output signals stored in data repository 410 may be used for updating mappings, as described above with regard to FIG. 4 .
- the chemical sensing system may then calculate a point in the Z representation, z , from the output signals using a model stored in model repository 406 that implements the map ⁇ in act 520.
- the chemical sensing system may then calculate a point in the ⁇ space, p , from the point z using a model stored in model repository 406 that implements the map ⁇ in act 530.
- the chemical sensing system may be configured to infer a composition of the environment corresponding to the value p in the ⁇ space in act 540. This inference can depend on semantics associated with points of manifold ⁇ (depicted as manifold 550 in FIG. 5 ) in a neighborhood of p .
- the chemical sensing system may be configured to identify labeled points within a predetermined distance of p . Such labeled points may be associated with known concentrations of analytes. While the overall relationship between analyte concentrations and locations in the ⁇ space may be complex and non-linear, for a sufficiently small region around p , the relationship may be approximately linear.
- the chemical sensing system may be configured to estimate analyte concentrations corresponding to p based on analyte concentrations associated with the labeled points within the predetermined distance of p .
- the chemical sensing system may be configured to interpolate concentrations for p based on these known concentrations.
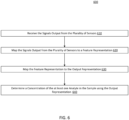
- FIG. 6 depicts an exemplary process 600 for determining a concentration of at least one analyte in a sample.
- the process 600 may be implemented using at least some of the mappings described above with regard to FIGs. 2A and 2B .
- Process 600 may be implemented using a chemical sensing system.
- the chemical sensing system includes a sensor array (e.g., sensor array 120).
- the sensor array includes a plurality of sensors arranged on a substrate.
- a first sensor and a second sensor of the plurality of sensors have different sensitivities to sense different analytes in a sample.
- Each of the plurality of sensors is configured to output a signal in response to sensing an analyte.
- the chemical sensing system can include a computing device.
- the computing device can include a processor and a memory configured to store data and instructions for performing one or more of the processes described herein.
- the chemical sensing system is configured to determine a concentration of analytes in the sample based, at least in part, on the output signals generated by the sensors and a model relating the output signals or information derived from the output signals to the output representation V .
- the output representation V may have bases corresponding to the different analytes in the sample.
- the chemical sensing system receives signals output from the plurality of sensors.
- Each signal may include a time series of measurements, as described above with regard to FIGs. 2A and 2B .
- the signals are received as they are generated (e.g., as a stream of data).
- the signal is stored and subsequently provided to the chemical sensing system.
- the signals are received from the sensors over a network.
- the chemical sensing system containing the sensors may be located remote from the computing device processing the signal.
- the chemical sensing system containing the sensors may be integrated with the computing device.
- a first model is used to map the signals output from the plurality of sensors to a feature representation Z .
- this mapping is non-linear. For example, a change in an analyte concentration in the sample results in a non-linear change in a location of a point in the feature representation.
- the chemical sensing system is configured to perform this mapping using a first model relating the signals output from the plurality of sensors to a feature representation.
- the mapping may include an act of mapping from the output signals to response values.
- an amplitude characteristic and/or a temporal characteristic of an output signal is mapped to each corresponding response value (e.g., a response value may be vector-valued, with one or more components corresponding to amplitude characteristics and one or more components corresponding to temporal characteristics).
- the amplitude characteristic may be, for example, a normalized change in an amplitude of the corresponding signal.
- the temporal characteristic may be, for example, a rise time or a fall time of an amplitude of the corresponding signal.
- These response values may then be weighted and combined to form feature vectors in the feature representation.
- the weights may be the weights of a neural network that relate the response values to the feature representation.
- the neural network can be a recurrent neural network (or include recurrent neural network layers) a convolutional neural network (or include convolutional neural network layers) or another type of neural network.
- a weighting can relate the response values to the feature representation.
- a second model is used to map the feature vectors corresponding to the output signals from the feature representation Z to an output representation V .
- the second model includes multiple sub-models that implement sub-mappings, as described above.
- a first sub-model relates a feature representation Z to a latent representation ⁇ .
- latent representation ⁇ has a lower dimensionality than the feature representation.
- the number of dimensions in feature representation Z can depend on the number of sensors in the sensor array and the number of features extracted from each sensor.
- the number of dimensions in latent representation ⁇ can depend on the number of relevant base analytes.
- feature representation Z can be a 32-dimensional space.
- the latent representation ⁇ can be a four-dimensional space.
- a second sub-model relates the latent representation ⁇ to a straightened orthogonal representation ⁇ .
- the straightened orthogonal representation ⁇ one-dimensional manifolds corresponding to varying concentrations of the same analyte are defined to have zero angle between them and one-dimensional manifolds corresponding to different analytes are orthogonal.
- a third sub-model can relate the straightened orthogonal representation ⁇ to the output representation V .
- the location of points in the output representation V can be a linear function of the concentration of analytes in corresponding samples.
- the third sub-model can relate the straightened orthogonal representation to a non-linearized output representation U having standard bases associated with the base analytes.
- the third sub-model can implement this relationship according to a mapping ⁇ , as described herein.
- the third sub-model can also relate the non-linearized output representation U to the output representation V .
- the third sub-model can implement this relationship according to a mapping ⁇ , as described herein.
- a concentration of at least one analyte in the sample is determined using the output representation.
- the chemical sensing system can determine the concentration of each relevant analyte based on the location of the point corresponding to the sample in the output representation. For example, when the output representation includes axes corresponding to four relevant base analytes, the location of a point in the output representation may be [ c 1 c 2 c 3 c 4 ]. In this example, c 1 is the concentration of the first base analyte, c 2 is the concentation of the second base analyte, c 3 is the concentration of the third base analyte, and c 4 is the concentration of the fourth base analyte.
- the chemical sensing system can be configured to store, display, or provide the position in the output representation corresponding to the sample.
- FIG. 7 depicts an exemplary process for configuring a chemical sensing system to detect concentrations of at least one analyte.
- a training device includes a processor and a memory configured to store data and instructions for performing the disclosed embodiments.
- the training device is configured to train an assessment model relating output signals generated by sensors in a sensor array (or information derived from such signals) to an output representation V having bases corresponding to base analytes.
- the chemical sensing system is then configured to detect concentrations of the analytes using the trained assessment model.
- the chemical sensing system can be configured to use the trained assessment model to relate output signals (or information derived from the output signals) to the output representation, as described above with regard to FIG. 6 .
- the assessment model can include a set of models.
- training using the training dataset may be performed over all models simultaneously.
- the set of models may use the training data to generate estimated concentrations, which may be compared to known concentrations using labels in the training data to generate an error signal, which may be used to update all of the models.
- a subset of the set of models may be trained simultaneously.
- each model in the set of models can be trained individually using the training dataset.
- the first two models in the set of models may be at least partially trained.
- These models can then generate output using the signals in the training dataset. This output can be used to train the next model in the set of models.
- the set of models may undergo iterative training. In each iteration, each of the models may be trained using at least a portion of training dataset. Training of individuals models, subsets of the set of models, or the overall assessment model may continue until training time criteria and/or accuracy criteria are satisfied.
- a training dataset generated by a plurality of sensors is received by the training device.
- the sensors have different sensitivities to sense different analytes in an environment.
- the sensors are configured to output a signal in response to sensing the different analytes.
- the training dataset may include x ( t ) as described above with regard to FIGs. 2A and 2B .
- the training device is configured to receive the training dataset as it is being generated by the sensors (e.g., as a data stream). In some embodiments, the training device is configured to receive the training dataset after it is generated by the sensors (e.g., the training dataset is stored and is later provided to the training device).
- the training dataset may be received directly from one or more instances of the chemical sensing system, or indirectly from a database configured to store the training dataset.
- the training dataset may be received over a network, or from an instance of the chemical sensing system connected to the training device.
- an instance of the chemical sensing system can include the training device, and the training may be performed by the chemical sensing system.
- an assignment model relating signals output by sensors (or information derived from the output signals) to the output representation V is trained by the training device.
- training the assessment model includes generating a first model relating the signals output from the plurality of sensors to the feature representation Z .
- the first model is implemented, at least in part, by one or more neural networks (e.g., a recurrent neural network, a convolutional neural network, or a neural network including recurrent and/or convolutional layers). Training the first model can include training weights of the neural network using the training dataset.
- the first model is trained using an unsupervised learning technique (e.g., without relying on labeled training data).
- training the assessment model includes generating a second model relating feature representation Z to the output representation V .
- the second model includes multiple sub-models, which may be trained separately.
- the mapping of feature representation Z to the output representation V includes associating bases in the straightened orthogonal representation with the analytes.
- a first sub-model relates the feature representation Z to a latent representation ⁇ .
- a continuous manifold embedded in the feature representation Z contains the signals output from the plurality of sensors.
- the continuous manifold may have a dimensionality equal to the dimensionality of the latent representation ⁇ .
- the latent representation ⁇ may have a dimensionality less than the dimensionality of the feature representation Z .
- the first sub-model includes a machine-learning model suitable for dimensionality reduction, such as the encoder of an autoencoder, the generator of a generative adversarial network, or a like model.
- the training device can be configured to train the first sub-model using the training dataset.
- the training is performed using an unsupervised learning technique (e.g., without relying on labeled training data).
- the first sub-model implements a non-parametric technique of dimensionality reduction (e.g., t-distributed stochastic neighbor embedding (t-SNE)).
- training the assessment model includes identifying manifolds corresponding to samples of varying concentrations of a same analyte. This training can proceed iteratively to identify one-dimensional manifolds associated with base analytes of varying concentrations in the feature representation Z using local gradient changes. The identification of these manifolds as associated with base analytes can be subsequently relied upon to generate models for straightening and orthogonalizing the latent representation ⁇ .
- a second sub-model relates the latent representation ⁇ to a straightened, orthogonal representation ⁇ .
- the second sub-model may include a straightening neural network.
- the straightening neural network is implemented as a feedforward neural network that relates the latent representation to a straightened representation.
- the training device can be configured to train the straightening neural network using the training dataset and a loss function configured to penalize generation of non-zero angles between vectors output by the at least one neural network that correspond to samples of varying concentrations of a same analyte.
- the second sub-model may also include an orthogonalization neural network.
- the orthogonalization neural network is implemented as a feedforward neural network that relates the straightened representation to a straightened, orthogonal representation.
- the training device can be configured to train the orthogonalization neural network using the training dataset and a loss function configured to penalize generation of non-orthogonal vectors output by the orthogonalization neural network that correspond to samples of different analytes.
- Training the second sub-model can include training at least one of the straightening neural network or the orthogonalization neural network using an unsupervised learning technique (e.g., without relying on labels associated with the training data). In some embodiments, this training relies on associations determined using local gradient changes.
- a third sub-model may relate the straightened orthogonal representation ⁇ to the output representation V .
- the training device is configured to use labels in the training data to associate bases in the straightened orthogonal representation with the base analytes. For example, the training device may identify an analyte associated with a basis using labels associated with one or more points lying on or near the basis. The training device can then generate an introduction model that introduces the associated bases onto the standard bases of a non-linearized output representation U. In some embodiments, the training device generates a linearizing model that linearizes the non-linearized output representation U using concentrations indicated in labels associated with the training data. In some embodiments, the linearizing model that linearizes the non-linearized output representation U includes a neural network. In some embodiments, this neural network is implemented as a feedforward neural network. The training device can be configured to train the neural network to linearize the non-linearized output representation U using the training data and concentration values corresponding to the training data.
- one or more of the models described above may be trained by a device other than the training device.
- the training device may be configured to generate the first model and the first and second sub-models. These models may collectively relate the output signals to a straightened orthogonal representation ⁇ .
- the training device may then receive the third sub-model relating the straightened orthogonal representation ⁇ to the output representation V .
- models may be reused, or only generated as necessary.
- one or more training devices may be configured to generate models relating output signals generated by different instances of a chemical sensing system to a common representation (e.g., non-linearized output representation U). Another model usable with each of the different instances of the chemical sensing system can then relate the non-linearized output representation U to output representation V .
- the chemical sensing system can be configured to detect concentrations of the analytes using the assessment model.
- the training device, or another device can cause the assessment model to be stored in a memory of the chemical sensing system.
- the chemical sensing system can then be configured to use the assessment model to map output signals received from sensors to the output representation V .
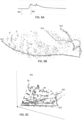
- FIGs. 8A to 8E depict empirical test data for three analytes (acetone, ethanol and toluene) mapped to various representations using models trained according to the disclosed embodiments.
- the dataset includes the output signal received from the sensing elements in the chemical sensing system to 1200 chemical samples.
- the chemical samples including samples of pure acetone, ethanol or toluene at various concentrations as the base analytes.
- the chemical samples also included mixtures of acetone, ethanol and/or toluene at various proportions and various total concentrations.
- Each output signal included 32 sequences of time-series data, each sequence corresponding to one of the 32 sensing elements.
- the samples were introduced into a 1.5L chamber in which the chemical sensing system was mounted. 10 samples of acetone, ethanol and toluene each were collected at concentrations varying from 2.5uL to 25uL. Mixtures of (Acetone, Ethanol), (Acetone, Toluene), (Toluene, Ethanol) and (Acetone, Toluene, Ethanol) in which the proportion of each chemical varied from 0% to 100% (0%, 17%, 25%, 33%, 50%, 66%, 75%, and 100%) were introduced to the chamber with total concentration varying from 2.5uL to 25uL. Per each mixture and at various concentrations, 10 samples were collected in the dataset to represent the semantic with the local distribution for each chemical composition.
- FIG. 8A depicts an exemplary transient response of a sensing element to one of the chemical compositions tested.
- the extremum value of the transient response is indicated as 803 and the baseline value of the transient response is indicated as 801.
- the mapping ⁇ includes only a descriptor f being the value "1" subtracted from the extremum value on the transient response, ⁇ , divided by the baseline vector, ⁇ , which is calculated for each cycle.
- f f 1 f 2 ⁇ f 32
- ⁇ ⁇ 1 ⁇ 2 ⁇ ⁇ 32
- ⁇ ⁇ 1 ⁇ 2 ⁇ ⁇ 32
- f i ⁇ i ⁇ i ⁇ 1
- the feature vector corresponding to each environment include 32 values.
- the feature representation Z was a 32-dimensional space. Disposed in this 32-dimensional space were 1200 values corresponding to the 1200 samples.
- FIGs. 8B to 8F the values of the points in each representation are presented by small circles. Each of the three lines indicate points corresponding to varying concentrations of one of three base analytes (acetone, ethanol, toluene).
- FIG. 8B depicts an exemplary latent representation ⁇ generated from the feature representation Z according to a mapping ⁇ .
- the mapping ⁇ was generated using t-distributed stochastic neighbor embedding (t-SNE) to learn a reduced three-dimension space ⁇ .
- t-SNE stochastic neighbor embedding
- the manifold 815 connects the median values of samples of pure acetone of varying concentrations
- the manifold 813 connects the median values of samples of pure ethanol of varying concentrations
- the manifold 811 connects the median values of samples of pure toluene of varying concentrations.
- the broken lines are curves fitted on the points related to each of the base analytes.
- FIG. 8C depicts an exemplary straightened representation ⁇ generated from the latent representation ⁇ according to a mapping ⁇ .
- the axes were identified for each base analyte (e.g., axis 821 for toluene, axis 825 for ethanol, and axis 823 for acetone). This identification can be performed using the iterative process of identifying exterior points in the manifold described herein. As there are three base analytes in the dataset, three axes can be identified. To straighten the axes, a line equation is calculated for each axis.
- Line equations can be constrained such that they do not all lie within a plane and an origin of all the line equations lie on or near a point corresponding to the absence of analytes in the sample.
- Each point associated with a base analyte is then mapped to a point on the corresponding line for that analyte.
- This mapping ⁇ can be generated using a neural network trained to straighten the axes and unfold the manifold. After the training is done, the mapping ⁇ is applied to the points in the latent representation ⁇ to generate corresponding points in the transformed space ⁇ .
- FIG. 8D depicts an exemplary straightened, orthogonal representation ⁇ generated from the straightened representation ⁇ according to a mapping ⁇ .
- the axes of ⁇ have been straightened, but are not (at least in this example) orthogonal.
- the chemical sensing system can be configured to generate orthogonal axes according to the following process.
- a first axis y 1 (depicted as axis 831) is selected.
- the selected axis 831 is not modified.
- a second axis y 2 is then selected and a mapping from the second axis y 2 to a target axis y 2 ′ (axis 833), orthogonal to the first axis 831, is then determined.
- the mapping of y 2 to axis 833 may also have the effect of mapping the third axis y 3 to y 3 ′ .
- the remaining axis y 3 ′ is then selected and a mapping from y 3 ′ to a target axis 835 is determined.
- target locations are generated for the points lying on axes y 2 and y 3 .
- a neural network may then be trained to implement the mapping ⁇ , which may map the points lying on axes y 2 and y 3 to the target locations. This neural network can then be used to calculate locations in straightened, orthogonal representation ⁇ correspond to the points in straightened representation ⁇ .
- FIG. 8E depicts an exemplary standard basis representation U generated from a straightened, orthogonal representation ⁇ according to a mapping ⁇ .
- the axes of ⁇ are orthogonal but are not (at least in this example) aligned with the standard bases of R M (e.g., axis 841, axis 843, and axis 845).
- the system can determine a projection from ⁇ to U that aligns each axis of ⁇ with a corresponding standard basis in U. For example, if the x-axis in U corresponds to ethanol, the mapping ⁇ may project the axis in ⁇ corresponding to ethanol to the x-axis in U (e.g., axis 843).
- FIG. 8F depicts an exemplary output representation V generated from standard basis representation U according to a mapping ⁇ .
- target points in output representation V are determined for each point in standard basis representation U.
- a neural network can be trained to implement the mapping ⁇ that transforms the points in standard basis representation U to the target points in output representation V .
- the chemical sensing system can be configured with these mappings. For example, models and parameters implementing these mappings can be saved to a memory of the chemical sensing system.
- the chemical sensing system can be configured to apply the stored models according to the stored parameters to implement these mappings, mapping the output sample received from the sensor array to a point in the output representation with clearly defined semantics.
- module may include hardware, such as a processor, an application-specific integrated circuit (ASIC), or a field-programmable gate array (FPGA), or a combination of hardware and software.
- ASIC application-specific integrated circuit
- FPGA field-programmable gate array
Landscapes
- Engineering & Computer Science (AREA)
- Physics & Mathematics (AREA)
- Theoretical Computer Science (AREA)
- Health & Medical Sciences (AREA)
- Life Sciences & Earth Sciences (AREA)
- General Health & Medical Sciences (AREA)
- General Physics & Mathematics (AREA)
- Molecular Biology (AREA)
- Artificial Intelligence (AREA)
- Mathematical Physics (AREA)
- Evolutionary Computation (AREA)
- Computational Linguistics (AREA)
- Computing Systems (AREA)
- General Engineering & Computer Science (AREA)
- Data Mining & Analysis (AREA)
- Biophysics (AREA)
- Software Systems (AREA)
- Biomedical Technology (AREA)
- Chemical & Material Sciences (AREA)
- Immunology (AREA)
- Analytical Chemistry (AREA)
- Biochemistry (AREA)
- Pathology (AREA)
- Nanotechnology (AREA)
- Food Science & Technology (AREA)
- Medicinal Chemistry (AREA)
- Combustion & Propulsion (AREA)
- Crystallography & Structural Chemistry (AREA)
- Investigating Or Analysing Biological Materials (AREA)
- Investigating Or Analyzing Materials By The Use Of Electric Means (AREA)
Claims (12)
- Système de détection chimique (100), comprenant :une pluralité de capteurs (121) agencés sur au moins un substrat (122), dans lequel un premier capteur et un second capteur de la pluralité de capteurs (121) présentent des sensibilités différentes pour détecter au moins un analyte dans un échantillon, chacun de la pluralité de capteurs (121) étant configuré pour délivrer en sortie un signal en réponse à la détection de l'au moins un analyte ;et un processeur informatique (130) programmé pour :recevoir les signaux délivrés en sortie par la pluralité de capteurs (121) ; etdéterminer une concentration de l'au moins un analyte dans l'échantillon sur la base, au moins en partie, des signaux reçus et d'un modèle entraîné pour relier les signaux ou les informations dérivées des signaux à une représentation de sortie présentant des bases correspondant à des analytes, les analytes incluant l'au moins un analyte, dans lequel la concentration est une valeur scalaire en conjonction avec une unité de mesure particulière,dans lequel :le modèle comprend :un premier modèle reliant les signaux délivrés en sortie de la pluralité de capteurs (121) à une représentation de caractéristiques (221) ; etun second modèle reliant la représentation de caractéristiques (221) à la représentation de sortie ; etdans lequel :
le second modèle reliant la représentation de caractéristiques (221) à la représentation de sortie comprend :
un premier sous-modèle reliant la représentation de caractéristiques (221) à une représentation latente (231) caractérisé en ce que le second modèle comprend en outre un deuxième sous-modèle reliant ladite représentation latente (231) à une représentation orthogonale redressée (241), dans lequel :des variétés unidimensionnelles dans la représentation orthogonale redressée (241) correspondant à des concentrations variables d'un même analyte présentent un angle nul entre elles ; etdes variétés unidimensionnelles dans la représentation orthogonale redressée (241) correspondant à différents analytes sont orthogonales. - Système de détection chimique (100) selon la revendication 1, dans lequel :
le premier modèle comprend :un mappage des signaux à des valeurs de réponse ; etune pondération reliant les valeurs de réponse à la représentation de caractéristiques (221). - Système de détection chimique (100) selon la revendication 2, dans lequel :
la pondération comprend :
des poids d'un réseau neuronal récurrent ou d'un réseau neuronal convolutif qui relient les valeurs de réponse à la représentation de caractéristiques (221). - Système de détection chimique (100) selon la revendication 2, dans lequel :
le mappage attribue à chaque valeur de réponse une caractéristique d'amplitude et/ou une caractéristique temporelle d'un signal correspondant. - Système de détection chimique (100) selon la revendication 4, dans lequel :
la caractéristique d'amplitude comprend un changement normalisé d'une amplitude du signal correspondant. - Système de détection chimique (100) selon la revendication 4, dans lequel :
la caractéristique temporelle comprend un temps de montée ou un temps de descente d'une amplitude du signal correspondant. - Système de détection chimique (100) selon la revendication 1, dans lequel :
un changement dans un emplacement d'un point dans la représentation de caractéristiques (221) correspondant à une concentration d'analyte dans l'échantillon est une fonction non linéaire d'un changement dans la concentration d'analyte dans l'échantillon. - Système de détection chimique (100) selon la revendication 1, dans lequel :le second modèle reliant la représentation de caractéristiques (221) à la représentation de sortie comprend :un troisième sous-modèle reliant la représentation orthogonale redressée (241) à la représentation de sortie, dans lequel le troisième sous-modèle :relie la représentation orthogonale redressée (241) à une représentation de sortie non linéarisée présentant des bases standard associées aux analytes ; etrelie la représentation de sortie non linéarisée à la représentation de sortie ; etdans lequel un changement dans un emplacement d'un point dans la représentation de sortie correspondant à une concentration d'analyte dans l'échantillon est une fonction linéaire d'un changement dans la concentration d'analyte dans l'échantillon.
- Système de détection chimique (100) selon la revendication 1, dans lequel :
chaque signal comprend une série temporelle de mesures. - Système de détection chimique (100) selon la revendication 1, dans lequel :le premier modèle est un modèle spécifique au dispositif reliant les signaux ou les informations dérivées des signaux à une représentation intermédiaire ; etle second modèle est un modèle indépendant du dispositif reliant la représentation intermédiaire à la représentation de sortie.
- Procédé mis en oeuvre par ordinateur comprenant :une réception (610) de signaux provenant d'une pluralité de capteurs (121) d'un système de détection chimique (100), les capteurs (121) présentant des sensibilités différentes pour détecter au moins un analyte dans l'échantillon, chacun des capteurs étant configuré pour délivrer en sortie un signal en réponse à la détection de l'au moins un analyte ;un mappage (620, 630) des signaux ou des informations basées sur les signaux à une représentation de sortie présentant des bases de coordonnées correspondant à des analytes ; etune détermination (640) d'une concentration de l'au moins un analyte dans l'échantillon à partir de la représentation de sortie, dans lequel la concentration est une valeur scalaire en conjonction avec une unité de mesure particulière ;dans lequel :le mappage des signaux ou des informations basées sur les signaux à une représentation de sortie comprend :une utilisation d'un premier modèle pour mapper les signaux délivrés en sortie de la pluralité de capteurs (121) à une représentation de caractéristiques (221) ; etune utilisation d'un second modèle pour mapper la représentation de caractéristiques (221) à la représentation de sortie,
dans lequel le second modèle comprend :un premier sous-modèle reliant la représentation de caractéristiques (221) à une représentation latente (231) caractérisé en ce que le second modèle comprend en outre un deuxième sous-modèle reliant ladite représentation latente (231) à une représentation orthogonale redressée (241), dans lequel :des variétés unidimensionnelles dans la représentation orthogonale redressée (241) correspondant à des concentrations variables d'un même analyte présentent un angle nul entre elles ; etdes variétés unidimensionnelles dans la représentation orthogonale redressée (241) correspondant à différents analytes sont orthogonales. - Procédé selon la revendication 11, dans lequel :
le second modèle comprend en outre :
un troisième sous-modèle reliant la représentation orthogonale redressée (241) à la représentation de sortie, dans lequel le troisième sous-modèle :relie la représentation orthogonale redressée (241) à une représentation de sortie non linéarisée présentant des bases standard associées aux analytes ; etrelie la représentation de sortie non linéarisée à la représentation de sortie ; etdans lequel un changement dans un emplacement d'un point dans la représentation de sortie correspondant à une concentration d'analyte dans l'échantillon est une fonction linéaire d'un changement dans la concentration d'analyte dans l'échantillon.
Applications Claiming Priority (2)
| Application Number | Priority Date | Filing Date | Title |
|---|---|---|---|
| US201862623440P | 2018-01-29 | 2018-01-29 | |
| PCT/IB2019/000107 WO2019145791A1 (fr) | 2018-01-29 | 2019-01-29 | Système de détection chimique |
Publications (4)
| Publication Number | Publication Date |
|---|---|
| EP3746800A1 EP3746800A1 (fr) | 2020-12-09 |
| EP3746800A4 EP3746800A4 (fr) | 2021-11-10 |
| EP3746800B1 true EP3746800B1 (fr) | 2025-01-22 |
| EP3746800C0 EP3746800C0 (fr) | 2025-01-22 |
Family
ID=67391375
Family Applications (1)
| Application Number | Title | Priority Date | Filing Date |
|---|---|---|---|
| EP19743153.9A Active EP3746800B1 (fr) | 2018-01-29 | 2019-01-29 | Système de détection chimique |
Country Status (4)
| Country | Link |
|---|---|
| US (2) | US10386379B1 (fr) |
| EP (1) | EP3746800B1 (fr) |
| ES (1) | ES3021879T3 (fr) |
| WO (1) | WO2019145791A1 (fr) |
Families Citing this family (10)
| Publication number | Priority date | Publication date | Assignee | Title |
|---|---|---|---|---|
| ES3021879T3 (en) | 2018-01-29 | 2025-05-27 | Stratuscent Inc | Chemical sensing system |
| US11106977B2 (en) | 2019-02-22 | 2021-08-31 | Stratuscent Inc. | Systems and methods for learning across multiple chemical sensing units using a mutual latent representation |
| EP4611001A3 (fr) * | 2019-10-11 | 2025-11-19 | C The Signs Limited | Outil de diagnostic |
| DE102020101490A1 (de) | 2020-01-22 | 2021-07-22 | Endress+Hauser Conducta Gmbh+Co. Kg | Sensorsystem und Verfahren |
| US12005649B2 (en) | 2020-09-23 | 2024-06-11 | Ut-Battelle, Llc | Aroma detection systems for food and beverage and conversion of detected aromas to natural language descriptors |
| WO2022074399A1 (fr) * | 2020-10-08 | 2022-04-14 | Nuclera Nucleics Ltd | Système d'électromouillage et procédé pour des réseaux ewod d'entraînement spécifiques d'un réactif dans des systèmes microfluidiques |
| US12567316B1 (en) * | 2023-08-02 | 2026-03-03 | State Farm Mutual Automobile Insurance Company | Security systems and methods for detecting anomalous events using sensors |
| WO2025155956A1 (fr) * | 2024-01-19 | 2025-07-24 | University Of South Florida | Nez électronique hybride et modulaire |
| WO2025179392A1 (fr) * | 2024-03-01 | 2025-09-04 | Stratuscent Inc. | Système de détection pour détecter la présence de nox dans un environnement |
| WO2025179386A1 (fr) * | 2024-03-01 | 2025-09-04 | Stratuscent Inc. | Système olfactif artificiel robuste |
Family Cites Families (18)
| Publication number | Priority date | Publication date | Assignee | Title |
|---|---|---|---|---|
| US6649416B1 (en) * | 2000-02-18 | 2003-11-18 | Trustees Of Tufts College | Intelligent electro-optical sensor array and method for analyte detection |
| US6379969B1 (en) * | 2000-03-02 | 2002-04-30 | Agilent Technologies, Inc. | Optical sensor for sensing multiple analytes |
| WO2002015777A1 (fr) * | 2000-08-18 | 2002-02-28 | Cygnus, Inc. | Procedes et dispositifs permettant de predire des evenements hypoglycemiques |
| US8187865B2 (en) | 2003-06-12 | 2012-05-29 | California Institute Of Technology | Nanowire sensor, sensor array, and method for making the same |
| CA2563825C (fr) * | 2004-04-22 | 2021-11-09 | Smiths Detection Inc. | Procede et systeme de surveillance autonome utilisant des capteurs de sensibilites differentes |
| US7531137B2 (en) * | 2004-04-30 | 2009-05-12 | Honeywell International Inc. | Substance detection system |
| US7640116B2 (en) * | 2005-09-07 | 2009-12-29 | California Institute Of Technology | Method for detection of selected chemicals in an open environment |
| US7858720B2 (en) | 2006-06-19 | 2010-12-28 | California Institute Of Technology | Co-polymer films for sensors |
| US8024133B2 (en) * | 2006-11-29 | 2011-09-20 | California Institute Of Technology | System for detecting and estimating concentrations of gas or liquid analytes |
| US9080942B2 (en) * | 2007-04-18 | 2015-07-14 | The Research Foundation for State University of New York | Flexible multi-moduled nanoparticle-structured sensor array on polymer substrate and methods for manufacture |
| US8024113B2 (en) | 2007-08-02 | 2011-09-20 | Volkswagen Ag | Navigation system |
| US7961312B2 (en) * | 2007-08-13 | 2011-06-14 | C8 Medisensors Inc. | Calibrated analyte concentration measurements in mixtures |
| US7925081B2 (en) * | 2007-12-12 | 2011-04-12 | Fuji Xerox Co., Ltd. | Systems and methods for human body pose estimation |
| WO2012075069A2 (fr) * | 2010-12-02 | 2012-06-07 | Dana-Farber Cancer Institute, Inc. | Signatures et déterminants associés au cancer et leurs méthodes d'utilisation |
| WO2016033186A1 (fr) * | 2014-08-26 | 2016-03-03 | Eloret Corporation | Système de surveillance chimique |
| RU2021137343A (ru) * | 2016-01-22 | 2022-01-26 | Отрэйсис, Инк. | Системы и способы улучшения диагностики заболеваний |
| US20180218256A1 (en) * | 2017-02-02 | 2018-08-02 | Qualcomm Incorporated | Deep convolution neural network behavior generator |
| ES3021879T3 (en) | 2018-01-29 | 2025-05-27 | Stratuscent Inc | Chemical sensing system |
-
2019
- 2019-01-29 ES ES19743153T patent/ES3021879T3/es active Active
- 2019-01-29 EP EP19743153.9A patent/EP3746800B1/fr active Active
- 2019-01-29 WO PCT/IB2019/000107 patent/WO2019145791A1/fr not_active Ceased
- 2019-01-29 US US16/261,195 patent/US10386379B1/en active Active
- 2019-06-28 US US16/456,244 patent/US11906533B2/en active Active
Non-Patent Citations (2)
| Title |
|---|
| BRAHIM-BELHOUARI S ET AL: "A comparative study of density models for gas identification using microelectronic gas sensor", PROCEEDINGS OF THE 3RD IEEE INTERNATIONAL SYMPOSIUM ON SIGNAL PROCESSING AND INFORMATION TECHNOLOGY (IEEE CAT. NO.03EX795), PISCATAWAY, NJ, USA,IEEE, 14 December 2003 (2003-12-14), pages 138 - 141, XP010729113, ISBN: 978-0-7803-8292-3 * |
| BRAHIM-BELHOUARI S ET AL: "Gas identification using density models", PATTERN RECOGNITION LETTERS, ELSEVIER, AMSTERDAM, NL, vol. 26, no. 6, 1 May 2005 (2005-05-01), pages 699 - 706, XP027779667, ISSN: 0167-8655, [retrieved on 20050501] * |
Also Published As
| Publication number | Publication date |
|---|---|
| US20190317118A1 (en) | 2019-10-17 |
| WO2019145791A1 (fr) | 2019-08-01 |
| US20190234973A1 (en) | 2019-08-01 |
| US10386379B1 (en) | 2019-08-20 |
| ES3021879T3 (en) | 2025-05-27 |
| EP3746800A4 (fr) | 2021-11-10 |
| EP3746800C0 (fr) | 2025-01-22 |
| EP3746800A1 (fr) | 2020-12-09 |
| US11906533B2 (en) | 2024-02-20 |
| CA3089818A1 (fr) | 2019-08-01 |
Similar Documents
| Publication | Publication Date | Title |
|---|---|---|
| EP3746800B1 (fr) | Système de détection chimique | |
| US11106977B2 (en) | Systems and methods for learning across multiple chemical sensing units using a mutual latent representation | |
| Zhang et al. | KNN classification with one-step computation | |
| Janarthanan et al. | Optimized unsupervised deep learning assisted reconstructed coder in the on-nodule wearable sensor for human activity recognition | |
| JP6594044B2 (ja) | 実時系列内の異常を検出するための方法 | |
| US11909751B2 (en) | Anomaly detection method based on IoT and apparatus thereof | |
| Berger et al. | Bayesian sensor calibration | |
| CN115683255A (zh) | 基于数据协整分析的油耗计量系统及其方法 | |
| CN111912937A (zh) | 一种室内突发污染物智能实时溯源方法及系统 | |
| CN114049525A (zh) | 气体种类和浓度识别的融合神经网络系统、装置与方法 | |
| Mishra et al. | Classification of gases/odors using dynamic responses of thick film gas sensor array | |
| CN114782775A (zh) | 分类模型的构建方法、装置、计算机设备及存储介质 | |
| CN109239207A (zh) | 基于电子鼻的气味识别方法、装置和电子鼻系统 | |
| CA3089818C (fr) | Systeme de detection chimique | |
| Du et al. | Sensitivity calibration of a three-axis accelerometer under different temperature conditions using the hybrid GA–PSO–BPNN algorithm | |
| EP2889724B1 (fr) | Système et procédé pour sélectionner des caractéristiques pour identifier des activités humaines dans un environnement d'interaction homme-machine | |
| JP7268509B2 (ja) | 異常度算出方法、及び、異常度算出用コンピュータプログラム | |
| Asmara et al. | Basketball Activity Recognition Using Supervised Machine Learning Implemented on Tizen OS Smartwatch | |
| Pezzementi et al. | Tactile object recognition and localization using spatially-varying appearance | |
| Dai et al. | Mobile Robot Visual Image Hierarchical Matching Algorithm Based On Deep Reinforcement Learning And Orthogonal Matching Pursuit | |
| Chennoju et al. | Classified Volatile Organic Compound Detection using Data Classification Algorithms | |
| Fan et al. | Unsupervised gas discrimination in uncontrolled environments by exploiting density peaks | |
| CN120123786B (zh) | 基于陀螺仪加速度计的姿态感应分析方法及系统 | |
| CN109030734B (zh) | 基于超声辅助与单个气体传感器的气体鉴别方法 | |
| CN107845089A (zh) | 一种基于颜色信息的测量方法、装置及系统 |
Legal Events
| Date | Code | Title | Description |
|---|---|---|---|
| STAA | Information on the status of an ep patent application or granted ep patent |
Free format text: STATUS: THE INTERNATIONAL PUBLICATION HAS BEEN MADE |
|
| PUAI | Public reference made under article 153(3) epc to a published international application that has entered the european phase |
Free format text: ORIGINAL CODE: 0009012 |
|
| STAA | Information on the status of an ep patent application or granted ep patent |
Free format text: STATUS: REQUEST FOR EXAMINATION WAS MADE |
|
| 17P | Request for examination filed |
Effective date: 20200827 |
|
| AK | Designated contracting states |
Kind code of ref document: A1 Designated state(s): AL AT BE BG CH CY CZ DE DK EE ES FI FR GB GR HR HU IE IS IT LI LT LU LV MC MK MT NL NO PL PT RO RS SE SI SK SM TR |
|
| AX | Request for extension of the european patent |
Extension state: BA ME |
|
| DAV | Request for validation of the european patent (deleted) | ||
| DAX | Request for extension of the european patent (deleted) | ||
| REG | Reference to a national code |
Ref country code: DE Ref legal event code: R079 Free format text: PREVIOUS MAIN CLASS: G01N0037000000 Ipc: G06N0003020000 Ref country code: DE Ref legal event code: R079 Ref document number: 602019065095 Country of ref document: DE Free format text: PREVIOUS MAIN CLASS: G01N0037000000 Ipc: G06N0003020000 |
|
| A4 | Supplementary search report drawn up and despatched |
Effective date: 20211007 |
|
| RIC1 | Information provided on ipc code assigned before grant |
Ipc: G01N 33/00 20060101ALI20211002BHEP Ipc: G06N 3/08 20060101ALI20211002BHEP Ipc: G06N 3/02 20060101AFI20211002BHEP |
|
| STAA | Information on the status of an ep patent application or granted ep patent |
Free format text: STATUS: EXAMINATION IS IN PROGRESS |
|
| 17Q | First examination report despatched |
Effective date: 20231129 |
|
| GRAP | Despatch of communication of intention to grant a patent |
Free format text: ORIGINAL CODE: EPIDOSNIGR1 |
|
| STAA | Information on the status of an ep patent application or granted ep patent |
Free format text: STATUS: GRANT OF PATENT IS INTENDED |
|
| INTG | Intention to grant announced |
Effective date: 20240826 |
|
| GRAS | Grant fee paid |
Free format text: ORIGINAL CODE: EPIDOSNIGR3 |
|
| GRAA | (expected) grant |
Free format text: ORIGINAL CODE: 0009210 |
|
| STAA | Information on the status of an ep patent application or granted ep patent |
Free format text: STATUS: THE PATENT HAS BEEN GRANTED |
|
| AK | Designated contracting states |
Kind code of ref document: B1 Designated state(s): AL AT BE BG CH CY CZ DE DK EE ES FI FR GB GR HR HU IE IS IT LI LT LU LV MC MK MT NL NO PL PT RO RS SE SI SK SM TR |
|
| REG | Reference to a national code |
Ref country code: GB Ref legal event code: FG4D |
|
| REG | Reference to a national code |
Ref country code: CH Ref legal event code: EP |
|
| REG | Reference to a national code |
Ref country code: IE Ref legal event code: FG4D |
|
| REG | Reference to a national code |
Ref country code: DE Ref legal event code: R096 Ref document number: 602019065095 Country of ref document: DE |
|
| U01 | Request for unitary effect filed |
Effective date: 20250220 |
|
| U07 | Unitary effect registered |
Designated state(s): AT BE BG DE DK EE FI FR IT LT LU LV MT NL PT RO SE SI Effective date: 20250227 |
|
| U20 | Renewal fee for the european patent with unitary effect paid |
Year of fee payment: 7 Effective date: 20250327 |
|
| REG | Reference to a national code |
Ref country code: ES Ref legal event code: FG2A Ref document number: 3021879 Country of ref document: ES Kind code of ref document: T3 Effective date: 20250527 |
|
| PG25 | Lapsed in a contracting state [announced via postgrant information from national office to epo] |
Ref country code: RS Free format text: LAPSE BECAUSE OF FAILURE TO SUBMIT A TRANSLATION OF THE DESCRIPTION OR TO PAY THE FEE WITHIN THE PRESCRIBED TIME-LIMIT Effective date: 20250422 |
|
| PG25 | Lapsed in a contracting state [announced via postgrant information from national office to epo] |
Ref country code: PL Free format text: LAPSE BECAUSE OF FAILURE TO SUBMIT A TRANSLATION OF THE DESCRIPTION OR TO PAY THE FEE WITHIN THE PRESCRIBED TIME-LIMIT Effective date: 20250122 |
|
| PG25 | Lapsed in a contracting state [announced via postgrant information from national office to epo] |
Ref country code: IS Free format text: LAPSE BECAUSE OF FAILURE TO SUBMIT A TRANSLATION OF THE DESCRIPTION OR TO PAY THE FEE WITHIN THE PRESCRIBED TIME-LIMIT Effective date: 20250522 |
|
| PG25 | Lapsed in a contracting state [announced via postgrant information from national office to epo] |
Ref country code: HR Free format text: LAPSE BECAUSE OF FAILURE TO SUBMIT A TRANSLATION OF THE DESCRIPTION OR TO PAY THE FEE WITHIN THE PRESCRIBED TIME-LIMIT Effective date: 20250122 |
|
| PG25 | Lapsed in a contracting state [announced via postgrant information from national office to epo] |
Ref country code: GR Free format text: LAPSE BECAUSE OF FAILURE TO SUBMIT A TRANSLATION OF THE DESCRIPTION OR TO PAY THE FEE WITHIN THE PRESCRIBED TIME-LIMIT Effective date: 20250423 |
|
| PG25 | Lapsed in a contracting state [announced via postgrant information from national office to epo] |
Ref country code: SM Free format text: LAPSE BECAUSE OF FAILURE TO SUBMIT A TRANSLATION OF THE DESCRIPTION OR TO PAY THE FEE WITHIN THE PRESCRIBED TIME-LIMIT Effective date: 20250122 |
|
| PG25 | Lapsed in a contracting state [announced via postgrant information from national office to epo] |
Ref country code: MC Free format text: LAPSE BECAUSE OF FAILURE TO SUBMIT A TRANSLATION OF THE DESCRIPTION OR TO PAY THE FEE WITHIN THE PRESCRIBED TIME-LIMIT Effective date: 20250122 |
|
| PG25 | Lapsed in a contracting state [announced via postgrant information from national office to epo] |
Ref country code: CZ Free format text: LAPSE BECAUSE OF FAILURE TO SUBMIT A TRANSLATION OF THE DESCRIPTION OR TO PAY THE FEE WITHIN THE PRESCRIBED TIME-LIMIT Effective date: 20250122 |
|
| PG25 | Lapsed in a contracting state [announced via postgrant information from national office to epo] |
Ref country code: SK Free format text: LAPSE BECAUSE OF FAILURE TO SUBMIT A TRANSLATION OF THE DESCRIPTION OR TO PAY THE FEE WITHIN THE PRESCRIBED TIME-LIMIT Effective date: 20250122 |
|
| PLBE | No opposition filed within time limit |
Free format text: ORIGINAL CODE: 0009261 |
|
| STAA | Information on the status of an ep patent application or granted ep patent |
Free format text: STATUS: NO OPPOSITION FILED WITHIN TIME LIMIT |
|
| REG | Reference to a national code |
Ref country code: CH Ref legal event code: L10 Free format text: ST27 STATUS EVENT CODE: U-0-0-L10-L00 (AS PROVIDED BY THE NATIONAL OFFICE) Effective date: 20251203 |
|
| 26N | No opposition filed |
Effective date: 20251023 |
|
| PG25 | Lapsed in a contracting state [announced via postgrant information from national office to epo] |
Ref country code: IE Free format text: LAPSE BECAUSE OF NON-PAYMENT OF DUE FEES Effective date: 20250129 |
|
| REG | Reference to a national code |
Ref country code: CH Ref legal event code: U11 Free format text: ST27 STATUS EVENT CODE: U-0-0-U10-U11 (AS PROVIDED BY THE NATIONAL OFFICE) Effective date: 20260201 |
|
| U20 | Renewal fee for the european patent with unitary effect paid |
Year of fee payment: 8 Effective date: 20260127 |
|
| PGFP | Annual fee paid to national office [announced via postgrant information from national office to epo] |
Ref country code: GB Payment date: 20260127 Year of fee payment: 8 |
|
| PGFP | Annual fee paid to national office [announced via postgrant information from national office to epo] |
Ref country code: ES Payment date: 20260202 Year of fee payment: 8 |
|
| PGFP | Annual fee paid to national office [announced via postgrant information from national office to epo] |
Ref country code: NO Payment date: 20260128 Year of fee payment: 8 |
|
| PGFP | Annual fee paid to national office [announced via postgrant information from national office to epo] |
Ref country code: CH Payment date: 20260201 Year of fee payment: 8 |