EP3767636B1 - Interface utilisateur pour système d'analyse de risques de patients - Google Patents
Interface utilisateur pour système d'analyse de risques de patients Download PDFInfo
- Publication number
- EP3767636B1 EP3767636B1 EP20187516.8A EP20187516A EP3767636B1 EP 3767636 B1 EP3767636 B1 EP 3767636B1 EP 20187516 A EP20187516 A EP 20187516A EP 3767636 B1 EP3767636 B1 EP 3767636B1
- Authority
- EP
- European Patent Office
- Prior art keywords
- patient
- user
- state
- time
- states
- Prior art date
- Legal status (The legal status is an assumption and is not a legal conclusion. Google has not performed a legal analysis and makes no representation as to the accuracy of the status listed.)
- Active
Links
Images























Classifications
-
- A—HUMAN NECESSITIES
- A61—MEDICAL OR VETERINARY SCIENCE; HYGIENE
- A61B—DIAGNOSIS; SURGERY; IDENTIFICATION
- A61B5/00—Measuring for diagnostic purposes; Identification of persons
- A61B5/72—Signal processing specially adapted for physiological signals or for diagnostic purposes
- A61B5/7235—Details of waveform analysis
- A61B5/7264—Classification of physiological signals or data, e.g. using neural networks, statistical classifiers, expert systems or fuzzy systems
-
- A—HUMAN NECESSITIES
- A61—MEDICAL OR VETERINARY SCIENCE; HYGIENE
- A61B—DIAGNOSIS; SURGERY; IDENTIFICATION
- A61B5/00—Measuring for diagnostic purposes; Identification of persons
- A61B5/72—Signal processing specially adapted for physiological signals or for diagnostic purposes
- A61B5/7271—Specific aspects of physiological measurement analysis
- A61B5/7275—Determining trends in physiological measurement data; Predicting development of a medical condition based on physiological measurements, e.g. determining a risk factor
-
- A—HUMAN NECESSITIES
- A61—MEDICAL OR VETERINARY SCIENCE; HYGIENE
- A61B—DIAGNOSIS; SURGERY; IDENTIFICATION
- A61B5/00—Measuring for diagnostic purposes; Identification of persons
- A61B5/74—Details of notification to user or communication with user or patient; User input means
- A61B5/742—Details of notification to user or communication with user or patient; User input means using visual displays
- A61B5/743—Displaying an image simultaneously with additional graphical information, e.g. symbols, charts, function plots
-
- G—PHYSICS
- G16—INFORMATION AND COMMUNICATION TECHNOLOGY [ICT] SPECIALLY ADAPTED FOR SPECIFIC APPLICATION FIELDS
- G16H—HEALTHCARE INFORMATICS, i.e. INFORMATION AND COMMUNICATION TECHNOLOGY [ICT] SPECIALLY ADAPTED FOR THE HANDLING OR PROCESSING OF MEDICAL OR HEALTHCARE DATA
- G16H40/00—ICT specially adapted for the management or administration of healthcare resources or facilities; ICT specially adapted for the management or operation of medical equipment or devices
- G16H40/60—ICT specially adapted for the management or administration of healthcare resources or facilities; ICT specially adapted for the management or operation of medical equipment or devices for the operation of medical equipment or devices
- G16H40/63—ICT specially adapted for the management or administration of healthcare resources or facilities; ICT specially adapted for the management or operation of medical equipment or devices for the operation of medical equipment or devices for local operation
-
- G—PHYSICS
- G16—INFORMATION AND COMMUNICATION TECHNOLOGY [ICT] SPECIALLY ADAPTED FOR SPECIFIC APPLICATION FIELDS
- G16H—HEALTHCARE INFORMATICS, i.e. INFORMATION AND COMMUNICATION TECHNOLOGY [ICT] SPECIALLY ADAPTED FOR THE HANDLING OR PROCESSING OF MEDICAL OR HEALTHCARE DATA
- G16H50/00—ICT specially adapted for medical diagnosis, medical simulation or medical data mining; ICT specially adapted for detecting, monitoring or modelling epidemics or pandemics
- G16H50/30—ICT specially adapted for medical diagnosis, medical simulation or medical data mining; ICT specially adapted for detecting, monitoring or modelling epidemics or pandemics for calculating health indices; for individual health risk assessment
-
- A—HUMAN NECESSITIES
- A61—MEDICAL OR VETERINARY SCIENCE; HYGIENE
- A61B—DIAGNOSIS; SURGERY; IDENTIFICATION
- A61B5/00—Measuring for diagnostic purposes; Identification of persons
- A61B5/02—Detecting, measuring or recording for evaluating the cardiovascular system, e.g. pulse, heart rate, blood pressure or blood flow
- A61B5/0205—Simultaneously evaluating both cardiovascular conditions and different types of body conditions, e.g. heart and respiratory condition
Definitions
- Document US 2011/004071 A1 discloses a system for displaying, in a timeline, medical information related to a human subject based on monitoring data, but not determining the utility of a particular invasive catheter measurement.
- Document US 2006/064396 A1 discloses a liver disease diagnosis system and graphical user interface for visualising and manipulating liver visual data sets.
- Document US 2011/112380 A1 discloses estimating and updating the current state of disease of a patient.
- the present disclosure relates to systems and methods for risk-based patient monitoring. More particularly, the present disclosure relates to systems and methods for assessing the current and future risks of a patient by combining data of the patient from various different sources.
- a first embodiment teaches a computer-implemented method of graphically communicating, to a user, patient risks for an individual patient, and includes the steps of receiving, from a device, data relating to a plurality of possible clinical patient states in which the patient may be classified; causing the display, on a display device, of a plurality of graphical indicators, each of the plurality of graphical indicators corresponding to one of the plurality of possible clinical patient states, each of the plurality of graphical indicators graphically identifying the probability that the patient is in a corresponding clinical patient state at a given point in a range of time, the plurality of graphical indicators configured to indicate a hazard level; and causing the display, on the display device, of a timeline controller configured to allow a user to dynamically select a plurality of points in time over the range of time, the graphical indicators changing dynamically in response to a specification by the user of one of the plurality of points in time to display the evolution of the plurality of patient states over the
- Graphical properties of the graphical indicators may indicate hazard levels.
- the plurality of graphical indicators are arranged on the display device segregated by hazard level so as to indicate a hazard level for each of the graphical indicators and in some embodiments the color of each of the plurality of graphical indicators indicates the hazard level associated with each such graphical indicator.
- the step of receiving, from a device, data relating to a plurality of possible clinical patient states in which the patient may be classified includes the step of receiving data identifying the plurality of possible clinical patient states in which the patient may be classified, and for each of the plurality of possible clinical patient states, also includes the steps of receiving data identifying the probability that the patient is in each of the possible patient states over the range of time; and receiving data identifying a hazard level into which each of the possible patient states is categorized.
- Bar charts may be used as graphical indicators.
- the arrangement of graphical indicators on the display device includes a bar chart having a plurality of bars, each bar associated with one of a plurality of hazard levels; and each of the plurality of graphical indicators is a bar in the bar chart.
- a bar within the bar chart may include a plurality of graphical indicators within a single hazard level.
- each of the bars has a length corresponding to the probability that the patient is in the corresponding clinical patient state at a given point in time.
- the hazard level of each of the graphical indicators is expressed by the color of said graphical indicator.
- the display device is a touch screen; and the dynamic controller is a slider displayed on the touch screen.
- Some embodiments also include displaying a graphical indicator configured to represent the utility of an invasive measurement, the utility of an invasive measurement expressing a divergence between: a first patient state distribution associated with the plurality of possible clinical patient states based on a plurality of internal state variables associated with a time interval, the plurality of internal state variables including an internal state variable resulting from the invasive measurement; and a simulated patient state distribution associated with the plurality of possible clinical patient states based on the same plurality of internal state variables associate with the same time interval, but excluding the internal state variable resulting from the invasive measurement.
- the first patient state distribution is weighted by hazard level.
- Some embodiments also include displaying a state variable data control feature that, when activated by the user, causes the display device to display internal state variables on which the patient states are based.
- Some embodiments also include displaying a tag creation feature that, when activated by the user, causes the display device to display a tag mark associated with the timeline controller at a selected point within the range of time, and some even include displaying a tag note creation field configured to permit annotation, by the user, of information associated with the tag.
- a non-transient computer readable medium having computer-executable code for graphically communicating, to a user, patient risks for an individual patient includes code for receiving, from a device, data relating to a plurality of possible clinical patient states in which the patient may be classified; code for causing the display, on a display device, of a plurality of graphical indicators, each of the plurality of graphical indicators corresponding to one of the plurality of possible clinical patient states, each of the plurality of graphical indicators graphically identifying the probability that the patient is in a corresponding clinical patient state at a given point in a range of time, the plurality of graphical indicators configured to indicate a hazard level; and code for causing the display, on the display device, of a timeline controller configured to allow a user to dynamically select a plurality of points in time over the range of time, the graphical indicators changing dynamically in response to a specification by the user of one of the plurality of points in time to display the evolution of the plurality of patient states over the range of time.
- the code is configured to arrange the graphical indicators on the display device segregated by hazard level so as to indicate a hazard level for each of the graphical indicators.
- the code is configured to display the graphical indicators in color, such that the color of each of the plurality of graphical indicators indicates the hazard level associated with each such graphical indicator.
- the code for receiving, from a device, data relating to a plurality of possible clinical patient states in which the patient may be classified includes: code for receiving data identifying the plurality of possible clinical patient states in which the patient may be classified, and for each of the plurality of possible clinical patient states, further includes: code for receiving data identifying the probability that the patient is in each of the possible patient states over the range of time; and code for receiving data identifying a hazard level into which each of the possible patient states is categorized.
- the arrangement of graphical indicators on the display device includes a bar chart having a plurality of bars, each bar associated with one of a plurality of hazard levels; and each of the plurality of graphical indicators is a bar in the bar chart.
- a bar within the bar chart may include a plurality of graphical indicators within a single hazard level.
- each of the bars has a length corresponding to the probability that the patient is in the corresponding clinical patient state at a given point in time.
- the hazard level of each of the graphical indicators is expressed by the color of said graphical indicator.
- the display device is a touch screen; and the dynamic controller is a slider displayed on the touch screen.
- Some embodiments further include code for displaying a graphical indicator configured to represent the utility of an invasive measurement, the utility of an invasive measurement expressing a divergence between: a first patient state distribution associated with the plurality of possible clinical patient states based on a plurality of internal state variables associated with a time interval, the plurality of internal state variables including an internal state variable resulting from the invasive measurement; and a simulated patient state distribution associated with the plurality of possible clinical patient states based on the same plurality of internal state variables associate with the same time interval, but excluding the internal state variable resulting from the invasive measurement.
- the first patient state distribution is weighted by hazard level.
- the code further includes code for displaying a state variable data control feature that, when activated by the user, causes the display device to display internal state variables on which the patient states are based.
- the code further includes code for displaying a tag creation feature that, when activated by the user, causes the display device to display a tag mark associated with the timeline controller at a selected point within the range of time. Further, in some embodiments, the code further includes code for displaying a tag note creation field configured to permit annotation, by the user, of information associated with the tag.
- a system for communicating, to a user, patient risks associated with a specific patient includes a display device; a computer processor configured to display a graphical user interface on the display device, the graphical user interface including: a plurality of graphical indicators, each of the plurality of graphical indicators corresponding to one of a plurality of possible clinical patient states for the patient, and identifying the probability that the patient is in a corresponding clinical patient state at a given point in a range of time, the plurality of graphical indicators configured to indicate a hazard level; and a timeline controller configured to allow the user to dynamically select a plurality of points in time over the range of time, the graphical indicators changing dynamically in response to a specification by the user of one of the plurality of points in time to display the evolution of the plurality of patient states over the range of time.
- the plurality of graphical indicators are arranged on the display device segregated by hazard level so as to indicate a hazard level for each of the graphical indicators.
- the color of each of the plurality of graphical indicators indicates the hazard level associated with each such graphical indicator.
- the arrangement of graphical indicators on the display device includes a bar chart having a plurality of bars, each bar associated with one of a plurality of hazard levels; and each of the plurality of graphical indicators includes a bar in the bar chart.
- a bar within the bar chart may include a plurality of graphical indicators within a single hazard level.
- each of the bars may have a length corresponding to the probability that the patient is in the corresponding clinical patient state at a given point in time.
- the hazard level of each of the graphical indicators may be expressed by the color of said graphical indicator.
- the display device includes a touch screen; and the dynamic controller is a slider displayed on the touch screen.
- Some embodiments of a system for communicating, to a user, patient risks associated with a specific patient additionally include a graphical indicator configured to represent the utility of an invasive measurement, the utility of an invasive measurement expressing a divergence between: a first patient state distribution associated with the plurality of possible clinical patient states based on a plurality of internal state variables associated with a time interval, the plurality of internal state variables including an internal state variable resulting from the invasive measurement; and a simulated patient state distribution associated with the plurality of possible clinical patient states based on the same plurality of internal state variables associate with the same time interval, but excluding the internal state variable resulting from the invasive measurement.
- the first patient state distribution is weighted by hazard level.
- the graphical user interface further includes: a state variable data control feature that, when activated by the user, causes the display device to display internal state variables on which the patient states are based.
- the graphical user interface further includes: a tag creation feature that, when activated by the user, causes the display device to display a tag mark associated with the timeline controller at a selected point within the range of time.
- a tag creation feature that, when activated by the user, causes the display device to display a tag mark associated with the timeline controller at a selected point within the range of time.
- some embodiments further include a tag note creation field configured to permit annotation, by the user, of information associated with the tag.
- the technologies described herein can be embodied as a monitoring system for critical care, which combines data from various bedside monitors, electronic medical records, and other patient specific information to assess the current and the future risks to the patient.
- the technologies can be also embodied as a decision support system that prompts the user with specific actions according to a standardized medical plan, when patient specific risks pass a predefined threshold.
- Yet another embodiment of the described technologies is an outpatient monitoring system which combines patient and family evaluation, together with information about medication regiments and physician evaluations to produce a risk profile of the patient, continuously track its clinical trajectory, and provide decision support to clinicians as regarding when to schedule a visit or additional tests.
- FIG. 1 illustrates a medical care risk based monitoring environment 1010 for providing health providers, such as physicians, nurses, or other medical care providers, risk-based monitoring in accordance with various embodiments of the present disclosure.
- a patient 101 may be coupled to one or more physiological sensors or bedside monitors 102 that may monitor various physiological parameters of the patient. These physiological sensors may include but are not limited to, a blood oximeter, a blood pressure measurement device, a pulse measurement device, a glucose measuring device, one or more analyte measuring devices, an electrocardiogram recording device, amongst others.
- the patient may be administered routine exams and tests and the data stored in an electronic medical record (EMR) 103.
- EMR electronic medical record
- the electronic medical record 103 may include but is not limited to stored information such as hemoglobin, arterial and venous oxygen content, lactic acid, weight, age, sex, ICD-9 code, capillary refill time, subjective clinician observations, patient self-evaluations, prescribed medications, medications regiments, genetics, etc.
- the patient 101 may be coupled to one or more treatment devices 104 that are configured to administer treatments to the patient.
- the treatments devices 104 may include extracorporeal membrane oxygenator, ventilator, medication infusion pumps, etc.
- a patient specific risk-based monitoring system may be configured to receive patient related information, including real-time information from bed-side monitors 102, EMR patient information from electronic medical record 103, information from treatment devices 104, such as settings, infusion rates, types of medications, and other patient related information, which may include the patient's medical history, previous treatment plans, results from previous and present lab work, allergy information, predispositions to various conditions, and any other information that may be deemed relevant to make an informed assessment of the possible patient conditions and states, and their associated probabilities.
- patient related information including real-time information from bed-side monitors 102, EMR patient information from electronic medical record 103, information from treatment devices 104, such as settings, infusion rates, types of medications, and other patient related information, which may include the patient's medical history, previous treatment plans, results from previous and present lab work, allergy information, predispositions to various conditions, and any other information that may be deemed relevant to make an informed assessment of the possible patient conditions and states, and their associated probabilities.
- patient-specific information For the sake of simplicity, the various types of information listed above will generally be referred to hereinafter as "patient-specific information”.
- the system may be configured to utilize the received information, determine the clinical risks, which then can be presented to a medical care provider, including but not limited to a physician, nurse, or other type of clinician.
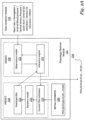
- the system includes one or more of the following: a processor 111, a memory 112 coupled to the processor 111, and a network interface 113 configured to enable the system to communicate with other devices over a network.
- the system may include a risk-based monitoring application 1020 that may include computer-executable instructions, which when executed by the processor 111, cause the system to be able to afford risk based monitoring of the patients, such as the patient 101.
- the risk based monitoring application 1020 includes, for example, a data reception module 121, a physiology observer module 122, a clinical trajectory interpreter module 123, and a visualization and user interaction module 124.
- the data reception module 121 may be configured to receive data from bedside monitors 102, electronic medical records 103, treatment devices 104, and any other information that may be deemed relevant to make an informed assessment regarding the patient's clinical risks, and any combination thereof of the preceding elements.
- the physiology observer module 122 utilizes multiple measurements to estimate probability density functions (PDF) of internal state variables (ISVs) that describe the components of the physiology relevant to the patient treatment and condition in accordance with a predefined physiology model.
- the ISVs may be directly observable with noise (as a non-limiting example, heart rate is a directly observable ISV), hidden (as a non-limiting example, oxygen delivery (DO 2 ) defined as the flow of blood saturated oxygen through the aorta cannot be directly measured and is thus hidden), or measured intermittently (as a non-limiting example, hemoglobin concentration as measured from Complete Blood Count tests is an intermittently observable ISV).
- noise as a non-limiting example, heart rate is a directly observable ISV
- hidden as a non-limiting example, oxygen delivery (DO 2 ) defined as the flow of blood saturated oxygen through the aorta cannot be directly measured and is thus hidden
- measured intermittently as a non-limiting example, hemoglobin concentration as
- the physiology observer module 122 of the present disclosure provides probability density functions as an output. Additional details related to the physiology observer module 122 are provided herein.
- the clinical trajectory interpreter module 123 may be configured, for example, with multiple possible patient states, and may determine which of those patient states are probable and with what probability, given the estimated probability density functions of the internal state variables.
- a patient state is defined as a qualitative description of the physiology at a particular point of a clinical trajectory, which is recognizable by medical practice, and may have implications to clinical decision-making. Examples of particular patient states include, but are not limited to, hypotension with sinus tachycardia, hypoxia with myocardial depression, compensated circulatory shock, cardiac arrest, hemorrhage, amongst others.
- these patient states may be specific to a particular medical condition, and the bounds of each of the patient states may be defined by threshold values of various physiological variables and data.
- the clinical trajectory interpreter module 123 may determine the patient conditions under which a patient may be categorized using any of information gathered from reference materials, information provided by health care providers, other sources of information.
- the reference materials may be stored in a database or other storage device 130 that is accessible to the risk based monitoring application 1020 via network interface 113, for example. These reference materials may include material synthesized from reference books, medical literature, surveys of experts, physician provided information, and any other material that may be used as a reference for providing medical care to patients.
- the clinical trajectory interpreter module 123 may first identify a patient population that is similar to the subject patient being monitored. By doing so, the clinical trajectory interpreter module 123 may be able to use relevant historical data based on the identified patient population to help determine the possible patient states.
- the clinical trajectory interpreter module 123 is capable of also determining the probable patient states under which the patient can be currently categorized, given the estimated probability density functions of the internal state variables, as provided by physiology observer module 122. In this way, each of the possible patient states is assigned a probability value from 0 to 1. The combination of patient states and their probabilities is defined as the clinical risk to the patient. Additional details related to the clinical trajectory interpreter module 123 are provided herein.
- Visualization and user interactions module 124 may be equipped to take the outputs of the data reception module 121 the physiology observer module 122, and the clinical trajectory interpreter module 123 and present them to the clinical personnel.
- the visualization and user interactions module 124 may show the current patient risks, their evolution through time, the probability density functions of the internal state variables as functions of time, and other features that are calculated by the two modules 122 and 123 as by-products and are informative to medical practice. Additionally, visualization and user interactions module 124 enables the users to set alarms based on the patient state probabilities, share those alarms with other users, take notes related to the patient risks and share those notes with other users, and browse other elements of the patient medical history. Additional details related to the visualization and user interactions module 124 are provided herein.
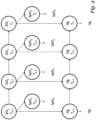
- FIG. 2 illustrates a basic schematic of the physiology observer module 122, which utilizes two models of the patient physiology: a dynamic model 212 and an observation model 221.
- the dynamic model 212 captures the relationship arising between the internal state variables at some time t k and another close time t k+1 , thereby enabling modeling of the patient physiology as a system whose present state has information about the possible future evolutions of the system.
- the observation model 221 may capture the relationships between measured physiology variables and other internal state variables.
- Examples of such models include: a) the dependence of the difference between systolic and diastolic arterial blood pressures (also called pulse pressure) on the stroke volume; b) the relationship between heart rate, stroke volume, and cardiac output; c) the relationship between hemoglobin concentration, cardiac output and oxygen delivery; d) the relationship between the Vanderbilt Assessment Scale and the clinical state of an attention deficit and hyperactivity disorder patient; and e) any other dependence between measurable and therefore observable parameters and internal state variables.
- the physiology observer module 122 functions as a recursive filter by employing information from previous measurements to generate predictions of the internal state variables and the likelihood of probable future measurements and then comparing them with the most recently acquired measurements. Specifically the physiology observer module 122 utilizes the dynamic model 212 in the predict step or mode 210 and the observation model 221 in the update step or mode 220. During the prediction mode 210, the physiology observer module 122 takes the estimated PDFs of ISVs 213 at a current time step t k and feeds them to the dynamic model 212, which produces predictions of the ISVs 211 for the next time step t k+1 .
- the physiology observer module 122 may utilize initial estimates 250, which may be derived from an educated guess of possible values for the ISVs or statistical analysis of previously collected patient data.
- FIG. 3 illustrates a non-limiting example of models that enable the physiology observer in accordance with the present disclosure.
- the management of oxygen delivery, DO2 is an important part of critical care. Therefore, precise estimation of DO2 can inform improved clinical practice.
- this estimation is achieved through the measurements of hemoglobin concentration (Hg), heart rate (HR), diastolic and systolic arterial blood pressures, and SpO2.
- the dynamic model 212 assumes that oxygen delivery is driven by a feedback process which stabilizes it against stochastic disturbances. Similarly, hemoglobin concentration is controlled around the norm value of 15 mg/dL.
- the observation model 221 takes into account the relationship between arterial oxygen saturation SpO2, hemoglobin concentration and arterial oxygen content CaO2, the dependence of the difference between systolic, ABPs, and diastolic, ABPd, arterial blood pressures (also called pulse pressure) on the stroke volume, and the relationship between heart rate, HR, stroke volume, SV, and cardiac output.
- the two models are abstracted as a Dynamic Bayesian Network (DBN), and the physiology observer module 122 utilizes the DBN to continuously track the oxygen delivery.
- DBN Dynamic Bayesian Network
- a Dynamic Bayesian Network is a systematic way to represent statistical dependencies in terms of a graph whose vertices signify variables (observable and unobservable), and whose edges show causal relationships.
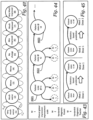
- FIG. 4 depicts a non-limiting example of the physiology observer described above tracking DO2, but over a longer time interval, i.e., 4 time steps.
- the main hidden ISV is the oxygen delivery variable (DO2).
- DO2 oxygen delivery variable
- the two types of measurements, Hemoglobin (Hg) and oximetry (SpO2) are in dashed circles in FIG. 4 .
- SpO2 is an example of the continuous or periodic measurements that the physiology observer module 122 receives from sensors, such as bedside monitors 102 and treatment devices 104 connected to the patient 101 that continuously report information.
- Hemoglobin is an example of an intermittent or aperiodic measurement extracted from patient lab work that is available to the observer on a sporadic and irregular basis, and latent at times, relative to current system time.
- the physiology observer module 122 is capable of handling both types of measurements because, along with tracking the hidden ISVs, e.g. DO2, module 122 also continuously maintains estimates of the observed values for all types of measurements, even when measurements are not present.
- FIG. 4 depicts these estimates for the case of SpO2 and Hg. As can be seen, the SpO2 measurements are available regularly at each time step, whereas Hg is only available at two of the time steps.
- certain measurements such as Hemoglobin
- the physiology observer module 122 may handle such out of sequence measurements using back propagation, in which the current estimates of the ISVs are projected back in time to the time of validity of the measurements, so that the information from the latent measurement can be incorporated correctly.
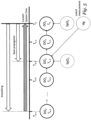
- FIG. 5 depicts such time line.
- hemoglobin arrives at the current system time, t k , but is valid and associated back to the ISV (DO2) at time T k-2 .
- Back propagation is the method of updating the current ISVs probability estimates P ( ISVs ( t k )
- ISVs ( t k )) that defines how the current probabilities evolve backwards in time.
- the latent measurement information is incorporated using Bayes' rule in the standard update: P ISVs t k ⁇ n
- M t k , m t k ⁇ n P m t k ⁇ n
- the updated probabilities are then propagated back to the current time t k using the prediction step described earlier. Back propagation can be used to incorporate the information.
- Another functionality of the physiology observer module 122 includes smoothing.
- the care provider using the system 100 may be interested in the patient state at some past time.
- the physiology observer module 122 may provide a more accurate estimate of the patient ISVs at that time in the past by incorporating all of the new measurements that the system has received since that time, consequently providing a better estimate than the original filtered estimate of the overall patient state at that time to the user, computing P ( ISVs ( t k-n )
- This is accomplished using the first step of back propagation in which the probability estimates at time t k which incorporate all measurements up to that time are evolved backwards to the time of interest t k-n using the defined transition probability kernel.
- FIG. 5 in which the user is interested in the patient state at t k-n and the estimates are smoothed back to that time.
- module 122 may filter artifacts of the measurements that are unrelated to the actual information contained in the measurements. This is performed by comparing the newly acquired measurements with the predicted likelihoods of probable measurements given the previous measurements. If the new measurements are considered highly unlikely by the model, they are not incorporated in the estimation. The process of comparing the measurements with their predicted likelihoods effectively filters artifacts and reduces noise.
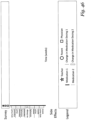
- FIG. 6 shows an example of such a process involving mean arterial blood pressure (ABPm).
- FIG. 6 shows the raw ABPm measurements prior to being processed by the physiology observer with the measurement artifacts identified, as well as the filtered measurements after being processed by the physiology observer module 122. As can be seen, the measurement artifacts have been removed and the true signal is left.
- physiology observer module 122 may utilize a number of algorithms for estimation or inference. Depending on the physiology model used, the physiology observer module 122 may use exact inference schemes, such as the Junction Tree algorithm, or approximate inference schemes using Monte Carlo sampling such as a particle filter, or a Gaussian approximation algorithms such as a Kalman Filter or any of its variants.
- exact inference schemes such as the Junction Tree algorithm
- approximate inference schemes using Monte Carlo sampling such as a particle filter
- Gaussian approximation algorithms such as a Kalman Filter or any of its variants.
- the physiology model used by physiology observer module 122 may be implemented using a probabilistic framework known as a Dynamic Bayesian Network, which graphically captures the causal and probabilistic relationship between the ISVs of the system, both at a single instance of time and over time. Because of the flexibility this type of model representation affords, the physiology observer module 122 may utilize a number of different inference algorithms. The choice of algorithm is dependent on the specifics of the physiology model used, the accuracy of the inference required by the application, and the computational resources available to the system. Used in this case, accuracy refers to whether or not an exact or approximate inference scheme is used. If the physiology observer model is of limited complexity, then an exact inference algorithm may be feasible to use. In other cases, for more complex physiology observer models, no closed form inference solution exists, or if one does exist, it is not computationally tractable given the available resources. In this case, an approximate inference scheme may be used.
- a probabilistic framework known as a Dynamic Bayesian
- the simplest case in which exact inference may be used is when all of the ISVs in the physiology model are continuous variables, and relationships between the ISVs in the model are restricted to linear Gaussian relationships.
- a standard Kalman Filter algorithm can be used to perform the inference.
- the probability density function over the ISVs is a multivariate Gaussian distribution and is represented with a mean and covariance matrix.
- the physiology observer module 122 may use either a Forward-backward algorithm, or a Belief Propagation algorithm for inference, respectively.
- the Junction Tree algorithm is a generalization of these two algorithms that can be used regardless of the underlying graph structure, and so the physiology observer module 122 may also use this algorithm for inference. Junction Tree algorithm comes with additional computational costs that may not be acceptable for the application.
- the probability distribution functions can be represented in a tabular form.
- the physiology observer module 122 may use an approximate inference scheme that relies on sampling techniques.
- the simplest version of this type of algorithm is a Particle Filter algorithm, which uses Sequential Importance Sampling. Markov Chain Monte Carlo (MCMC) Sampling methods may also be used for more efficient sampling. Given complex and non-linear physiologic relationships, this type of approximate inference scheme affords the most flexibility.
- MCMC Markov Chain Monte Carlo
- the physiology observer may utilize an adaptive resampling scheme.
- regions of the ISV state space may be associated with different patient states, and different levels of hazard to the patient. The higher the number, the more hazardous that particular condition is to the patient's health.
- FIG. 7 illustrates an example of this resampling.
- State 1 and State 2 have the highest hazard level.
- the left plot depicts the samples generated from the standard resampling. Notice there are naturally more particles in state 1 and state 2 region because these states are most probable.
- the right plot shows the impact of the adaptive resampling. Notice how the number of samples in the areas of highest risk has increased significantly.
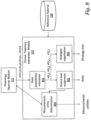
- the Clinical Trajectory Interpreter 123 takes the joint Probability Density Functions of the ISVs from physiology observer module 122, and performs state probability estimation 801 to calculate the probabilities of different patient states.
- the Probability Density Functions of the ISVs may be defined in closed form, for example multidimensional Gaussians 260, or approximated by histogram 280 of particles 270, as illustrated in FIGS. 2B-D . In both cases, the probability density functions of the ISVs can be referred to as: P(ISV1(t), ISV2(t), . . . , ISVn(t)), where t is the time they refer to.
- the patient state may be defined by a conditional probability density function: P ( S
- P(ISV1(t), ISV2(t), ..., ISVn(t)) is defined by a closed form function such as multidimensional Gaussian 260
- the integration may be performed directly.
- P(ISV1(t), ISV2(t), ... , ISVn(t) is approximated by a histogram 280 of particles 270
- ISV 1 , ISV 2 , ..., ISV n ) is defined by a partition of the space spanned by ISV 1 , ISV 2 , ..., ISV n n into regions as shown in FIG. 9
- the probability P ( S i ( t )) may be calculated by calculating the fraction of particles 270 in each region.
- the clinical trajectory interpreter module 123 may assign different hazard levels 802 for each patient state or organize the states into different etiologies 803.
- the clinical trajectory interpreter module 123 in conjunction with the physiology observer module 122, may perform measurements utility determination 804 to determine the utility of different invasive measurements such as invasive blood pressures or invasive oxygen saturation monitoring.
- the Clinical trajectory interpreter Module 123 determines the probabilities that the patient is in a particular state, rather than the exact state that the patient is in.
- FIG. 9 illustrates a non-limiting example of a definition of a patient state that may be employed by the clinical trajectory interpreter module 123.
- ISV 1 , ISV 2 , ..., ISV n ) may be defined by partitioning the domain spanned by the internal state variables ISV 1 , ISV 2 , ..., ISV n .
- the particular example assumes that the patient physiology is described by two internal state variables: Pulmonary Vascular Resistance (PVR) and Cardiac Output (CO).
- PVR Pulmonary Vascular Resistance
- CO Cardiac Output
- PVR can be used to define the attributes of Normal PVR and High PVR, and CO to define the attributes of Normal CO and Low CO, by assigning thresholds with the two variables.
- four separate states can be defined: State 1: Low CO, Normal PVR; State 2: Low CO, High PVR; State 3: Normal CO, High PVR; State 4: Normal CO Normal PVR.
- FIG. 10 illustrates a non-limiting example of how the clinical trajectory interpreter module 123 may employ the definition of patient states to assign probabilities that the patient may be classified under each of the four possible patient states at a particular point of time.
- the clinical trajectory interpreter module 123 takes the joint probability density function of P(Cardiac Output (Tk), Pulmonary Vascular Resistance (Tk)) and integrates it over the regions corresponding to each particular state, which produces P(S1(Tk)), P(S2(Tk)), P(S3(Tk)), and P(S4(Tk)).
- the clinical trajectory interpreter module 123 assigns a probability that a particular patient state is ongoing, given the information provided by the physiology observer module 122. Note that if the output of the physiology observer module 122 is not a closed form function 260 but a histogram 280 of particles 270, the clinical interpreter will not perform integration but just calculate the relative fraction of particles 270 within each region.
- FIG. 11 illustrates an alternative approach of estimating the probabilities for different patient states.
- the clinical trajectory interpreter module 123 employs the joint probability functions of the ISVs for two consecutive time windows T k and T k+1 to calculate a moving window average. Note in the example that the size of the window is doubled for two time instances, which indicates that the window may be of an arbitrary, suitable size. As a result of this moving window averaging, the clinical trajectory interpreter module 123 performs a dynamic analysis of the trajectory of the ISVs.
- this probability calculation gives an estimate of the probability that a particular patient state may be ongoing in the chosen time-frame, as opposed to just at a chosen time instance.
- Clinical trajectory interpreter module 123 may also assign hazard levels to each particular state.
- FIG. 12 illustrates a non-limiting example of a definition of patient states assigned with hazard levels by the clinical trajectory interpreter module 123.
- the hazard levels may be informed from clinician surveys, reference literature or any other clinical sources.
- the clinical trajectory interpreter module 123 distinguishes between four different hazard levels: 1--Minimal risk, 2--Mild risk, 3--Medium risk, and 4--Severe risk.
- the combination of the probability of a patient state and its hazard level will be referred from hereon as a "Patient risk.”
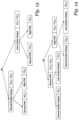
- FIG. 13 illustrates how the patient states and their respective probabilities may be organized into tree graphs called etiologies.
- the attributes normal and low associated with the cardiac output ISV are the base nodes of the graph.
- Each of these vertexes has two children associated with the attributes of the pulmonary vascular resistance.
- This organization leads to each patient state being a leaf (end vertex) on the tree.
- This particular tree will be referred to as an etiology tree.
- the etiology tree may be further employed by the visualization and user interaction module 124 to provide a layered view of the various patient risks as further described herein.
- FIG. 14 illustrates that the etiology tree may not be unique for a given set of patient states and physiologic variables.
- FIG. 14 provides an alternative etiology tree for the example from FIG. 13 .
- the root of the alternative etiology tree starts from the attributes associated with the pulmonary vascular resistance, instead of the attributes associated with cardiac output.
- different rules may be employed for generating the trees depending on various factors and the context of use. For example, one etiology tree may be preferred against another realization in different clinical situations or depending on the preference of the users. Moreover, the tree may dynamically change as the risks change and the clinical situation evolves.
- FIG. 15 illustrates a method for calculating the utility of different measurements.
- the risk-based system 100 and the clinical trajectory interpreter module 123 calculates the utility of a particular measurement with the illustrated procedure. Particularly, in step 9001, a measurement m i is be selected. Given measurement m i and a current time (tcurrent), in step 9002, the clinical trajectory interpreter module 123 submits an instruction to the physiology observer module 122 to simulate the physiology observer module output (the probability density functions of the internal state variables) from a given arbitrary point back from the current time (t current -T) to the current time t current with removal of measurement m i from the algorithm output.
- t current current time
- step 9003 the clinical trajectory interpreter module 123 simulates the state probabilities estimation given the simulated output of the physiology observer and arrives with a set of patient state probabilities, i.e., P sim (S 1 (t current )), P sim (S 2 (t current )), ... , P sim (S n (t current )). Then, in step 9004, using the state probabilities determined from all available measurements, i.e., P(S 1 (t current )), P(s2(tcurrent)), ...
- the clinical trajectory interpreter module 123 can perform the utility calculation not only for a particular measurement, but also for any group of measurements.
- the utility calculation can also include a component that captures the potential harm associated with a particular measurement. For example, the invasive catheter measurement described above would have a large level of harm associated with it. In this way, the calculation trades the harm associated with the measurement against the value of information it provides.
- the risk-based monitoring system 100 can also integrate external computation generated from third party algorithms implemented either on the same computation medium as the patient-based monitoring system or as a part of an external device.
- FIG. 16 illustrates one possible realization of integration of an external computation generated from third party algorithms.
- the output from the external computation 9110 is provided to the clinical trajectory interpreter module 123 which implements integration instructions 9120.
- the state probability estimation 801 produces new states P(newS 1 ), P(newS 2 ), P(newS 3 ) ,..., P(newS n+m ), which may result in an increased number of states n+m from the original number of n states.
- integration instructions 9120 may be provided to the hazard level assignment 802 and the etiology organization 803.
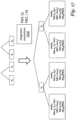
- FIG. 17 illustrates an example of integration instructions.
- the integration instruction may also employ prior probabilities P(A
- EC P EC
- FIG. 18 illustrates an additional example of integration instructions of an external computation.
- the risk-based monitoring system 100 can perform the integration, as shown in FIG. 18 , both in the case that the external computation 9110 is generated on the same computational medium as the patient-based monitoring system, or as a part of an external device.
- the external computation 9110 provides direct information about a particular internal state variable estimated by the physiology observer module 122 (or enhanced physiology observer module 9300). Therefore, to integrate the external computation, the physiology observer module 122 can treat the external computation 9110 as an additional measurement and integrate it directly into the observation model 221.
- FIG. 19 illustrates example functionalities of the visualization and user interactions module 124.
- module 124 may receive all available patient information and data including, the data from the data reception module 121, the joint probability density function produced by the physiology observer module 122, and the etiology tree, the risks, and the invasive measurements utilities estimated by the clinical trajectory interpreter module 123.
- the visualization and user interactions module 124 may produce: 1) a unit view 1501 of patients describing their risks, diagnoses, etc.; 2) a view 1502 of a patient's electronic medical record including laboratory results, prescribed medication, diagnoses, etc.; 3) a view 1503 of a patient's ongoing risks; 4) a view 1504 of a patient's risk trajectory, i.e., how the probabilities for particular patient states have evolved in a particular time frame; 5) a view 1505 of a patient's measurements utilities in the estimation of the particular patient risks; 6) a plot of a patient estimated ISVs' PDFs 1506 describing the time evolution of the ISVs' PDFs; 7) a view 1507 enabling to navigate through the etiology tree of the patient and thus visualize different levels of the tree; 8) a view 1508 showing a patient's predicted risks; 9) a view 1509 enabling clinicians to view and set patient risk based alarms; 10) a view 1510 of a
- FIG. 20 illustrates an example of a summary view 2000 that may convey in a single screen a risk profile for each patient in a particular hospital unit.
- the risk profile represents what is the cumulative probability of the patient being in a particular hazard level. It is calculated by summing the current probabilities of all states at particular hazard level.
- the summed probabilities, hazard levels are represented by the height of four bars, each bar corresponding to a particular hazard level.
- these hazard levels may be Green (slanted hatching)--Minimal risk, Yellow (vertical hatching)--Mild risk, Orange (horizontal hatching)--Medium risk, and Red (dotted hatching)--Severe risk.
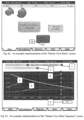
- FIG. 21 illustrates one possible realization of a view 2100 describing the ongoing risks of the patient.
- Each round-cornered box corresponds to a particular risk: the color corresponds to the hazard level with Green (slanted hatching)-Minimal risk, Yellow (vertical hatching)--Mild risk, Orange (horizontal hatching)-Medium risk, and Red (dotted hatching)--Severe risk; the height of the box corresponds to the probability of the particular patient state. Risks are grouped in columns based on their hazard levels. The screen and the respective risks are updated in real-time as new data becomes available.
- the system 100 may provide information about the utility of the various invasive measurements in determining these risks.
- the illustrated example gives the utilities of invasive arterial blood pressure (ABP) and invasive central venous pressure (CVP) measurements.
- the utility may be represented by filled bars 2110 and 2120, and the maximum utility may correspond to six filled bars.
- the six filled bars may be displayed in color gradient from 1-dark green, 2-light green, 3-yellow, 4-red, 5-purple, to 6-white or empty.
- the filled bars 2110 for ABP show all six colors, while two of the filled bars 2120 for CVP respectfully show 1-dark green and 2-light green and the remaining filled bars 2110 show 6-white or empty.
- FIG. 22 illustrates a view 2200 and how a slider 2210 or other graphic element on top of the patient view may be utilized in reviewing the history of the patient risks.
- the slider 2210 is moved to show the patient risks at approximately four hours back from current time. This enables clinicians to review the continuous evolution of the patient risks and compare them with the applied treatment or any other external factors.
- slider 2210 may be moved on the user interface with a pointing device, a command, or, if utilized in conjunction with touch sensitive displays, through touching and dragging the slider or other graphic element to designate the desired time period.
- the etiology tree is used to combine the two states State A 2130: Hypoxia with low cardiac output and State B 2140: hypoxia with low Qp:Qs from FIG. 21 to represent them by a single patient state (Hypoxia) 2220. In the particular example, this is used to fit the text into the smaller box of FIG. 22 relative to FIG. 21 .
- the user can navigate the etiology tree in view 2300 by clicking on the composite patient state 2220 and viewing its constituent patient states 2130 and 2140, as illustrated in FIG. 23 .
- FIG. 24 illustrates in view 2400 how in the same framework the user may view the predicted risks for the patient by moving the slider 2410 ahead of current time.
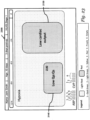
- [DB3] FIG. 25 illustrates in view 2500 an interactive dialog box 2510 through which the user may define the conditions to set an alarm for a particular risk. The user achieves this by selecting the particular risk and then setting upper and lower thresholds for the patient state probability associated with this risk. No alarm is activated as long as the patient state probability is between the upper and the lower threshold. The alarm is activated when the patient state probability crosses the threshold. Once the alarm is activated the system 100 may notify a list of chosen people, or send the notification to another clinical system. Any of module 122-124 may actually store their respective threshold data ranges and initiate the trigger depending on the specific parameter.
- FIG. 26 illustrates in view 2600 yet another possible visualization of the patient risk trajectory, i.e. the evolution of the patient states' probabilities associated with particular risks.
- the user may choose what time series of patient state probabilities he/she wants to display, and the system plots these probabilities against time.
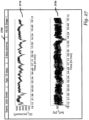
- FIG. 27 illustrates in view 2700 how the system 100 may directly present the probability density functions of various internal state variables.
- the estimated PDF of oxygen delivery is plotted in graph 2710 as a function of time, with darker colors corresponding to higher likelihood.
- the estimated PDF of mixed venous oxygenation saturation (SvO2) is plotted in graph 2720 and compared with actual measurements (dark circles).
- FIG. 28 in view 2800 illustrates an example of a tagging definition interface 2810 that enables clinicians to mark specific instances of time or specific periods of time 2820 that are of interest or represent important points in the clinical course, i.e. a tag.
- Tags may be shared or sent via dialog box 2830 to specified recipients, or may be included in notes or any other part of the user interface. Users may be able to annotate a tag with particular comments or observations via dialog box 2840, and tags may be classified into categories from menu list 2850, for example, a tag may represent a change in medication dosing, an intervention, a note regarding monitors or measuring equipment, etc.
- Tags and their respective time-series markings may be color coded to indicate various properties, such as their category.
- green tag-marks on a time series may represent changes in medication
- red tag-marks may represent interventions
- yellow tag marks may represent periods of heightened concern.
- the user may be prompted to define time instance or the time period, the category of the tag, the annotation for the tag, and how the tag should be handled by the system.
- annotations may be suggested by using natural language processing to convert the etiologies of the condition into note form.
- FIG. 29 illustrates in view 2900 a Newsfeed view 2910 comprising tags, notes, or information taken from external sources, such as the time of a blood draw as taken from an electronic medical record (EMR).
- the Newsfeed 2910 may allow clinicians to view and post events, periods of interest, interventions, notes, tags, etc., which are posted by other clinicians. Clinicians may view the entire Newsfeed, or sort it based on Tag category, hazard level, etc. Further, clinicians may search for tags based on keywords, intervention type, time of stay, source of information, etc.
- Entries 2920-2926 on Newsfeed 2010 may indicate any of the category, source of tag, and patient overview, either in words, or as a picture, such as the risk profile.
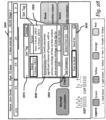
- FIG. 30 illustrates in view 3000 a Condition Summary View 3010 through which the clinician may request a condition summary by selecting or clicking a particular patient state.
- the Condition Summary View 3010 then may present clinicians with a description of a particular state, including both definitions in window 3020 of the state, and information regarding how the system arrived at the conclusion about this patient state probability.
- This view 3010 may provide the likelihood and hazard level of the patient state, the definition of the patient state in terms of ISV thresholds, and the likelihood of each attribute defining the state, as illustrated and can also provide a natural language description and evidence window 3030 of evidence contributing to the patient state, by translating the ISVs PDFs into a qualitative textual description, or by directly presenting numerical information regarding the evidence.
- FIG. 30 illustrates in view 3000 a Condition Summary View 3010 through which the clinician may request a condition summary by selecting or clicking a particular patient state.
- the Condition Summary View 3010 then may present clinicians with a description of a particular state, including both definitions in window 3020 of the
- the Condition Summary View 3010 illustrates the Condition Summary View 3010 for the patient state shock due to low cardiac output.
- the Condition Summary View 3010 presents the probability of the "shock due to low cardiac output" state, and the hazard level of the state shown in color or dotted hatching. Further, the definitions of shock (mixed venous saturation below or equal to 45%), and low cardiac output (cardiac output below 3.2 liters per minute per meter squared), along with the probabilities that each of these are satisfied (e.g., 40% for shock and 30% for low CO) is presented.
- the evidence window 3030 conveys the information which leads to the assessment of "Shock due to low CO".
- the system has converted the information regarding the probabilities of the etiologies into a textual form, specifically that the estimated probability is mainly driven by the fact that there is sub nominal pulse pressure (systolic blood pressure minus diastolic blood pressure) indicating reduced stroke volume.
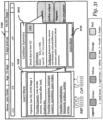
- FIG. 31 further illustrates in view 3100 the ability for the user interface to include and display reference material, which may be accessed through the Internet, or stored within the system 100 or remotely accessible thereby.
- Selecting the Learn More button 3110 in the Condition Summary View 3010 may bring up a Learn More View 3120, which shows reference information associated with the Condition Summary View 3010.
- Reference information may include causes, interventions, common comorbidities, anatomy, relevant publications, etc.
- this feature may serve as a training tool to familiarize clinicians with managing the particular patient population, or treatment strategies.
- hypoplastic Left Heart Syndrome is a congenital heart defect, which is manifested by an underdeveloped left ventricle and left atrium.
- patients suffering from this condition do not have separated systemic and pulmonary blood flows, but instead the right ventricle is responsible for pumping blood to both the body and the lungs. Therefore, the hemodynamic optimization during intensive care involves managing the fractions of the blood flow that pass through the lungs (pulmonary flow Q p ) and the body (systemic flow Q s ).
- the optimal hemodynamic state is reached when, adequate tissue oxygen delivery, DO 2 , is achieved for a pulmonary to systemic blood flow ratio, denoted Q p /Q s , of 1.
- Table 1 Variable Description Units Type DO 2 Indexed Oxygen Delivery mL O 2 /min/m 2 Dynamic VO 2 Indexed Oxygen Consumption mL O 2 /min/m 2 Dynamic PVR Pulmonary Vascular Resistance mm Hg/L/min/m 2 Dynamic SVR System Vascular Resistance mm Hg/L/min/m 2 Dynamic ⁇ PVR Change in PVR per time step mm Hg/L/min/m 2 Dynamic ⁇ SVR Change in SVR per time step mm Hg/L/min/m 2 Dynamic Hb Hemoglobin g/dL Dynamic/Observed HR Heart Rate Beats per min Dynamic/Observed SpvO 2 Pulmonary Venous Oxygen Saturation % Dynamic SaO 2 Arterial Oxygen S
- Table 1 lists state variables that may be used in the model of HLHS physiology after stage 1 palliation, the variable description, units, and type of variable.
- variables encompass circulation, hemodynamic, and the oxygen exchange components of HLHS physiology, the models can be altered or enhanced with any additional physiologic components such as ventilation, metabolism, etc. without altering the premise of the disclosed invention.
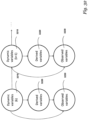
- FIG. 32 depicts a general Dynamic Bayesian Network (DBN) that may be employed to capture the physiology model of the HLHS stage 1 palliation patients.
- the graphical model illustrated conceptually in FIG. 32 captures the causal and probabilistic relationship between the variables of the model.
- the state variables are organized into three groups: dynamic variables 3210, derived variables 3220, and observed variables 3230.
- Dynamic variables 3210 are variables whose values change over time based on a dynamic probabilistic model to be described below.
- Derived variables 3230 are quantities that depend on the dynamic variables with some functional relationship. These variables are computed or derived when required from the latest dynamic variables and are therefore also dynamic in nature.
- Observed variables 3230 are those variables that are measured directly by one of the sensors connected to the system and the patient. Observed variables 3230 represent instances of the true dynamic or derived states variables that have been observed under noise.
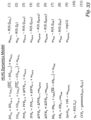
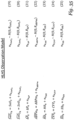
- FIG. 33 lists several equations that may be used to model the dynamics of the HLHS stage 1 physiology.
- the model consists of four main types of stochastic models.
- the first type of model is a stochastic feedback control model (eqs. 1, 2, and 7). These variables have a nominal value that the body maintains, but are disturbed by some random process off of this nominal value. The strength at which the body attempts to maintain these values is decided by the feedback constant.
- the second type of model is a drift diffusion process (eqs, 3 and 4). These variables are driven over time by a random white noise process and a drift rate process.
- the third type of model is a simple random walk process (eqs. 5, 6, and 8).
- the last type of dynamic model is a memory-less process model in which the variable has no relationship to the variable at the previous time period, but is simply a random variable which value changes at each time instance according to some predefined distribution over the proper support of the variable, i.e. a gamma distribution over the entire positive real line with parameters A and B. (eqs. 9, 10, and 11).
- the driving noise for each dynamic model is independent white Gaussian noise.
- FIG. 34 depicts example equations that may be used to abstract the relationships between the dynamic variables in the model and the derived variables. Some of these functional relationships are true for general human physiology, but many are the result of the parallel circulation physiology that is specific to the HLHS population. Equations 12-15 describe relationships for variables that are measured directly. Equations 16-18 describe functional relationships for variables that are of highest interest when managing care of HLHS patients post-surgery, specifically Cardiac Output (CO) and Pulmonary to Systemic Flow ratio (Qp:Qs). These variables cannot be measured directly without complex procedures.
- CO Cardiac Output
- Qp:Qs Pulmonary to Systemic Flow ratio
- FIG. 35 now provides a possible observation model that may be used to relate the derived variables with the available sensor data.
- Each observation model is a conditional Gaussian relationship.
- the measurement received from the sensor represents a direct observation of the underlying state variable corrupted by additional independent Gaussian White noise with some variance.
- the figure depicts the observed quantity as the underlying state variable with a tilde over the variable name.
- different sensors can map to the same underlying state variable, but with potentially different noise levels.
- SpO2 as reported by a pulse oximeter measures the underlying physiology state, SaO2 or arterial oxygen saturation noninvasively.
- An intravenous catheter inserted directly into the arterial blood stream also measures this quantity but in an invasive way. The catheter measurement should be a more accurate measurement than the pulse oximetry. In this model, this is handled with a smaller measurement variance, R.
- a particle filter is an example of an approximate inference scheme that uses Monte Carlo samples of the internal state variables to approximate the probability density function of each state variables with an empirical distribution based on the number of particles.
- the filter uses a process known as Sequential Importance Sampling (SIS) to continuously resample particles from the most recent approximate probability distribution.
- SIS Sequential Importance Sampling
- each particle is assigned a weight.
- the weights of each particle are updated based on the likelihood of the particular particle given the observation.
- the particles are then resampled based on their relative updated weights, the particles with the highest weights being more likely to be resampled than those with lower weights.
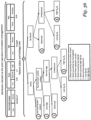
- FIG. 36 illustrates possible attributes, patient states, and an etiology tree that may be used by the clinical trajectory interpreter module 123 in the case of the HLHS Stage 1 population.
- the variable total cardiac output defined as the sum of the systemic and the pulmonary blood flows is used to define low and normal total cardiac output, the Qp:Qs ratio is used to derive low, balanced, and high Qp:Qs ratio, the value of hemoglobin concentration Hgb is used to derive low and normal hemoglobin, and the value of the mixed venous oxygen saturation, SvO2, is used to derive the attributes hemodynamic shock and no hemodynamic shock.
- FIG. 35 also illustrates a possible realization of an etiology tree
- Another possible application of the risk based monitoring system is to assist clinicians when deciding whether to apply a particular treatment, one example being blood transfusion.
- Transfusion of blood and blood products is a common inhospital procedure.
- blood transfusion indications and policies are neither well established nor consistently applied within or between medical centers.
- Multiple studies have demonstrated variation in transfusion practices among different hospitals, practitioners, and procedures. This variation persists even when applied to a single procedure (e.g. coronary artery bypass graft surgery).
- transfusion has been increasingly recognized as an independent risk factor for morbidity and mortality.
- Specific events and outcomes associated with transfusion include sepsis, organ ischemia, increased time on ventilation support, increased hospital length of stay, and short- and long-term morbidity. This relationship is proportional to the transfusion volume, and evidence suggests that high hematocrit values may be detrimental. Understandably, researchers conventionally recommend transfusion policies aimed at achieving an informed tradeoff between the risks and benefits.
- FIG. 37 illustrates one possible environment in which the risk based monitoring system can be applied to assist clinicians in deciding whether to apply a particular treatment.
- a patient 101 is being monitored with multiple measurements 3910, both intermittently and persistently.
- the persistent measurements may include mixed venous oxygen saturation (SvO2) 3911, systolic, diastolic and mean arterial blood pressures (ABP s
- the intermittent measurements may include blood pH 3915, hemoglobin concentration (Hgb) 3912, and lactic acid concentration 3914 monitored through periodic blood works.
- SvO2 mixed venous oxygen saturation
- Hgb hemoglobin concentration
- Hgb lactic acid concentration
- a possible treatment complications determination module 3924 receives information from the clinical trajectory interpreter module 123, together with information about the patient demographics 3931 and type of procedure 3932. With the information, this module 3924 queries an outcome database 3943 and receives back information of what the probability of different complications can be given that a) the patient is in particular patient states with particular probabilities; b) the patient is of certain demographics (age, sex, etc); c) the patient has had a particular type of procedure; d) and any combinations thereof of a) b) and c).
- the outcome database 3943 can be populated by using outcome studies 3990 derived from retrospective studies 3991, randomized clinical trials 3992, institution specific outcomes 3993 determined from previously collected patient data for a particular institution, and any combination thereof of the proceeding elements.
- the possible treatment complications determination module 3942 determines the possible complications, it feeds this information back to an enhanced visualization and user interactions module 3941.
- the enhanced visualization and user interactions module 3941 combines the patient-specific risk based monitoring performed by the physiology observer module 122 and the clinical trajectory interpreter module 122, with the evaluation of probable complication. This affords the system to provide a superior vantage point from which the clinician 3920 can better recognize risks and benefits of treatments such as blood transfusion, and respectively more efficiently and effectively decide whether to administer this treatment 3960 or not.
- FIG. 38 shows a non-limiting example set of patient states relevant to blood transfusion that may be used to inform the blood transfusion decision.
- the states contain information about the dynamics of the hemoglobin (decreasing/stable/increasing) and the hemodynamic compensation for reduced blood oxygen carrying capacity. In uncompensated patients, the hemodynamic auto-regulation mechanisms become incapable of overcoming the depleted blood oxygen carrying capacity, marking the onset of anaerobic metabolism.
- These seven states can be determined through three internal state variables: oxygen delivery, hemoglobin, and rate of hemoglobin production/loss. Specifically, when hemoglobin is above 13 mg/dL, it is assumed that there is no Hgb related pathology 4001.
- Hgb When Hgb is lower than 13 mg/dL, there are six other states, determined through five different attributes. From the oxygen delivery ISV, the system can determine whether the patient is compensated or uncompensated, e.g., it may be assumed that DO2 above 400 ml/min/m.sup.2, for ventilated and paralyzed patient, indicates compensation, and below this value uncompensated patient.
- the other three attributes are determined from the Hgb rate ISV and are stable 4013 and 4014 (the rate is close to zero), increasing 4011 and 4012 (the rate is positive), and decreasing 4015 and 4016 (the rate is negative).
- FIG. 39 illustrates one possible embodiment of this application.
- the data from the clinical trajectory interpreter module 123 is fed to a treatment query module 4142.
- the treatment query module 4142 queries a treatment plan database 4143 based on the determined patient risks.
- the treatment plan database 4143 specifies a map between patient risks and treatments.
- the database 4143 returns a treatment plan, it is represented to the clinician 3920 by an enhanced visualization and user interactions module 4141 with plan.
- the clinician 3920 can then make clinical decision 4190 with respect to patient 101.
- the user decision, the context under which it was taken, (the calculated patient risks, the estimated ISVs, and other possible patient data at the time of the decision) are then recorded to a decision data base 4144.
- the decision database 4144 then can be compared to patient outcomes and utilized in the improvement of the treatment plan.
- FIG. 40 illustrates an example application of the risk based monitoring system 4240 combined with a specific type of standardized clinical plan.
- the particular example considers the medical decision whether to treat the patient with nitric oxide.
- Nitric oxide is a pulmonary vasodilator and is used to treat high pulmonary vascular resistance and ensuing pulmonary hypertension, which can cause reduced cardiac output.
- the medical plan uses the risks calculated by the clinical trajectory interpreter module 123 and stratifies 4230 them into two categories: low risk and high risk. If the risks are low 4201 the recommended decision is not to treat 4202, respectively, if the patient is classified as being in high risk the recommended decision is to treat 4203. The provider can then make a decision to either follow the recommendations 4250 or disregard them 4260.
- Justifications 4210 and 4220 in conjunction with patient outcomes may be utilized to refine the risk stratification 4230 and risk-based monitoring system 100.
- FIG. 41 illustrates the example risk stratification that may be employed by the system in the context of Nitric Oxide treatment. Specifically, it assumes that the patient can be in four different states: State 1: Low CO, Normal PVR; State 2: Low CO, High PVR; State 1 Normal CO, High PVR; State 4: Normal CO Normal PVR.
- a patient being in low risk may be defined as P(State 1) ⁇ 10% and P(State 1)+P(State 2) ⁇ 30%.
- high risk may be defined as: P(State 1)>10% and P(State 1)+P(State 2)>30%.
- Yet another embodiment of the present disclosure allows the clinical trajectory tracking in outpatient care.
- Outpatient care of chronic conditions involves sporadic patient assessment from intermittent visits, patient self-evaluations, and observations from caregivers. This leads to uncertainties in determining the patient clinical course and the efficiency of the prescribed treatment strategy.
- clinicians To achieve effective patient care management, clinicians must understand and reduce these uncertainties. They have two main decisions at their disposal: 1) schedule visits, prescribe tests, or solicit self-evaluation (or caregiver evaluations) to improve their understanding of the clinical trajectory; and/or 2) prescribe changes of medication or medication dosing to achieve a better trade-off between the likelihood of improvement and possible side-effects.
- schedule visits, prescribe tests, or solicit self-evaluation (or caregiver evaluations) to improve their understanding of the clinical trajectory
- prescribe changes of medication or medication dosing to achieve a better trade-off between the likelihood of improvement and possible side-effects.
- FIG. 42 illustrates possible patient states that may describe the clinical trajectory of an ADHD patient. They are the same as the ones used by the Clinical global impression-improvement scale: 1) very much worse; 2) much worse; 3) worse; 4) No change; 5) Minimally Improved; 6) Much improved; 7) Very much improved.
- the Patient State Distribution is the set of probabilities that the patient is in any of the seven states, given all available information and observations.
- FIG. 43 lists the available patient evaluation modalities as M1. M2 and M3. Models may be used to map the test questions and answers into the states of the patient. Both the clinical evaluation and the test-based evaluation are associated with uncertainty that prohibits the exact determination in which of the seven states the patient currently resides.
- the dynamic model or the patient evolution from state to state may be abstracted by a Dynamic Bayesian Network (DBN) as the one shown in FIG. 44 .
- DBN Dynamic Bayesian Network
- the arcs' directions signify statistical dependence, i.e., the connection from "Patient state @ t1" 4601 to "M1”, signifies the probability density function (PDF): P(M1
- PDF probability density function
- the depicted DBN illustrates that "Patient state @ t2" 4602 (the patient state at a particular time t2), is conditioned on the "Patient state @ t1" (the patient state at the previous time increment 11).
- this model enables the estimation of the patient state distribution even in the absence of some or all possible measurements, e.g., as illustrated in the figure at time instance t2 when M1 is missing, and at time instance t3 ("Patient state @ t3" 4603), when all measurements are missing.
- FIG. 45 illustrates an alternative embodiment for two predictions of how the patient state can transition in a single month given medication change or a dosage change. This prediction is performed based on a statistical model derived in the following fashion: Step 1: Isolate a group of patients from retrospective data which at some point of their treatment have passed through State A and received a change of treatment (Med1 Dose1->Med 2 Dose 2); Step 2: For each patient, set the time instance that this particular event occurred to t0; 3) step 3: for each patient identify what is the patient state at time t0+1 Month (1M) (or any desired time step unit). 4) calculate the fraction of patients that transition State A->State i where i stands for all seven possible patient states; 5) set the fraction as the probabilities for transition under the particular treatment change.
- Step 1 Isolate a group of patients from retrospective data which at some point of their treatment have passed through State A and received a change of treatment (Med1 Dose1->Med 2 Dose 2); Step 2: For each patient, set the time
- FIG. 46 shows one possible embodiment and scenario of visualization displaying the patient clinical trajectory and risks.
- the user interface denotes that the patient is at "no change" state, and that this has been established by three separate measurements: office visit, teacher based Vanderbilt diagnosis, and parent based Vanderbilt diagnosis.
- the solid line on the screen signifies that a medication has been prescribed to the patient (Medication 1) at week 1 of the treatment.
- FIG. 47 shows an evaluation of the patient and the patient trajectory at week 9 at which point the clinical risk assessment system determines a probability density function for the state of the patient for each of the past six weeks.
- the available measurements at this point are teacher and parent Vanderbilt diagnosis.
- the clinician prescribes a change of medication dosing, which is depicted by a dashed red line.
- the user interface shows the side effect reported by the patient--headache.
- FIG. 48 shows a follow-up evaluation based on teacher and parent Vanderbilt diagnosis.
- the clinician decides a medication change depicted by a hollow line.
- FIG. 49 shows consequent evaluation based on all available measurements--office visit, parent and teacher evaluation, which establishes high probability for significant improvement.
- FIG. 50 shows yet another follow-up at which point it is established that the patient is most probably stably improved, and has been stably improved between the two evaluations. Note that due to the applied inference, the PDF for the patient trajectory is continuously estimated. However, the precision (the concentration of the PDF) is higher in the presence of a measurement.
- FIG. 51 shows a follow-up evaluation of the patient and the patient trajectory in the absence of measurements. Due to the lack of recent observations, the uncertainty is increasing.
- FIG. 52 shows the state of this uncertainty given a full patient evaluation (all measurement modalities).
- the inference engine propagates this uncertainty back in time to produce a more precise estimation of the patient trajectory, which helps the clinician to deduct that the patient is stable.
- FIG. 53 illustrates yet another possible visualization from the described system output. It shows possible patient state transitions under changes of treatment plan, e.g., change of medication. It also conveys what possible side-effects can be expected. For every side effect, there are three stages of manifestation--mild, moderate, and severe represented with the three boxes next to each side effect in the figure. The coloring corresponds to the probability of a particular severity manifestation for each particular side-effect, with darker colors indicating higher probability.
- ⁇ tissue oxygen delivery
- SvOz venous oxygen saturation
- SVC superior vena cava
- rSO 2 cerebral blood oxygenation
- NIRS Near Infrared Spectroscopy
- the invention described herein provides a system and method for representing patient risks and other clinical information.
- the risks correspond to the probabilities that the patient exhibits particular conditions and respective etiologies.
- the invention discusses a method for representing the utility of different possibly harmful modes of physiologic monitoring in estimating these risks.
- the invention also discusses a method for applying this risk representation in the care of patients.
- the invention described herein provides a system and method for representing patient risks and other clinical information.
- the invention enables a user interface with a workflow as the one described in Figure 66 .
- the user first chooses a specific patient from a list of patients ( Figure 54 ). The user then transitions to a view that enables them to review the current risks to the patient ( Figure 55 ), and provides them with the ability to set alerts for specific risks ( Figure 61 ) or put timestamps for important events ( Figure 57 ). The user can then review a historic timeline of the risks ( Figure 63 ), which enables them to review how the risks have changed over a specific time period. Following this, the user can review the physiology measurements which were used as the basis for the calculated risks ( Figure 64 ), review the patient chart ( Figure 65 ), and take notes on the patient.
- the screen depicted in Figures 55 through 62 is called the "Patient View Risks".
- the purpose of this screen is to present the probability of the patient being in each possible clinical state, the hazard level associated with each of these states, as well as the utility of each available measurement to the user.
- the user also has the ability to set alarms. These alarms can be set up to trigger either when one of the probabilities of the patient states crosses a threshold set by the user or by any other event of interest (e.g. change of medication). When an alarm triggers, it can also automatically set a time-stamped tag.
- An example implementation is illustrated by the markers on Figures 55 through 62 .
- the markers represent the following: (1) sliding button allows visualizing how the patient risks have changed with time, (2) the utility of each measurement (full halo corresponds to maximum utility), (3) possible patient state given the currently available measurements, and (4) navigation tab.
- marker #3 the color represents hazard level of the state (four possible states: Minimum Hazard, Mild Hazard, Moderate Hazard, Severe Hazard, ranging from green to red respectively) and the size of the box corresponds to probability.
- marker #5 illustrates that dragging the sliding window and pressing it down produces the result of marker #6 (shown in Figure 57 ).
- the user also has the ability to replay portions of the patient's timeline. This gives the user manual control in viewing the history of the patient's stay.
- the current physiological measures currently in use are also displayed on the screen. These measures are represented with the name of the measure encircled by a bar chart in the shape of a halo. The color of the halo corresponds to the extent to which that measure contributes to the currently viewed state of the patient. Potential measurements that are available but not in use can also be displayed on the screen.
- the user has the ability to customize the clinical states that are viewed through several methods.
- Marker #7 shows that dragging one state into another state produces a composite state, highlighted by marker #8 (in Figure 59 ). Clicking on this composite state (denoted by marker #9) allows the user to see the states that the composite state consists of.
- the name of the composite state is denoted by marker #10.
- the naming of the states themselves is based on hierarchical organization that is handled by the backend (one of which is denoted by marker #11).
- Marker #12 highlights the color, which captures the risk of the composite state.
- the user can set upper (marker #13) and lower (marker #14) limits for each risk displayed on the "Patient View Risks” screen.
- the alarm can be set via the checkmark box shown by marker #15.
- Marker #16 designates the button where the user can choose people to be notified when the alarm is triggered.
- the alarm screen is overlaid on top of the "Patient View Risks" screen (highlighted by marker #17).
- the box represented by marker #18 is a list which shows people to be notified on the onset of an alarm.
- Figure 62 shows the states associated with alarms are marked (marker #19).
- the next screen is called the "Patient View Risk Trajectory" as shown in Figure 63 .
- the purpose of this screen is to allow the user to display the risks for the patient being in a particular state as functions of time.
- the user is able to choose: (1) the probability of what states or combination of states to display, and (2) at what time scale to display them.
- An example implementation is shown in Figure 63 , where marker #1 shows that by clicking the minus button the user deletes a particular state probability history and marker #2 shows by clicking the plus button the user can add additional states or combination of states.
- Marker #3 illustrates the probability evolution of a particular state, which is measured by the probability axis (denoted by marker #4).
- Marker #5 shows a tool for adjusting the time scale.
- Marker #6 designates a line shows time stamps corresponding to features 5 (illustrated by marker #5 in Figure 56 ) and 6 (illustrated by marker #6 in Figure 57 ) of "Patient View Risks".
- a crucial feature is the ability to "tag" events that the user desires to view at a later time.
- the user can search events to tag based on medication, specific times of the patient's stay, etc. These tags can mark time-series for all views, can be shared, can be included in notes, etc.
- the user can annotate tags. These tags can be accessed in note form, where the patient state corresponding to the time tagged will be displayed as a screenshot. This also gives the user the ability to search through the tags, which can include tags that correspond to state probability thresholds.
- the next screen is called "Patient View Chart".
- the purpose of this screen is to present the user with the same information as the one provided to them by the rounding chart.
- An example implementation is shown in Figure 65 , where the content of this view is pulled directly from the clinician's rounding chart.
- Figure 66 provides an example workflow that gives an order of actions through the interface. For each patient, the user reviews the current risks to the patient. At this time, the user can tag a desired point in time for future reference and can set up alerts as described in the alert feature description above. Next, the user can review risk trajectory for the patient. From there, the user can choose to review the physiological measurements as well as the patient's chart. Finally, using the notes tab, the user can take notes on the patient.
Landscapes
- Health & Medical Sciences (AREA)
- Engineering & Computer Science (AREA)
- Life Sciences & Earth Sciences (AREA)
- Biomedical Technology (AREA)
- Public Health (AREA)
- Medical Informatics (AREA)
- General Health & Medical Sciences (AREA)
- Physics & Mathematics (AREA)
- Pathology (AREA)
- Artificial Intelligence (AREA)
- Surgery (AREA)
- Molecular Biology (AREA)
- Heart & Thoracic Surgery (AREA)
- Animal Behavior & Ethology (AREA)
- Biophysics (AREA)
- Veterinary Medicine (AREA)
- Primary Health Care (AREA)
- Epidemiology (AREA)
- Psychiatry (AREA)
- Physiology (AREA)
- Computer Vision & Pattern Recognition (AREA)
- Signal Processing (AREA)
- General Business, Economics & Management (AREA)
- Business, Economics & Management (AREA)
- Evolutionary Computation (AREA)
- Fuzzy Systems (AREA)
- Mathematical Physics (AREA)
- Data Mining & Analysis (AREA)
- Databases & Information Systems (AREA)
- Nuclear Medicine, Radiotherapy & Molecular Imaging (AREA)
- Radiology & Medical Imaging (AREA)
- Measuring And Recording Apparatus For Diagnosis (AREA)
Claims (14)
- Procédé mis en œuvre par ordinateur pour communiquer graphiquement, à un utilisateur, des risques de patient pour un patient individuel, le procédé comprenant :la réception, en provenance d'un dispositif, de données relatives à une pluralité d'états cliniques possibles de patient selon lesquels le patient peut être classé ;l'affichage, sur un dispositif d'affichage, d'une pluralité d'indicateurs graphiques, chacun de la pluralité d'indicateurs graphiques correspondant à l'un de la pluralité d'états cliniques possibles de patient, chacun de la pluralité d'indicateurs graphiques identifiant graphiquement la probabilité que le patient se trouve dans un état clinique correspondant de patient à un point donné dans un intervalle de temps, la pluralité d'indicateurs graphiques étant configurés pour indiquer un niveau de danger ; etl'affichage, sur le dispositif d'affichage, d'un contrôleur de chronologie configuré pour permettre à un utilisateur de sélectionner dynamiquement une pluralité de points dans le temps sur l'intervalle de temps, les indicateurs graphiques changeant dynamiquement en réponse à une spécification par l'utilisateur de l'un de la pluralité de points dans le temps pour afficher l'évolution de la pluralité d'états possibles de patient sur l'intervalle de temps ; etla détermination de l'utilité d'une mesure par cathéter invasif particulière mi, par :soumission d'une instruction à un module observateur de physiologie (122) pour simuler une sortie de module observateur de physiologie (9002) (fonctions de densité de probabilité de variables d'état internes) à partir d'un point antérieur au temps courant (tcurrent-T) jusqu'au temps courant (tcurrent) avec le retrait de la mesure mi ;dans un module interprétateur de trajectoire clinique (123), pour simuler une estimation de probabilité d'état (9003) compte tenu de la sortie simulée du module observateur de physiologie, pour arriver à un ensemble de probabilités d'état de patientPsim(S1(tcurrent)), Psim(S2(tcurrent))... Psim(Sn(tcurrent)) ;dans le module interprétateur de trajectoire clinique (123), à l'aide de probabilités d'état déterminées à partir de toutes les mesures disponibles P(S1(tcurrent), P(S2tcurrent), ... P(Sn(tcurrent), calcul de l'utilité [U(mi)] (9004) de la mesure mi à l'aide de la formule :
 affichage d'un indicateur graphique configuré pour représenter l'utilité de la mesure invasive.
 - Procédé mis en œuvre par ordinateur pour communiquer graphiquement des risques de patient à un utilisateur selon la revendication 1, dans lequella pluralité d'indicateurs graphiques sont agencés sur le dispositif d'affichage séparés par niveau de danger de façon à indiquer un niveau de danger pour chacun des indicateurs graphiques ;
oudans lequel la couleur de chacun de la pluralité d'indicateurs graphiques indique le niveau de danger associé à chacun de ces indicateurs graphiques. - Procédé mis en œuvre par ordinateur pour communiquer graphiquement des risques de patient à un utilisateur selon la revendication 1, dans lequel la réception, en provenance d'un dispositif, de données relatives à une pluralité d'états cliniques possibles de patient selon lesquels le patient peut être classé, comprend :
la réception de données identifiant la pluralité d'états cliniques possibles de patient selon lesquels le patient peut être classé, et pour chacun de la pluralité d'états cliniques possibles de patient, comprend en outre :la réception de données identifiant la probabilité que le patient se trouve dans chacun des états cliniques possibles de patient sur l'intervalle de temps ; etla réception de données identifiant un niveau de danger dans lequel chacun des états possibles de patient est catégorisé. - Procédé mis en œuvre par ordinateur pour communiquer graphiquement des risques de patient à un utilisateur selon la revendication 1, dans lequel :l'affichage d'indicateurs graphiques sur le dispositif d'affichage comprend un diagramme à barres comportant une pluralité de barres, chaque barre étant associée à un d'une pluralité de niveaux de danger ;dans lequel en particulier, une barre à l'intérieur du diagramme à barres peut comprendre une pluralité d'indicateurs graphiques à l'intérieur d'un seul niveau de danger ; etchacun de la pluralité d'indicateurs graphiques comprend une barre dans le diagramme à barres.
- Procédé mis en œuvre par ordinateur pour communiquer graphiquement des risques de patient à un utilisateur selon la revendication 4, dans lequelchacune des barres a une longueur correspondant à la probabilité que le patient se trouve dans l'état clinique correspondant de patient à un point donné dans le temps
oudans lequel le niveau de danger de chacun des indicateurs graphiques est exprimé par la couleur dudit indicateur graphique. - Procédé mis en œuvre par ordinateur pour communiquer graphiquement des risques de patient à un utilisateur selon la revendication 1, comprenant en outre :
l'affichage d'une particularité de contrôle de données de variable d'état qui, lorsqu'elle est activée par l'utilisateur, amène le dispositif d'affichage à afficher des variables d'état internes sur lesquelles sont basés les états de patient. - Procédé mis en œuvre par ordinateur pour communiquer graphiquement des risques de patient à un utilisateur selon la revendication 1, comprenant en outre :l'affichage d'une particularité de création d'étiquette qui, lorsqu'elle est activée par l'utilisateur, amène le dispositif d'affichage à afficher une marque d'étiquette associée au contrôleur de chronologie à un point sélectionné à l'intérieur de l'intervalle de temps eten particulier l'affichage d'un champ de création de notes d'étiquette configuré pour permettre l'annotation, par l'utilisateur, d'informations associées à l'étiquette.
- Support non transitoire lisible par ordinateur comportant un code exécutable par ordinateur pour communiquer graphiquement, à un utilisateur, des risques de patient pour un patient individuel, le code exécutable par ordinateur comprenant un code pour exécuter le procédé selon l'une des revendications 1 à 7.
- Système comprenant :un dispositif d'affichage ;un processeur d'ordinateur configuré pour afficher une interface utilisateur graphique pour communiquer, à un utilisateur, des risques de patient associés à un patient spécifique selon le procédé défini dans les revendications 1 à 7.
- Système pour communiquer, à un utilisateur, des risques de patient associés à un patient spécifique selon la revendication 9, dans lequel :un agencement d'indicateurs graphiques sur le dispositif d'affichage comprend un diagramme à barres comportant une pluralité de barres, chaque barre étant associée à un d'une pluralité de niveaux de danger ; etchacun de la pluralité d'indicateurs graphiques comprend une barre dans le diagramme à barres, en particulier dans lequel une barre à l'intérieur du diagramme à barres peut comprendre une pluralité d'indicateurs graphiques à l'intérieur d'un seul niveau de danger.
- Système pour communiquer, à un utilisateur, des risques de patient associés à un patient spécifique selon la revendication 9, dans lequelchacune des barres a une longueur correspondant à la probabilité que le patient se trouve dans l'état clinique correspondant de patient à un point donné dans le temps
oudans lequel le niveau de danger de chacun des indicateurs graphiques est exprimé par la couleur dudit indicateur graphique. - Système pour communiquer, à un utilisateur, des risques de patient associés à un patient spécifique selon la revendication 9, dans lequel :le dispositif d'affichage comprend un écran tactile ; etle contrôleur dynamique est un curseur affiché sur l'écran tactile.
- Système pour communiquer, à un utilisateur, des risques de patient associés à un patient spécifique selon la revendication 9, l'interface utilisateur graphique comprenant en outre :
une particularité de contrôle de données de variable d'état qui, lorsqu'elle est activée par l'utilisateur, amène le dispositif d'affichage à afficher des variables d'état internes sur lesquelles sont basés les états de patients. - Système pour communiquer, à un utilisateur, des risques de patient associés à un patient spécifique selon la revendication 9, l'interface utilisateur graphique comprenant en outre :une particularité de création d'étiquette qui, lorsqu'elle est activée par l'utilisateur, amène le dispositif d'affichage à afficher une marque d'étiquette associée au contrôleur de chronologie à un point sélectionné à l'intérieur de l'intervalle de temps eten particulier un champ de création de notes d'étiquette configuré pour permettre l'annotation, par l'utilisateur, d'informations associées à l'étiquette.
Priority Applications (1)
| Application Number | Priority Date | Filing Date | Title |
|---|---|---|---|
| EP24182772.4A EP4410199A3 (fr) | 2012-11-19 | 2013-11-19 | Interface utilisateur pour système d'analyse de risque de patient |
Applications Claiming Priority (5)
| Application Number | Priority Date | Filing Date | Title |
|---|---|---|---|
| US201261727820P | 2012-11-19 | 2012-11-19 | |
| US201361774274P | 2013-03-07 | 2013-03-07 | |
| US13/826,441 US20130231949A1 (en) | 2011-12-16 | 2013-03-14 | Systems and methods for transitioning patient care from signal-based monitoring to risk-based monitoring |
| PCT/US2013/070810 WO2014078859A1 (fr) | 2012-11-19 | 2013-11-19 | Interface utilisateur pour systèmes d'analyse de risques de patients |
| EP13855989.3A EP2919644A4 (fr) | 2012-11-19 | 2013-11-19 | Interface utilisateur pour systèmes d'analyse de risques de patients |
Related Parent Applications (1)
| Application Number | Title | Priority Date | Filing Date |
|---|---|---|---|
| EP13855989.3A Division EP2919644A4 (fr) | 2012-11-19 | 2013-11-19 | Interface utilisateur pour systèmes d'analyse de risques de patients |
Related Child Applications (1)
| Application Number | Title | Priority Date | Filing Date |
|---|---|---|---|
| EP24182772.4A Division EP4410199A3 (fr) | 2012-11-19 | 2013-11-19 | Interface utilisateur pour système d'analyse de risque de patient |
Publications (2)
| Publication Number | Publication Date |
|---|---|
| EP3767636A1 EP3767636A1 (fr) | 2021-01-20 |
| EP3767636B1 true EP3767636B1 (fr) | 2024-06-19 |
Family
ID=50731773
Family Applications (3)
| Application Number | Title | Priority Date | Filing Date |
|---|---|---|---|
| EP24182772.4A Pending EP4410199A3 (fr) | 2012-11-19 | 2013-11-19 | Interface utilisateur pour système d'analyse de risque de patient |
| EP13855989.3A Ceased EP2919644A4 (fr) | 2012-11-19 | 2013-11-19 | Interface utilisateur pour systèmes d'analyse de risques de patients |
| EP20187516.8A Active EP3767636B1 (fr) | 2012-11-19 | 2013-11-19 | Interface utilisateur pour système d'analyse de risques de patients |
Family Applications Before (2)
| Application Number | Title | Priority Date | Filing Date |
|---|---|---|---|
| EP24182772.4A Pending EP4410199A3 (fr) | 2012-11-19 | 2013-11-19 | Interface utilisateur pour système d'analyse de risque de patient |
| EP13855989.3A Ceased EP2919644A4 (fr) | 2012-11-19 | 2013-11-19 | Interface utilisateur pour systèmes d'analyse de risques de patients |
Country Status (3)
| Country | Link |
|---|---|
| EP (3) | EP4410199A3 (fr) |
| ES (1) | ES2986666T3 (fr) |
| WO (1) | WO2014078859A1 (fr) |
Families Citing this family (7)
| Publication number | Priority date | Publication date | Assignee | Title |
|---|---|---|---|---|
| US20200411188A1 (en) * | 2018-03-06 | 2020-12-31 | Ieso Digital Health Limited | Improvements in or relating to psychological profiles |
| US11763947B2 (en) | 2020-10-14 | 2023-09-19 | Etiometry Inc. | System and method for providing clinical decision support |
| US12326918B2 (en) | 2021-10-18 | 2025-06-10 | Optum Services (Ireland) Limited | Cross-temporal encoding machine learning models |
| US12327193B2 (en) | 2021-10-19 | 2025-06-10 | Optum Services (Ireland) Limited | Methods, apparatuses and computer program products for predicting measurement device performance |
| CN116486971A (zh) * | 2022-01-10 | 2023-07-25 | 成都心吉康科技有限公司 | 一种随访系统及方法 |
| US12551124B2 (en) * | 2022-03-11 | 2026-02-17 | Promedix, Inc. | Systems and methods for measuring capillary refill time |
| US12229188B2 (en) | 2022-05-17 | 2025-02-18 | Optum Services (Ireland) Limited | Machine learning techniques for generating disease prediction utilizing cross-temporal semi-structured input data |
Family Cites Families (9)
| Publication number | Priority date | Publication date | Assignee | Title |
|---|---|---|---|---|
| US7392199B2 (en) * | 2001-05-01 | 2008-06-24 | Quest Diagnostics Investments Incorporated | Diagnosing inapparent diseases from common clinical tests using Bayesian analysis |
| US6956572B2 (en) * | 2003-02-10 | 2005-10-18 | Siemens Medical Solutions Health Services Corporation | Patient medical parameter user interface system |
| US20060111933A1 (en) * | 2003-10-09 | 2006-05-25 | Steven Wheeler | Adaptive medical decision support system |
| EP1751550B1 (fr) * | 2004-04-14 | 2020-05-13 | Edda Technology, Inc. | Systeme, procede et interface graphique permettant de diagnostiquer une maladie du foie |
| US20070239043A1 (en) * | 2006-03-30 | 2007-10-11 | Patel Amisha S | Method and Apparatus for Arrhythmia Episode Classification |
| EP1844725B1 (fr) * | 2006-04-07 | 2009-03-25 | BrainLAB AG | Évaluation des risques de trajectoires planifiés |
| US20120022336A1 (en) * | 2010-07-21 | 2012-01-26 | Streamline Automation, Llc | Iterative probabilistic parameter estimation apparatus and method of use therefor |
| US8645164B2 (en) * | 2009-05-28 | 2014-02-04 | Indiana University Research And Technology Corporation | Medical information visualization assistant system and method |
| WO2011060314A1 (fr) * | 2009-11-12 | 2011-05-19 | eTenum, LLC | Procédé et système pour une estimation optimale dans un diagnostic médical |
-
2013
- 2013-11-19 EP EP24182772.4A patent/EP4410199A3/fr active Pending
- 2013-11-19 EP EP13855989.3A patent/EP2919644A4/fr not_active Ceased
- 2013-11-19 EP EP20187516.8A patent/EP3767636B1/fr active Active
- 2013-11-19 WO PCT/US2013/070810 patent/WO2014078859A1/fr not_active Ceased
- 2013-11-19 ES ES20187516T patent/ES2986666T3/es active Active
Also Published As
| Publication number | Publication date |
|---|---|
| ES2986666T3 (es) | 2024-11-12 |
| EP4410199A3 (fr) | 2024-10-23 |
| EP3767636A1 (fr) | 2021-01-20 |
| EP2919644A4 (fr) | 2016-09-14 |
| EP4410199A2 (fr) | 2024-08-07 |
| WO2014078859A1 (fr) | 2014-05-22 |
| EP2919644A1 (fr) | 2015-09-23 |
Similar Documents
| Publication | Publication Date | Title |
|---|---|---|
| US12183467B2 (en) | System and methods for transitioning patient care from signal based monitoring to risk based monitoring | |
| IL277521A (en) | Systems and methods for transferring patient care from signal-based monitoring to risk-based monitoring | |
| US12488900B2 (en) | Systems and methods for transitioning patient care from signal-based monitoring to risk-based monitoring | |
| US12387842B2 (en) | Systems and methods for optimizing medical care through data monitoring and feedback treatment | |
| EP3767636A1 (fr) | Interface utilisateur pour système d'analyse de risques de patients | |
| US11763947B2 (en) | System and method for providing clinical decision support | |
| US20220115143A1 (en) | Systems and Methods for determining the Contribution of a Given Measurement to a Patient State Determination | |
| EP4035178A1 (fr) | Systèmes et procédés de transition de soins de patient à partir d'une surveillance basée sur un signal pour une surveillance basée sur un risque | |
| US20250325237A1 (en) | Clinical education method and system | |
| US20260135002A1 (en) | Systems and methods for transitioning patient care from signal based monitoring to risk based monitoring |
Legal Events
| Date | Code | Title | Description |
|---|---|---|---|
| PUAI | Public reference made under article 153(3) epc to a published international application that has entered the european phase |
Free format text: ORIGINAL CODE: 0009012 |
|
| STAA | Information on the status of an ep patent application or granted ep patent |
Free format text: STATUS: THE APPLICATION HAS BEEN PUBLISHED |
|
| AC | Divisional application: reference to earlier application |
Ref document number: 2919644 Country of ref document: EP Kind code of ref document: P |
|
| AK | Designated contracting states |
Kind code of ref document: A1 Designated state(s): AL AT BE BG CH CY CZ DE DK EE ES FI FR GB GR HR HU IE IS IT LI LT LU LV MC MK MT NL NO PL PT RO RS SE SI SK SM TR |
|
| RIN1 | Information on inventor provided before grant (corrected) |
Inventor name: BUTLER, EVAN J. Inventor name: BARONOV, DIMITAR V. Inventor name: LOCK, JESSE M. |
|
| STAA | Information on the status of an ep patent application or granted ep patent |
Free format text: STATUS: REQUEST FOR EXAMINATION WAS MADE |
|
| 17P | Request for examination filed |
Effective date: 20210719 |
|
| RBV | Designated contracting states (corrected) |
Designated state(s): AL AT BE BG CH CY CZ DE DK EE ES FI FR GB GR HR HU IE IS IT LI LT LU LV MC MK MT NL NO PL PT RO RS SE SI SK SM TR |
|
| P01 | Opt-out of the competence of the unified patent court (upc) registered |
Effective date: 20230522 |
|
| GRAP | Despatch of communication of intention to grant a patent |
Free format text: ORIGINAL CODE: EPIDOSNIGR1 |
|
| STAA | Information on the status of an ep patent application or granted ep patent |
Free format text: STATUS: GRANT OF PATENT IS INTENDED |
|
| INTG | Intention to grant announced |
Effective date: 20240111 |
|
| RIN1 | Information on inventor provided before grant (corrected) |
Inventor name: LOCK, JESSE M. Inventor name: BUTLER, EVAN J. Inventor name: BARONOV, DIMITAR V. |
|
| GRAS | Grant fee paid |
Free format text: ORIGINAL CODE: EPIDOSNIGR3 |
|
| GRAA | (expected) grant |
Free format text: ORIGINAL CODE: 0009210 |
|
| STAA | Information on the status of an ep patent application or granted ep patent |
Free format text: STATUS: THE PATENT HAS BEEN GRANTED |
|
| AC | Divisional application: reference to earlier application |
Ref document number: 2919644 Country of ref document: EP Kind code of ref document: P |
|
| AK | Designated contracting states |
Kind code of ref document: B1 Designated state(s): AL AT BE BG CH CY CZ DE DK EE ES FI FR GB GR HR HU IE IS IT LI LT LU LV MC MK MT NL NO PL PT RO RS SE SI SK SM TR |
|
| REG | Reference to a national code |
Ref country code: GB Ref legal event code: FG4D |
|
| REG | Reference to a national code |
Ref country code: CH Ref legal event code: EP |
|
| REG | Reference to a national code |
Ref country code: DE Ref legal event code: R096 Ref document number: 602013085828 Country of ref document: DE |
|
| PG25 | Lapsed in a contracting state [announced via postgrant information from national office to epo] |
Ref country code: BG Free format text: LAPSE BECAUSE OF FAILURE TO SUBMIT A TRANSLATION OF THE DESCRIPTION OR TO PAY THE FEE WITHIN THE PRESCRIBED TIME-LIMIT Effective date: 20240619 |
|
| PG25 | Lapsed in a contracting state [announced via postgrant information from national office to epo] |
Ref country code: FI Free format text: LAPSE BECAUSE OF FAILURE TO SUBMIT A TRANSLATION OF THE DESCRIPTION OR TO PAY THE FEE WITHIN THE PRESCRIBED TIME-LIMIT Effective date: 20240619 Ref country code: HR Free format text: LAPSE BECAUSE OF FAILURE TO SUBMIT A TRANSLATION OF THE DESCRIPTION OR TO PAY THE FEE WITHIN THE PRESCRIBED TIME-LIMIT Effective date: 20240619 |
|
| REG | Reference to a national code |
Ref country code: LT Ref legal event code: MG9D |
|
| PG25 | Lapsed in a contracting state [announced via postgrant information from national office to epo] |
Ref country code: GR Free format text: LAPSE BECAUSE OF FAILURE TO SUBMIT A TRANSLATION OF THE DESCRIPTION OR TO PAY THE FEE WITHIN THE PRESCRIBED TIME-LIMIT Effective date: 20240920 |
|
| REG | Reference to a national code |
Ref country code: NL Ref legal event code: MP Effective date: 20240619 |
|
| PG25 | Lapsed in a contracting state [announced via postgrant information from national office to epo] |
Ref country code: LV Free format text: LAPSE BECAUSE OF FAILURE TO SUBMIT A TRANSLATION OF THE DESCRIPTION OR TO PAY THE FEE WITHIN THE PRESCRIBED TIME-LIMIT Effective date: 20240619 |
|
| PG25 | Lapsed in a contracting state [announced via postgrant information from national office to epo] |
Ref country code: NO Free format text: LAPSE BECAUSE OF FAILURE TO SUBMIT A TRANSLATION OF THE DESCRIPTION OR TO PAY THE FEE WITHIN THE PRESCRIBED TIME-LIMIT Effective date: 20240919 Ref country code: LV Free format text: LAPSE BECAUSE OF FAILURE TO SUBMIT A TRANSLATION OF THE DESCRIPTION OR TO PAY THE FEE WITHIN THE PRESCRIBED TIME-LIMIT Effective date: 20240619 Ref country code: HR Free format text: LAPSE BECAUSE OF FAILURE TO SUBMIT A TRANSLATION OF THE DESCRIPTION OR TO PAY THE FEE WITHIN THE PRESCRIBED TIME-LIMIT Effective date: 20240619 Ref country code: GR Free format text: LAPSE BECAUSE OF FAILURE TO SUBMIT A TRANSLATION OF THE DESCRIPTION OR TO PAY THE FEE WITHIN THE PRESCRIBED TIME-LIMIT Effective date: 20240920 Ref country code: FI Free format text: LAPSE BECAUSE OF FAILURE TO SUBMIT A TRANSLATION OF THE DESCRIPTION OR TO PAY THE FEE WITHIN THE PRESCRIBED TIME-LIMIT Effective date: 20240619 Ref country code: BG Free format text: LAPSE BECAUSE OF FAILURE TO SUBMIT A TRANSLATION OF THE DESCRIPTION OR TO PAY THE FEE WITHIN THE PRESCRIBED TIME-LIMIT Effective date: 20240619 Ref country code: RS Free format text: LAPSE BECAUSE OF FAILURE TO SUBMIT A TRANSLATION OF THE DESCRIPTION OR TO PAY THE FEE WITHIN THE PRESCRIBED TIME-LIMIT Effective date: 20240919 |
|
| REG | Reference to a national code |
Ref country code: ES Ref legal event code: FG2A Ref document number: 2986666 Country of ref document: ES Kind code of ref document: T3 Effective date: 20241112 |
|
| PG25 | Lapsed in a contracting state [announced via postgrant information from national office to epo] |
Ref country code: NL Free format text: LAPSE BECAUSE OF FAILURE TO SUBMIT A TRANSLATION OF THE DESCRIPTION OR TO PAY THE FEE WITHIN THE PRESCRIBED TIME-LIMIT Effective date: 20240619 |
|
| REG | Reference to a national code |
Ref country code: AT Ref legal event code: MK05 Ref document number: 1696475 Country of ref document: AT Kind code of ref document: T Effective date: 20240619 |
|
| PG25 | Lapsed in a contracting state [announced via postgrant information from national office to epo] |
Ref country code: NL Free format text: LAPSE BECAUSE OF FAILURE TO SUBMIT A TRANSLATION OF THE DESCRIPTION OR TO PAY THE FEE WITHIN THE PRESCRIBED TIME-LIMIT Effective date: 20240619 |
|
| PG25 | Lapsed in a contracting state [announced via postgrant information from national office to epo] |
Ref country code: PT Free format text: LAPSE BECAUSE OF FAILURE TO SUBMIT A TRANSLATION OF THE DESCRIPTION OR TO PAY THE FEE WITHIN THE PRESCRIBED TIME-LIMIT Effective date: 20241021 |
|
| PG25 | Lapsed in a contracting state [announced via postgrant information from national office to epo] |
Ref country code: PT Free format text: LAPSE BECAUSE OF FAILURE TO SUBMIT A TRANSLATION OF THE DESCRIPTION OR TO PAY THE FEE WITHIN THE PRESCRIBED TIME-LIMIT Effective date: 20241021 |
|
| PG25 | Lapsed in a contracting state [announced via postgrant information from national office to epo] |
Ref country code: PL Free format text: LAPSE BECAUSE OF FAILURE TO SUBMIT A TRANSLATION OF THE DESCRIPTION OR TO PAY THE FEE WITHIN THE PRESCRIBED TIME-LIMIT Effective date: 20240619 |
|
| PG25 | Lapsed in a contracting state [announced via postgrant information from national office to epo] |
Ref country code: EE Free format text: LAPSE BECAUSE OF FAILURE TO SUBMIT A TRANSLATION OF THE DESCRIPTION OR TO PAY THE FEE WITHIN THE PRESCRIBED TIME-LIMIT Effective date: 20240619 |
|
| PG25 | Lapsed in a contracting state [announced via postgrant information from national office to epo] |
Ref country code: AT Free format text: LAPSE BECAUSE OF FAILURE TO SUBMIT A TRANSLATION OF THE DESCRIPTION OR TO PAY THE FEE WITHIN THE PRESCRIBED TIME-LIMIT Effective date: 20240619 Ref country code: IS Free format text: LAPSE BECAUSE OF FAILURE TO SUBMIT A TRANSLATION OF THE DESCRIPTION OR TO PAY THE FEE WITHIN THE PRESCRIBED TIME-LIMIT Effective date: 20241019 |
|
| PG25 | Lapsed in a contracting state [announced via postgrant information from national office to epo] |
Ref country code: CZ Free format text: LAPSE BECAUSE OF FAILURE TO SUBMIT A TRANSLATION OF THE DESCRIPTION OR TO PAY THE FEE WITHIN THE PRESCRIBED TIME-LIMIT Effective date: 20240619 |
|
| PG25 | Lapsed in a contracting state [announced via postgrant information from national office to epo] |
Ref country code: SK Free format text: LAPSE BECAUSE OF FAILURE TO SUBMIT A TRANSLATION OF THE DESCRIPTION OR TO PAY THE FEE WITHIN THE PRESCRIBED TIME-LIMIT Effective date: 20240619 Ref country code: RO Free format text: LAPSE BECAUSE OF FAILURE TO SUBMIT A TRANSLATION OF THE DESCRIPTION OR TO PAY THE FEE WITHIN THE PRESCRIBED TIME-LIMIT Effective date: 20240619 |
|
| PG25 | Lapsed in a contracting state [announced via postgrant information from national office to epo] |
Ref country code: SM Free format text: LAPSE BECAUSE OF FAILURE TO SUBMIT A TRANSLATION OF THE DESCRIPTION OR TO PAY THE FEE WITHIN THE PRESCRIBED TIME-LIMIT Effective date: 20240619 |
|
| PG25 | Lapsed in a contracting state [announced via postgrant information from national office to epo] |
Ref country code: SM Free format text: LAPSE BECAUSE OF FAILURE TO SUBMIT A TRANSLATION OF THE DESCRIPTION OR TO PAY THE FEE WITHIN THE PRESCRIBED TIME-LIMIT Effective date: 20240619 Ref country code: SK Free format text: LAPSE BECAUSE OF FAILURE TO SUBMIT A TRANSLATION OF THE DESCRIPTION OR TO PAY THE FEE WITHIN THE PRESCRIBED TIME-LIMIT Effective date: 20240619 Ref country code: RO Free format text: LAPSE BECAUSE OF FAILURE TO SUBMIT A TRANSLATION OF THE DESCRIPTION OR TO PAY THE FEE WITHIN THE PRESCRIBED TIME-LIMIT Effective date: 20240619 Ref country code: PL Free format text: LAPSE BECAUSE OF FAILURE TO SUBMIT A TRANSLATION OF THE DESCRIPTION OR TO PAY THE FEE WITHIN THE PRESCRIBED TIME-LIMIT Effective date: 20240619 Ref country code: IS Free format text: LAPSE BECAUSE OF FAILURE TO SUBMIT A TRANSLATION OF THE DESCRIPTION OR TO PAY THE FEE WITHIN THE PRESCRIBED TIME-LIMIT Effective date: 20241019 Ref country code: EE Free format text: LAPSE BECAUSE OF FAILURE TO SUBMIT A TRANSLATION OF THE DESCRIPTION OR TO PAY THE FEE WITHIN THE PRESCRIBED TIME-LIMIT Effective date: 20240619 Ref country code: CZ Free format text: LAPSE BECAUSE OF FAILURE TO SUBMIT A TRANSLATION OF THE DESCRIPTION OR TO PAY THE FEE WITHIN THE PRESCRIBED TIME-LIMIT Effective date: 20240619 Ref country code: AT Free format text: LAPSE BECAUSE OF FAILURE TO SUBMIT A TRANSLATION OF THE DESCRIPTION OR TO PAY THE FEE WITHIN THE PRESCRIBED TIME-LIMIT Effective date: 20240619 |
|
| REG | Reference to a national code |
Ref country code: DE Ref legal event code: R097 Ref document number: 602013085828 Country of ref document: DE |
|
| PG25 | Lapsed in a contracting state [announced via postgrant information from national office to epo] |
Ref country code: DK Free format text: LAPSE BECAUSE OF FAILURE TO SUBMIT A TRANSLATION OF THE DESCRIPTION OR TO PAY THE FEE WITHIN THE PRESCRIBED TIME-LIMIT Effective date: 20240619 |
|
| PLBE | No opposition filed within time limit |
Free format text: ORIGINAL CODE: 0009261 |
|
| STAA | Information on the status of an ep patent application or granted ep patent |
Free format text: STATUS: NO OPPOSITION FILED WITHIN TIME LIMIT |
|
| 26N | No opposition filed |
Effective date: 20250320 |
|
| REG | Reference to a national code |
Ref country code: CH Ref legal event code: PL |
|
| PG25 | Lapsed in a contracting state [announced via postgrant information from national office to epo] |
Ref country code: MC Free format text: LAPSE BECAUSE OF FAILURE TO SUBMIT A TRANSLATION OF THE DESCRIPTION OR TO PAY THE FEE WITHIN THE PRESCRIBED TIME-LIMIT Effective date: 20240619 |
|
| PG25 | Lapsed in a contracting state [announced via postgrant information from national office to epo] |
Ref country code: LU Free format text: LAPSE BECAUSE OF NON-PAYMENT OF DUE FEES Effective date: 20241119 |
|
| REG | Reference to a national code |
Ref country code: CH Ref legal event code: PL |
|
| PG25 | Lapsed in a contracting state [announced via postgrant information from national office to epo] |
Ref country code: CH Free format text: LAPSE BECAUSE OF NON-PAYMENT OF DUE FEES Effective date: 20241130 |
|
| REG | Reference to a national code |
Ref country code: BE Ref legal event code: MM Effective date: 20241130 |
|
| PG25 | Lapsed in a contracting state [announced via postgrant information from national office to epo] |
Ref country code: SE Free format text: LAPSE BECAUSE OF FAILURE TO SUBMIT A TRANSLATION OF THE DESCRIPTION OR TO PAY THE FEE WITHIN THE PRESCRIBED TIME-LIMIT Effective date: 20240619 |
|
| PG25 | Lapsed in a contracting state [announced via postgrant information from national office to epo] |
Ref country code: BE Free format text: LAPSE BECAUSE OF NON-PAYMENT OF DUE FEES Effective date: 20241130 |
|
| PG25 | Lapsed in a contracting state [announced via postgrant information from national office to epo] |
Ref country code: IE Free format text: LAPSE BECAUSE OF NON-PAYMENT OF DUE FEES Effective date: 20241119 |
|
| PGFP | Annual fee paid to national office [announced via postgrant information from national office to epo] |
Ref country code: DE Payment date: 20251128 Year of fee payment: 13 |
|
| PGFP | Annual fee paid to national office [announced via postgrant information from national office to epo] |
Ref country code: GB Payment date: 20251127 Year of fee payment: 13 |
|
| PGFP | Annual fee paid to national office [announced via postgrant information from national office to epo] |
Ref country code: IT Payment date: 20251119 Year of fee payment: 13 |
|
| PGFP | Annual fee paid to national office [announced via postgrant information from national office to epo] |
Ref country code: FR Payment date: 20251125 Year of fee payment: 13 |
|
| PGFP | Annual fee paid to national office [announced via postgrant information from national office to epo] |
Ref country code: ES Payment date: 20251201 Year of fee payment: 13 |
|
| PG25 | Lapsed in a contracting state [announced via postgrant information from national office to epo] |
Ref country code: HU Free format text: LAPSE BECAUSE OF FAILURE TO SUBMIT A TRANSLATION OF THE DESCRIPTION OR TO PAY THE FEE WITHIN THE PRESCRIBED TIME-LIMIT; INVALID AB INITIO Effective date: 20131119 |
|
| PG25 | Lapsed in a contracting state [announced via postgrant information from national office to epo] |
Ref country code: CY Free format text: LAPSE BECAUSE OF FAILURE TO SUBMIT A TRANSLATION OF THE DESCRIPTION OR TO PAY THE FEE WITHIN THE PRESCRIBED TIME-LIMIT; INVALID AB INITIO Effective date: 20131119 |