EP3777253B1 - Évaluation de service de réseau sans fil - Google Patents
Évaluation de service de réseau sans fil Download PDFInfo
- Publication number
- EP3777253B1 EP3777253B1 EP19784765.0A EP19784765A EP3777253B1 EP 3777253 B1 EP3777253 B1 EP 3777253B1 EP 19784765 A EP19784765 A EP 19784765A EP 3777253 B1 EP3777253 B1 EP 3777253B1
- Authority
- EP
- European Patent Office
- Prior art keywords
- snr
- actual
- signal
- average
- signal quality
- Prior art date
- Legal status (The legal status is an assumption and is not a legal conclusion. Google has not performed a legal analysis and makes no representation as to the accuracy of the status listed.)
- Active
Links
Images







Classifications
-
- H—ELECTRICITY
- H04—ELECTRIC COMMUNICATION TECHNIQUE
- H04W—WIRELESS COMMUNICATION NETWORKS
- H04W4/00—Services specially adapted for wireless communication networks; Facilities therefor
- H04W4/02—Services making use of location information
- H04W4/029—Location-based management or tracking services
-
- H—ELECTRICITY
- H04—ELECTRIC COMMUNICATION TECHNIQUE
- H04B—TRANSMISSION
- H04B17/00—Monitoring; Testing
- H04B17/30—Monitoring; Testing of propagation channels
- H04B17/309—Measuring or estimating channel quality parameters
- H04B17/318—Received signal strength
-
- H—ELECTRICITY
- H04—ELECTRIC COMMUNICATION TECHNIQUE
- H04W—WIRELESS COMMUNICATION NETWORKS
- H04W16/00—Network planning, e.g. coverage or traffic planning tools; Network deployment, e.g. resource partitioning or cells structures
- H04W16/18—Network planning tools
- H04W16/20—Network planning tools for indoor coverage or short range network deployment
-
- H—ELECTRICITY
- H04—ELECTRIC COMMUNICATION TECHNIQUE
- H04B—TRANSMISSION
- H04B17/00—Monitoring; Testing
- H04B17/20—Monitoring; Testing of receivers
- H04B17/27—Monitoring; Testing of receivers for locating or positioning the transmitter
-
- H—ELECTRICITY
- H04—ELECTRIC COMMUNICATION TECHNIQUE
- H04B—TRANSMISSION
- H04B17/00—Monitoring; Testing
- H04B17/30—Monitoring; Testing of propagation channels
- H04B17/309—Measuring or estimating channel quality parameters
- H04B17/318—Received signal strength
- H04B17/327—Received signal code power [RSCP]
-
- H—ELECTRICITY
- H04—ELECTRIC COMMUNICATION TECHNIQUE
- H04B—TRANSMISSION
- H04B17/00—Monitoring; Testing
- H04B17/30—Monitoring; Testing of propagation channels
- H04B17/309—Measuring or estimating channel quality parameters
- H04B17/336—Signal-to-interference ratio [SIR] or carrier-to-interference ratio [CIR]
-
- H—ELECTRICITY
- H04—ELECTRIC COMMUNICATION TECHNIQUE
- H04W—WIRELESS COMMUNICATION NETWORKS
- H04W24/00—Supervisory, monitoring or testing arrangements
- H04W24/10—Scheduling measurement reports ; Arrangements for measurement reports
-
- H—ELECTRICITY
- H04—ELECTRIC COMMUNICATION TECHNIQUE
- H04W—WIRELESS COMMUNICATION NETWORKS
- H04W4/00—Services specially adapted for wireless communication networks; Facilities therefor
- H04W4/30—Services specially adapted for particular environments, situations or purposes
- H04W4/33—Services specially adapted for particular environments, situations or purposes for indoor environments, e.g. buildings
-
- H—ELECTRICITY
- H04—ELECTRIC COMMUNICATION TECHNIQUE
- H04W—WIRELESS COMMUNICATION NETWORKS
- H04W84/00—Network topologies
- H04W84/02—Hierarchically pre-organised networks, e.g. paging networks, cellular networks, WLAN [Wireless Local Area Network] or WLL [Wireless Local Loop]
- H04W84/10—Small scale networks; Flat hierarchical networks
- H04W84/12—WLAN [Wireless Local Area Networks]
Definitions
- Wireless performance and connectivity are modern issues and continue to expand as cellular and wireless connectivity and transmission of data has become ubiquitous. Not all network plans are the same and coverage, performance, and connectivity for one provider is inherently different than coverage, performance, and connectivity for another provider based upon the location of towers and signal generators. While generally more coverage and stronger signals are better, efficiently providing coverage would generate improved performance at reduced costs to providers. This in turn can reduce costs to participants or allow for further extension of networks or improvements to other areas of the network. Accordingly, cellular network operators and others continually assess the coverage and performance of wireless networks to identify areas of potential improvement and to identify competitive position and potential opportunities to increase sales of wireless service in an area.
- Coverage and performance of cellular networks or mobile networks can be measured using a variety of methods, such as using portable test equipment or gathering measurements directly from the network equipment that is providing wireless service.
- portable testing equipment can be used to manually gather signal strength and noise measurements by movement along or within an area of interest. This can allow collection of such data generally within an area by persons walking, driving, or otherwise moving within an area.
- information can be combined with this collected data and measured directly from the network equipment. Together, these data points can assist with assessing performance of the network.
- US2016/360380A1 discloses a method for correcting in-venue location estimation using structural information.
- Document EP2717609 (ZHANG ) discloses a method for managing coverage optimization.
- the following disclosure describes methods and systems for improving network system performance for wireless networks, optimizing the same, determining indoor network performance, and methods for determining optimization priority of a network. Only the methods relating to determining optimization priority of a network are part of the claimed invention. The other methods and systems are described to aid understanding of the invention, but do not form part of the claimed invention.
- a method comprising capturing a measurement of network performance from a device application, network performance counter, or call trace that contains a reported horizontal and/or vertical location and one or more error values; defining wherein the one or more error values are a circular area with the radius equal to the location accuracy; using a computer mapping system wherein the reported horizontal and vertical location and error value is defined on a polygonal map defining existing structures and roads; and defining an indoor confidence level based upon the proportion of the area of the error value that falls within a structure as defined on the polygonal map.
- the polygonal map is a 2-dimensional map.
- the polygonal map is a 3-dimensional map.
- the error value is a sphere, having a radius equal to the location accuracy.
- an additional weight is applied to the indoor confidence level where the device is connected to a WiFi network.
- the device's location and location accuracy is measured from crowdsourced data, network performance counters and/or call traces.
- an additional weight is applied to the indoor confidence level if the device is charging.
- an additional weight is applied to the indoor confidence level if the device is stationary for a predetermined amount of time.
- the predetermined amount of time is at least 1 minute, at least 2 minutes, at least 5 minutes, at least 10 minutes, at least 15 minutes, at least 30 minutes, or at least 60 minutes.
- an additional weight is applied to the indoor confidence level if a reported location change is too far from a previous reported location to have travelled in an elapsed time since the previous reported location.
- an additional weight is applied to the indoor confidence level if a reported location of a previous measurement at a similar day and time is similar to a subsequent measured location at the said day and time.
- the indoor confidence level is calculated above a particular threshold (e.g. 40 or 50%) and wherein the error value overlaps within a predefined margin of a structure, then if an indoor confidence level is determined, the measurement is defined as being within said structure.
- a particular threshold e.g. 40 or 50%
- An embodiment is directed toward an optimization priority, wherein an optimization score is defined for a given signal by comparing signal level (for example, RSRP [Reference Signal Receive Power]) to signal quality (for example, RS SNR [Reference Signal-to-Noise Ratio] or RSRQ [Reference Signal Receive Quality]).
- Signal level and signal quality can be detected for systems such as 2G, 3G, 4G, 5G, LTE, or systems of the like now or in development in the future.
- Additional signal and quality KPIs may also include RSSI, RxLev, Eclo, SS-RSRP, SS-SINR, and others as known to those of ordinary skill in the art. Said KPIs may be interchanged with those referred to herein as understood by those of skill in the art.
- signal level and quality are KPI (key performance indicators) which are typically correlated and can be quantified during the network planning phase, using signal propagation and modeling tools; postlaunch optimization phase with RF measurements collection using a dedicated drive-test apparatus and manual processing and analysis of data logs; or Mature Network Optimization Phase, wherein network service measurements collection from a large number of existing customers and automatic processing and visualization are utilized.
- KPI key performance indicators
- an optimization score is defined by normalizing a deviation of a measurement's signal level and quality from (a) the area average signal level and quality and (b) the ideal signal level and quality achievable; and calculating a score using predefined quality value thresholds to generate an optimization score between 0 and 100.
- a further embodiment comprises calculating a score for optimization priority of a signal measurement within a measurement set wherein one of four scenarios exist namely: wherein (1) the slope of RS SNR [AVERAGE] is lower than the slope of RS SNR [IDEAL] and lower than the actual RS SNR; (2) the slope of RS SNR [AVERAGE] is lower than the slope of RS SNR [IDEAL] and higher than the actual RS SNR; (3) the slope of RS SNR [AVERAGE] is higher than the slope of RS SNR [IDEAL] and lower than the actual RS SNR; (4) the slope of RS SNR [AVERAGE] is higher than the slope of RS SNR [IDEAL] and higher than the actual RS SNR.
- These scenarios can be optimized by calculating the priority score according to the formulae defined herein, in order to generate an optimization priority for a single measurement within a dataset.
- Disclosed is a method of creating an indoor confidence level comprising: receiving a location and location accuracy value from or for a device, wherein the location accuracy value is equated to a location accuracy circle; comparing the location and location accuracy circle to a map of known buildings and outdoor locations; and defining an indoor confidence level based upon the percent of overlap of the accuracy radius to a building on said map.
- a map of known building footprints is an electronically defined map comprising a plurality of polygons, each polygon defining a known building or structure, which are each defined as being indoors, and wherein all other space on said map is defined as outdoors.
- the indoor confidence level defined upon the percent of overlap of the accuracy radius to a building on said map is an initial indoor confidence level.
- the initial indoor confidence level is modified based upon one or more additional steps, selected from the group consisting of: detecting whether a device is connected to a WiFi network; detecting whether the device battery is charging, detecting if the device is stationary at a high confidence location, detecting whether the device moves a significant distance in a period of time " T " that provides indication of unreliable location mapping; detecting a location and comparing to a similar time and location from a previous day; and combinations thereof.
- the process of detecting whether a device is connected to a WiFi network is further defined by comparing the strength of the WiFi signal to a signal threshold variable in order to determine whether a device is connected to a WiFi network.
- the process of detecting whether the device battery is charging detects whether the device is connected to A/C power.
- the process of detecting if the device is stationary at a high confidence location comprises detecting if a device is stationary for a time period "7" and wherein the high confidence location is one that has an indoor confidence level of at least 50, or which has previously been categorized as being indoors.
- the process of detecting whether the device moves a significant distance in a period of time "7" is defined as capturing a set of location datapoints and comparing a set of location datapoints over a time period T 1 , and wherein if any data point moves a distance greater than possible during the period of time " T " then that distance is identified as being unreliable.
- the distance being unreliable provides an increase in the indoor confidence level.
- the process captures data at a first time and stores a location and a time in a database, and wherein a data point, captured at a different day, at the same time of day, is compared to the location of the first time, and wherein if the location is the about the same, then the indoor confidence level is increased.
- the indoor confidence level is modified due to any of the additional steps, the indoor confidence level is a medium confidence level.
- the medium confidence level being defined, and wherein the location accuracy radius overlaps with any building, the location is reported as in that building.
- the medium confidence level being defined, and wherein the location accuracy radius does not overlap with a building, the location is reported as not within in that building.
- a method for identifying an optimization priority for a given measurement within a dataset of wireless measurements comprising: calculating a score for optimization priority of a signal measurement within a measurement set wherein one of four scenarios exist namely: wherein (1) the slope of RS SNR [AVERAGE] is lower than the slope of RS SNR [IDEAL] and lower than the actual RS SNR; (2) the slope of RS SNR [AVERAGE] is lower than the slope of RS SNR [IDEAL] and higher than the actual RS SNR; (3) the slope of RS SNR [AVERAGE] is higher than the slope of RS SNR [IDEAL] and lower than the actual RS SNR; (4) the slope of RS SNR [AVERAGE] is higher than the slope of RS SNR [IDEAL] and higher than the actual RS SNR.
- the method further comprises calculating an indoor confidence level that indicates the likelihood of a measurement having been generated indoors and wherein calculating the optimization priority score further includes using the calculated indoor confidence level and a location to modify the optimization priority scores to favor indoor locations.
- a method of defining an optimization parameter for wireless network solutions comprising, defining a result, wherein the result is offered in the form of a calculated score ranging from 0% to 100% which represents the normalized deviation of a measurement's signal level and quality from (a) a calculation of the area average signal level and quality and (b) a calculation of the ideal signal level and quality achievable; wherein the calculated score also uses predefined signal quality value thresholds to place higher priority for optimization on areas with considerably degraded quality; and wherein areas with a high calculated score value and a high signal and poor quality, a performance modification selected from network changes such as antenna configuration or handoff settings adjustments, rather than the installation of a new cell site.
- a method of optimizing a network carrier for a user comprising: defining at least one location point having a location coordinate (latitude and longitude), defining the location point on a map comprising known structures, said structures defined as polygons on said map, overlying a map of carrier coverage to said map and defining a coverage rate for said location point.
- the method comprising defining at least two location points on a map.
- the method comprising applying at least two different carrier overlays to define an optimized carrier for the location point or location points.
- Measurements may include signal level, signal quality, dropped calls, and data transfer speeds.
- the test equipment is typically installed in a vehicle which is driven on roads or placed in a backpack or cart which is walked through an outdoor or indoor area under study. Location information may be gathered through a GPS (or similar) device connected to the test set, or the location may be manually recorded periodically by the tester. After collection, the samples are processed, displayed, and analyzed on a map to identify any service problems and their geographic location. For example, a sample data set comprising a plurality of data points (45) are depicted in FIG. 3 , which are collected in this manual manner.
- Measurement sample collection using professional test equipment that is driven or walked through an area can be very costly. Additionally, professional test equipment is limited to a small number of test devices, fragile cables, and connectors that are prone to breakage, and is limited to locations that are accessible to the tester. For example, coverage samples taken from a vehicle may not accurately reflect the actual coverage at locations adjacent to the roadway, or do not accurately reflect the coverage at an elevated height, i.e. inside of a building that is adjacent to that street. Certainly, these may not address coverage underground, such as in subway or trolley spaces, if these are not specifically tested. This leads to weaknesses in the data, lowering its value, despite the high costs of collection.
- Another common network service assessment technique involves analysis of measurement samples gathered continuously by the wireless network equipment itself. To locate where problems are occurring geographically with this method, delay measurements from serving and neighboring cell sites may be combined to yield an approximate location of any service problems. Since samples collected directly by a network may be located geographically based on low resolution delay measurements, this often results in poor location accuracy. Additionally, with this method, samples are only available for the host network and not competing networks.
- Measurement samples may be gathered through applications typically installed on smartphones or gathered directly from wireless networks. Results can be displayed on a map and in tabular form.
- ICL Indoor Confidence Level
- a measurement sample typically includes a location along with an error value. However, there is no reliable indication whether the sample was generated indoors or outdoors. Additionally, if there are multiple buildings in the area, there is no indication which building the sample was recorded in.
- a threshold may be used to select only samples with high or low Indoor Confidence Level.
- the samples are attributed to particular buildings. For example, by using data points that are only high ICL, overall coverage, performance, and user density can be assessed for particular buildings or sections of buildings.
- the methods below describe a method for determining the likelihood that a device or network-generated measurement sample was generated indoors, and attributes them to a specific building or outdoor area.
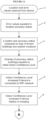
- FIGS. 1A and 1B provides an overview of the ICL methodology, and FIG. 2 details an example of certain data points on a sample map.
- Step 1 of FIG. 1A comprises receiving location and error values from a device. Together the location and error values define a measurement sample (1), which is received from a device or network performance counter or call trace that contains a reported horizontal and/or vertical location as well as one or more location accuracy values.
- Horizontal location accuracy is typically defined as the radius (2) of a circle centered at the reported latitude and longitude coordinates. This imaginary circle indicates that there is a high probability of the true location being within its bounds.
- the area overlap ratio between the horizontal location accuracy circle and polygons defining horizontal footprints of known structures (buildings) is used to calculate an initial indoor confidence level (4).
- one with 25% of the area within a polygon means a 25 ICL, and one with 75% of the area within a polygon means a 75 ICL.
- This level can then be modified based on additional factors. For example:
- the calculated Confidence Level (meaning the initial ICL and the above steps 5-9 are completed to generate a calculated Confidence Level) is above a particular threshold (40% or 50% for example) and within a predefined margin from a nearby building, then that building is identified as the one the reported measurement was recorded within (10).
- FIG. 2 wherein the horizontal location accuracy values are depicted as circular representations, with the horizontal location accuracy value being defined as the magnitude of the depicted radius.
- the horizontal location accuracy value is defined as the magnitude of the depicted radius.
- FIG. 2 there are three different measurement points (26, 27, and 31), each having different accuracy values, and thus the radius of each of (21, 25, and 29) are different, a smaller radius defining a higher location accuracy.
- the location accuracy value for the first radius (21) at the first point (26) is much larger than the location accuracy value of the second radius (25) at the second point (27), and the location accuracy value for the third radius (29) at the third point (31) has a location accuracy between the first radius (21) and the second radius (25).
- These locations are then mapped against the structures (22, 24, and 28).
- the words "structures" and “buildings” are used interchangeably herein.
- a location point can be determined as an initial threshold based on these known points and measurements.
- the overlap radius of each of the first radius (21), the second radius (25), and the third radius (29) are overlapped on the polygonal map to generate an initial indoor confidence level (4). It is important to define this indoor confidence level, as optimization of the network may vary depending on indoor or outdoor performance.
- an indoor confidence level is determined to be on a continuum between 0% and 100%, with 0% defining that there is no indoor confidence, i.e. the data point is likely outdoors.
- a score of 100% defines that the data point is likely indoors.
- the points in between define the continuum wherein there is not a binary response, but a level of certainty with regard to the position of a device when taking a measurement.
- FIG. 2 defines some examples of these confidence levels, with the first data point (26) having a 50% of the area of the circle indoors and 50% outdoors, and thus defines an indoor confidence level of 50.
- a second data point (27) having 0% of area overlap with any building polygon indicates 0% indoor initial confidence level
- third data point (31) having a 100% of the area inside a building polygon, defining a 100% initial indoor confidence level.
- Determining and refining the initial indoor confidence level for the first data point (26) is a key feature that is addressed by the methods defined herein. Once the horizontal location accuracy values are defined and the radius (21) plotted against the polygonal map, in this case, depicting one half of the radius (21) within (33) the structure (22), and one half outside (32) of the structure (22), an initial ICL of 50% is calculated. Improvement of this level can be made through additional steps.
- a further step to refining the initial indoor confidence level is to ask whether the data point (26) was collected when the device (any device, whether it is a device having cellular telemetry [phone, tablet, laptop, watch, etc.], a network performance counter, or call trace) is also connected to a WiFi network (5).
- the device any device, whether it is a device having cellular telemetry [phone, tablet, laptop, watch, etc.], a network performance counter, or call trace
- This is a relevant data point as many devices are not connected to WiFi when traveling on a road or walking through a neighborhood, and these individuals typically use cellular data for connections.
- a person using a smart phone and out for a run listens to music through a streaming service by using cellular data.
- the device When the device does connect to WiFi (5) it usually means that the device is now in a location that is ordinarily an indoor location, such as a home, office, gym, or other space where a WiFi network that is recognized by the device is expected. Thus, a strong active or passive WiFi connection indicates a higher confidence level of the device being indoors at that moment.
- further steps may be evaluated to determine an indoor confidence level.
- the lack of a WiFi network can be utilized to reduce the indoor confidence level. Whether a decrease in the indoor confidence level is provided or no change is provided, further steps can be utilized to further modify the indoor confidence level.
- an increase in the indoor confidence level adjustment is generated if the device is charging.
- an increase of the ICL is defined only when the charge is defined as coming from AC power.
- supplemental battery packs or mobile charging would not generate an increase in the ICL based on this criterion.
- the indoor confidence level can again be increased if a device is stationary at a high confidence location (7).
- a high confidence location is one that has an ICL of at least 50%, or which has previously been categorized as being indoors based on additional data. For example, data point (26) would have its indoor confidence level increased if the device remains stationary for a given amount of time. That would indicate that the device may be within the building, for example, at a desk, in a locker, or on a person as they are working within a building. It is more likely that a device is indoors when stationary as compared to outdoors and because of the propensity for the device to be with a person who is required to be working at that location.
- a device in a static location may measure its location every "n" seconds, with "n” being usually between 1 and 60 seconds. Of these measurements, only a subset might have nearly identical locations, with the rest reporting high variance in locations. If the distance between the nearly identical locations and the remaining ones is higher than the user could have travelled in the short period of time, then there is a high likelihood that the device is not actually moving but is instead experiencing location accuracy issues due to a poor GPS lock or network-assisted location triangulation.
- the indoor confidence level is increased where the distance is significantly different than from a previous location (8), because there is a higher probability that the device is static at a location that is not using GPS, as indoor applications have a lower use of GPS and higher use of triangulation protocols, and these triangulation protocols are more prone to deviations in position than their GPS counterparts, specifically when inside of a building.
- steps 1-4 define an initial ICL and the remaining steps seek to increase the certainty of the ICL calculation, whether that is lower or higher. Accordingly, in addition to the mapping on the polygonal map and determining error values for a particular location, the additional qualification steps in steps 5-9 of FIGS. 1A and 1B are further defined below. These steps may be used alone or in combination with one another.
- prior data based on location and timing can also be utilized to modify the ICL. For example, historical data showing a measurement at a similar time and place (9) during several weeks of data would be highly suggestive of an indoor location, i.e. the place of employment of the individual. However, a different location at a time and place than normally reported indicates the possibility of being at a different indoor location or an outdoor location, thus reducing the ICL.
- step 7 we can define a high confidence location through step (9), which compares the previous location at a similar time of day.
- the location and time are stored within a database or in memory, which allows for a comparison from a time point " t 0 " to a present time, for comparison to attain the high confidence location determination.
- places where the phone typically stays are at home, school, or work, and these can be tracked through simply recurring habits based on time and location to generate such high confidence locations.
- step 10 we can also attribute a high confidence location to a building, just as below a medium confidence is attributed to a building.
- any time a high confidence is set, and the measurement error is within a building polygon we set the location as in that building, just as in steps 10, 11, and 13 with medium confidence listed below. If there is no building nearby, then that indicates a likelihood that there is not a high confidence to begin with and that the previous time and location may be outdoors, such as someone who runs at the same time every day.
- a medium confidence level can be calculated.
- the system is queried in step 10: Is medium confidence level location within nearby building borders?
- medium confidence refers to an analysis of steps 5-9 of FIGS. 1A and 1B .
- Medium confidence itself can be a variable and designated based upon the criteria of the search. For example, wherein medium confidence is defined as meeting at least one of the evaluation steps. Namely, if in step 5, there was a WiFi connection, or in step 6, charging, or step 7 stationary device, or step 8 the distance travelled, or step 9 a similar location. Each of these allows for increasing the confidence, and thus any positive responses to such evaluations steps would result in medium confidence.
- medium confidence may require a positive assertion to two or more of the steps 5-9, or three or more, or even four or more, or all five.
- two or more steps are utilized to generate a medium confidence. Accordingly, if medium confidence is defined, and within nearby building borders, then the answer is "Yes” (12), then the location is reported as being within the building (14). If the answer is "No” (13), either because of a failure of medium confidence or of being within nearby building borders, then the location is reported as not within the building (15). Thus, depending on the answer, a location and indoor confidence level is returned (16) and can be stored in a database or utilized for further analysis. Thus, step 15 confirms both a determination of inside or outside of a building and the confidence level returned of that determination.
- confidence level is additive of the initial confidence level. Namely, an initial score is generated by mapping and then an increase or decrease in the score is generated. For example, for each positive assertion to steps 5-9, ten points can be added to the initial ICL. In other embodiments, twenty-five points can be added to the initial ICL. In other embodiments fifty points can be added to the initial ICL. Accordingly, users can modify the scoring based upon particular certainty with regard to the data to fit their needs. Furthermore, a positive assertion to steps 5-9 may increase the initial ICL, but a negative response may also decrease the initial ICL by an amount. Each step may also have different weights than another step.
- a map can be created of signal to noise ratios and signal strength using only measurements with high or low ICL to allow for improved data management of signal quality in a particular area.
- a high ICL may be greater than 50, 60, 70, 80, or 90, and a low ICL may be below 50, 40, 30, 20, 10, or any number in between for either the high or low ICL.
- This information can then be utilized, on one hand, by service providers who can evaluate weaknesses in their signal reach or quality to specifically improve the infrastructure, instead of deploying additional equipment to increase the signal level in the impacted area.
- service providers who can evaluate weaknesses in their signal reach or quality to specifically improve the infrastructure, instead of deploying additional equipment to increase the signal level in the impacted area.
- the data herein can be mined to allow for optimization rather than capacity expansion.
- FIG. 10 depicts a flowchart showing this process comprising defining an electronic map (131), defining one or more carriers on the map (132), defining a location or inputting a location of a user (133) on said map, comparing the defined location of the user (133) with the carrier coverage (134), and changing the coverage to different providers (135) to optimize the carrier coverage.
- This last step can be performed automatically by the system; for example, the defined coverage (132) may be an input to a current carrier of the user, and, once the user defines her location (133), the system can automatically select an optimized carrier (135) to be displayed on the map. It may be that several carriers have excellent signal in the particular location, so it may be advantageous to generate two or more location points (136) for the user and then re-comparing or recalculating an optimized provider (137). These steps can be repeated as necessary with "N" number of location points in order to define an optimized carrier. For example, points might be home, school, job, friend's home, etc., and a user can then optimize the carrier coverage based upon these points. Obviously, the data can then be mined by the providers to identify possible targets for sales or for areas that have the most desire and can be optimized by a carrier.
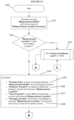
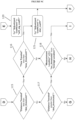
- FIGS. 9A , 9B , 9C , and 9D provide a detailed flowchart for calculating of elements of Indoor Confidence Level, and details setting of certain levels of confidence as the process and assertion steps are completed.
- a further step is to calculate an overlap area (105) as overlap between a measurement buffer and all building polygons.
- distance traveled as a time difference between current and previous measurement location (107).
- time traveled as a time difference between current and previous measurement location (107).
- average location as the location coordinates of average measurement location of the device for the time (hour) of day from historic values for the same device (108).
- the next step is determination of whether this overlap area is greater than 50% (109). If yes, then the next step is to determine whether the device is mobile charging (112). If yes, then indoor confidence level is set to 100% (103), then the measurement location is defined as within a "location threshold 1" of any building polygon edge. However, if the overlap area is less than 50%, then we consider whether the overlap area is between 40% and 50% (110). If yes, then the measurement location is defined as within a "location threshold 1" of any building polygon edge. The status of mobile charging (112) is then considered.
- the process asks whether there is a WiFi connection (113), wherein no WiFi continues to point D, and yes asks whether WiFi Signal strength is greater than a WiFi signal threshold (114), in which yes sets indoor confidence level to 100% (103), and no leads to E.
- the system asks whether the time traveled is less than the "time threshold 1" (116). Where the distance traveled is not less than the distance threshold from (115), then the system asks whether the distance traveled is greater than the "distance threshold 2" in (117). If yes, then we ask if the measurement location is within the "location threshold 2" from the average location (118). If the time travelled is less than "time threshold 1" (116) then we set adjustment coefficient to "distance coefficient 1" (121): if the time is not less, then we proceed to determine whether the measurement location is within the location threshold 2 from the average location (118). If yes, then we set adjustment coefficient to location coefficient 1 (123).
- the adjustment coefficient can be set by the particular stringent requirements of the process at hand. Accordingly, in one embodiment, the value may be X and, in another embodiment, the value Y. Furthermore, the coefficients do not need to be identical, and certain coefficients may hold more weight than others.
- preferred embodiments define a method of defining an indoor confidence level through a process including steps of: (1) receiving location and error values from a device, wherein error values are equated to location accuracy results; (2) comparing the location and accuracy radius to a map of known buildings and outdoor locations, (3) overapplying the accuracy radius with buildings to generate an initial indoor confidence level. In certain embodiments, these steps are sufficient for generating an indoor confidence level.
- using any one of the above steps generates a medium confidence score that then detects whether the data is within nearby building borders and then determining from this point whether the location is indoors or outdoors and returning a location and indoor confidence level.
- a location and indoor confidence level can be returned that reports that the location is within a building. For example, where the location accuracy radius is within a building polygon and a high confidence location, then the location is reported as within that building.
- the building location is determined to be the building polygon with the greatest percentage within the location accuracy radius.
- OPL Optimization Priority Level
- ICL or OPL values are calculated, several individual raw measurements in the same general location or building can be aggregated to assess the overall service in each building or outdoor area.
- the ICL and/or OPL values may then be combined with each other or with other inputs such as the percentage of measurements on low bands compared to high bands, density of users, proportion of users on legacy vs. newer technologies (LTE vs. UMTS, for example), and others to rank buildings and outdoor areas for network improvement and sales opportunity.
- LTE RSRP Reference Signal Receive Power
- LTE RS SNR Reference Signal Signal-to-Noise Ratio
- the optimization methods outlined above rely on manual identification of areas of good signal level and poor signal quality with the added challenge of individual toggling between LTE RSRP and LTE RS SNR and/or LTE RSRQ maps in the case of an LTE network.
- the same concept applies to all modern wireless technologies, including 5G, UMTS, CDMA, etc.
- the area average signal level and quality metric defines the Average RS SNR as a linear function of RSRP.
- the equation for this line in particular its slope and intercept, can be determined by finding the best fitting straight line on an RSRP vs RS SNR scatter plot.
- RS SNR [IDEAL] RSRP [ACTUAL] - 125.25 [dBm]
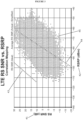
- FIG. 3 provides an example distribution of LTE RSRP and RS SNR measurements 44 collected using drive-test equipment with calculated RS SNR [IDEAL] (43) and Average RS SNR [ACTUAL] (44) computed over the entire sample set, with RS SNR (dB) (41) defined on the y-axis and RSRP (dBm) (42) defined on the x-axis.
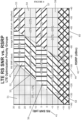
- LTE RS SNR measurements with highest delta from ideal RS SNR (RS SNR [IDEAL] ) and cluster average RS SNR (Average RS SNR [ACTUAL] ) can be grouped into several sets (10, for example) yielding equal ranges of normalized scores in 10% increments from 0% to 100%. These ranges are depicted in FIG. 4 .
- the groups of normalized scores can be partitioned based on absolute RS SNR thresholds (-20 dB to -10 dB, -10 dB to 0 dB, etc.) since signal quality has a higher impact than signal level in facilitating high performance of services provided by the wireless carriers.
- FIG. 4 provides a visual overview of example thresholds and regions of assigned LTE Optimization Priority, comprising actual data points plotted against RS SNR over RSRP. Ultimately, the optimization, as calculated by the formula are detailed in FIG. 4 , which defines optimization priority.
- An LTE Optimization Priority score can be calculated for individual measurements of LTE RSRP and corresponding LTE RS SNR values from a set of measurements by way of simple linear functions definition and extrapolation. It is important that the measurements set contains a large number of LTE RSRP and LTE RS SNR samples with a wide variance of values.
- Priority % Priority BASE + Priority INCREMENT
- Priority BASE Any 10 % , 20 % , 30 % , 40 % , 50 % , 60 % , 70 % , 80 % , 90 %
- FIG. 5 depicting the scenario where the slope of RS SNR [AVERAGE] is lower than the slope of RS SNR [IDEAL] and actual RS SNR.
- RS SNR [IDEAL] (78) has a first slope and is parallel to slope (80). However, Average RS SNR [ACTUAL] slope (79) is lower than the slope (78) of RS SNR [IDEAL] .
- This provides for data the delta min (81) and the delta max (82) points. This creates a section between y 2 (73) and y 3 (74) between the points of delta min (81) and delta max (82) that defines the location of the datapoint (83) priority under consideration.
- a graphical representation of this solution is depicted in FIG. 6 .
- the delta min (92) is from point y 3 to a point on RS SNR [IDEAL] at x 2
- the delta max (82) is from y 2 to a point on RS SNR [IDEAL] at x 3 .
- Priority % Priority BASE + Priority INCREMENT
- Priority BASE Any 10 % , 20 % , 30 % , 40 % , 50 % , 60 % , 70 % , 80 % , 90 %
- FIG. 7 shows a graphical representation of the same, depicting y 2 (141), y 3 (142), limits on the RSRP x 1 (143), x 2 (144), and x 3 (145). Which defines the delta min (147), the delta max (148), and an area of (149).
- Priority % Priority BASE + Priority INCREMENT
- Priority BASE Any 10 % , 20 % , 30 % , 40 % , 50 % , 60 % , 70 % , 80 % , 90 %
- FIG. 8 depict a further scenario wherein the slope of the Average RS SNR [ACTUAL] (156) is greater than the slope of the RS SNR [IDEAL] (78) and actual RS SNR is above Average RS SNR.
- FIG. 8 depicts wherein y 2 (151) and y 3 (152), match with the RSRP variables x 1 (153), x 2 (154), and x 3 (155) to define the delta min (157) and delta max (156), and the area of interest (159).
- Priority % Priority BASE + Priority INCREMENT
- Priority BASE Any 10 % , 20 % , 30 % , 40 % , 50 % , 60 % , 70 % , 80 % , 90 %
- Priority % Priority BASE + 0.1 ⁇ abs m Avearge RS SNR ACTUAL ⁇ RS SNR ACTUAL ⁇ RSRP ACTUAL ⁇ 125.2 abs m Avearge RS SNR ACTUAL ⁇ RS SNR Threshold 1 ⁇ 125.2 ⁇ RS SNR Threshold 1 ⁇ a Average RS SNR ACTUAL
- a scenario to identify the use cases for the above formulae and the corresponding graphical depictions is wherein a data set of 1,000 measurements exists, with each measurement having an RSRP and a corresponding RS SNR.
- the group of 1,000 measurements are plotted on an RSRP over RS SNR plot and a generates a line that best fits the scatter plot.
- This line is the Average RS SNR as a function of RSRP, as depicted in the plot figures.
- y 2 , y 3 and x 2 we find the location of delta_min and delta_max.
- the shaded area as depicted in FIGS. 5-8 is the location of the some of the 1,000 measurements that fall within the y and x limits.
- This optimization priority can be further combined by the ICL to identify both internal and external considerations with regard to the coverage and quality, and also to the priority of which the optimization should occur.
- the methods and systems herein can be utilized alone or in combination with one another to improve network service.
Landscapes
- Engineering & Computer Science (AREA)
- Computer Networks & Wireless Communication (AREA)
- Signal Processing (AREA)
- Quality & Reliability (AREA)
- Physics & Mathematics (AREA)
- Electromagnetism (AREA)
- Mobile Radio Communication Systems (AREA)
- Position Fixing By Use Of Radio Waves (AREA)
Claims (15)
- Procédé permettant de définir un score de priorité d'optimisation et d'appliquer ledit score pour améliorer les performances d'un réseau sans fil, comprenant :l'obtention d'un ensemble des mesures comprenant une pluralité de niveaux de signaux mesurés (42) et une pluralité de qualités de signaux mesurées (41) associées, lesdits niveaux de signaux mesurés (42) et lesdites qualités de signaux (41) étant mesurés à l'aide de signaux provenant du réseau sans fil ;la détermination d'une pluralité de qualités de signaux idéales (43, 78) et d'une pluralité de qualités de signaux moyennes (44, 79, 146) sur une plage comprenant la pluralité de niveaux de signaux mesurés ;la détermination d'une pluralité d'écarts concernant les qualités de signaux idéales représentant des différences de qualités de signaux normalisées entre la pluralité de qualités de signaux idéales (43, 78) correspondant à la pluralité de niveaux de signaux mesurés (42) et la pluralité de qualités de signaux mesurées (41) associées à la pluralité de niveaux de signaux mesurés (42) ;la détermination d'une pluralité d'écarts concernant les qualités de signaux moyennes représentant des différences de qualités de signaux normalisées entre la pluralité de qualités de signaux moyennes (44, 79) correspondant à la pluralité de niveaux de signaux mesurés (42) et la pluralité de qualités de signaux mesurées (41) associées à la pluralité de niveaux de signaux mesurés (42) ;le calcul d'une pluralité de scores de priorité d'optimisation pour l'ensemble de mesures compte tenu de la pluralité d'écarts concernant les qualités de signaux idéales et de la pluralité d'écarts concernant les qualités de signaux moyennes, étant entendu que des sous-ensembles des qualités de signaux mesurées présentant une combinaison d'écarts plus importants concernant les qualités de signaux idéales et d'écarts plus importants concernant les qualités de signaux moyennes produisent des scores de priorité d'optimisation plus importants ; etla priorisation d'ajustements de configurations du réseau sans fil pour les régions géographiques associées aux sous-ensembles des mesures ayant des scores de priorité d'optimisation plus élevés.
- Procédé selon la revendication 1, dans lequel l'ensemble de mesures comprend une pluralité de niveaux de signaux mesurés (42) de RSRPACTUAL (puissance reçue de signal de référence) et une pluralité de qualités de signaux mesurés (41) de RS SNRACTUAL (rapport signal sur bruit du signal de référence), la pluralité de qualités de signaux idéales (78) comprend RS SNRIDEAL, la pluralité de qualités de signaux moyennes (79) comprend RS SNRACTUAL moyen, et dans lequel la détermination de la pluralité d'écarts concernant les qualités de signaux idéales et la détermination de la pluralité d'écarts concernant les qualités de signaux moyennes comprend, pour un sous-ensemble des mesures ayant un RS SNRACTUAL compris entre un seuil de qualité de signal supérieur et un seuil de qualité de signal inférieur et un RS SNRACTUAL inférieur au RS SNRACTUAL moyen correspondant à la RSRPACTUAL associée au RS SNRACTUAL :la détermination d'un delta de qualité de signal mesuré entre le RS SNRACTUAL et le RS SNRIDEAL correspondant à la RSRPACTUAL associée au RS SNRACTUAL ;la détermination d'un delta de qualité de signal minimum (92) parmi une pluralité de deltas entre le RS SNRACTUAL du sous-ensemble et le RS SNRIDEAL correspondant à la RSRPACTUAL associée au RS SNRACTUAL du sous-ensemble ;la détermination d'un delta de qualité de signal maximum (82) parmi la pluralité de deltas ; etla détermination d'un rapport entre un premier écart et un deuxième écart en tant que différences des qualités de signaux normalisées, ledit premier écart comprenant les différences entre le delta de qualité de signal mesuré et le delta de qualité de signal minimum, et ledit deuxième écart comprenant les différences entre le delta de qualité de signal maximum et le delta de qualité de signal minimum.
- Procédé selon la revendication 2, dans lequel le calcul de la pluralité de scores de priorité d'optimisation pour le sous-ensemble de mesures comprend : l'ajout des différences des qualités de signaux normalisées pour le sous-ensemble de mesures à un score de priorité d'optimisation de base associé aux qualités de signaux mesurées comprises entre le seuil de qualité de signal supérieur et le seuil de qualité de signal inférieur, ledit score de priorité d'optimisation de base diminuant progressivement à mesure que le seuil de qualité de signal supérieur et le seuil de qualité de signal inférieur augmentent progressivement.
- Procédé selon la revendication 1, dans lequel l'ensemble de mesures comprend une pluralité de niveaux de signaux mesurés (42) de RSRPACTUAL (puissance reçue de signal de référence) et une pluralité de qualités de signaux mesurées (41) de RS SNRACTUAL (rapport signal sur bruit du signal de référence), la pluralité de qualités de signaux idéales (78) comprend RS SNRIDEAL, la pluralité de qualités de signaux moyennes (146) comprend RS SNRACTUAL moyen et dans lequel la détermination de la pluralité d'écarts concernant les qualités de signaux idéales et la détermination de la pluralité d'écarts concernant les qualités de signaux moyennes comprennent, pour un sous-ensemble des mesures ayant un RS SNRACTUAL compris entre un seuil de qualité de signal supérieur et un seuil de qualité de signal inférieur et un RS SNRACTUAL supérieur au RS SNRACTUAL moyen correspondant à la RSRPACTUAL associée au RS SNRACTUAL :la détermination d'un delta de qualité de signal mesuré entre le RS SNRACTUAL et le RS SNRIDEAL correspondant à la RSRPACTUAL associée au RS SNRACTUAL ;la détermination d'un delta de qualité de signal minimum (147) parmi une pluralité de deltas entre le RS SNRACTUAL du sous-ensemble et le RS SNRIDEAL correspondant à la RSRPACTUAL associée au RS SNRACTUAL du sous-ensemble ;la détermination d'un delta de qualité de signal maximal (148) parmi la pluralité de deltas ; etla détermination d'un rapport entre un premier écart et un deuxième écart en tant que différences des qualités de signaux normalisées, ledit premier écart comprenant les différences entre le delta de qualité de signal mesuré et le delta de qualité de signal minimum, et ledit deuxième écart comprenant les différences entre le delta de qualité de signal maximum et le delta de qualité de signal minimum.
- Procédé selon la revendication 4, dans lequel le calcul de la pluralité de scores de priorité d'optimisation pour le sous-ensemble de mesures comprend : l'ajout des différences des qualités de signaux normalisées pour le sous-ensemble des mesures à un score de priorité d'optimisation de base associé aux qualités de signaux comprises entre le seuil de qualité de signal supérieur et le seuil de qualité de signal inférieur, et ledit score de priorité d'optimisation de base diminuant progressivement à mesure que le seuil de qualité de signal supérieur et le seuil de qualité de signal inférieur augmentent progressivement.
- Procédé selon la revendication 1, comprenant en outre le calcul d'un niveau de confiance d'intérieur qui indique la probabilité qu'une mesure ait été générée à l'intérieur, et dans lequel le calcul du score de priorité d'optimisation comprend en outre l'utilisation du niveau de confiance d'intérieur calculé et d'un emplacement pour modifier les scores de priorité d'optimisation afin de favoriser les emplacements intérieurs.
- Procédé selon la revendication 1, dans lequel la pluralité de scores de priorité d'optimisation est divisée compte tenu d'une pluralité de seuils de qualité de signal.
- Procédé selon la revendication 1, dans lequel, la détermination de la pluralité d'écarts concernant les qualités de signaux moyennes comprend la détermination du fait que la pluralité de qualités de signaux mesurées (41) associées à la pluralité de niveaux de signaux mesurés (42) est supérieure ou inférieure à la pluralité de qualités de signaux moyennes (44, 79, 146) correspondant à la pluralité de niveaux de signaux mesurés (42).
- Procédé selon la revendication 1, dans lequel la pluralité de scores de priorité d'optimisation est divisée compte tenu d'une pluralité de seuils de qualité de signal et de comparaisons entre la pluralité de qualités de signaux mesurées (41) associées à la pluralité de niveaux de signaux mesurés (42) et à la pluralité de qualités de signaux idéales (43, 78) ainsi qu'à la pluralité de qualités de signaux moyennes (44, 79, 146) correspondant à la pluralité de niveaux de signaux mesurés (42).
- Procédé selon la revendication 1, dans lequel la pluralité de qualités de signaux moyennes (44, 79, 146) est déterminée en faisant la moyenne de la pluralité de qualités de signaux mesurées (41) associées à chacun des niveaux de signaux mesurés (42).
- Procédé selon la revendication 1, dans lequel la pluralité de qualités de signaux idéales (43, 78) est déterminée en soustrayant une valeur représentative de la puissance du bruit thermique de chacun des niveaux de signaux mesurés (42).
- Procédé selon la revendication 1, dans lequel la priorisation des ajustements des configurations du réseau sans fil comprend la priorisation de la conception et de l'optimisation du réseau sans fil pour les régions géographiques associées aux sous-ensembles des mesures ayant des scores de priorité d'optimisation relativement élevés.
- Procédé selon la revendication 1, dans lequel la pluralité de scores de priorité d'optimisation est divisée compte tenu d'une pluralité de seuils de qualité de signal, d'une relation entre la pluralité de qualités de signaux mesurées (41) et la pluralité de qualités de signaux idéales (43, 78), et d'une relation entre la pluralité de qualités de signaux mesurées (41) et la pluralité de qualités de signaux moyennes (44, 79, 146).
- Procédé selon la revendication 1, dans lequel les régions géographiques associées aux sous-ensembles des mesures ayant les scores de priorité d'optimisation relativement élevés représentent le sous-ensemble des mesures ayant des écarts plus importants ou davantage négatifs par rapport aux qualités de signaux idéales (43, 78) ou aux qualités de signaux moyennes (44, 79, 146).
- Procédé selon la revendication 1, dans lequel la pluralité de scores de priorité d'optimisation pour l'ensemble de mesures est calculée selon l'un des quatre scénarios suivants :(1) la pluralité de qualités de signaux moyennes (44, 79, 146) a un taux de changement (pente) inférieur à celui de la pluralité de qualités de signaux idéales (43, 78) et un sous-ensemble de la pluralité de qualités de signaux mesurées (41) est supérieur à la pluralité correspondante de qualités de signaux moyennes (44, 79, 146) ;(2) la pluralité de qualités de signaux moyennes (44, 79, 146) a un taux de changement (pente) supérieur à celui de la pluralité de qualités de signaux idéales (43, 78) et un sous-ensemble de la pluralité de qualités de signaux mesurées (41) est supérieur à la pluralité correspondante de qualités de signaux moyennes (44, 79, 146) ;(3) la pluralité de qualités de signaux moyennes (44, 79, 146) a un taux de changement (pente) inférieur à celui de la pluralité de qualités de signaux idéales (43, 78) et un sous-ensemble de la pluralité de qualités de signaux mesurées (41) est inférieur à la pluralité correspondante de qualités de signaux moyennes (44, 79, 146) ; ou(4) la pluralité de qualités de signaux moyennes (44, 79, 146) a un taux de changement (pente) supérieur à celui de la pluralité de qualités de signaux idéales (43, 78) et un sous-ensemble de la pluralité de qualités de signaux mesurées (41) est inférieur à la pluralité correspondante de qualités de signaux moyennes (44, 79, 146).
Priority Applications (1)
| Application Number | Priority Date | Filing Date | Title |
|---|---|---|---|
| EP23192156.0A EP4250795A3 (fr) | 2018-04-11 | 2019-04-11 | Évaluation de service de réseau sans fil |
Applications Claiming Priority (2)
| Application Number | Priority Date | Filing Date | Title |
|---|---|---|---|
| US201862761924P | 2018-04-11 | 2018-04-11 | |
| PCT/US2019/027040 WO2019200139A1 (fr) | 2018-04-11 | 2019-04-11 | Évaluation de service de réseau sans fil |
Related Child Applications (2)
| Application Number | Title | Priority Date | Filing Date |
|---|---|---|---|
| EP23192156.0A Division EP4250795A3 (fr) | 2018-04-11 | 2019-04-11 | Évaluation de service de réseau sans fil |
| EP23192156.0A Division-Into EP4250795A3 (fr) | 2018-04-11 | 2019-04-11 | Évaluation de service de réseau sans fil |
Publications (4)
| Publication Number | Publication Date |
|---|---|
| EP3777253A1 EP3777253A1 (fr) | 2021-02-17 |
| EP3777253A4 EP3777253A4 (fr) | 2022-04-06 |
| EP3777253B1 true EP3777253B1 (fr) | 2023-09-27 |
| EP3777253C0 EP3777253C0 (fr) | 2023-09-27 |
Family
ID=68162296
Family Applications (2)
| Application Number | Title | Priority Date | Filing Date |
|---|---|---|---|
| EP23192156.0A Pending EP4250795A3 (fr) | 2018-04-11 | 2019-04-11 | Évaluation de service de réseau sans fil |
| EP19784765.0A Active EP3777253B1 (fr) | 2018-04-11 | 2019-04-11 | Évaluation de service de réseau sans fil |
Family Applications Before (1)
| Application Number | Title | Priority Date | Filing Date |
|---|---|---|---|
| EP23192156.0A Pending EP4250795A3 (fr) | 2018-04-11 | 2019-04-11 | Évaluation de service de réseau sans fil |
Country Status (4)
| Country | Link |
|---|---|
| US (3) | US10567922B2 (fr) |
| EP (2) | EP4250795A3 (fr) |
| CA (1) | CA3096351A1 (fr) |
| WO (1) | WO2019200139A1 (fr) |
Families Citing this family (10)
| Publication number | Priority date | Publication date | Assignee | Title |
|---|---|---|---|---|
| US11106441B2 (en) * | 2018-09-14 | 2021-08-31 | Microsoft Technology Licensing, Llc | Secure device-bound edge workload delivery |
| US11238148B2 (en) * | 2019-02-12 | 2022-02-01 | Cisco Technology, Inc. | Location-based, context-aware challenge-response authentication |
| US11165648B1 (en) * | 2019-09-26 | 2021-11-02 | Juniper Networks, Inc. | Facilitating network configuration testing |
| US11129032B2 (en) | 2019-11-26 | 2021-09-21 | Motorola Mobility Llc | Optimal device position for wireless communication |
| US10849034B1 (en) * | 2019-11-26 | 2020-11-24 | Motorola Mobility Llc | Signal map for wireless connectivity |
| US11486960B2 (en) * | 2019-12-13 | 2022-11-01 | Billups, Inc. | Mobile signal based building footprints |
| US11552724B1 (en) | 2020-09-16 | 2023-01-10 | Wells Fargo Bank, N.A. | Artificial multispectral metadata generator |
| US11706078B1 (en) | 2021-03-22 | 2023-07-18 | Two Six Labs, LLC | Internet disruption detection |
| EP4381766A4 (fr) * | 2021-08-06 | 2025-06-25 | Jio Platforms Limited | Systèmes et procédés pour optimiser la demande d'alimentation dans un réseau de télécommunication |
| CN121212745B (zh) * | 2025-11-28 | 2026-03-03 | 北京数字一百信息技术有限公司 | 一种基于大数据的客户管理方法及系统 |
Citations (1)
| Publication number | Priority date | Publication date | Assignee | Title |
|---|---|---|---|---|
| EP2717609A1 (fr) * | 2011-07-28 | 2014-04-09 | Huawei Technologies Co., Ltd | Procédé, dispositif et système de gestion d'optimisation de couverture |
Family Cites Families (31)
| Publication number | Priority date | Publication date | Assignee | Title |
|---|---|---|---|---|
| JP3871201B2 (ja) | 2002-01-29 | 2007-01-24 | ソニー株式会社 | コンテンツ提供取得システム |
| JP2005025381A (ja) * | 2003-06-30 | 2005-01-27 | Toshiba Corp | 電子機器および電力制御方法 |
| US8755815B2 (en) | 2010-08-31 | 2014-06-17 | Qualcomm Incorporated | Use of wireless access point ID for position determination |
| US8634860B2 (en) * | 2010-01-15 | 2014-01-21 | Apple Inc. | Location determination using cached location area codes |
| US8811977B2 (en) | 2010-05-06 | 2014-08-19 | At&T Mobility Ii Llc | Device-driven intelligence and feedback for performance optimization and planning of a service network |
| US9801095B2 (en) | 2010-07-26 | 2017-10-24 | At&T Mobility Ii Llc | Automated wireless access point resource allocation and optimization |
| US8174931B2 (en) | 2010-10-08 | 2012-05-08 | HJ Laboratories, LLC | Apparatus and method for providing indoor location, position, or tracking of a mobile computer using building information |
| US8635023B2 (en) * | 2011-11-22 | 2014-01-21 | Google Inc. | Position indication controls for device locations |
| US9014716B2 (en) * | 2012-04-10 | 2015-04-21 | Qualcomm Incorporated | Techniques for processing perceived routability constraints that may or may not affect movement of a mobile device within an indoor environment |
| US9215560B1 (en) * | 2012-07-12 | 2015-12-15 | two forty four a.m. LLC | System and method for device-centric location detection and geofencing |
| US9310462B2 (en) | 2012-09-07 | 2016-04-12 | Microsoft Technology Licensing, Llc | Locating a mobile computing device in an indoor environment |
| US9596670B2 (en) | 2013-01-16 | 2017-03-14 | Apple Inc. | Location assisted service capability monitoring |
| US9277368B2 (en) * | 2013-07-18 | 2016-03-01 | Qualcomm Incorporated | Method and apparatus for determining whether or not a mobile device is indoors |
| US9609539B2 (en) | 2013-11-08 | 2017-03-28 | Qualcomm Incorporated | Techniques and methods for controlling crowdsourcing from a mobile device |
| KR102205805B1 (ko) * | 2014-04-30 | 2021-01-21 | 삼성전자주식회사 | 이동 통신 시스템에서 네트워크 최적화 프로세스 자동 수행 장치 및 방법 |
| US9503858B2 (en) | 2014-08-28 | 2016-11-22 | Qualcomm Incorporated | Selective crowdsourcing of location-related data |
| US20160116274A1 (en) * | 2014-10-27 | 2016-04-28 | At&T Mobility Ii Llc | Mobility based location determination |
| US9983291B2 (en) | 2014-11-10 | 2018-05-29 | Qualcomm Incorporated | Methods, apparatuses, and devices for mobile device position estimation using virtual access points |
| US9918203B2 (en) | 2015-06-05 | 2018-03-13 | Apple Inc. | Correcting in-venue location estimation using structural information |
| US9906911B2 (en) | 2015-09-04 | 2018-02-27 | Telefonaktiebolaget L M Ericsson (Publ) | Systems and methods for UE positioning in a distributed antenna wireless system |
| US9706366B2 (en) | 2015-11-06 | 2017-07-11 | International Business Machines Corporation | WiFi-fingerprint based indoor localization map |
| US10374882B2 (en) * | 2016-03-16 | 2019-08-06 | Futurewei Technologies, Inc. | Systems and methods for identifying causes of quality degradation in wireless networks |
| US9843890B2 (en) | 2016-03-18 | 2017-12-12 | Qualcomm Incorporated | Reliability in mobile device positioning in a crowdsourcing system |
| US9998856B2 (en) | 2016-05-13 | 2018-06-12 | Qualcomm Incorporated | Method and/or system for positioning of a mobile device |
| US11004122B2 (en) | 2016-05-31 | 2021-05-11 | Digital Locations, Inc. | System and method for identifying wireless communication assets |
| US10038981B2 (en) | 2016-07-26 | 2018-07-31 | Qualcomm Incorporated | Synchronous scanning terrestrial networks for measurements for crowdsourcing and positioning |
| US20180070212A1 (en) | 2016-09-02 | 2018-03-08 | Athentek Innovations, Inc. | Systems and methods to track movement of a device in an indoor environment |
| US10129691B2 (en) | 2016-10-14 | 2018-11-13 | OneMarket Network LLC | Systems and methods to determine a location of a mobile device |
| US10136342B2 (en) | 2017-04-11 | 2018-11-20 | Cisco Technology, Inc. | System and method to facilitate wireless network optimization |
| US10542330B2 (en) * | 2017-05-31 | 2020-01-21 | Netscout Systems, Inc. | Automatic adaptive network planning |
| US10798626B2 (en) * | 2018-02-21 | 2020-10-06 | Cellwize Wireless Technologies Ltd. | Method of managing a cellular network and system thereof |
-
2019
- 2019-04-11 EP EP23192156.0A patent/EP4250795A3/fr active Pending
- 2019-04-11 CA CA3096351A patent/CA3096351A1/fr active Pending
- 2019-04-11 US US16/381,961 patent/US10567922B2/en active Active
- 2019-04-11 WO PCT/US2019/027040 patent/WO2019200139A1/fr not_active Ceased
- 2019-04-11 EP EP19784765.0A patent/EP3777253B1/fr active Active
-
2020
- 2020-02-14 US US16/790,914 patent/US11388551B2/en active Active
- 2020-02-17 US US16/792,652 patent/US11388552B2/en active Active
Patent Citations (1)
| Publication number | Priority date | Publication date | Assignee | Title |
|---|---|---|---|---|
| EP2717609A1 (fr) * | 2011-07-28 | 2014-04-09 | Huawei Technologies Co., Ltd | Procédé, dispositif et système de gestion d'optimisation de couverture |
Also Published As
| Publication number | Publication date |
|---|---|
| EP3777253A1 (fr) | 2021-02-17 |
| US10567922B2 (en) | 2020-02-18 |
| EP4250795A2 (fr) | 2023-09-27 |
| US20200186971A1 (en) | 2020-06-11 |
| EP4250795A3 (fr) | 2023-11-22 |
| US11388551B2 (en) | 2022-07-12 |
| US11388552B2 (en) | 2022-07-12 |
| EP3777253C0 (fr) | 2023-09-27 |
| CA3096351A1 (fr) | 2019-10-17 |
| US20200336862A1 (en) | 2020-10-22 |
| WO2019200139A1 (fr) | 2019-10-17 |
| EP3777253A4 (fr) | 2022-04-06 |
| US20190320292A1 (en) | 2019-10-17 |
Similar Documents
| Publication | Publication Date | Title |
|---|---|---|
| EP3777253B1 (fr) | Évaluation de service de réseau sans fil | |
| CN109996186B (zh) | 一种网络覆盖问题识别方法及装置、可读取存储介质 | |
| EP3137918B1 (fr) | Système de positionnement, procédé, dispositif mobile, et programme informatique | |
| EP2118810B1 (fr) | Système et procédé pour optimiser l'estimation de position d'une unité mobile | |
| US8526961B2 (en) | Method and apparatus for mapping operating parameter in coverage area of wireless network | |
| US9052378B2 (en) | Estimation of position using WLAN access point radio propagation characteristics in a WLAN positioning system | |
| EP3242144B1 (fr) | Amélioration d'une performance de positionnement | |
| CN107250829B (zh) | 用于检查无线电模型数据的健康状况的设备、系统和方法 | |
| US8552910B2 (en) | System and method of locating missing nodes in networks | |
| US20100137005A1 (en) | Method for positioning portable communication device | |
| US10200965B2 (en) | Analysis and monitoring of a positioning infrastructure | |
| CN116133037B (zh) | 一种无线网络评估方法及装置 | |
| GB2621425A (en) | Temporal Network analytics | |
| US12342192B2 (en) | Three-dimensional indoor wireless service assessment and visualization | |
| KR20140119333A (ko) | 위치 정확도 향상을 위한 위치 측위 방법 및 장치 | |
| CN113573236B (zh) | 定位结果的置信度的评估方法和装置 | |
| JP5484368B2 (ja) | 移動端末からの位置情報に基づく対象エリア表示方法及びシステム | |
| Yilmaz et al. | Sensor placement algorithm for radio environment map construction in cognitive radio networks | |
| US20240373246A1 (en) | Method of monitoring telecommunication network and system for implementing the same | |
| US20240214772A1 (en) | Systems and methods for assigning user device movement states | |
| JP6185804B2 (ja) | 判定装置、ネットワークノード、判定方法、及びプログラム | |
| JP2015064232A (ja) | 判定装置、ネットワークノード、判定方法、及びプログラム | |
| CN120282175A (zh) | 一种基站退网方法、装置及可读存储介质 | |
| CN121126245A (zh) | 无线异常事件地理化分析方法、装置、电子设备及介质 | |
| CN119012258A (zh) | 竞对小区和竞对站点坐标估计方法 |
Legal Events
| Date | Code | Title | Description |
|---|---|---|---|
| STAA | Information on the status of an ep patent application or granted ep patent |
Free format text: STATUS: THE INTERNATIONAL PUBLICATION HAS BEEN MADE |
|
| PUAI | Public reference made under article 153(3) epc to a published international application that has entered the european phase |
Free format text: ORIGINAL CODE: 0009012 |
|
| STAA | Information on the status of an ep patent application or granted ep patent |
Free format text: STATUS: REQUEST FOR EXAMINATION WAS MADE |
|
| 17P | Request for examination filed |
Effective date: 20201020 |
|
| AK | Designated contracting states |
Kind code of ref document: A1 Designated state(s): AL AT BE BG CH CY CZ DE DK EE ES FI FR GB GR HR HU IE IS IT LI LT LU LV MC MK MT NL NO PL PT RO RS SE SI SK SM TR |
|
| AX | Request for extension of the european patent |
Extension state: BA ME |
|
| DAV | Request for validation of the european patent (deleted) | ||
| DAX | Request for extension of the european patent (deleted) | ||
| REG | Reference to a national code |
Ref country code: HK Ref legal event code: DE Ref document number: 40047589 Country of ref document: HK |
|
| RIC1 | Information provided on ipc code assigned before grant |
Ipc: H04B 17/27 20150101ALI20211118BHEP Ipc: H04W 4/029 20180101AFI20211118BHEP |
|
| A4 | Supplementary search report drawn up and despatched |
Effective date: 20220304 |
|
| RIC1 | Information provided on ipc code assigned before grant |
Ipc: H04B 17/27 20150101ALI20220228BHEP Ipc: H04W 4/029 20180101AFI20220228BHEP |
|
| REG | Reference to a national code |
Ref country code: DE Ref legal event code: R079 Free format text: PREVIOUS MAIN CLASS: H04W0004020000 Ipc: H04W0016180000 Ref country code: DE Ref legal event code: R079 Ref document number: 602019038289 Country of ref document: DE Free format text: PREVIOUS MAIN CLASS: H04W0004020000 Ipc: H04W0016180000 |
|
| GRAP | Despatch of communication of intention to grant a patent |
Free format text: ORIGINAL CODE: EPIDOSNIGR1 |
|
| STAA | Information on the status of an ep patent application or granted ep patent |
Free format text: STATUS: GRANT OF PATENT IS INTENDED |
|
| RIC1 | Information provided on ipc code assigned before grant |
Ipc: H04W 16/20 20090101ALI20230324BHEP Ipc: H04W 4/029 20180101ALI20230324BHEP Ipc: H04W 24/02 20090101ALI20230324BHEP Ipc: H04W 16/18 20090101AFI20230324BHEP |
|
| INTG | Intention to grant announced |
Effective date: 20230412 |
|
| GRAS | Grant fee paid |
Free format text: ORIGINAL CODE: EPIDOSNIGR3 |
|
| GRAA | (expected) grant |
Free format text: ORIGINAL CODE: 0009210 |
|
| STAA | Information on the status of an ep patent application or granted ep patent |
Free format text: STATUS: THE PATENT HAS BEEN GRANTED |
|
| RAP3 | Party data changed (applicant data changed or rights of an application transferred) |
Owner name: OOKLA, LLC |
|
| AK | Designated contracting states |
Kind code of ref document: B1 Designated state(s): AL AT BE BG CH CY CZ DE DK EE ES FI FR GB GR HR HU IE IS IT LI LT LU LV MC MK MT NL NO PL PT RO RS SE SI SK SM TR |
|
| REG | Reference to a national code |
Ref country code: GB Ref legal event code: FG4D |
|
| REG | Reference to a national code |
Ref country code: CH Ref legal event code: EP |
|
| REG | Reference to a national code |
Ref country code: DE Ref legal event code: R096 Ref document number: 602019038289 Country of ref document: DE |
|
| REG | Reference to a national code |
Ref country code: IE Ref legal event code: FG4D |
|
| U01 | Request for unitary effect filed |
Effective date: 20231012 |
|
| U07 | Unitary effect registered |
Designated state(s): AT BE BG DE DK EE FI FR IT LT LU LV MT NL PT SE SI Effective date: 20231020 |
|
| PG25 | Lapsed in a contracting state [announced via postgrant information from national office to epo] |
Ref country code: GR Free format text: LAPSE BECAUSE OF FAILURE TO SUBMIT A TRANSLATION OF THE DESCRIPTION OR TO PAY THE FEE WITHIN THE PRESCRIBED TIME-LIMIT Effective date: 20231228 |
|
| PG25 | Lapsed in a contracting state [announced via postgrant information from national office to epo] |
Ref country code: RS Free format text: LAPSE BECAUSE OF FAILURE TO SUBMIT A TRANSLATION OF THE DESCRIPTION OR TO PAY THE FEE WITHIN THE PRESCRIBED TIME-LIMIT Effective date: 20230927 Ref country code: NO Free format text: LAPSE BECAUSE OF FAILURE TO SUBMIT A TRANSLATION OF THE DESCRIPTION OR TO PAY THE FEE WITHIN THE PRESCRIBED TIME-LIMIT Effective date: 20231227 Ref country code: HR Free format text: LAPSE BECAUSE OF FAILURE TO SUBMIT A TRANSLATION OF THE DESCRIPTION OR TO PAY THE FEE WITHIN THE PRESCRIBED TIME-LIMIT Effective date: 20230927 Ref country code: GR Free format text: LAPSE BECAUSE OF FAILURE TO SUBMIT A TRANSLATION OF THE DESCRIPTION OR TO PAY THE FEE WITHIN THE PRESCRIBED TIME-LIMIT Effective date: 20231228 |
|
| PG25 | Lapsed in a contracting state [announced via postgrant information from national office to epo] |
Ref country code: IS Free format text: LAPSE BECAUSE OF FAILURE TO SUBMIT A TRANSLATION OF THE DESCRIPTION OR TO PAY THE FEE WITHIN THE PRESCRIBED TIME-LIMIT Effective date: 20240127 |
|
| U20 | Renewal fee for the european patent with unitary effect paid |
Year of fee payment: 6 Effective date: 20240306 |
|
| PG25 | Lapsed in a contracting state [announced via postgrant information from national office to epo] |
Ref country code: ES Free format text: LAPSE BECAUSE OF FAILURE TO SUBMIT A TRANSLATION OF THE DESCRIPTION OR TO PAY THE FEE WITHIN THE PRESCRIBED TIME-LIMIT Effective date: 20230927 |
|
| PG25 | Lapsed in a contracting state [announced via postgrant information from national office to epo] |
Ref country code: SM Free format text: LAPSE BECAUSE OF FAILURE TO SUBMIT A TRANSLATION OF THE DESCRIPTION OR TO PAY THE FEE WITHIN THE PRESCRIBED TIME-LIMIT Effective date: 20230927 Ref country code: RO Free format text: LAPSE BECAUSE OF FAILURE TO SUBMIT A TRANSLATION OF THE DESCRIPTION OR TO PAY THE FEE WITHIN THE PRESCRIBED TIME-LIMIT Effective date: 20230927 Ref country code: IS Free format text: LAPSE BECAUSE OF FAILURE TO SUBMIT A TRANSLATION OF THE DESCRIPTION OR TO PAY THE FEE WITHIN THE PRESCRIBED TIME-LIMIT Effective date: 20240127 Ref country code: ES Free format text: LAPSE BECAUSE OF FAILURE TO SUBMIT A TRANSLATION OF THE DESCRIPTION OR TO PAY THE FEE WITHIN THE PRESCRIBED TIME-LIMIT Effective date: 20230927 Ref country code: CZ Free format text: LAPSE BECAUSE OF FAILURE TO SUBMIT A TRANSLATION OF THE DESCRIPTION OR TO PAY THE FEE WITHIN THE PRESCRIBED TIME-LIMIT Effective date: 20230927 Ref country code: SK Free format text: LAPSE BECAUSE OF FAILURE TO SUBMIT A TRANSLATION OF THE DESCRIPTION OR TO PAY THE FEE WITHIN THE PRESCRIBED TIME-LIMIT Effective date: 20230927 |
|
| PG25 | Lapsed in a contracting state [announced via postgrant information from national office to epo] |
Ref country code: PL Free format text: LAPSE BECAUSE OF FAILURE TO SUBMIT A TRANSLATION OF THE DESCRIPTION OR TO PAY THE FEE WITHIN THE PRESCRIBED TIME-LIMIT Effective date: 20230927 |
|
| REG | Reference to a national code |
Ref country code: DE Ref legal event code: R097 Ref document number: 602019038289 Country of ref document: DE |
|
| PLBE | No opposition filed within time limit |
Free format text: ORIGINAL CODE: 0009261 |
|
| STAA | Information on the status of an ep patent application or granted ep patent |
Free format text: STATUS: NO OPPOSITION FILED WITHIN TIME LIMIT |
|
| 26N | No opposition filed |
Effective date: 20240628 |
|
| PG25 | Lapsed in a contracting state [announced via postgrant information from national office to epo] |
Ref country code: MC Free format text: LAPSE BECAUSE OF FAILURE TO SUBMIT A TRANSLATION OF THE DESCRIPTION OR TO PAY THE FEE WITHIN THE PRESCRIBED TIME-LIMIT Effective date: 20230927 |
|
| PG25 | Lapsed in a contracting state [announced via postgrant information from national office to epo] |
Ref country code: MC Free format text: LAPSE BECAUSE OF FAILURE TO SUBMIT A TRANSLATION OF THE DESCRIPTION OR TO PAY THE FEE WITHIN THE PRESCRIBED TIME-LIMIT Effective date: 20230927 |
|
| REG | Reference to a national code |
Ref country code: CH Ref legal event code: PL |
|
| PG25 | Lapsed in a contracting state [announced via postgrant information from national office to epo] |
Ref country code: CH Free format text: LAPSE BECAUSE OF NON-PAYMENT OF DUE FEES Effective date: 20240430 |
|
| U20 | Renewal fee for the european patent with unitary effect paid |
Year of fee payment: 7 Effective date: 20250310 |
|
| PG25 | Lapsed in a contracting state [announced via postgrant information from national office to epo] |
Ref country code: IE Free format text: LAPSE BECAUSE OF NON-PAYMENT OF DUE FEES Effective date: 20240411 |
|
| PG25 | Lapsed in a contracting state [announced via postgrant information from national office to epo] |
Ref country code: CY Free format text: LAPSE BECAUSE OF FAILURE TO SUBMIT A TRANSLATION OF THE DESCRIPTION OR TO PAY THE FEE WITHIN THE PRESCRIBED TIME-LIMIT; INVALID AB INITIO Effective date: 20190411 |
|
| PG25 | Lapsed in a contracting state [announced via postgrant information from national office to epo] |
Ref country code: HU Free format text: LAPSE BECAUSE OF FAILURE TO SUBMIT A TRANSLATION OF THE DESCRIPTION OR TO PAY THE FEE WITHIN THE PRESCRIBED TIME-LIMIT; INVALID AB INITIO Effective date: 20190411 |
|
| PGFP | Annual fee paid to national office [announced via postgrant information from national office to epo] |
Ref country code: GB Payment date: 20260312 Year of fee payment: 8 |
|
| U20 | Renewal fee for the european patent with unitary effect paid |
Year of fee payment: 8 Effective date: 20260310 |