EP3785014B1 - Verfahren zur diagnose von krankheiten mittels mikrodurchflusszytometrie - Google Patents
Verfahren zur diagnose von krankheiten mittels mikrodurchflusszytometrie Download PDFInfo
- Publication number
- EP3785014B1 EP3785014B1 EP19792287.5A EP19792287A EP3785014B1 EP 3785014 B1 EP3785014 B1 EP 3785014B1 EP 19792287 A EP19792287 A EP 19792287A EP 3785014 B1 EP3785014 B1 EP 3785014B1
- Authority
- EP
- European Patent Office
- Prior art keywords
- biomarker
- particle
- particles
- algorithm
- data
- Prior art date
- Legal status (The legal status is an assumption and is not a legal conclusion. Google has not performed a legal analysis and makes no representation as to the accuracy of the status listed.)
- Active
Links
Images


Classifications
-
- G—PHYSICS
- G01—MEASURING; TESTING
- G01N—INVESTIGATING OR ANALYSING MATERIALS BY DETERMINING THEIR CHEMICAL OR PHYSICAL PROPERTIES
- G01N15/00—Investigating characteristics of particles; Investigating permeability, pore-volume or surface-area of porous materials
- G01N15/10—Investigating individual particles
- G01N15/14—Optical investigation techniques, e.g. flow cytometry
- G01N15/1429—Signal processing
- G01N15/1431—Signal processing the electronics being integrated with the analyser, e.g. hand-held devices for on-site investigation
-
- G—PHYSICS
- G01—MEASURING; TESTING
- G01N—INVESTIGATING OR ANALYSING MATERIALS BY DETERMINING THEIR CHEMICAL OR PHYSICAL PROPERTIES
- G01N15/00—Investigating characteristics of particles; Investigating permeability, pore-volume or surface-area of porous materials
- G01N15/10—Investigating individual particles
- G01N15/14—Optical investigation techniques, e.g. flow cytometry
- G01N15/1429—Signal processing
-
- G—PHYSICS
- G01—MEASURING; TESTING
- G01N—INVESTIGATING OR ANALYSING MATERIALS BY DETERMINING THEIR CHEMICAL OR PHYSICAL PROPERTIES
- G01N15/00—Investigating characteristics of particles; Investigating permeability, pore-volume or surface-area of porous materials
- G01N15/10—Investigating individual particles
- G01N15/14—Optical investigation techniques, e.g. flow cytometry
- G01N15/1456—Optical investigation techniques, e.g. flow cytometry without spatial resolution of the texture or inner structure of the particle, e.g. processing of pulse signals
- G01N15/1459—Optical investigation techniques, e.g. flow cytometry without spatial resolution of the texture or inner structure of the particle, e.g. processing of pulse signals the analysis being performed on a sample stream
-
- G—PHYSICS
- G01—MEASURING; TESTING
- G01N—INVESTIGATING OR ANALYSING MATERIALS BY DETERMINING THEIR CHEMICAL OR PHYSICAL PROPERTIES
- G01N21/00—Investigating or analysing materials by the use of optical means, i.e. using sub-millimetre waves, infrared, visible or ultraviolet light
- G01N21/62—Systems in which the material investigated is excited whereby it emits light or causes a change in wavelength of the incident light
- G01N21/63—Systems in which the material investigated is excited whereby it emits light or causes a change in wavelength of the incident light optically excited
- G01N21/64—Fluorescence; Phosphorescence
- G01N21/6428—Measuring fluorescence of fluorescent products of reactions or of fluorochrome labelled reactive substances, e.g. measuring quenching effects, using measuring "optrodes"
-
- G—PHYSICS
- G01—MEASURING; TESTING
- G01N—INVESTIGATING OR ANALYSING MATERIALS BY DETERMINING THEIR CHEMICAL OR PHYSICAL PROPERTIES
- G01N33/00—Investigating or analysing materials by specific methods not covered by groups G01N1/00 - G01N31/00
- G01N33/48—Biological material, e.g. blood, urine; Haemocytometers
- G01N33/50—Chemical analysis of biological material, e.g. blood, urine; Testing involving biospecific ligand binding methods; Immunological testing
- G01N33/53—Immunoassay; Biospecific binding assay; Materials therefor
- G01N33/575—Immunoassay; Biospecific binding assay; Materials therefor for cancer
- G01N33/57555—Immunoassay; Biospecific binding assay; Materials therefor for cancer of the prostate
-
- G—PHYSICS
- G06—COMPUTING OR CALCULATING; COUNTING
- G06N—COMPUTING ARRANGEMENTS BASED ON SPECIFIC COMPUTATIONAL MODELS
- G06N20/00—Machine learning
- G06N20/10—Machine learning using kernel methods, e.g. support vector machines [SVM]
-
- G—PHYSICS
- G06—COMPUTING OR CALCULATING; COUNTING
- G06N—COMPUTING ARRANGEMENTS BASED ON SPECIFIC COMPUTATIONAL MODELS
- G06N20/00—Machine learning
- G06N20/20—Ensemble learning
-
- G—PHYSICS
- G06—COMPUTING OR CALCULATING; COUNTING
- G06N—COMPUTING ARRANGEMENTS BASED ON SPECIFIC COMPUTATIONAL MODELS
- G06N3/00—Computing arrangements based on biological models
- G06N3/02—Neural networks
- G06N3/08—Learning methods
- G06N3/09—Supervised learning
-
- G—PHYSICS
- G06—COMPUTING OR CALCULATING; COUNTING
- G06N—COMPUTING ARRANGEMENTS BASED ON SPECIFIC COMPUTATIONAL MODELS
- G06N3/00—Computing arrangements based on biological models
- G06N3/02—Neural networks
- G06N3/08—Learning methods
- G06N3/0985—Hyperparameter optimisation; Meta-learning; Learning-to-learn
-
- G—PHYSICS
- G06—COMPUTING OR CALCULATING; COUNTING
- G06N—COMPUTING ARRANGEMENTS BASED ON SPECIFIC COMPUTATIONAL MODELS
- G06N5/00—Computing arrangements using knowledge-based models
- G06N5/01—Dynamic search techniques; Heuristics; Dynamic trees; Branch-and-bound
-
- G—PHYSICS
- G01—MEASURING; TESTING
- G01N—INVESTIGATING OR ANALYSING MATERIALS BY DETERMINING THEIR CHEMICAL OR PHYSICAL PROPERTIES
- G01N15/00—Investigating characteristics of particles; Investigating permeability, pore-volume or surface-area of porous materials
- G01N2015/0038—Investigating nanoparticles
-
- G—PHYSICS
- G01—MEASURING; TESTING
- G01N—INVESTIGATING OR ANALYSING MATERIALS BY DETERMINING THEIR CHEMICAL OR PHYSICAL PROPERTIES
- G01N15/00—Investigating characteristics of particles; Investigating permeability, pore-volume or surface-area of porous materials
- G01N15/10—Investigating individual particles
- G01N2015/1006—Investigating individual particles for cytology
-
- G—PHYSICS
- G01—MEASURING; TESTING
- G01N—INVESTIGATING OR ANALYSING MATERIALS BY DETERMINING THEIR CHEMICAL OR PHYSICAL PROPERTIES
- G01N15/00—Investigating characteristics of particles; Investigating permeability, pore-volume or surface-area of porous materials
- G01N15/10—Investigating individual particles
- G01N15/14—Optical investigation techniques, e.g. flow cytometry
- G01N2015/1402—Data analysis by thresholding or gating operations performed on the acquired signals or stored data
-
- G—PHYSICS
- G01—MEASURING; TESTING
- G01N—INVESTIGATING OR ANALYSING MATERIALS BY DETERMINING THEIR CHEMICAL OR PHYSICAL PROPERTIES
- G01N15/00—Investigating characteristics of particles; Investigating permeability, pore-volume or surface-area of porous materials
- G01N15/10—Investigating individual particles
- G01N15/14—Optical investigation techniques, e.g. flow cytometry
- G01N2015/1488—Methods for deciding
-
- G—PHYSICS
- G01—MEASURING; TESTING
- G01N—INVESTIGATING OR ANALYSING MATERIALS BY DETERMINING THEIR CHEMICAL OR PHYSICAL PROPERTIES
- G01N21/00—Investigating or analysing materials by the use of optical means, i.e. using sub-millimetre waves, infrared, visible or ultraviolet light
- G01N21/62—Systems in which the material investigated is excited whereby it emits light or causes a change in wavelength of the incident light
- G01N21/63—Systems in which the material investigated is excited whereby it emits light or causes a change in wavelength of the incident light optically excited
- G01N21/64—Fluorescence; Phosphorescence
- G01N21/6428—Measuring fluorescence of fluorescent products of reactions or of fluorochrome labelled reactive substances, e.g. measuring quenching effects, using measuring "optrodes"
- G01N2021/6439—Measuring fluorescence of fluorescent products of reactions or of fluorochrome labelled reactive substances, e.g. measuring quenching effects, using measuring "optrodes" with indicators, stains, dyes, tags, labels, marks
-
- G—PHYSICS
- G06—COMPUTING OR CALCULATING; COUNTING
- G06N—COMPUTING ARRANGEMENTS BASED ON SPECIFIC COMPUTATIONAL MODELS
- G06N3/00—Computing arrangements based on biological models
- G06N3/02—Neural networks
- G06N3/04—Architecture, e.g. interconnection topology
- G06N3/045—Combinations of networks
-
- G—PHYSICS
- G06—COMPUTING OR CALCULATING; COUNTING
- G06N—COMPUTING ARRANGEMENTS BASED ON SPECIFIC COMPUTATIONAL MODELS
- G06N3/00—Computing arrangements based on biological models
- G06N3/12—Computing arrangements based on biological models using genetic models
- G06N3/126—Evolutionary algorithms, e.g. genetic algorithms or genetic programming
-
- G—PHYSICS
- G06—COMPUTING OR CALCULATING; COUNTING
- G06N—COMPUTING ARRANGEMENTS BASED ON SPECIFIC COMPUTATIONAL MODELS
- G06N7/00—Computing arrangements based on specific mathematical models
- G06N7/01—Probabilistic graphical models, e.g. probabilistic networks
Definitions
- the present invention relates to diagnostic methods and biomarkers tested therein. More specifically, the present invention relates to the use of extracellular vesicles for clinically significant prostate cancer diagnosis and biomarkers for predicting the same.
- Extracellular vesicles hold great potential for diagnostics and prognostics in a variety of fields such as immunology, neurology, cardiology, and oncology.
- EVs include exosomes (30-100 nm), microvesicles (50-2,000 nm), apoptotic bodies (500-4,000 nm), and very large oncosomes (1,000-10,000nm). Healthy and diseased cells continuously release EVs which contain many of the mRNA, miRNA, and protein markers from their cells of origin. EVs have been found in nearly all biological fluids including blood, urine, semen, and cerebrospinal fluid, making them promising targets for minimally-invasive diagnostic assays.
- Electron microscopy provides the highest resolution images of EVs but lacks high-throughput data acquisition, cannot easily measure many markers simultaneously, and may require time consuming and complicated data analysis since the raw data are images ( Harris JR, Arch Biochem Biophys 581: 3-18, 2015 ).
- Nanoparticle tracking analysis and tunable resistive pulse sensing allow rapid enumeration and sizing of particles but are not ideal for characterizing EV markers ( Gardiner C et al., J Extracell Vesicles 2, 2013 ; Vogel R et al., Anal Chem 83(9): 3499-35-6, 2011 ).
- Microflow cytometry also referred to as nanoscale or high sensitivity flow cytometry allows high-throughput characterization of the optical properties of particles, allowing quantification of particle size, concentration, and marker abundance for millions of EVs in minutes (Szatenek supra). These desirable characteristics make ⁇ FCM well-suited for highsensitivity EV-based clinical assays.
- ⁇ FCM generates large amounts of data which complicates analysis.
- a typical 10 ⁇ L plasma sample that has been diluted 100-fold can generate over 5,000,000 events each in a single minute of analysis with over a dozen optical properties. In other words, a single ⁇ L of plasma can have >109 events.
- Other liquid biopsy types can have similar concentrations.
- the analysis of EVs by ⁇ FCM can examine at least 500 -50,000 fold more sample events compared to Nanoparticle (NTA) or electron microscopy per sample analysis, providing a greater representative analysis of the whole sample.
- NTA Nanoparticle
- Traditional cell-based flow cytometry analysis typically involves generating bivariate scatter plots and quantifying event concentration within user-defined regions of interest (ROIs) over 4 quadrants since many cells have similar size and are characterized as marker positive or negative.
- ROIs regions of interest
- EVs When generating an EV-based diagnostic/prognostic assay, EVs must not only be characterized within biological samples but also analyzed for their ability to predict clinically meaningful conditions which can improve patient well-being and/or healthcare economics.
- D.PINK, R.PAPROSKI (O523.03, LBO.14, OT.7.05): "Abstract Book: ISEV2017",JOURNAL OF EXTRACELLULAR VESICLES., vol. 6, no. sup1, 15 May 2017 (2017-05-15), pages 41-41, XP055588374,DOI: 10.1080/20013078.2017.1310414 , also discloses a prior art method of diagnosing a disease signature for a disease in a patient.
- Described herein are embodiments illustrative of biomarkers for diagnosing disease, including clinically significant prostate cancer; methods of diagnosing disease, including clinically significant prostate cancer; and methods of developing disease prediction models and diagnostic tests using the same. It will be appreciated that the embodiments and examples described herein are for illustrative purposes intended for those skilled in the art and are not meant to be limiting in any way. All references to embodiments or examples throughout the disclosure should be considered a reference to an illustrative and non-limiting embodiment or an illustrative and non-limiting example.
- a method of diagnosing disease, such as clinically significant prostate cancer, in a patient is provided.
- clinically significant prostate cancer means a prostate cancer with a Gleason Group 3 or higher.
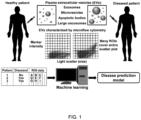
- the method involves the steps of: incubating a sample from the patient with one or more probes and/or antibodies which bind one or more biomarkers for the disease of interest; subjecting the sample to microflow cytometry; obtaining signal intensities for the one or more biomarkers and, optionally, obtaining one or more optical properties associated with the sample; processing the signal intensities and, if obtained, the one or more optical properties using custom algorithms to determine the concentration of different particle phenotypes in the patient sample; and diagnosing the patient with the disease based on the output of a machine learning algorithm using particle phenotype concentration data from patient samples as inputs for machine learning.
- the disease may be cancer, in particular clinically significant prostate cancer, and the biomarkers correlating to cancer biomarkers, in particular clinically significant prostate cancer biomarkers.
- a method of identifying a disease signature involves the steps of: incubating samples from a healthy subjects and samples from subjects with a known disease with one or more probes which bind to one or more biomarkers for a disease; subjecting the samples to microflow cytometry; obtaining signal intensities for the one or more biomarkers and, optionally, obtaining one or more optical properties associated with each sample; log transforming the signal intensities from the one or more biomarkers and, if present, the one or more optical properties to produce transformed signal intensities; binning particles with similar transformed signal intensities in regions of interest (ROI); determining the concentration of particles in each ROI (which is calculated by dividing the total particle counts in each ROI by the sample volume analyzed during data acquisition), comparing the particle concentration data in each ROI between the samples from healthy subjects and samples from the subjects with a known disease; determining receiver operator characteristic (ROC) area under the curve (AUC) values for each ROI from each combination of markers; and selecting a combination of biomarkers that provides the highest AUC values to obtain
- Samples that are useful in the present invention include, but are not limited to, biological samples, such as blood (or components thereof), semen, milk, etc.
- extracellular vesicles do not need to be isolated and purified, as is required in other methods. Instead, serum or plasma can be isolated from blood as per standard clinical diagnostic procedures and used, without further purification and processing, in the methods described herein.
- Probes can include, but are not limited to, whole antibodies or antibody components such as F(ab), F(ab') 2 or F(ab') fragments, minibodies, etc. against specific antigens, or peptides against specific targets. Probes can also include various dyes that permit identification of particular components in the sample. For example, incubation with lipophilic dyes which stain membrane bound small particles can aid in the segregation of protein aggregates from lipid bound particles in a sample. Typically probes will have a directly conjugated secondary component, such as a fluorescent conjugate, that aids in the detection of the probe bound target.
- a directly conjugated secondary component such as a fluorescent conjugate
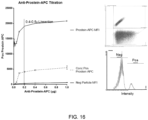
- the sample can be incubated with the PSMA specific monoclonal antibody J591 (available through BZL Biologics, LLC) which has been directly conjugated with a dye such as DyLight 405.
- a non-conjugated probe e.g. PSMA specific monoclonal antibody J591
- a secondary agent to identify the primary probe used in the assay. For example, incubation with the Qdot565-conjugated donkey anti-mouse IgG antibody, which then permits detection in the ⁇ FCM assay.
- the biomarker probes will be specific to a biological molecule that is only or primarily expressed in cells or tissues affected by the disease of interest.
- the biomarkers can be specific for a particular cell type.
- more than one biomarker can be used to identify more than one feature of the disease of interest and/or cell type.
- Incubation of samples with biomarker probes may be done as a single sample + single probe format, or as a single sample + multiple probe formats.
- the format of the incubation may provide different answers as each biomarker probe may provide different information on EV populations in a sample.
- a probe may indicate lipid bound versus non-lipid bound events, or an epithelial versus non-epithelial particle origin.
- a probe may indicate disease presence, disease presence and aggressiveness.
- Multiple probes in an incubation can have similar indications of particle origin, disease presence, and disease aggressiveness. Thus the combination of probes may have significant implications for detection of a disease phenotype.
- Particle size and enumeration can be estimated by light scatter.
- the light scatter characteristics combined with the fluorescence intensity described above can provide a unique phenotype for each particle.
- These particle phenotypes can be used singular or combined with multiple biomarkers can provided a unique disease signature for the disease of interest.
- the samples are then subjected to ⁇ FCM, using a commercially available machine, such as, but not limited to, the Apogee A50 microflow cytometer or the CytoFLEX or DxFlex Flow Cytometer.
- Raw data obtained from the ⁇ FCM analysis can be extracted using algorithms, written in MATLAB, R, or Python, and organized as individual particles as rows and light scatter and fluorescence intensities as columns. The time each particle was recorded can be represented in a separate column.
- the minimum and maximum cut-offs for light scatter/fluorescence intensity for each particle phenotype can be determined through optimization experiments, which involve using a range of different cut-offs for a range of different light scatter/fluorescence intensities and identifying the cut-offs that provide the highest receiver operator characteristic under the curve from previously acquired patient data.
- the number of particles in each particle phenotype can be determined using custom processing scripts which groups particles with similar light scatter and marker intensity. Particle phenotype concentrations are calculated based on particle phenotype counts, the length of time the sample was run, the sample flow rate of the ⁇ FCM, and the dilution factor of the sample. If the patient has more than one FCM data file (i.e. multiple replicates), particle phenotype concentrations can be averaged across all replicate ⁇ FCM date files.
- a Dynamic Fluorescence Thresholding algorithm it is also possible to calculate particle phenotype concentrations in samples using a Dynamic Fluorescence Thresholding algorithm by identifying the biomarker positivity status for each particle in each patient.
- a kernel density estimation (KDE) function is applied to the histogram plots of a single probe signal from a single patient sample.
- the fluorescence value F1 is identified as the region on the X-axis (fluorescence intensity) of the histogram plot that intersects with the highest region on the Y-axis (particle density) on the KDE plot for the biomarker negative particle population, which is the largest peak near the left side of the KDE plot.
- F2 fluorescence intensity value that separates biomarker positive and negative particles
- F3 F3 is a small arbitrary fluorescence intensity value that is added to help ensure biomarker negative particles are not classified as biomarker positive particles. Particles with fluorescence intensities above or below Fs are positive or negative for the biomarker, respectively.
- a data set for machine learning is constructed.
- a table can be created with particle phenotype concentrations for all patients. In one iteration, rows can represent patients and columns represent particle phenotype concentration. However, it will be clear to a person skilled in the art that the data can be represented in an opposite manner or in some other tabular form.
- Clinically relevant data can be added as additional columns, or rows depending on how the data set is created, to the table. This data can be used as additional features for machine learning (e.g., does PSA with the ⁇ FCM data provide better predictions of who has clinically significant prostate cancer?) or it may be used as labels that the machine learning algorithms need to predict (e.g., identification of which patients have clinically significant prostate cancer).
- an optimized machine learning model capable of predicting clinical status from ⁇ FCM with or without clinical data.
- Software used for machine learning can include, but is not limited to, R, MATLAB, KNIME, and python.
- Machine learning models can include single decision tree, support vector machines, k-nearest neighbor, linear regression, logistic regression, discriminant analysis, random forest, neural networks, and XGBoost.
- the algorithm providing the highest ROC AUC for predicting a clinical condition can be further optimized. All machine learning algorithms are analyzed using 5-fold cross-validation which involves splitting the data into 5 separate groups.
- a model can be created using 4 of the 5 groups and model accuracy can be determined against the held-out group. The groups are shuffled and the process is repeated 4 more times so that every patient is used once in the held-out group. This ensures model accuracy is determined on data that was not used to create the model.
- Machine learning algorithm optimization includes identifying which ⁇ FCM / clinical features should be kept / removed before model creation using recursive-feature elimination. This algorithm identifies the most important features from a model using all data (e.g., XGBoost feature importance using the xgb.importance function in R). Multiple data sets are created which include the top 10, 20, 30, 40, 50, 60, 70, 80, 90, or 100% most important features and the data set which provides the highest ROC AUC using 5-fold cross-validation contains the features which will be kept for the final machine learning model. Other feature selection algorithms including genetic algorithms and simulated annealing can also be used at this step.
- the tunable parameters of the machine learning algorithm can be optimized through grid searching. This involves providing multiple values for each tunable algorithm parameter (e.g., XGBoost parameters such as "nrounds”: 100, 200, and 300 as well as “max_depth”: 3, 4, and 5) and testing every combination of possible parameter values.
- XGBoost parameters such as "nrounds”: 100, 200, and 300 as well as "max_depth”: 3, 4, and 5
- the set of parameter values providing the highest ROC AUC using 5-fold cross-validation is used for the final machine learning model.
- the final machine learning model optimization involves ensembling many (typically 2:100) models together by averaging the predictions from all models. All models will use the optimized features and parameters described above, but each model will use a slightly different cohort of patients (e.g., randomly selected 80% of patients) for model creation. This causes each model to be unique and the average of all models' predictions will provide a more accurate and stable prediction of clinical status then using a single model with the full data set.
- the final optimized ensembled model is saved on a computer for future use.
- the final machine learning model can be used to predict clinical status of new patients.
- New patient data which includes particle phenotype concentrations with or without clinical data can be used as input for the final machine learning model to predict the probability that a patient has a specific clinical condition.
- the goal was to separate the ⁇ FCM data into many different ROIs, where each ROI represents the concentration of different EVs, and use machine learning on the ROI data to predict clinical conditions ( Fig. 1 ). Before creating such models, it was important to first identify which clinical conditions the ⁇ FCM data can best predict. Automated analysis scripts were used to create AUC maps of the ⁇ FCM data for predicting 10 different clinical conditions which were relevant to the PSMA and ghrelin probes.
- grade group 3 PCa patients receiving radical prostatectomy had a 10 year recurrence-free progression of under 0.5, which was significantly lower than >0.75 for those patients with grade group 2 PCa (28). This suggests that most men with grade group 3 PCa have metastatic disease at diagnosis since surgical removal of the primary tumor does not cure the patients of PCa. Without being limited by theory, the greater abundance of larger PSMA-positive particles in higher grade PCa patients may be partly due to circulating metastatic cells since larger EVs (>300 nm) from localized tumor cells would have difficulty intravasating into blood vessels.
- AUC maps were created for predicting diabetes.
- a range of different sized ghrelin-positive particles displayed AUCs near 0.7, suggesting that diabetic men have EVs with elevated levels of ghrelin receptors ( Fig. 2c ).
- the ⁇ FCM data was used to predict clinically significant PCa which were defined as grade group 3+ since these patients demonstrate significantly worse outcome than grade group 2 and lower PCa patients.
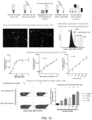
- ⁇ FCM data was analyzed by manual gating to provide a benchmark of conventional analysis. Creating manual gates around specific particle populations is a non-trivial task since different particle populations exist on different patient scatter plots with some slight shifts in population locations ( Fig. 3a, b, c ). For simplicity, gates were created that grouped all marker-positive particles. When compared to non-clinically significant PCa, only the concentration of ghrelin-positive particles was significantly higher in clinically significant PCa by 2.1-fold (p ⁇ 0.05, Fig. 3d ). The AUCs of PSMA-, ghrelin-, and PSMA/ghrelin-positive particle concentrations for predicting clinically significant PCa were all below 0.6 ( Fig. 3e ). These low AUCs may be explained by the AUC maps which show the gates encompassing particles with AUCs above and below 0.5 ( Fig. 3a, b, c ).
- XGBoost variable gain map which displays the most important ROIs for XGBoost model accuracy, illustrated that many different particle populations are important for the XGBoost model (Fig. 10a).
- the ROIs with relatively high variable gain mostly overlapped with regions on the AUC map that were well above and below 0.5, suggesting that particle populations which had higher and lower concentrations in clinically significant PCa patients were important for the model (Fig. 10b).
- Table 2 Patient characteristics by PCa grade group Patient characteristics by PCa grade group Grade group ⁇ 2 Grade group ⁇ 3 p -value ROC AUC mean (CI) Cutoff (>) Sensitivity % (CI) Specificity % (CI) PPV % (CI) NPV % (CI) Patients, n 188 27 Race, n (% black) 3 (1.6 ⁇ 1 (3.7) 0.42 0.51 (0.39-0.63) - 3.7 (0.094-19) 98 (95-100) 25 (0.63-81) 88 (82-92) Family history of PCa, n (%) 53 (29) 6 (22) 0.65 0.53 (0.42-0.65) - 22 (8.6-42 ⁇ 71 (64-78) 10 (3.8-21) 86 (80-91) Previous negative biopsy, n (%) 20 (11) 1 (3.7) 0.49 0.54 (0.42-0.65) - 3.7 (0.094-19) 89 (84-93) 4.8 (0.12-24) 86 (81-91) DRE, n (% abnormal) 48 (26)
- DRE digital rectal exam
- SOC standard of care
- CI 95% confidence interval
- ROC AUC receiver operator characteristic area under the curve
- PPV positive predictive value
- NPV negative predictive value
- men with enlarged prostates were significantly less likely to have PCa, meaning that compared to men with normal sized prostates, a greater percentage of men with enlarged prostates underwent unnecessary biopsies.
- the fraction of patients with abnormal DRE was similar between men with normal and enlarged prostates ( Fig. 6c ) while PSA levels were significantly higher in men with enlarged prostates (p ⁇ 0.05, Fig. 6d ), suggesting that elevated PSA was responsible for the increased number of unnecessary biopsies.
- PSA density PSA divided by prostate volume
- PSA density PSA divided by prostate volume
- SOC + ⁇ FCM probability scores for clinically significant PCa were significantly different between non-clinically significant and clinically significant PCa patients (p ⁇ 0.0005, Fig. 6f ), and using the previously define probability cutoff threshold in Table 2, 100% and 49% of patients with clinically significant and non-clinically significant PCa would be recommended for biopsy, respectively, eliminating approximately half of unnecessary biopsies while still maintain 100% sensitivity for detecting clinically significant PCa ( Fig. 6g ).
- Pre-biopsy plasma samples were acquired from the Alberta Prostate Cancer Research Initiative (APCaRI) biorepository.
- the inclusion criteria were adult men without prior prostate cancer diagnosis who were: (1) referred to urology clinics in Alberta for prostate concerns and were being scheduled for a prostate biopsy; and (2) undergoing transurethral prostate surgery for diagnosis or treatment of prostate abnormalities. All patients provided written informed consent, and the study was approved by the scientific ethics committees at the Prostate Cancer Centre (Calgary, Alberta, Canada) and the Northern Alberta Urology Centre (Edmonton, Alberta, Canada). Patients were enrolled between June 2014 and September 2015. Transrectal ultrasound guided prostate biopsies were performed with a median of 12 cores per patient and evaluated according to each hospital's SOPs. Test results were not provided to the clinical sites for patient care.
- Plasma preparation samples underwent a 2 step centrifugation process. First a standard 1300 xg for 10 minutes to provide separation of plasma from other blood components followed by a second 1300 xg x 10 minutes centrifugation to pellet platelets. Blood collected in serum tubes is first allowed to clot for 15-30 minutes and then a single 1300 xg x 10 minutes centrifugation step is performed.
- Frozen plasma samples were thawed, centrifuged at 16,000 x g for 30 minutes to remove large debris and platelet particles, and incubated with 400 ⁇ g/mL J591 antibody and 1/50 final dilution of secondary Qdot565-conjugated donkey anti-mouse IgG antibody. Samples were also incubated with 0.025 mM Ghrelin Cy5 probe containing the first 18 amino acids of ghrelin. Thirty minutes after probe incubation, samples were diluted 100-fold in double filtered (0.22 ⁇ m) phosphate buffered saline and analyzed with the Apogee A50 microflow cytometer using a flow rate of 3.01 ⁇ L/minute.
- the ⁇ FCM data was used to predict binary clinical features (e.g., patients with or without diabetes, normal or abnormal digital rectal exam) and correlate with ordinal or interval clinical features (e.g., tumor stage or PSA, respectively) using a custom MATLAB script.
- an excel instruction file was created which described how the ⁇ FCM data should be analyzed for each clinical feature.
- each clinical feature was a separate column and each row contained specific information or instructions. Specific information included the location of the clinical feature within the database, the type of data for each clinical feature (binary or ordinal/interval), and the value which represents missing data for that clinical feature. Instructions primarily involved how the clinical feature should be transformed which included thresholding values when binarizing features, deriving the PCa grade groups from Gleason scores, and determining age from dates of birth. Patients missing data for the clinical feature were removed from analysis for that clinical feature.
- ⁇ FCM particle concentration data for each ROI was used to predict or correlate with clinical features.
- ROC receiver operator characteristic
- AUC area under the curve
- Pearson correlation coefficients were determined for each ROI and correlation maps were generated for each bivariate data set. The highest 10% of AUC values in each AUC map were averaged and these values were compared across clinical features.
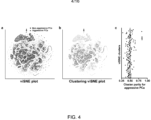
- viSNE plots were created using Cyt version 2.0 software run on MATLAB (25). Each patient's triplicate fcs files were concatenated into one fcs file. Two new fcs files were created: one using events from patients with grade group 2 and lower PCa (non-clinically significant PCa), and the other using events from patients with grade group 3 and higher PCa (clinically significant PCa). These two fcs files had a total of approximately 100,000 events with an equal number of events from each patient within their group.
- the percent neighbor variable was set to 2% and a Gaussian kernel was used.
- Cluster centers were selected using delta values between 1.5 and 5 as well as rho values between 200 and 1900.
- 248 clusters were created over the 60,000 events.
- Cluster purity for clinically significant PCa was defined as the number of clinically significant PCa events divided by the total number events within each cluster. Only clusters with at least 60 particles (0.1% of total particles) were analyzed.
- MATLAB's classification learner app was used to test 23 different machine learning algorithms to predict clinically significant PCa using particle concentration ⁇ FCM data. These algorithms included individual/bagged/boosted decision trees, linear/quadratic/cubic/Gaussian support vector machines, logistic regression, linear/quadratic/subspace discriminant analysis, and k-nearest neighbors.
- XGBoost was also tested using the 'xgboost' package in R (version 3.3.3). All machine learning algorithms used default settings and 5-fold cross-validation repeated at least 10 times with patient randomization between repeats.
- the assay has single cancer cell detection with higher theoretical SNR than conventional flow cytometry.
- Ultrasound ⁇ 15 Mpa pressure generates maximal EVs.
- XGBoost models were created to predict patients with aggressive prostate cancer (Gleason 4+3 and higher). Models were used on the same data with modified fluorescence (x 0.125 - 256) and AUCs were calculated.
- the non-linear light scattering calibration algorithm can help correct light scatter variability in samples. Processing data with dynamic fluorescence thresholds helps ensure model reliability on shifted data. These standardization algorithms will improve clinical assay predictions when used in many clinics over time.
Landscapes
- Engineering & Computer Science (AREA)
- Physics & Mathematics (AREA)
- Theoretical Computer Science (AREA)
- Health & Medical Sciences (AREA)
- General Physics & Mathematics (AREA)
- Software Systems (AREA)
- Chemical & Material Sciences (AREA)
- Life Sciences & Earth Sciences (AREA)
- Immunology (AREA)
- Computing Systems (AREA)
- Mathematical Physics (AREA)
- Data Mining & Analysis (AREA)
- Evolutionary Computation (AREA)
- General Engineering & Computer Science (AREA)
- Artificial Intelligence (AREA)
- General Health & Medical Sciences (AREA)
- Analytical Chemistry (AREA)
- Pathology (AREA)
- Biochemistry (AREA)
- Medical Informatics (AREA)
- Computer Vision & Pattern Recognition (AREA)
- Molecular Biology (AREA)
- Biomedical Technology (AREA)
- Dispersion Chemistry (AREA)
- Computational Linguistics (AREA)
- Signal Processing (AREA)
- Biophysics (AREA)
- Urology & Nephrology (AREA)
- Hematology (AREA)
- Microelectronics & Electronic Packaging (AREA)
- Chemical Kinetics & Catalysis (AREA)
- Nuclear Medicine, Radiotherapy & Molecular Imaging (AREA)
- Optics & Photonics (AREA)
- Medicinal Chemistry (AREA)
- Biotechnology (AREA)
- Microbiology (AREA)
- Cell Biology (AREA)
- Food Science & Technology (AREA)
- Investigating Or Analysing Biological Materials (AREA)
- Measuring Or Testing Involving Enzymes Or Micro-Organisms (AREA)
Claims (10)
- Verfahren zur Diagnose einer Krankheitssignatur für eine Krankheit bei einem Patienten, wobei das Verfahren die folgenden Schritte umfasst:Inkubieren einer Probe, die extrazelluläre Vesikel (EVs) des Patienten umfasst, mit einer oder mehreren Sonden, die Biomarker für die Krankheit von Interesse binden, die an die EVs gebunden sind;Aussetzen der Probe einer Mikrodurchflusszytometrie, um die EVs zu identifizieren;Erhalten von Signalintensitäten für den einen oder die mehreren Biomarker und Erhalten von einer oder mehreren optischen Eigenschaften, die mit der Probe assoziiert sind;Verarbeiten der Signalintensitäten und, falls erhalten, der einen oder mehreren optischen Eigenschaften, um Konzentrationen von verschiedenen Partikelphänotypen in der Probe zu berechnen; wobei das Verarbeiten ein logarithmisches Transformieren der Signalintensitäten umfasst, um transformierte Signalintensitäten zu produzieren; sowie Binning von Partikeln mit ähnlichen transformierten Signalintensitäten in Regionen von Interesse (ROI) für jede optische Eigenschaft, wobei jede ROI als ein anderer Partikelphänotyp angesehen wird; undBerechnen von Partikelphänotypkonzentrationen in Proben mittels eines dynamischen Fluoreszenzschwellenwertalgorithmus durch Identifizieren des Biomarkerpositivitätsstatus für jedes Partikel in jedem Patienten;Verwenden dieser Konzentrationen der Partikelphänotypen als Eingaben für Maschinenlernalgorithmen, um die Wahrscheinlichkeit zu bestimmen, dass Patienten klinisch signifikanten Prostatakrebs aufweisen.
- Verfahren nach Anspruch 1, wobei die Schritte des logarithmischen Transformierens und des Binnings gleichzeitig oder getrennt erfolgen.
- Verfahren nach Anspruch 2, wobei das Binning der Partikel ein Binning mittels einer festgelegten Anzahl an Bins pro optischer Eigenschaft umfasst.
- Verfahren nach einem der Ansprüche 1-3, wobei das Verfahren eine Vielzahl von ROIs umfasst.
- Verfahren nach Anspruch 1, wobei der dynamische Fluoreszenzschwellenwertalgorithmus den Biomarkerpositivitätsstatus für jedes Partikel in jedem Patienten durch Folgendes identifiziert:Anpassen einer Kerndichteschätzungs(KDE-)Funktion an die Partikelsignaldaten für alle Partikel jedes Biomarkers;Identifizieren des Fluoreszenzwertes F1, der die höchste Region auf der Y-Achse (Partikeldichte) auf dem KDE-Diagramm für die Biomarkernegativpartikelpopulation schneidet;Berechnen von Steigungen auf der KDE-Kurve für viele verschiedene höhere Fluoreszenzsignalintensitäten von F1, um einen zweiten Fluoreszenzwert F2 zu identifizieren, der dort liegt, wo die Steigung meist negativ ist,Berechnen des Fluoreszenzintensitätswertes, der Biomarkerpositivpartikel und Biomarkernegativpartikel (Fs) trennt, der gleich F1 + (2 * (F2 - F1)) + F3 ist, wobei F3 ein kleiner willkürlicher Fluoreszenzintensitätswert ist, der hinzugefügt wird, um sicherzustellen, dass Biomarkernegativpartikel nicht als Biomarkerpositivpartikel klassifiziert werden;Bestimmen des Biomarkerpositivitätsstatus von allen Partikeln basierend darauf, ob die Partikel ein Biomarkersignal über (Biomarkerpositiv) oder unter (Biomarkernegativ) Fs aufweisen;Binning von Partikeln in verschiedene geschätzte Größengruppen basierend auf ihren Lichtstreuungsintensitäten; undBestimmen von Partikelphänotypen durch alle möglichen Kombinationen von Biomarkerpositivitäts- und Lichtstreuungsgruppen.
- Verfahren nach einem der Ansprüche 1 bis 5, wobei der Maschinenlernalgorithmus ein individueller/verpackter/geboosterter Entscheidungsbaumalgorithmus, linearer/quadratischer/kubischer/Gaußscher Supportvektor-Maschinenalgorithmus, logistische Regression, lineare/quadratische/Subraum-Diskriminanzanalyse oder k-nächster-Nachbar-Algorithmus ist, bevorzugt wobei der Maschinenlernalgorithmus ein geboosterter Entscheidungsbaumalgorithmus ist, mehr bevorzugt wobei der Maschinenlernalgorithmus ein XGBoost-Algorithmus ist.
- Verfahren nach Anspruch 6, wobei der extreme gradientengeboosterte Entscheidungsbaumalgorithmus ein Ensemble von zumindest 100 Modellen mit gemittelten Ausgangswahrscheinlichkeiten umfasst.
- Verfahren nach Anspruch 1, wobei der eine oder die mehreren Biomarker ausgewählt sind aus der Gruppe bestehend aus SLC45A3, FOLH1, GHSR, JAG1, CDH11, SELE, MERTK, GABRA2, TNFRSF10B, ABCC5, LETMD1, CADM1, EMP2, ENTPD2, ABCB11, IL17RA, RNF122, ST14, SYPL1, LDLRAD3, HTR1F, EMP1, TRPV6, KCNN2, CLCN6, SLC17A3, SLC44A4, SLC22A23, C9orf91, RDH10, PNKD und TMEM229.
- Verfahren nach einem der Ansprüche 1 bis 8, wobei die Probe eine Serum-, Plasma-, Urinoder Samenprobe ist.
- Verfahren nach Anspruch 1, wobei eine Mischung von Sonden verwendet wird, die gewebespezifische Biomarker, krebsspezifische Biomarker, ergebnisspezifische Biomarker oder eine Kombination davon binden, bevorzugtwobei der gewebespezifische Biomarker ein prostataspezifischer Biomarker ist, oderwobei der krebsspezifische Biomarker Ghrelin ist, oderwobei der ergebnisspezifische Biomarker Polysialinsäure ist.
Applications Claiming Priority (2)
| Application Number | Priority Date | Filing Date | Title |
|---|---|---|---|
| CA3003032A CA3003032A1 (en) | 2018-04-27 | 2018-04-27 | Methods of diagnosing disease using microflow cytometry |
| PCT/CA2019/050541 WO2019204940A1 (en) | 2018-04-27 | 2019-04-26 | Methods of diagnosing disease using microflow cytometry |
Publications (3)
| Publication Number | Publication Date |
|---|---|
| EP3785014A1 EP3785014A1 (de) | 2021-03-03 |
| EP3785014A4 EP3785014A4 (de) | 2022-01-26 |
| EP3785014B1 true EP3785014B1 (de) | 2025-06-25 |
Family
ID=68293427
Family Applications (1)
| Application Number | Title | Priority Date | Filing Date |
|---|---|---|---|
| EP19792287.5A Active EP3785014B1 (de) | 2018-04-27 | 2019-04-26 | Verfahren zur diagnose von krankheiten mittels mikrodurchflusszytometrie |
Country Status (9)
| Country | Link |
|---|---|
| US (1) | US20210048383A1 (de) |
| EP (1) | EP3785014B1 (de) |
| JP (1) | JP7451424B2 (de) |
| CN (1) | CN112313497A (de) |
| AU (1) | AU2019259581B2 (de) |
| BR (1) | BR112020021779B1 (de) |
| CA (2) | CA3003032A1 (de) |
| CL (1) | CL2020002768A1 (de) |
| WO (1) | WO2019204940A1 (de) |
Families Citing this family (8)
| Publication number | Priority date | Publication date | Assignee | Title |
|---|---|---|---|---|
| US20220292363A1 (en) * | 2019-09-02 | 2022-09-15 | Phil Rivers Technology, Ltd. | Method for automatically determining disease type and electronic apparatus |
| JP7428505B2 (ja) * | 2019-11-19 | 2024-02-06 | 富士レビオ株式会社 | コンピュータプログラム、学習モデル生成方法及び情報処理装置 |
| CN113218848B (zh) * | 2021-04-30 | 2022-08-12 | 天津深析智能科技发展有限公司 | 一种判断非特异细胞群的方法 |
| CN113380318B (zh) * | 2021-06-07 | 2023-04-07 | 天津金域医学检验实验室有限公司 | 人工智能辅助流式细胞术40cd免疫表型检测方法及系统 |
| CN114018789A (zh) * | 2021-10-08 | 2022-02-08 | 武汉大学 | 基于成像流式细胞检测和机器学习的急性白血病分型方法 |
| CN115294191B (zh) * | 2022-10-08 | 2022-12-27 | 武汉楚精灵医疗科技有限公司 | 基于电子内镜的标志物尺寸测量方法、装置、设备及介质 |
| JP2024157876A (ja) * | 2023-04-26 | 2024-11-08 | 株式会社日立ハイテク | 情報処理システム、及び情報処理方法 |
| WO2025255587A1 (en) * | 2024-06-07 | 2025-12-11 | Kohler Co. | Systems and methods for generating individual health and wellness insights |
Citations (1)
| Publication number | Priority date | Publication date | Assignee | Title |
|---|---|---|---|---|
| US10874610B2 (en) * | 2016-10-19 | 2020-12-29 | Northwestern University | Extracellular vesicle-based diagnostics and engineered exosomes for targeted therapeutics against cancer |
Family Cites Families (26)
| Publication number | Priority date | Publication date | Assignee | Title |
|---|---|---|---|---|
| US6025128A (en) * | 1994-09-29 | 2000-02-15 | The University Of Tulsa | Prediction of prostate cancer progression by analysis of selected predictive parameters |
| US6140065A (en) * | 1997-09-05 | 2000-10-31 | Dianon Systems, Inc. | Methods for diagnosing benign prostatic diseases and prostatic adenocarcinoma using an algorithm |
| CA2403874A1 (en) * | 2000-03-28 | 2001-12-06 | Dana-Farber Cancer Institute, Inc. | Molecular database for antibody characterization |
| US20040265874A1 (en) * | 2000-10-17 | 2004-12-30 | Bio-Rad Laboratories, Inc. | Pattern recognition method for diagnosis of systemic autoimmune diseases |
| US20050095611A1 (en) * | 2003-05-02 | 2005-05-05 | Chan Daniel W. | Identification of biomarkers for detecting pancreatic cancer |
| US20060195266A1 (en) * | 2005-02-25 | 2006-08-31 | Yeatman Timothy J | Methods for predicting cancer outcome and gene signatures for use therein |
| US20070009970A1 (en) * | 2005-07-08 | 2007-01-11 | Predicant Biosciences, Inc. | Biological patterns for diagnosis and treatment of cancer |
| US20080133141A1 (en) * | 2005-12-22 | 2008-06-05 | Frost Stephen J | Weighted Scoring Methods and Use Thereof in Screening |
| US20070255113A1 (en) * | 2006-05-01 | 2007-11-01 | Grimes F R | Methods and apparatus for identifying disease status using biomarkers |
| JP2010510528A (ja) * | 2006-11-22 | 2010-04-02 | ライフ テクノロジーズ コーポレーション | 自己免疫疾患のバイオマーカー |
| JP2010256132A (ja) * | 2009-04-23 | 2010-11-11 | Okayama Univ | 糖尿病性腎症の進行度の検出方法及び糖尿病性腎症の進行度の診断キット並びに糖尿病性腎症の進行度の指標となる物質及びその選別方法 |
| KR102023584B1 (ko) * | 2011-03-01 | 2019-09-24 | 예일 유니버시티 | 위장관췌장 신경내분비 신생물 (GEP-NENs)의 예측 방법 |
| US20130095575A1 (en) | 2011-10-03 | 2013-04-18 | The Board Of Trustees Of The Leland Stanford Junior University | Methods for Fractionation, Analysis and Collection of Microvesicles From Patient Samples |
| DK3179393T3 (da) * | 2012-01-31 | 2020-07-27 | Genomic Health Inc | Genexpressionsprofilalgoritme og -test til bestemmelse af prognosen for prostatakræft |
| US20150133327A1 (en) * | 2012-04-19 | 2015-05-14 | Hon Sing Leong | Method for detecting or monitoring prostate cancer |
| WO2014028494A1 (en) * | 2012-08-13 | 2014-02-20 | The Regents Of The University Of California | Detecting and treating liver damage |
| EP2943204B1 (de) | 2013-01-10 | 2019-03-13 | Venatorx Pharmaceuticals Inc | Beta-lactamase-hemmer |
| EP3049067A4 (de) * | 2013-09-24 | 2017-05-03 | The Regents of the University of California | Eingekapselte sensoren und messsysteme für bioassays und diagnostika sowie verfahren zur herstellung und verwendung davon |
| KR102396026B1 (ko) * | 2014-01-21 | 2022-05-09 | 안자리움 바이오사이언시스 아게 | 하이브리도좀, 이를 포함하는 조성물, 이의 제조 방법 및 이의 용도 |
| AU2015360448A1 (en) * | 2014-12-10 | 2017-06-29 | Neogenomics Laboratories, Inc. | Automated flow cytometry analysis method and system |
| CA2993102A1 (en) * | 2015-07-22 | 2017-01-26 | Minomic International Ltd. | Biomarker combinations for prostate disease |
| WO2017053592A1 (en) * | 2015-09-23 | 2017-03-30 | The Regents Of The University Of California | Deep learning in label-free cell classification and machine vision extraction of particles |
| US10731166B2 (en) * | 2016-03-18 | 2020-08-04 | Caris Science, Inc. | Oligonucleotide probes and uses thereof |
| WO2017181147A1 (en) * | 2016-04-15 | 2017-10-19 | Octave Biosciences, Inc. | Methods for assessment of multiple sclerosis activity |
| US10914748B2 (en) * | 2016-09-08 | 2021-02-09 | UNIVERSITé LAVAL | Erythrocyte-derived extracellular vesicles as a biomarker for clinically assessing Parkinson's disease |
| US9934364B1 (en) * | 2017-02-28 | 2018-04-03 | Anixa Diagnostics Corporation | Methods for using artificial neural network analysis on flow cytometry data for cancer diagnosis |
-
2018
- 2018-04-27 CA CA3003032A patent/CA3003032A1/en not_active Abandoned
-
2019
- 2019-04-26 EP EP19792287.5A patent/EP3785014B1/de active Active
- 2019-04-26 BR BR112020021779-4A patent/BR112020021779B1/pt active IP Right Grant
- 2019-04-26 AU AU2019259581A patent/AU2019259581B2/en active Active
- 2019-04-26 CN CN201980040523.XA patent/CN112313497A/zh active Pending
- 2019-04-26 US US17/050,799 patent/US20210048383A1/en active Pending
- 2019-04-26 WO PCT/CA2019/050541 patent/WO2019204940A1/en not_active Ceased
- 2019-04-26 CA CA3050256A patent/CA3050256C/en active Active
- 2019-04-26 JP JP2020560403A patent/JP7451424B2/ja active Active
-
2020
- 2020-10-26 CL CL2020002768A patent/CL2020002768A1/es unknown
Patent Citations (1)
| Publication number | Priority date | Publication date | Assignee | Title |
|---|---|---|---|---|
| US10874610B2 (en) * | 2016-10-19 | 2020-12-29 | Northwestern University | Extracellular vesicle-based diagnostics and engineered exosomes for targeted therapeutics against cancer |
Also Published As
| Publication number | Publication date |
|---|---|
| CN112313497A (zh) | 2021-02-02 |
| AU2019259581A1 (en) | 2020-11-26 |
| CL2020002768A1 (es) | 2021-05-28 |
| EP3785014A1 (de) | 2021-03-03 |
| AU2019259581B2 (en) | 2024-10-17 |
| WO2019204940A1 (en) | 2019-10-31 |
| CA3003032A1 (en) | 2019-10-27 |
| BR112020021779B1 (pt) | 2023-03-07 |
| JP2021522503A (ja) | 2021-08-30 |
| BR112020021779A2 (pt) | 2021-02-23 |
| JP7451424B2 (ja) | 2024-03-18 |
| CA3050256A1 (en) | 2019-10-27 |
| US20210048383A1 (en) | 2021-02-18 |
| EP3785014A4 (de) | 2022-01-26 |
| CA3050256C (en) | 2023-09-05 |
Similar Documents
| Publication | Publication Date | Title |
|---|---|---|
| EP3785014B1 (de) | Verfahren zur diagnose von krankheiten mittels mikrodurchflusszytometrie | |
| Park et al. | Molecular profiling of single circulating tumor cells from lung cancer patients | |
| US20230304993A1 (en) | Circulating tumor cell diagnostics for lung cancer | |
| Weigt et al. | Gene expression profiling of bronchoalveolar lavage cells preceding a clinical diagnosis of chronic lung allograft dysfunction | |
| US20250180564A1 (en) | Single cell genomic profiling of circulating tumor cells (ctcs) in metastatic disease to characterize disease heterogeneity | |
| JP2019502384A (ja) | 疾患の不均一性を特徴づけるための転移性疾患における、循環腫瘍細胞(ctc)の単一細胞ゲノムプロファイリング | |
| CN107422127A (zh) | 用非稀有细胞检测稀有细胞的方法 | |
| CN110998318A (zh) | 基于转移性疾病中循环肿瘤细胞(ctc)的单细胞表征的确定疗法的方法 | |
| CN114107509B (zh) | 一种肝癌预后标记物及其应用 | |
| Paproski et al. | Building predictive disease models using extracellular vesicle microscale flow cytometry and machine learning | |
| WO2012170974A1 (en) | System and method of cytomic vascular health profiling | |
| US20170059581A1 (en) | Methods for diagnosis and prognosis of inflammatory bowel disease using cytokine profiles | |
| WO2019232361A1 (en) | Personalized treatment of pancreatic cancer | |
| Lee et al. | Performance and advancement of the kidney solid organ response test | |
| US20230273211A1 (en) | Method of diagnosing breast cancer | |
| US20150218655A1 (en) | Biomarkers for prostate cancer prognosis | |
| Russo et al. | Augmentation-based deep learning for identification of circulating tumor cells | |
| CN117233389A (zh) | 用于快速鉴定急性髓系白血病中cebpa双突变的标志物 | |
| Sharaby | AI-driven approach for diagnosis of renal transplant rejection based on biomarkers identification and integration. | |
| US20130073213A1 (en) | Gene Expression-Based Differential Diagnostic Model for Rheumatoid Arthritis | |
| Dambinova et al. | Challenges in Using Biomarkers in Central Nervous System Applications | |
| WO2016075232A1 (en) | Gene signature associated with tolerance to renal allograft |
Legal Events
| Date | Code | Title | Description |
|---|---|---|---|
| STAA | Information on the status of an ep patent application or granted ep patent |
Free format text: STATUS: THE INTERNATIONAL PUBLICATION HAS BEEN MADE |
|
| PUAI | Public reference made under article 153(3) epc to a published international application that has entered the european phase |
Free format text: ORIGINAL CODE: 0009012 |
|
| STAA | Information on the status of an ep patent application or granted ep patent |
Free format text: STATUS: REQUEST FOR EXAMINATION WAS MADE |
|
| 17P | Request for examination filed |
Effective date: 20201029 |
|
| AK | Designated contracting states |
Kind code of ref document: A1 Designated state(s): AL AT BE BG CH CY CZ DE DK EE ES FI FR GB GR HR HU IE IS IT LI LT LU LV MC MK MT NL NO PL PT RO RS SE SI SK SM TR |
|
| AX | Request for extension of the european patent |
Extension state: BA ME |
|
| DAV | Request for validation of the european patent (deleted) | ||
| DAX | Request for extension of the european patent (deleted) | ||
| REG | Reference to a national code |
Ref country code: HK Ref legal event code: DE Ref document number: 40048115 Country of ref document: HK |
|
| A4 | Supplementary search report drawn up and despatched |
Effective date: 20220105 |
|
| RIC1 | Information provided on ipc code assigned before grant |
Ipc: G06N 3/12 20060101ALI20211222BHEP Ipc: G06N 20/20 20190101ALI20211222BHEP Ipc: G06N 20/10 20190101ALI20211222BHEP Ipc: G06N 7/00 20060101ALI20211222BHEP Ipc: G06N 5/00 20060101ALI20211222BHEP Ipc: G06N 3/04 20060101ALI20211222BHEP Ipc: G01N 15/00 20060101ALI20211222BHEP Ipc: G01N 33/574 20060101ALI20211222BHEP Ipc: G01N 15/14 20060101ALI20211222BHEP Ipc: G06N 20/00 20190101ALI20211222BHEP Ipc: G01N 15/10 20060101AFI20211222BHEP |
|
| STAA | Information on the status of an ep patent application or granted ep patent |
Free format text: STATUS: EXAMINATION IS IN PROGRESS |
|
| 17Q | First examination report despatched |
Effective date: 20231006 |
|
| GRAP | Despatch of communication of intention to grant a patent |
Free format text: ORIGINAL CODE: EPIDOSNIGR1 |
|
| STAA | Information on the status of an ep patent application or granted ep patent |
Free format text: STATUS: GRANT OF PATENT IS INTENDED |
|
| RIC1 | Information provided on ipc code assigned before grant |
Ipc: G06N 5/01 20230101ALI20241220BHEP Ipc: G01N 15/1429 20240101ALI20241220BHEP Ipc: G06N 3/126 20230101ALI20241220BHEP Ipc: G06N 3/12 20060101ALI20241220BHEP Ipc: G06N 20/20 20190101ALI20241220BHEP Ipc: G06N 20/10 20190101ALI20241220BHEP Ipc: G06N 7/00 20060101ALI20241220BHEP Ipc: G06N 5/00 20060101ALI20241220BHEP Ipc: G06N 3/04 20060101ALI20241220BHEP Ipc: G01N 15/00 20060101ALI20241220BHEP Ipc: G01N 33/574 20060101ALI20241220BHEP Ipc: G01N 15/14 20060101ALI20241220BHEP Ipc: G06N 20/00 20190101ALI20241220BHEP Ipc: G01N 15/10 20060101AFI20241220BHEP |
|
| INTG | Intention to grant announced |
Effective date: 20250122 |
|
| GRAS | Grant fee paid |
Free format text: ORIGINAL CODE: EPIDOSNIGR3 |
|
| GRAA | (expected) grant |
Free format text: ORIGINAL CODE: 0009210 |
|
| STAA | Information on the status of an ep patent application or granted ep patent |
Free format text: STATUS: THE PATENT HAS BEEN GRANTED |
|
| AK | Designated contracting states |
Kind code of ref document: B1 Designated state(s): AL AT BE BG CH CY CZ DE DK EE ES FI FR GB GR HR HU IE IS IT LI LT LU LV MC MK MT NL NO PL PT RO RS SE SI SK SM TR |
|
| REG | Reference to a national code |
Ref country code: GB Ref legal event code: FG4D |
|
| REG | Reference to a national code |
Ref country code: CH Ref legal event code: EP |
|
| REG | Reference to a national code |
Ref country code: CH Ref legal event code: EP |
|
| REG | Reference to a national code |
Ref country code: IE Ref legal event code: FG4D |
|
| REG | Reference to a national code |
Ref country code: DE Ref legal event code: R096 Ref document number: 602019071630 Country of ref document: DE |
|
| PG25 | Lapsed in a contracting state [announced via postgrant information from national office to epo] |
Ref country code: FI Free format text: LAPSE BECAUSE OF FAILURE TO SUBMIT A TRANSLATION OF THE DESCRIPTION OR TO PAY THE FEE WITHIN THE PRESCRIBED TIME-LIMIT Effective date: 20250625 |
|
| REG | Reference to a national code |
Ref country code: LT Ref legal event code: MG9D |
|
| PG25 | Lapsed in a contracting state [announced via postgrant information from national office to epo] |
Ref country code: GR Free format text: LAPSE BECAUSE OF FAILURE TO SUBMIT A TRANSLATION OF THE DESCRIPTION OR TO PAY THE FEE WITHIN THE PRESCRIBED TIME-LIMIT Effective date: 20250926 Ref country code: NO Free format text: LAPSE BECAUSE OF FAILURE TO SUBMIT A TRANSLATION OF THE DESCRIPTION OR TO PAY THE FEE WITHIN THE PRESCRIBED TIME-LIMIT Effective date: 20250925 |
|
| PG25 | Lapsed in a contracting state [announced via postgrant information from national office to epo] |
Ref country code: BG Free format text: LAPSE BECAUSE OF FAILURE TO SUBMIT A TRANSLATION OF THE DESCRIPTION OR TO PAY THE FEE WITHIN THE PRESCRIBED TIME-LIMIT Effective date: 20250625 |
|
| PG25 | Lapsed in a contracting state [announced via postgrant information from national office to epo] |
Ref country code: HR Free format text: LAPSE BECAUSE OF FAILURE TO SUBMIT A TRANSLATION OF THE DESCRIPTION OR TO PAY THE FEE WITHIN THE PRESCRIBED TIME-LIMIT Effective date: 20250625 |
|
| PG25 | Lapsed in a contracting state [announced via postgrant information from national office to epo] |
Ref country code: RS Free format text: LAPSE BECAUSE OF FAILURE TO SUBMIT A TRANSLATION OF THE DESCRIPTION OR TO PAY THE FEE WITHIN THE PRESCRIBED TIME-LIMIT Effective date: 20250925 |
|
| PG25 | Lapsed in a contracting state [announced via postgrant information from national office to epo] |
Ref country code: LV Free format text: LAPSE BECAUSE OF FAILURE TO SUBMIT A TRANSLATION OF THE DESCRIPTION OR TO PAY THE FEE WITHIN THE PRESCRIBED TIME-LIMIT Effective date: 20250625 |
|
| REG | Reference to a national code |
Ref country code: NL Ref legal event code: MP Effective date: 20250625 |
|
| PG25 | Lapsed in a contracting state [announced via postgrant information from national office to epo] |
Ref country code: NL Free format text: LAPSE BECAUSE OF FAILURE TO SUBMIT A TRANSLATION OF THE DESCRIPTION OR TO PAY THE FEE WITHIN THE PRESCRIBED TIME-LIMIT Effective date: 20250625 |
|
| PG25 | Lapsed in a contracting state [announced via postgrant information from national office to epo] |
Ref country code: PT Free format text: LAPSE BECAUSE OF FAILURE TO SUBMIT A TRANSLATION OF THE DESCRIPTION OR TO PAY THE FEE WITHIN THE PRESCRIBED TIME-LIMIT Effective date: 20251027 |
|
| REG | Reference to a national code |
Ref country code: AT Ref legal event code: MK05 Ref document number: 1806900 Country of ref document: AT Kind code of ref document: T Effective date: 20250625 |
|
| PG25 | Lapsed in a contracting state [announced via postgrant information from national office to epo] |
Ref country code: IS Free format text: LAPSE BECAUSE OF FAILURE TO SUBMIT A TRANSLATION OF THE DESCRIPTION OR TO PAY THE FEE WITHIN THE PRESCRIBED TIME-LIMIT Effective date: 20251025 |
|
| PG25 | Lapsed in a contracting state [announced via postgrant information from national office to epo] |
Ref country code: AT Free format text: LAPSE BECAUSE OF FAILURE TO SUBMIT A TRANSLATION OF THE DESCRIPTION OR TO PAY THE FEE WITHIN THE PRESCRIBED TIME-LIMIT Effective date: 20250625 Ref country code: SM Free format text: LAPSE BECAUSE OF FAILURE TO SUBMIT A TRANSLATION OF THE DESCRIPTION OR TO PAY THE FEE WITHIN THE PRESCRIBED TIME-LIMIT Effective date: 20250625 |
|
| PG25 | Lapsed in a contracting state [announced via postgrant information from national office to epo] |
Ref country code: CZ Free format text: LAPSE BECAUSE OF FAILURE TO SUBMIT A TRANSLATION OF THE DESCRIPTION OR TO PAY THE FEE WITHIN THE PRESCRIBED TIME-LIMIT Effective date: 20250625 |
|
| PG25 | Lapsed in a contracting state [announced via postgrant information from national office to epo] |
Ref country code: PL Free format text: LAPSE BECAUSE OF FAILURE TO SUBMIT A TRANSLATION OF THE DESCRIPTION OR TO PAY THE FEE WITHIN THE PRESCRIBED TIME-LIMIT Effective date: 20250625 |
|
| PG25 | Lapsed in a contracting state [announced via postgrant information from national office to epo] |
Ref country code: EE Free format text: LAPSE BECAUSE OF FAILURE TO SUBMIT A TRANSLATION OF THE DESCRIPTION OR TO PAY THE FEE WITHIN THE PRESCRIBED TIME-LIMIT Effective date: 20250625 |
|
| PG25 | Lapsed in a contracting state [announced via postgrant information from national office to epo] |
Ref country code: SK Free format text: LAPSE BECAUSE OF FAILURE TO SUBMIT A TRANSLATION OF THE DESCRIPTION OR TO PAY THE FEE WITHIN THE PRESCRIBED TIME-LIMIT Effective date: 20250625 |
|
| PG25 | Lapsed in a contracting state [announced via postgrant information from national office to epo] |
Ref country code: ES Free format text: LAPSE BECAUSE OF FAILURE TO SUBMIT A TRANSLATION OF THE DESCRIPTION OR TO PAY THE FEE WITHIN THE PRESCRIBED TIME-LIMIT Effective date: 20250625 |
|
| PG25 | Lapsed in a contracting state [announced via postgrant information from national office to epo] |
Ref country code: DK Free format text: LAPSE BECAUSE OF FAILURE TO SUBMIT A TRANSLATION OF THE DESCRIPTION OR TO PAY THE FEE WITHIN THE PRESCRIBED TIME-LIMIT Effective date: 20250625 |
|
| PG25 | Lapsed in a contracting state [announced via postgrant information from national office to epo] |
Ref country code: IT Free format text: LAPSE BECAUSE OF FAILURE TO SUBMIT A TRANSLATION OF THE DESCRIPTION OR TO PAY THE FEE WITHIN THE PRESCRIBED TIME-LIMIT Effective date: 20250625 |
|
| PLBE | No opposition filed within time limit |
Free format text: ORIGINAL CODE: 0009261 |
|
| STAA | Information on the status of an ep patent application or granted ep patent |
Free format text: STATUS: NO OPPOSITION FILED WITHIN TIME LIMIT |