EP3795643A1 - Sonde fluorescente et ses applications - Google Patents
Sonde fluorescente et ses applications Download PDFInfo
- Publication number
- EP3795643A1 EP3795643A1 EP19306175.1A EP19306175A EP3795643A1 EP 3795643 A1 EP3795643 A1 EP 3795643A1 EP 19306175 A EP19306175 A EP 19306175A EP 3795643 A1 EP3795643 A1 EP 3795643A1
- Authority
- EP
- European Patent Office
- Prior art keywords
- membrane
- lipid
- fluorescent compound
- gel
- lipid membrane
- Prior art date
- Legal status (The legal status is an assumption and is not a legal conclusion. Google has not performed a legal analysis and makes no representation as to the accuracy of the status listed.)
- Withdrawn
Links
- 0 C*(C)CC(C)(C)C(c1ccc(cc(cc2)N(CCO)CCO)c2c1)=O Chemical compound C*(C)CC(C)(C)C(c1ccc(cc(cc2)N(CCO)CCO)c2c1)=O 0.000 description 1
Images





Classifications
-
- G—PHYSICS
- G01—MEASURING; TESTING
- G01N—INVESTIGATING OR ANALYSING MATERIALS BY DETERMINING THEIR CHEMICAL OR PHYSICAL PROPERTIES
- G01N33/00—Investigating or analysing materials by specific methods not covered by groups G01N1/00 - G01N31/00
- G01N33/48—Biological material, e.g. blood, urine; Haemocytometers
- G01N33/50—Chemical analysis of biological material, e.g. blood, urine; Testing involving biospecific ligand binding methods; Immunological testing
- G01N33/58—Chemical analysis of biological material, e.g. blood, urine; Testing involving biospecific ligand binding methods; Immunological testing involving labelled substances
- G01N33/582—Chemical analysis of biological material, e.g. blood, urine; Testing involving biospecific ligand binding methods; Immunological testing involving labelled substances with fluorescent label
-
- C—CHEMISTRY; METALLURGY
- C09—DYES; PAINTS; POLISHES; NATURAL RESINS; ADHESIVES; COMPOSITIONS NOT OTHERWISE PROVIDED FOR; APPLICATIONS OF MATERIALS NOT OTHERWISE PROVIDED FOR
- C09B—ORGANIC DYES OR CLOSELY-RELATED COMPOUNDS FOR PRODUCING DYES, e.g. PIGMENTS; MORDANTS; LAKES
- C09B57/00—Other synthetic dyes of known constitution
-
- G—PHYSICS
- G01—MEASURING; TESTING
- G01N—INVESTIGATING OR ANALYSING MATERIALS BY DETERMINING THEIR CHEMICAL OR PHYSICAL PROPERTIES
- G01N21/00—Investigating or analysing materials by the use of optical means, i.e. using sub-millimetre waves, infrared, visible or ultraviolet light
- G01N21/62—Systems in which the material investigated is excited whereby it emits light or causes a change in wavelength of the incident light
- G01N21/63—Systems in which the material investigated is excited whereby it emits light or causes a change in wavelength of the incident light optically excited
- G01N21/64—Fluorescence; Phosphorescence
- G01N21/6428—Measuring fluorescence of fluorescent products of reactions or of fluorochrome labelled reactive substances, e.g. measuring quenching effects, using measuring "optrodes"
-
- G—PHYSICS
- G01—MEASURING; TESTING
- G01N—INVESTIGATING OR ANALYSING MATERIALS BY DETERMINING THEIR CHEMICAL OR PHYSICAL PROPERTIES
- G01N33/00—Investigating or analysing materials by specific methods not covered by groups G01N1/00 - G01N31/00
- G01N33/48—Biological material, e.g. blood, urine; Haemocytometers
- G01N33/50—Chemical analysis of biological material, e.g. blood, urine; Testing involving biospecific ligand binding methods; Immunological testing
- G01N33/53—Immunoassay; Biospecific binding assay; Materials therefor
- G01N33/575—Immunoassay; Biospecific binding assay; Materials therefor for cancer
-
- G—PHYSICS
- G01—MEASURING; TESTING
- G01N—INVESTIGATING OR ANALYSING MATERIALS BY DETERMINING THEIR CHEMICAL OR PHYSICAL PROPERTIES
- G01N33/00—Investigating or analysing materials by specific methods not covered by groups G01N1/00 - G01N31/00
- G01N33/48—Biological material, e.g. blood, urine; Haemocytometers
- G01N33/50—Chemical analysis of biological material, e.g. blood, urine; Testing involving biospecific ligand binding methods; Immunological testing
- G01N33/53—Immunoassay; Biospecific binding assay; Materials therefor
- G01N33/575—Immunoassay; Biospecific binding assay; Materials therefor for cancer
- G01N33/5758—Immunoassay; Biospecific binding assay; Materials therefor for cancer involving compounds serving as markers for tumours, cancers or neoplasias, e.g. cellular determinants, receptors, heat shock/stress proteins, A-protein, oligosaccharides or metabolites
- G01N33/5759—Immunoassay; Biospecific binding assay; Materials therefor for cancer involving compounds serving as markers for tumours, cancers or neoplasias, e.g. cellular determinants, receptors, heat shock/stress proteins, A-protein, oligosaccharides or metabolites involving compounds localised on the membrane of tumour or cancer cells
-
- G—PHYSICS
- G01—MEASURING; TESTING
- G01N—INVESTIGATING OR ANALYSING MATERIALS BY DETERMINING THEIR CHEMICAL OR PHYSICAL PROPERTIES
- G01N21/00—Investigating or analysing materials by the use of optical means, i.e. using sub-millimetre waves, infrared, visible or ultraviolet light
- G01N21/62—Systems in which the material investigated is excited whereby it emits light or causes a change in wavelength of the incident light
- G01N21/63—Systems in which the material investigated is excited whereby it emits light or causes a change in wavelength of the incident light optically excited
- G01N21/64—Fluorescence; Phosphorescence
- G01N21/6428—Measuring fluorescence of fluorescent products of reactions or of fluorochrome labelled reactive substances, e.g. measuring quenching effects, using measuring "optrodes"
- G01N2021/6439—Measuring fluorescence of fluorescent products of reactions or of fluorochrome labelled reactive substances, e.g. measuring quenching effects, using measuring "optrodes" with indicators, stains, dyes, tags, labels, marks
-
- G—PHYSICS
- G01—MEASURING; TESTING
- G01N—INVESTIGATING OR ANALYSING MATERIALS BY DETERMINING THEIR CHEMICAL OR PHYSICAL PROPERTIES
- G01N2800/00—Detection or diagnosis of diseases
- G01N2800/52—Predicting or monitoring the response to treatment, e.g. for selection of therapy based on assay results in personalised medicine; Prognosis
Definitions
- Membranes as selective barriers between the inner and the outer compartments, regulate a plethora of phenomena related to signalling, molecule entry into cells, metabolite exchange or membrane trafficking. Therefore, investigations in the field of membranes are exponentially increasing today. The complexity of biological membranes, as major components of the living cell, and their numerous interactions with intra- and extracellular networks, make their direct investigation difficult.
- Membrane fluidity modulates the binding of proteins to the membrane, transmembrane protein function, formation of multi-protein or protein-lipid complexes and more generally, signaling or metabolic pathways. Therefore, quantifying membrane fluidity is a challenge in the field of biological membranes. To respond to this challenge, there is a need for tools to accurately measure physical membrane state in living cells or tissue. In this respect, organic fluorescent probes sensitive to the viscosity of their environment are widely used for the study of both membrane fluidity and organization. Among them, Laurdan, which belongs to the family of 2-(dimethylamino)-6-acylnaphthalene, is one of the most popular.
- Laurdan's emission spectrum is shifted from 440 nm to 490 nm. This shift was shown to be primarily linked to the mobility of water molecules in the vicinity of the excited naphthalene moiety ( Parasassi et al., Biophysical Society Volume 60 July 1991, 179-189 ) which is reported to be located at the hydrophilic-hydrophobic interface of the bilayer.
- the 440 nm/490 nm fluorescence emission intensity ratio mirrors the polarity of Laurdan environment which in turn gives insight into the packing of lipid molecules and membrane fluidity state.
- Laurdan in biomimetic assemblies are numerous both by fluorescence spectroscopy and fluorescence microscopy, but living cell membranes studies with Laurdan are more scarce.
- Laurdan is a rather hydrophobic molecule, with low solubility in aqueous buffers. It was shown to accumulate in apolar compartments such as lipid droplets. Plasma membrane labelling is therefore rather ineffective.
- the distribution of Laurdan between ordered and disordered regions of the membranes is not homogeneous ( Kim et al., ChemBioChem 2007, 8, 553-559 ).
- C-Laurdan possesses a carboxylic group which dissociates with a pKa 6.6, its fluorescence properties will be affected not only by membrane packing/fluidity but also by the presence of charged phospholipids and by pH variations in various cell compartments.
- UV-excitable probes such as Laurdan and derivatives are very sensitive to changes in membrane fluidity, but they are all subject to photo-bleaching. Therefore, microscopy visualization of these fluorophores requires biphoton microscopy settings to limit excitation energy.
- Other derivatives with spectral properties shifted towards the red edge of the spectrum were designed, such as Di-4-ANEPPDHQ, which has emission maxima of 560 nm and 610 nm in gel and liquid crystalline phase membranes, respectively ( Dinic et al., Biochimica et Biophysica Acta 1808 (2011) 298-306 ; Sezgin et al., ChemPhysChem 2015, 16, 1387-1394 ).
- Di-4-ANEPPDHQ Molecular mechanisms underlining spectral changes of Di-4-ANEPPDHQ were shown to be different from those of Laurdan, with Laurdan being more sensitive to lipid packing and Di-4-ANEPPDHQ more sensitive to cholesterol content in membranes. Yet, cholesterol sensitivity of Di-4-ANEPPDHQ was proposed to be related to cholesterol-fluorophore interactions or to an electrochromic effect, since this probe is sensitive to membrane potential, rather than to a direct measure of lipid packing in membranes ( Amaro et al., J. Phys. D: Appl. Phys. 50 (2017) 134004 (9pp )).
- the aim of the invention is to obviate these drawbacks.
- One of the purposes of the invention is to provide a fluorescent probe sensitive to membrane fluidity.
- Another purpose of the invention is to provide a method for labelling a lipid membrane.
- An additional purpose of the invention is to provide a method for determining the degree of fluidity of a lipid membrane
- Another purpose of the invention is to provide a method for diagnosing cancer in an individual.
- An ultimate purpose of the invention is to provide a method for tumour follow-up in a patient.
- the compound of formula I unexpectedly labels the lipid membranes with a high sensitivity to their degree of fluidity. Moreover, unlike C-Laurdan and Laurdan probes, the compound of formula I shows a high fluorescence intensity when inserted into membranes whose lipids are in the liquid-crystal phase. Consequently, the compound of formula I allows for the first time to finely compare the degree of fluidity between two lipid membranes. Moreover, the water solubility of the compound of formula I is very good. As a result, the compound of formula I does not tend to precipitate in the cells and its incorporation efficiency in the cells is very good with a homogeneous distribution in the cell membranes. The results are therefore reproducible and allow its use for cell labelling for application such as diagnosis cancer and evaluating the responsiveness of a patient to a therapeutic treatment.
- the "C3-C25 alkyl, linear or branched, saturated or not, cyclic or not" of R 3 includes a C3-C25 alkyl linear saturated, a C3-C25 alkyl linear unsaturated, a C3-C25 alkyl linear branched saturated, a C3-C25 alkyl linear branched unsaturated, a C3-C25 cycloalkyl saturated, a C3-C25 cycloalkyl unsaturated, a C3-C25 cycloalkyl branched saturated and a C3-C25 cycloalkyl branched unsaturated.
- R 3 is selected in the group consisting in C3, C4, C5, C6, C7, C8, C9, C10, C11, C12, C13, C14, C15, C16, C17, C18, C19, C20, C21, C22, C23, C24 and C25 alkyl, linear or branched, saturated or not, cyclic or not.
- R3 is a C3-C20 alkyl, linear or branched, saturated or not, cyclic or not.
- R3 is a C6-C15 alkyl, linear or branched, saturated or not, cyclic or not, more advantageously, R3 is a C8-C12 alkyl, linear or branched, saturated or not, cyclic or not, advantageously R3 is a C10 alkyl, linear or branched, saturated or not, cyclic or not.
- the "C1-C6 alkyl, linear or branched, saturated or not, cyclic or not, not substituted" of R 4 R 5 includes a C1-C6 linear saturated alkyl, a C1-C6 linear unsaturated alkyl, a C1-C6 branched saturated alkyl, a C1-C6 branched unsaturated alkyl, a C1-C6 saturated cycloalkyl, a C3-C6 unsaturated cycloalkyl, a C3-C6 branched saturated cycloalkyl and a C3-C6 branched unsaturated cycloalkyl.
- the "C2-C6 alkyl, linear or branched, saturated or not, cyclic or not, substituted by at least a hydroxyl group" of R 4 and R 5 includes a C2-C6 alkyl linear saturated substituted by at least a hydroxyl group, a C2-C6 alkyl linear unsaturated substituted by at least a hydroxyl group, a C2-C6 alkyl linear branched saturated substituted by at least a hydroxyl group, a C2-C6 alkyl linear branched unsaturated substituted by at least a hydroxyl group, a C3-C6 cycloalkyl saturated substituted by at least a hydroxyl group, a C3-C6 cycloalkyl unsaturated substituted by at least a hydroxyl group, a C3-C6 cycloalkyl branched saturated substituted by at least a hydroxyl group and a C3-C6 cycloalkyl branched unsaturated substituted by at least
- R 4 and R 5 are of formula wherein, R 7 , R 8 and R 9 are independently from each other hydrogen or a C1-C5 alkyl linear or branched, saturated or not, cyclic or not.
- each carbon atom of R 4 and R 5 is substituted by at most one hydroxyl group.
- the "C3-C6 alkyl, linear or branched, saturated or not, cyclic or not, substituted by at least two hydroxyl groups" of R 4 and R 5 includes a C3-C6 linear saturated alkyl substituted by at least two hydroxyl groups, a C3-C6 linear unsaturated alkyl substituted by at least two hydroxyl groups, a C3-C6 branched saturated alkyl substituted by at least two hydroxyl groups, a C3-C6 branched unsaturated alkyl substituted by at least two hydroxyl groups, a C3-C6 saturated cycloalkyl substituted by at least two hydroxyl groups, a C3-C6 unsaturated cycloalkyl substituted by at least two hydroxyl groups, a C3-C6 branched saturated cycloalkyl substituted by at least two hydroxyl groups and a C3-C6 branched unsaturated cycloalkyl substituted by at least two hydroxyl groups
- 2,3,4-trihydroxybutyl, 2,3,4,5-tetrahydroxypentyl and 2,3,4,5,6-pentahydroxyhexyl 2,3-dihydroxypropyl, 2,3-dihydroxybutyl, 2,4-dihydroxybutyl, 3,4-dihydroxybutyl, 1-methyl-2,3-dihydroxypropyl, 1-hydroxymethyl-2-hydroxypropyl, 2,3,4-trihydroxybutyl, 1-hydroxymethyl-2,3-dihydroxypropyl, 2,3-dihydroxypentyl, 2,4-dihydroxypentyl, 2,5-dihydroxypentyl, 3,4-dihydroxypentyl, 3,5-dihydroxypentyl, 4,5-dihydroxypentyl, 1-hydroxymethyl-2-hydroxybutyl, 1-hydroxymethyl-3-hydroxybutyl, 1-hydroxymethyl-4-hydroxybutyl, 1-methyl-2,3-dihydroxybutyl, 1-methyl-2,4-dihydroxybutyl, 1-methyl-3,4-
- R 4 and R 5 are together and independently from each other wherein n is an integer from 1 to 5 and m, o and p are together and independently from each other an integer from 0 to 4, and wherein the sum of n, m, o and p is an integer from 1 to 5.
- R 4 is as defined above and R 5 is a C1-C6 alkyl, linear or branched, saturated or not, cyclic or not, not substituted or R 4 is an unsubstituted C1-C6 alkyl, linear or branched, saturated or not, cyclic or not, not substituted and R 5 is as defined above, wherein n and m are together and independently from each other an integer from 1 to 4 and o and p are together and independently from each other an integer from 0 to 3, By “from 1 to 4", it is meant in the invention 1, 2, 3, and 4.
- R 4 and R 5 are together and independently from each other or R 4 is and R 5 is or R 4 is and R 5 is wherein n and m are together and independently from each other an integer from 1 to 4, and wherein the sum of n and m is an integer from 2 to 5.
- the "C1-C6 alkyl, linear or branched, saturated or not, cyclic or not" of R 6 includes a C1-C6 alkyl linear saturated, a C1-C6 alkyl linear unsaturated, a C1-C6 alkyl linear branched saturated, a C1-C6 alkyl linear branched unsaturated, a C1-C6 cycloalkyl saturated substituted by at least a hydroxyl group, a C1-C6 cycloalkyl unsaturated, a C1-C6 cycloalkyl branched saturated and a C1-C6 cycloalkyl branched unsaturated.
- cyclopropyl cyclobutyl, cyclopentyl, methylcyclopentyl, dimethylcyclopentyl, cyclohexyl, methylene, ethylene, trimethylene, propylene, tetramethylene, pentamethylene, hexamethylene, 2-butenyl, 3-butenyl, 2-methyl-2-propenyl, 1-methyl-2-propenyl and 3-methyl-2-butenyl.
- R 6 is a C1-C6 alkyl, linear or branched, saturated or not, cyclic or not, not substituted.
- R 6 is selected in the group consisting of C1, C2, C3, C4, C5 and C6 alkyl, linear or branched, saturated or not, cyclic or not.
- R 6 is a C1-C4 alkyl, linear or branched, saturated or not, cyclic or not.
- R 6 is a C1-C2 alkyl, linear or branched, saturated or not, cyclic or not.
- said fluorescent compound is of formula I-a: wherein R 3 , R 4 and R 5 are as defined above.
- said fluorescent compound is of formula I-a wherein R 3 , is a C8-C22 alkyl, linear or branched, saturated or not, cyclic or not.
- the fluorescent compound is of formula: or wherein the asterisk means that the carbon atom is an asymmetric carbon.
- the fluorescent compounds of formula 11 to 14 are selected in the group consisting of a racemic mixture, the R enantiomer and the S enantiomer. More advantageously, the fluorescent compounds of formula 11 is a racemic mixture. Particularly, the fluorescent compound of formula 16 is selected in the group consisting in a racemic mixture of diastereomers, a racemic mixture of a single diastereomer, the RR enantiomer, the RS enantiomer, the SS enantiomer and the SR enantiomer.
- the fluorescent compound of formula 17 is selected in the group consisting in a racemic mixture of diastereomers, a racemic mixture of a single diastereomer, the D- or L- arabino, ribo, xylo or lyxo configuration.
- the fluorescent compound of formula 18 is selected in the group consisting in a racemic mixture of diastereomers, a racemic mixture of a single diastereomer, the D- or L- gluco, manno, galacto, allo, altro, talo, gulo, ido configuration.
- the invention also relates to the use of a fluorescent compound as defined above, for, preferably in vitro and ex vivo, labelling a lipid membrane or part thereof.
- ex vivo means in the invention that which takes place outside normal biological context.
- ex vivo means in the invention that which takes place outside an organism. Specifically, ex vivo refers to experimentation or measurements done in or on tissue from an organism in an external environment with minimal alteration of natural conditions.
- Lipid membranes are complex and dynamic systems. They are formed by amphipathic lipids, consisting of polar, hydrophilic head groups and apolar, hydrophobic chains, which tend to aggregate in the lipid-water systems into specific phases such as micelles, lamellar, cubic or inverse hexagonal phases. This supramolecular phase organization is driven by the shape and concentration of the amphipathic molecule as well as the system's temperature. The lipid phase organization reflects lipid packing at the lowest energy needed to balance repulsive head group interactions and hydrophobic chains effects.
- the fluorescent compound as defined above labels solely lipids which are organized in lipid membranes. That means that the other classes of lipids are not labelled by the said fluorescent compound.
- This aspect of the invention is an important parameter for applications such as quantifying lipids organized in a lipid membrane and compared the membrane fluidity variation between two cells, as described below.
- the lipid membrane comprises lipids which are selected from the group consisting of phospholipid, sphingolipid, sterol, glycolipid, fatty acid, phosphoglyceride or a mix thereof.
- the lipid membrane comprises lipids which are selected from the group comprising phospholipid, glycerophospholipid and phosphyglyceride.
- the lipid membrane or part thereof is selected between a lipid monolayer membrane and a lipid bilayer membrane.
- Lipid bilayer membranes which constitute the majority of the biological membranes, are composed of two opposing leaflets/layers.
- the lipid membrane or part thereof is selected from the group consisting ofof liposome or biological membrane.
- liposome it is meant in the invention a closed vesicle having a lipid bilayer membrane.
- biological membrane it is meant in the invention a membrane which pertains to an organism.
- the natural lipid membrane is selected from the group consisting ofof eukaryote lipid membrane, prokaryote lipid membrane and virus lipid membrane.
- virus lipid membrane is commonly eukaryote or prokaryote lipid membrane.
- the lipid membrane or part thereof is a Gram-positive lipid membrane.
- the lipid membrane or part thereof is a eukaryote lipid membrane. More advantageously, the lipid membrane or part thereof is a cell membrane and selected from the group comprising plasma membrane, Golgi membrane, mitochondrial membrane, liposomes, nuclear envelope, endoplasmic reticulum, vesicles and chloroplasts membrane.
- vesicles it is meant in the invention both the intracellular vesicles and extracellular vesicles.
- intracellular vesicles include vacuoles, lysosomes, transport vesicles and secretory vesicles.
- extracellular vesicles include ectosomes/microvesicles and exosomes.
- the said lipid membrane is an exosome.
- the invention further relates to a method for, with preference in vitro and ex vivo, labelling a lipid membrane or part thereof comprising a step of contacting a fluorescent compound as defined above with a lipid membrane or part thereof, and a step of detecting the fluorescence of the said lipid membrane or part thereof labelled by the said fluorescent compound.
- the lipid membrane or part thereof is selected from a lipid monolayer membrane and a lipid bilayer membrane.
- the lipid membrane comprises lipids which are selected from the group comprising phospholipid, sphingolipid, sterol, glycerophospholipid, glycolipid, fatty acid, phosphoglyceride or a mix thereof.
- the lipid membrane comprises lipids which are selected from the group comprising phospholipid, glycerophospholipid and phosphyglyceride.
- the lipid membrane or part thereof is selected from the group consisting ofof liposome and biological membrane.
- the natural lipid membrane is selected from the group consisting ofeukaryote lipid membrane, prokaryote lipid membrane and virus lipid membrane.
- the lipid membrane is a eukaryote cell lipid membrane.
- the lipid membrane or part thereof is a eukaryote lipid membrane. More advantageously, the lipid membrane or part thereof is selected from the group comprising plasma membrane, Golgi membrane, mitochondrial membrane, liposomes, nuclear membrane, endoplasmic reticulum, vesicles and chloroplasts.
- the compound as described above is dissolved in solution of DMSO and/or ethanol.
- the said fluorescent compound has a concentration from 0.01 to 10 ⁇ M.
- 0.01 to 10 ⁇ M it is meant in the invention 0.01 ⁇ M, 0.02 ⁇ M, 0.03 ⁇ M, 0.04 ⁇ M, 0.05 ⁇ M, 0.06 ⁇ M, 0.07 ⁇ M, 0.08 ⁇ M, 0.09 ⁇ M, 0.10 ⁇ M, 0.11 ⁇ M, 0.12 ⁇ M, 0.13 ⁇ M, 0.14 ⁇ M, 0.15 ⁇ M, 0.16 ⁇ M, 0.17 ⁇ M, 0.18 ⁇ M, 0.19 ⁇ M, 0.20 ⁇ M, 0.21 ⁇ M, 0.22 ⁇ M, 0.23 ⁇ M, 0.24 ⁇ M, 0.25 ⁇ M, 0.26 ⁇ M, 0.27 ⁇ M, 0.28 ⁇ M, 0.29 ⁇ M, 0.30 ⁇ M, 0.31 ⁇ M, 0.32 ⁇ M, 0.33 ⁇ M, 0.34 ⁇ M, 0.35 ⁇ M, 0.36 ⁇ M, 0.37 ⁇ M, 0.38 ⁇ M, 0.39 ⁇ M, 0.40 ⁇ M
- the step of contacting a fluorescent compound as defined above with a lipid membrane or part thereof is performed during at least 30 seconds.
- said step is performed from 30 seconds to 60 hours.
- 30 seconds to 60 hours it is meant 30 seconds, 31 seconds, 32 seconds, 33 seconds, 34 seconds, 35 seconds, 36 seconds, 37 seconds, 38 seconds, 39 seconds, 40 seconds, 41 seconds, 42 seconds, 43 seconds, 44 seconds, 45 seconds, 46 seconds, 47 seconds, 48 seconds, 49 seconds, 50 seconds, 51 seconds, 52 seconds, 53 seconds, 54 seconds, 55 seconds, 56 seconds, 57 seconds, 58 seconds, 59 seconds, 60 seconds, 1 minute, 2 minutes, 3 minutes, 4 minutes, 5 minutes, 6 minutes, 7 minutes, 8 minutes, 9 minutes, 10 minutes, 11 minutes, 12 minutes, 13 minutes, 14 minutes, 15 minutes, 16 minutes, 17 minutes, 18 minutes, 19 minutes, 20 minutes, 21 minutes, 22 minutes, 23 minutes, 24 minutes, 25 minutes, 26 minutes, 27 minutes, 28 minutes, 29 minutes, 30 minutes, 31 minutes, 32 minutes, 33 minutes
- the step of detecting the fluorescence is performed by fluorimetry, fluorescence microscopy or flow cytometry.
- fluorimetry the fluorescence is typically measured by using a spectrofluorometer or a photomultiplicator.
- a spectrofluorometer is an instrument which takes advantage of fluorescent properties of some compounds in order to provide information regarding their concentration and chemical environment in a sample.
- a certain excitation wavelength is selected, and the emission is observed either at a single wavelength, or a scan is performed to record the intensity versus wavelength, also called an emission spectrum.
- the instrument is used in fluorescence spectroscopy.
- a photomultiplicator is an extremely sensitive detector of light in the ultraviolet, visible, and near-infrared ranges of the electromagnetic spectrum. These detectors multiply the current produced by incident light by as much as 100 million times or 10 8 (i.e., 160 dB), in multiple dynode stages, enabling (for example) individual photons to be detected when the incident flux of light is low.
- the step of detecting the fluorescence is performed at a temperature from -50°C to 150°C. by "-50°C to 150°C" it is meant -50°C, -49°C, -48°C, - 47°C, -46°C, -45°C, -44°C, -43°C, -42°C, -41°C, -40°C, -39°C, -38°C, -37°C, -36°C, -35°C, -34°C, -33°C, -32°C, -31°C, -30°C, -29°C, -28°C, -27°C, -26°C, -25°C, -24°C, -23°C, -22°C, -21°C, -20°C, -19°C, -18°C, -17°C, -16°C, -15°C, -14°C, -13°
- the said fluorescent compound is the compound of formula 12 or of formula 14.
- the detection step is performed by fluorimetry with an excitation wavelength at 390nm and an emission wavelength from 420nm to 520nm.
- the detection step is performed by fluorescence microscopy with an excitation wavelength at 405nm and an emission wavelength from 420nm to 520nm.
- the detection step is performed by fluorescence microscopy with an excitation wavelength at 390nm and an emission wavelength from 420nm to 520nm.
- the invention also relates to a use of a fluorescent compound as defined above, for, with preference in vitro and ex vivo, evaluating the degree of fluidity of a lipid membrane.
- Membrane fluidity depends upon lateral and rotational diffusion of lipids within a lipid membrane. Lipids acquire thermal energy when they are heated up, so that energetic lipids move around more, arranging and rearranging randomly, making the membrane more fluid. At low temperatures, the lipids are laterally ordered and organized in the membrane, and the lipid chains are mostly in the all-trans configuration and pack well together.
- the two-dimensional leaflet(s) of a lipid membrane can exist in different states known as crystalline phase, gel phase, ripple phase and fluid phase.
- the fluid phase is also called crystal liquid phase.
- lipids are highly ordered into all-trans chain conformation generating a compact lipid environment which is characterized by a large reduction in lateral lipid diffusion and low levels of membrane hydration. Lipids are tightly packed parallel to each other into a hexagonal lattice with a spacing of roughly 0.4 nm. The lipid hydrocarbons chains can be tilted with respect to the crystalline phase, thereby forming a gel phase reliant on lipid composition and hydration levels or the presence of other ions.
- thermotropic phase transition Depending on the composition of the lipid membrane, the transition between gel and fluid phase arises at a specific temperature called the thermotropic phase transition. This process is usually preceded by a so-called pre-transition inducing the formation of a ripple phase, characterized by periodic one-dimensional ripples.
- ripple phase characterized by periodic one-dimensional ripples.
- the lipids are highly disordered, and the triangular lattice order is lost with an increased lateral and rotational diffusion of the lipids.
- each lipid In a lipid monolayer membrane, each lipid is free to diffuse through the layer, and in a lipid bilayer membrane each lipid can either diffuse through the layer they belong to or switch to the counterpart layer.
- a lipid membrane in a fluid phase can be characterized by a diffusion coefficient of lipids of about 10 -8 cm 2 per second.
- a lipid membrane in gel phase can be characterized by a diffusion coefficient of lipids of about 10 -11 cm 2 to 10 -1 cm 2 per second.
- the invention further relates to a method for, with preference in vitro and ex vivo, evaluating the degree of fluidity of a lipid membrane, said method comprising the steps of:
- I gel and I lc are intensities of fluorescence measured by fluorimetry, typically by using spectrofluorometer or a photomultiplicator, from the said lipid membrane or part thereof labeled by said fluorescent compound, the measurement of said intensity I gel being performed at a wavelength characteristic of said fluorescent compound in gel lipid phase, and the measurement of said intensity I lc being performed at a wavelength characteristic of said fluorescent compound in liquid crystal lipid phase,
- Fluorescence intensities are directly obtained from the emission spectrum at the indicated wavelengths.
- the said fluorescent compound is the compound of formula 12, wherein at step b) the I gel and I lc are measured after an excitation wavelength at 385 nm, and wherein I gel is the intensity of the wavelength 440 nm and I lc is the intensity of the wavelength 490 nm.
- the said fluorescent compound is the compound of formula 14, wherein at step b) the I gel and I lc are measured after an excitation wavelength at 385 nm, and wherein I gel is the intensity of the wavelength 440 nm and I lc is the intensity of the wavelength 490 nm.
- the invention also relates to a method for in vitro and ex vivo evaluating the degree of fluidity of a lipid membrane, said method comprising the steps of:
- the said fluorescent compound is the compound of formula 12, wherein at step b) the I gel and I lc are measured after an excitation wavelength at 385 nm, and wherein I gel is the intensity of the wavelength 440 nm and I lc is the intensity of the wavelength 490 nm.
- the said fluorescent compound is the compound of formula 14, wherein at step b) the I gel and I lc are measured after an excitation wavelength at 385 nm, and wherein I gel is the intensity of the wavelength 440 nm and I lc is the intensity of the wavelength 490 nm.
- the invention also relates to a use of a fluorescent compound as defined above, for, with preference in vitro and ex vivo, quantification of lipids organized in at least one lipid membrane or part thereof in an aqueous solution.
- the invention also relates to a method for, with preference in vitro and ex vivo, quantification of lipids organized in at least one lipid membrane or part thereof in an aqueous solution, comprising the steps of:
- the said fluorescent compound is the compound of formula 12, wherein at step b) the I lc is measured after an excitation wavelength at 385 nm, and wherein I lc is the intensity of the wavelength 490 nm.
- the said fluorescent compound is the compound of formula 14, wherein at step b) the I lc is measured after an excitation wavelength at 385 nm, and wherein I lc is the intensity of the wavelength 490 nm.
- the calibration curve of the intensity of fluorescence is obtained with a lipid membrane of the same nature as the tested at least one lipid membrane.
- the calibration curve is obtained with several known concentrations of a lipid membrane for which the intensity of fluorescence is measured. Each obtained intensity fluorescence is then plotted on a graph for the respective concentration.
- the position of the maximum fluorescence emission largely depends on the order state of the lipid membrane. This characteristic, which makes them valuable for determining the order state of the membrane may be inconvenient when sample fluidity does not match that of the standard solution. Therefore, the fluorescence intensity parameter can be replaced by the surface under the peak, which does not depend on the fluidity state of the lipid membrane.
- the surface under the peak also called surface under the curve or surface under the spectrum, corresponds to the area under the curve of the fluorescence intensity.
- the invention also relates to a method for, with preference in vitro and ex vivo, quantification of lipids organized in at least one lipid membrane or part thereof in an aqueous solution, comprising the steps of:
- the said fluorescent compound is the compound of formula 12, wherein at step b) an excitation wavelength at 385 nm is used.
- the said fluorescent compound is the compound of formula 14, wherein at step b) an excitation wavelength at 385 nm is used.
- the said two limit wavelengths advantageously surround the wavelength I gel characteristic of said fluorescent compound in gel lipid phase. More advantageously, a first wavelength I 1 is chosen with I 1 > I gel + 10 nm, and a second wavelength I 2 is chosen with I 2 ⁇ I gel -10nm .
- the calibration curve of the surface under the peak is also obtained with a lipid membrane of the same nature as the tested at least one lipid membrane, and the intensities of fluorescence are determined between the same two limit wavelengths.
- the calibration curve is obtained with several known concentrations of a lipid membrane for which the surface under the peak is calculated. Each obtained value of surface under the peak is then plotted on a graph for the respective concentration.
- the invention also relates to a use of a fluorescent compound as defined above, for, with preference in vitro and ex vivo, diagnosis of a cancer in an individual.
- Biological membrane of cancer cells mostly present a different degree of fluidity from their normal counterparts.
- the compound as defined above can in one hand be used for in vitro labelling cell membrane, and on the other hand can be used to finely determined a difference of the degree of fluidity between two lipid membrane, it becomes possible to diagnosis cancer in an individual by the measure of the lipid membrane fluidity of a cell membrane.
- cancer it is meant in the invention any type of cancer, i.e. solid tumours, leukaemia and lymphoma.
- cancer include lymphoma, melanoma, breast cancer, lung cancer, liver cancer, bladder cancer, cervical cancer, prostate cancer, gastric cancer, leukemia, head cancer, head and neck cancer, colorectal cancer, kidney cancer, colon cancer, ovarian cancer, testicular germ cell tumors, all sarcoma, neuroblastoma and glioblastoma such as glioblastoma in Li-Fraumeni syndrome and sporadic glioblastoma, malignant melanomas, pancreatic ductal adenocarcinomas, myeloid leukemia, acute myelogenous leukemia, myelodysplastic syndrome, myeloproliferative syndrome, gynaecological cancer, Kaposi's sarcoma, Hansen's disease and collagenous colitis.
- the said fluorescent compound is the compound of formula 12.
- the said fluorescent compound is the compound of formula 14.
- said diagnosis is of a metastasis state of cancer.
- Methodastasis it is meant in the invention the propagation of cancer from the organ where it started to a different organ. It generally occurs through the blood or lymphatic system.
- the cancer cells spread and form a new tumour, the latter is called a secondary or metastatic tumour.
- the cancer cells forming the secondary tumour are like those of the original tumour. If a breast cancer, for example, spreads (metastasizes) to the lung, the secondary tumour is formed of malignant breast cancer cells.
- the disease in the lung is metastatic breast cancer and not lung cancer.
- the invention also relates to a use of a fluorescent compound as defined above, for, with preference in vitro and ex vivo, diagnosis of a neurodegenerative disease, such as Parkinson and Huntington's chorea, schizophrenia, Niemann-Pick disease or cardiovascular diseases in an individual.
- a neurodegenerative disease such as Parkinson and Huntington's chorea, schizophrenia, Niemann-Pick disease or cardiovascular diseases in an individual.
- the invention further relates to a method for the in vitro and ex vivo diagnosis of a cancer in an individual, said method comprising the steps of:
- the said fluorescent compound is the compound of formula 12, wherein at step b) the I gel and I lc are measured after an excitation wavelength at 385 nm, and wherein I gel is the intensity of the wavelength 440 nm and I lc is the intensity of the wavelength 490 nm.
- the said fluorescent compound is the compound of formula 14, wherein at step b) the I gel and I lc are measured after an excitation wavelength at 385 nm, and wherein I gel is the intensity of the wavelength 440 nm and I lc is the intensity of the wavelength 490 nm.
- sample it is meant in the invention a biological material isolated from an individual.
- the biological sample may contain any biological material suitable for labelling lipid membrane.
- the sample can be isolated from any suitable biological tissue or fluid.
- tissues include tissue obtained from a patient's brain, gastrointestinal tract, lung, pancreas, liver, skin, kidney, eye, heart, blood vessels, lymph nodes, spine, and skeletal or smooth muscle.
- fluids include blood, blood plasma, serum, urine or cerebral spinal fluid (CSF).
- step d) it is concluded that said individual is afflicted by a cancer if said GP is lower than at most 0.99xGP R , or concluding that said individual is not afflicted by a cancer if said GP is equal or higher than said at most 0.99xGP R .
- 0.99 0.98, 0.97, 0.96, 0.95, 0.94, 0.93, 0.92, 0.91, 0.90, 0.89, 0.88, 0.87, 0.86, 0.85, 0.84, 0.83, 0.82, 0.81, 0.80, 0.79, 0.78, 0.77, 0.76, 0.75, 0.74, 0.73, 0.72, 0.71, 0.70, 0.69, 0.68, 0.67, 0.66, 0.65, 0.64, 0.63, 0.62, 0.61, 0.60, 0.59, 0.58, 0.57, 0.56, 0.55, 0.54, 0.53, 0.52, 0.51, 0.50, 0.49, 0.48, 0.47, 0.46, 0.45, 0.44, 0.43, 0.42, 0.41, 0.40, 0.39, 0.38, 0.37, 0.36, 0.35, 0.34, 0.33, 0.32, 0.31, 0.30, 0.29, 0.28, 0.27, 0.26, 0.25, 0.24, 0.23, 0.22, 0.21, 0.20, 0.19
- the said cell membrane is an exosome, obtained from blood.
- the invention also relates to a use of a fluorescent compound as defined above, for in vitro and ex vivo diagnosis of the response to a therapeutic treatment of a patient afflicted with a cancer, said therapeutic treatment being directed to said cancer.
- the said fluorescent compound is the compound of formula 12.
- the said fluorescent compound is the compound of formula 14.
- treatment it is meant in the invention any type of therapy, which aims at terminating, preventing, ameliorating or reducing the susceptibility to a clinical condition as described herein.
- the term treatment relates to prophylactic treatment (i.e. a therapy to reduce the susceptibility to a clinical condition), of a disorder or a condition as defined herein.
- prophylactic treatment i.e. a therapy to reduce the susceptibility to a clinical condition
- treatment treating
- treating and their equivalent terms refer to obtaining a desired pharmacologic or physiologic effect, covering any treatment of a pathological condition or disorder in a mammal, including a human.
- treatment includes (1) preventing the disorder from occurring or recurring in a subject, (2) inhibiting the disorder, such as arresting its development, (3) stopping or terminating the disorder or at least symptoms associated therewith, so that the host no longer suffers from the disorder or its symptoms, such as causing regression of the disorder or its symptoms, for example, by restoring or repairing a lost, missing or defective function, or stimulating an inefficient process, or (4) relieving, alleviating, or ameliorating the disorder, or symptoms associated therewith, where ameliorating is used in a broad sense to refer to at least a reduction in the magnitude of a parameter, such as inflammation, pain, or immune deficiency.
- a parameter such as inflammation, pain, or immune deficiency
- the invention finally relates to a method for in vitro and ex vivo evaluation of the response to a therapeutic treatment of a patient afflicted with a cancer, said therapeutic treatment being directed to said cancer, said method comprising the steps of:
- the said fluorescent compound is the compound of formula 12, wherein at step b) the I gel and I lc are measured after an excitation wavelength at 385 nm, and wherein I gel is the intensity of the wavelength 440 nm and I lc is the intensity of the wavelength 490 nm.
- the said fluorescent compound is the compound of formula 14, wherein at step b) the I gel and I lc are measured after an excitation wavelength at 385 nm, and wherein I gel is the intensity of the wavelength 440 nm and I lc is the intensity of the wavelength 490 nm.
- step d) it is concluded that said patient is considered to be responsive to the said therapeutic treatment if GP is higher than at most 0.99xGP R , or concluding that patient is not considered to be responsive to the said therapeutic treatment if GP is equal or higher than said at most 0.99xGP R .
- 0.99 0.98, 0.97, 0.96, 0.95, 0.94, 0.93, 0.92, 0.91, 0.90, 0.89, 0.88, 0.87, 0.86, 0.85, 0.84, 0.83, 0.82, 0.81, 0.80, 0.79, 0.78, 0.77, 0.76, 0.75, 0.74, 0.73, 0.72, 0.71, 0.70, 0.69, 0.68, 0.67, 0.66, 0.65, 0.64, 0.63, 0.62, 0.61, 0.60, 0.59, 0.58, 0.57, 0.56, 0.55, 0.54, 0.53, 0.52, 0.51, 0.50, 0.49, 0.48, 0.47, 0.46, 0.45, 0.44, 0.43, 0.42, 0.41, 0.40, 0.39, 0.38, 0.37, 0.36, 0.35, 0.34, 0.33, 0.32, 0.31, 0.30, 0.29, 0.28, 0.27, 0.26, 0.25, 0.24, 0.23, 0.22, 0.21, 0.20, 0.19
- the said cell membrane is an exosome, obtained from blood.
- Lauroylchloride and nitrobenzene were purchased from Acros. 2-bromonaphthalene, aluminium chloride, N-methylallylamine, 2-dicyclohexylphosphino2'4'6'triisopropylbiphenyl (X-Phos), Palladium acetate (Pd (Ac)2), N-methylmorpholine oxide monohydrate, catalytic OsO4 2.5% solution in tert-butanol and anhydrous dioxane were purchased from Sigma-Aldrich. Potassium tert-butanolate was purchased from Lancaster. Nitrobenzene and anhydrous dioxane were used without further purification. Flash chromatographies were performed on silica gel purchased from Acros Organics.
- 2-bromonaphthalene (2g, 9.7 mmol) was dissolved in 9.6 mL of nitrobenzene under an Argon atmosphere. The solution was stirred in an ice bath. Lauroylchloride (2.8 mL, 11.64 mmol, 1.2 equiv.) was added drop wise. The reaction mixture was treated with aluminium chloride (1.4 g, 10.67 mmol, 1.1 equiv.) and stirred at room temperature for at least 18 hours. The reaction mixture was quenched with distilled water and extracted three times with ethylacetate. The organic phases were combined, washed with brine, dried over sodium sulphate and concentrated under reduced pressure.
- N-methylallylamine 64 ⁇ L, 0.668 mmol, 1.3 equiv.
- anhydrous dioxane 1.5 mL
- the mixture was heated to 100°C in an oil bath and stirred for 15 hours.
- the mixture was cooled down to room temperature, diluted with ethylacetate, filtered through Celite and concentrated under reduce pressure to obtain a brown solid product.
- the final product is pure at 80%.
- the NMAAL (80 % purity) product is disposed in 25 mL glassware. 5 mL of acetone, 2 mL of water, 141 mg of N-methylmorpholine oxide monohydrate and 50 ⁇ L of catalytic OSO 4 (100 ⁇ L of a 2.5% solution in tert -butanol) are added and the reaction is stirred overnight at room temperature. The mixture is then diluted in ethylacetate, extracted with water (2x30 mL) and washed with brine (30 mL). The organic phase is dried over magnesium sulphate and concentrated under reduce pressure to obtain a crude product purified by flash chromatography on silica gel.
- Elution is carried first with 100 mL of ethylacetate/petroleum ether (10/90) to eliminate contaminants, then with 100 mL ethylacetate/petroleum ether (50/50) to eliminate intermediate products of reaction and finally with 100 mL of ethylacetate 100% for the recuperation of a dark green pure final product (18.7 mg, yield 41.7 %).
- DIOLL probe was synthesis as described in Example 1.
- Laurdan was purchased from GE healthsicences and C-Laurdan was synthesized as described below.
- Lipids were purchased from Avanti Polar Lipids (Alabaster, Al). PBS was purchased from Sigma-Aldrich. Ultrapure water was obtained with a PureLabOption Q7 system (Veolia Water STI, Decines, France).
- Fetal bovine serum was purchased from Eurobio (ref: CVFSVF 00-01), Dulbecco's Modified Eagle's Medium/ Nutrient Mixture F-12 (DMEM/F-12) nutrient mixture (Ham) (ref: 31331-028) and penicillin-streptomycin were purchased from Gibco, human epidermal growth factor (EGF) was purchased from Promocell and insulin was purchased from NovoRapid.
- FBS Fetal bovine serum
- DMEM/F-12 Dulbecco's Modified Eagle's Medium/ Nutrient Mixture F-12
- Ham nutrient mixture
- penicillin-streptomycin were purchased from Gibco
- human epidermal growth factor (EGF) was purchased from Promocell and insulin was purchased from NovoRapid.
- Dil is purchased from life technologies (ref: M7513), Er-tracker is purchased from life technologies, Mito tracker is purchased from life technologies.
- Fluorescence measurements were performed with a Hitachi F4500 fluorometer. Excitation and emission slits were fixed at 5 nm and spectra were recorded at 25°C using a 1 cm path length thermostated quartz micro-cuvette. 0.26 mM solutions of the probes were prepared in a dichloromethane: methanol mixture (3: 1 volume ratio). Measurements were performed with 2.6 mM probes diluted in the different solvents (see Table 1 ). The initial solvent of the stock solution thus represents 1% of the final volume.
- Liposomes were prepared in PBS buffer using a classical freeze/though protocol. In brief, lipids dissolved in chloroform were dried under vacuum. The lipid film formed was rehydrated with the PBS solution and agitated until the complete suspension of the lipid film. The vesicle solution was then submitted to 6 freeze/thaw (5 min in liquid nitrogen/ 10 min in 37°C water bath) cycles and then extruded 19 times sequentially trough 400 nm and 200 nm polycarbonate membranes (Avanti Polar Lipids Liposome Extruder). The 200 nm liposome suspension was stored at 4°C.
- Fluorescence data was obtained using a Hitachi F4500 fluorometer. Emission spectra were recorded between 420 and 600 nm with an excitation wavelength fixed at 385 nm and 5 nm excitation and emission slits. Ethanol solutions of fluorescent probes were prepared and added to liposomes at a 1: 400 (probe: phospholipid) molar ratio. Liposomes were used at a 40 ⁇ g.mL -1 final concentration. Measurements were done at 21°C for all liposome compositions indicated in Table 2, except for DMPC where a range of temperature from 5 to 65°C was also applied.
- Fluorescence measurements were performed with an LSR Fortessa. Cells passing in front of the laser were exited with a laser of 405 nm and the filters 450/50 and 525/50 were used to respectively observed the rigid state intensity and fluid state intensity. Like the spectrofluorometer, Ethanol solutions of Dioll were prepared and added to liposomes at a 1: 400 molar ratio. Liposomes were used at a 40 ⁇ g.mL -1 final concentration. Measurements were done at 21°C for all liposome composition indicated in Table 2. Data processing was effectuated on FlowJo.
- HMECs Human mammary epithelial cells
- DMEM Dulbecco's Modified Eagle's Medium
- HAMF12 medium Gibco
- FBS fetal bovine serum
- Ibco penicillin-streptomycin
- 10 ng.mL -1 human epidermal growth factor (EGF) Promocell
- 262 mU.mL -1 insulin NovoRapid
- 0,5 ⁇ g.ml -1 hydrocortisone Sigma
- Plasmid Plasmid membrane (Dil), endoplasmic reticulum (ER tracker), mitochondria (Mito tracker)
- ER tracker Endoplasmic reticulum
- Mito tracker mitochondria
- Nuclear stain was injected automatically in the chamber after dioll fluorescence recording.
- the images were taken using a Zeiss LSM 880 AxioObserver inverted spectral confocal microscope. This is a spectral confocal microscope on stand with incubation chamber with environmental control temperature, CO 2 and hygrometry.
- the light source is a laser diode.
- the objective is an alpha Plan-Apochromat 63x/1.46 Oil DIC M27.
- Dioll excitation wavelength was 405 nm and the emission wavelength was a band from 424nm to 513nm.
- spectral mode acquisition excitation wavelength was 405 nm and images were taken at 424, 432, 441, 450, 459, 468, 477, 486, 495, 504, 513 nm emission wavelength.
- the excitation wavelength was 561 nm and detection wavelength was 611 nm.
- the excitation wavelength was 561 nm and emission wavelength was 621 nm.
- the excitation wavelength was 405nm and emission wavelength was 430nm
- a composite image was created from the image obtained with the Dioll and the image obtained with one of the specific subcellular markers (Dil, ER-tracker, Mito tracker) to precisely identify areas were the probed colocalized.
- the emission intensity values in the 440 and 490 nm channels were measured using ImageJ after background correction for the areas identified.
- GP values were calculated from at least 5 independent measurements.
- DIOLL probe a comparison with Laurdan and C-Laurdan probes in organic solvents of increasing polarity
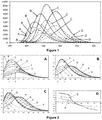
- C-Laurdan and DIOLL probe perfectly respond to this requirement as shifts in the maximum emission wavelength are recorded with the increasing solvent polarity (416 nm and 425 nm in toluene, 432 and 441 nm in chloroform, 450 and 460 nm in DMSO and 485 nm and 486 nm in ethanol, for C-Laurdan and DIOLL probe, respectively).
- Table 1 Maximum emission wavelength of Laurdan, C-Laurdan and DIOLL probe in organic solvents of increasing polarity.
- Fluorescence intensity is however very different for the two Laurdan analogues, with Dioll remarkably showing a high fluorescence intensity, going from 1.5 to 2 fold higher than for Laurdan whatever the solvent used.
- C-Laurdan shows very low fluorescence intensities: 1.3 to 10 times lower than that of Laurdan (hypochromic effect).
- the good fluorescence yield recorded for DIOLL probe makes it a good candidate for microscopy and spectroscopy applications.
- DMPC 1,2-dimyristoyl-sn-glycero-3-phosphocholine
- Dioll has a behavior similar to Laurdan, with a shift in the maximum emission wavelength from 440 nm for the gel phase to 490 nm in the liquid crystalline phase ( Figure 3C ). Moreover, the decrease in the fluorescence intensity between the gel and the fluid phase is more limited than for Laurdan with a gel over liquid crystalline ratio of 0.8 vs 0.6 for Laurdan.
- GP Generalized Polarization
- Dioll and Laurdan show a large difference in GP values between the ordered/gel and disordered/liquid crystalline states. This property is of importance for microscopy use where a clear-cut separation of fluorescence coming from gel and liquid crystalline phases is required for visualization of membranes in different states.
- Dioll As membrane fluidity state is determined by lipid acyl chain length and unsaturation, the inventors checked whether Dioll was equally able to render variations in membrane state depending on lipid characteristics. Therefore, Dioll was inserted in liposomes constituted of phosphatidylcholines with different melting temperatures, dictated by different chain length and unsaturation (ranging from 14 to 18 carbons for the chain length and from 0 to 2 for the chain unsaturation, respectively; Table 2 ).
- Liposome preparations used and corresponding phase transition temperatures (Tm).
- Tm Liposome preparation Lipid Acyl chain composition Schematic structure Tm DLPC 1,2-dilinoleoyl-sn-glycero-3-phosphocholine 18:2 ( ⁇ 9,12 -Cis) PC - 57°C DOPC 1,2-dioleoyl-sn-glycero-3-phosphocholine 18:1 ( ⁇ 9 -Cis) PC - 17°C POPC 1-palmitoyl-2-oleoyl-glycero-3-phosphocholine 16:0-18:1 PC -4°C DMPC 1,2-dimyristoyl-sn-glycero-3-phosphocholine 14:0 PC 24°C DPPC 1,2-dipalmitoyl-glycero-3-phosphocholine 16:0 PC 41°C DSPC 1,2-distearoyl-sn-glycero
- Results plotted in Figure 3A show clear differences in the GP values according to the nature of the liposome going from the most rigid, DSPC (C18:0) with a GP value of 0.58 to the most fluid DLPC (C18:2) with a GP value of -0.26.
- GP values obtained are in correlation with Tm ranging from 55° for DSPC to -57°C for DLPC (Table 2).
- the new fluorophore proved to be an excellent tool to measure liposome fluidity by flow cytometry.
- This technique allows one to visualize and discriminate events (cells or particles) within a heterogeneous population via differences of size, granularity or fluorescence.
- the spectrofluorometer which gives a bulk fluorescence spectrum and thus a bulk value of GP
- flow cytometry one may obtain the GP parameter of individual particles in a heterogeneous population.
- the correlation GP and fluidity state observed through spectroscopy is also found with a flow cytometer.
- the entire fluidity range is discriminated with the DSPC liposomes, theoretically the most rigid at 21°C, which has a lowest ratio 525/450, while the DLPC liposomes which the most fluid has a highest ratio 525/450.
- HMEC cells were incubated with DIOLL probe for 48h and then observed by confocal microscopy. Fluorescence images were recorded each 10 nm from 425 to 512 nm (excitation 405 nm). Dioll labeled uniformly all cell membranes, yet the fluorescence profile was different for each emission channel, with membrane structures that were more intensively labeled in the blue edge and others in the red edge of the spectrum. An overlay of images obtained is shown in Figure 4 , where one clearly distinguishes different shades of grey corresponding to the sum of different fluorescence intensities obtained in each channel.
- Dioll fluorescence co-localized at the plasma membrane level with membrane label Dil.
- Dioll also showed a good co-localization with ER-tracker, which is a specific label of the endoplasmic reticulum. It also co-localized with Mito-tracker, a specific label of mitochondria.
- Dioll perfectly labels membrane structures of the nucleus. Nuclear content was labeled with Hoechst.
- GP values were estimated from the relative intensities at 440 and 490 nm for each type of membrane identified above ( Figure 5 ).
- High GP values (0.05 ⁇ 0.03) were obtained for plasma membrane structures (A). This is in line with literature data concerning plasma membrane composition, with a high percentage of sphingomyelin and cholesterol. Indeed, sphingolipids are lipids with high melting temperature and this type of lipids are expected to give stiffness to bilayers.
- membranes of endoplasmic reticulum (B), mitochondria (C) and nucleus (D) are rather fluid with GP values of -0.14 ⁇ 0.06, -0.18 ⁇ 0.02 and -019 ⁇ 0.04, respectively.
- Endoplasmic reticulum displays extremely low concentrations of sterols and complex sphingolipids, despite being the main site of synthesis.
- the loose packing of endoplasmic reticulum membrane lipids is consistent with the function of the organelle in the insertion and transport of newly synthesized lipids and proteins.
- cholesterol and sphingolipid content is also low.
- the major lipid constituents are phosphatidylcholine and phosphatidylethanolamine, which account together for about 80% of total phospholipids.
- Cardiolipin is present in the range of 10-20% of total mitochondrial phospholipids.
- mitochondrial fatty acids In mammalian cells, approximately 50% of mitochondrial fatty acids are unsaturated, linoleic acid (18:1), linolenic acid (18:2) and arachidonic acid (20:4) being the most prominent fatty acids, which gives mitochondrial membranes a very high fluidity also reported with DIOLL probe fluorescence.
- Example 3 Quantification of lipid membranes in aqueous solutions
- Liposomes various supported or tethered bilayers, monolayers, bicelles, to name only some, are largely used systems to mimic plasma and organelle membranes.
- liposomes are widely used to probe protein-lipid interactions, lipid organization and molecule penetration across membranes. They are also versatile assemblies in drug delivery systems, as they are non-toxic, biodegradable, and readily produced on a large scale. They are also extensively used for the reconstitution of transmembrane proteins, to form proteoliposomes, the lipid bilayer offering a native-like medium for membrane-spanning domains. For all these applications, liposomes undergo various fabrication processes: extrusion, centrifugation, protein reconstitution, cell-free protein synthesis, molecule grafting, etc. It is therefore of interest to determine lipid concentrations after various processes and in different production batches.
- colorimetric methods such as Bartlett. and Rouser. methods are based on the reaction between the inorganic phosphate obtained after liposome treatment with perchloric acid and ammonium molibdate to obtain phosphomolibdate.
- a reducing agent such as 1-amino-2-naphtol-4 sulfonic acid (Bartlett method) and ascorbic acid (Rouser method) leads to formation of a violet complex absorbing at 820-830 nm. Both methods are rather sensitive (LOD and LOQ around 5 and 20 ⁇ g.ml -1 , respectively).
- the Stewart method ( Stewart, Analytical Biochemistry 104, 10-14 (1980 )) probably the most widely used method for phospholipid determination, is based on the formation of a complex between the phosphate group of the lipid polar head and ammonium ferro-thiocyanate, absorbing at 485 nm. It is rather fast and easy to implement, but requires lipid extraction in organic solvent and the use of chloroform-resistant recipes and protection. LOD and LOQ methods are evaluated at 10 ⁇ g.ml -1 and 100 ⁇ g.ml -1 , respectively.
- DIOLL probe was synthesis as described in Example 1.
- Lipids were purchased from Avanti Polar Lipids (Alabaster, Al). Hepes, PBS, NaCl, ferric chloride hexahydrate (FeCl 3 (H 2 O) 6 ) and ammonium thiocyanate (NH 4 SCN) were purchased from Sigma Aldrich (St Quentin Falavier, France). Ultrapure water was obtained with a PureLabOption Q7 system (Véolia Water STI, Decines, France).
- Liposomes were prepared using a classical freeze/thaw protocol. Briefly, the appropriate lipid mixture solubilized in chloroform was dried under vacuum, then solubilized with 1 ml buffer under strong agitation. Assays were done either in HEPES 20 mM pH 7.4 buffer 100 mM NaCl or in PBS. The liposome emulsion obtained was submitted to 6 freeze/thaw cycles (5 min in liquid nitrogen/10 min in a water bath at 37°C, 1 minute strong agitation) to decrease the number of bilayers and obtain unilamellar vesicles.
- the liposome solution was extruded successively through a 400 nm and 100 nm polycarbonate membrane using an extruder (Avanti Polar Lipids). Liposomes were routinely prepared at lipid concentrations between 1 and 10 mg.ml -1 and subsequently diluted at the desired concentration.
- a POPC solution of known concentration 100 ⁇ g.ml -1 was used as standard. Increasing volumes of the standard solution were diluted with buffer in a 96 well plate (Nunc). The final volume per well was 200 ⁇ l and lipid concentrations between 0 and 80 ⁇ g.ml -1 were used. Samples were prepared in parallel to a final volume of 200 ⁇ l per well.
- the fluorescence spectra of 2 ⁇ M Dioll in aqueous buffer were recorded in the absence of liposomes and the surface under the curve was calculated to estimate the blank value on 5 independent measurements.
- LOD and LOQ were calculated as 3 times or 10 times the standard deviation of the blank, respectively.
- Sensitivity was estimated from the slope of the linear fit for low liposome concentrations. As the fluorescence intensity is dependent on the instrument used, in this study the inventors estimated that an increase of 100 A.U. in the fluorescence intensity obtained with TECAN InfiniteM200 was significant.
- CV coefficient of variation
- lipids were extracted from the various samples with chloroform.
- aqueous samples were mixed with chloroform (10 times the volume of the sample) under vigorous shaking.
- the samples were then centrifuged at 300 x g for 10 min to accelerate phase separation (Multifuge 3 LR, Heraeus).
- the chloroform (bottom) phase was recovered with a glass pipette.
- a POPC standard solution was prepared at 100 ⁇ g.ml -1 in chloroform. Increasing volumes of the standard solution were diluted with chloroform in glass centrifuge tubes to a final volume of 2 ml. Samples extracted in chloroform were prepared in parallel and diluted to 2 ml. 2 ml of Ferrothiocyanate solution (obtained by mixing 20.7 g of Ferric chloride hexahydate and 30.4 g of ammonium thiocyanate in 1L of ultrapure water) was added to each tube. The solutions were vigorously mixed and then centrifuged at 300 x g for 10 min (Multifuge 3 LR, Heraeus).
- the chloroform (bottom) phase was recovered with a glass pipette and the absorbance was measured at 485 nm in glass cuvettes with a Jasco V-730 spectrophotometer. For quantification absorbance at 485 nm was plotted against phospholipid concentration.
- HMEC culture medium 120 ml were collected after two days of culture, and centrifuged at 2 000 x g at 4°C during 10 min (Multifuge 3LR HerausTM). Supernatants were collected and ultracentrifuged at 20 000 x g, 4°C during 30 min (Optima LE-80 BeckmanTM with a fixed rotor angle 50.2 Ti BeckmanTM). A second ultracentrifugation was realized at 100 000 x g, 4 °C during 2 h.
- Pellets were resuspended with 1 mL of PBS buffer, regrouped in the same tube and ultracentrifuged at 100 000 x g, 4 °C during 1 h. Finally, the pellet was resuspended in 200 ⁇ L of PBS buffer to obtain concentrated exosomes.
- Giant Plasma Membrane Vesicles were prepared according to previously described protocol ( Baumgart, T. et al. Large-scale fluid/fluid phase separation of proteins and lipids in giant plasma membrane vesicles. Proc. Natl. Acad. Sci. (2007). doi:10.1073/pnas.0611357104 ) but adapted to PC-3 cell culture.
- PC-3 were cultured in RPMI-1640 10% FBS 100 U/mL penicillin and 100 ⁇ g/mL streptomycin under a humidified atmosphere of 5% CO 2 at 37°C at 80 % cell confluence in 25 cm 2 plastic flasks.
- Fluorescence intensity at 490 nm as a function of the lipid concentration in the well showed a hyperbolic evolution.
- the position of the maximum fluorescence emission largely depends on the order state of the lipid membrane. This characteristic, which makes them valuable for determining the order state of the membrane, is an inconvenient when sample fluidity does not match that of the standard solution. Therefore, to overcome this inconvenient, the fluorescence intensity parameter was replaced by the surface under the peak, which does not depend on the fluidity state of the membrane.
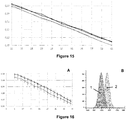
- the surface under the peak was estimated by integrating the spectra obtained between 420 and 560 nm using an Excel complementary function, IntegralP (www.fordom.free.fr). When plotted as a function of the liposome concentration, the surface under the peak also nicely fits a hyperbolic function ( Figure 6C ). Therefore, the hyperbolic dependency between the surface under the experimental fluorescence emission spectra and the liposome concentration in the well can be used as a calibration curve to measure liposome concentration in various samples.
- the limit of detection (LOD), the lowest concentration that can be detected but not quantified, and the limit of quantification (LOQ), the lowest concentration that can be quantified with a reasonable degree of confidence, of the calibration curve were determined from the standard deviation of the blank solution (2 ⁇ M Dioll in buffer) ( Table 3).
- the LOQ corresponded to a lipid concentration of 1.2 ⁇ g.ml -1 obtained for 10 times the standard deviation of the blank.
- the sensitivity of the detection method is defined as the dependency between the instrumental response and the variation in the concentration of the compound of interest. It is instrument-dependent. In our conditions, the slope of the linear part was equal to 10 5 A.U (arbitrary unit). per concentration unit ( ⁇ g.ml -1 ). That means that, considering that the sensitivity limit of TECAN InfiniteM200 used in this study is 100 A.U., one can detect variations in liposome concentration of the sample as low as 1 ng.ml -1 .
- the repeatability of the method which represents the determination of how close values are to each other, under identical experimental conditions, was assessed by determination of the concentration of a POPC liposome solution prepared independently of the standard solution. A concentration of 914 ⁇ 56 ⁇ g ml -1 was obtained with 3 replicates, which gave a repeatability of 6 %.
- the same POPC liposome solution was measured using the largely used Stewart method. A difference of 1.2 % was obtained between mean values obtained with the two methods. Results were therefore consistent and opened the possibility to routinely use the DIOLL as a probe to measure lipid membrane amount in various samples, without lipid extraction and in a rather short time (less than 30 min).
- DMPC 1,2-dimyristoyl-sn-glycero-3-phosphocholine
- DPPC 1,2-dipalmitoyl-glycero-3-phosphocholine
- Table 4 Liposome preparations used and corresponding phase transition temperatures (Tm)
- Tm Liposome preparation Lipid Acyl chain composition Schematic structure Tm POPC 1-palmitoyl-2-oleoyl-glycero-3-phosphocholine 16:0-18:1 PC -4°C DMPC 1,2-dimyristoyl-sn-glycero-3-phosphocholine 14:0 PC 24°C DPPC 1,2-dipalmitoyl-glycero-3-phosphocholine 16:0 PC 41°C
- DMPC gel to liquid crystalline transition temperature (Tm) of 23°C
- Tm 41°C liquid ordered-liquid disordered transition
- DPPC Tm 41°C
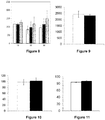
- Cholesterol is one major component of membranes and also a major modulator of membrane order. Depending on membranes, the proportion of cholesterol varies between 10 and 30 % of lipid total mass. Liposomes containing a mixture of POPC and cholesterol where prepared and the concentration was measured using Dioll method and POPC liposomes of known concentration as a standard curve. The concentration obtained for 10, 20 and 30 % cholesterol correlated well with the concentration of phospholipids obtained using the Stewart method ( Figure 8 , white and black bars), but not with the total amount of lipids (if one takes into account 10, 20 or 30 mass % of cholesterol in the sample) ( Figure 8 , dotted bars).
- Membranes contain non negligible amounts of negatively charged lipids with precise and fundamental functions. It is thus of interest to check the robustness of the Dioll-based quantification method towards negatively charged lipids.
- the inventors have chosen to prepare liposomes containing 50 % POPC and 50 % POPS (1-palmitoyl-2-oleoyl-glycero-3-phosphoserine). The concentration of the prepared liposome solution was estimated either by the Dioll-based method, with POPC liposomes of known concentration as standard curve, either by the Stewart method with POPC chloroform solution as standard ( Figure 9 ). The two methods very nicely correlated.
- the new fluorescence-based quantification method of membrane proved to be robust with respect to the order state of the membrane.
- a simple standard curve such as plain liposomes of increasing concentration and a constant fluorophore concentration, one can determine membrane amount in samples of different compositions: DMPC, DPPC, cholesterol-containing liposomes or negatively charged liposomes.
- Exosomes are small vesicles (50 to 150 nm) secreted by cells, specific of their origin cell and which can be extracted from numerous body fluids (blood, urine). They are therefore of interest for studies of pathologies, but also for the development of non-invasive diagnostic tools, notably in oncology. Measuring exosome concentration rapidly, with small sample volumes and in a non-destructive manner is of growing interest. Therefore, the inventors adapted the Dioll-based quantification method to this type of vesicles. A standard curve based on POPC liposomes of known concentration in the presence of a constant Dioll concentration (2 ⁇ M) was recorded as the surface under the curve vs. liposome concentration in the well, as described above.
- GPMVs are derived from biological cells, by chemically induced (here with 25 mM formaldehyde, 2 mM DTT in PBS) plasma membrane vesiculation or "blebbing".
- the inventors present a new, rapid and easy to use method of lipid membrane quantification in artificial and natural vesicles based on the fluorescence of DIOLL probe.
- This fluorophore has a very low fluorescence in aqueous buffers, but when it spontaneously inserts into lipid bilayers its fluorescence drastically increases. the inventors checked therefore whether this was a regular increase, by incubating a constant amount of fluorophore with increasing amounts of liposomes.
- This parameter unlike the fluorescence intensity, does not depend on the membrane fluidity and may serve as a universal parameter to quantify membranes.
- Detection and quantification limits of the POPC standard curve attained values as low as 0.4 and 1.2 ⁇ g.ml -1 , comparable with those of Bartlett and Stewart methods, which allows one to quantify low amounts of biological samples.
- a fluorophore is inserted into the bilayer, this method is not destructive and liposomes, proteoliposomes or diverse vesicles may be used for further applications.
- the sensitivity of the method was good up to 40 ⁇ g.ml -1 . Above this value, the intensity of fluorescence reaches a plateau and samples require dilutions.
- the sensitivity of the method depends on the instrumental response to the variation in the analyte concentration, therefore it is instrument-dependent. In our conditions, by using an instrument such as TECAN InfiniteM200, the inventors detect variations in the liposome concentrations the range of 1 ng.ml -1 .
- Dioll fluorescence can be used as a parameter to measure the amount of phospholipid membranes in complex samples without solvent extraction and that by using simple liposome compositions as standards.
- the detection method based on fluorescence, is fast (less than 30 min with a plate reader, less than 1h with a classical fluorimeter), simple to use, sensitive and realizable with standard lab equipment
- DIOLL probe was synthesis as described in Example 1.
- MCT Medium chain triglycerides, MCT (Miglyol®812) purchased from CREMER OLEO GmbH & Co. KG (Hamburg, Germany) was used as the oil phase.
- Polyoxyethylene (40) stearate (Myrj®52) from Sigma-Aldrich (St Quentin-Fallavier, France) and oleoyl polyoxyl-6 glycerides (Labrafil®M1944CS) from Gattefosse (Saint-Priest, France) were used as nonionic surfactants.
- the aqueous phase used to prepare emulsions was sodium phosphate buffer solution (5 mM; pH 7.4).
- Tacrolimus (FK-506) was purchased from LC Laboratories (Woburn, MA, USA). Hydrochloric acid 37%, AnalaR NORMAPUR® Reag. Ph. Eur. was from VWR International (Fontenay-sous-Bois, France). Dichloromethane, methanol, acetonitrile (HPLC grade), dodecyl sulfate sodium salt pure, sodium taurocholate hydrate 96% and sodium hydroxide were purchased from Fisher Scientific (Illkirch, France). Egg phospholipids with 70% phosphatidylcholine (Lipoid E80S) were from Lipoid GmbH (Ludwigshafen am Rhein, Germany).
- Acetic acid was obtained from Chem-Lab NV (Zedelgem, Belgium).
- Maltodextrin MD Glucidex® 12D
- TR trehalose 100
- Milli-Q water used as the aqueous phase to prepare all solutions and emulsions, was obtained using a Milli-Q Academic System (Millipore, Saint Quentin, Yvelines France).
- Nanoemulsions were prepared by emulsion phase inversion (EPI) technique.
- the oil phase was prepared by mixing the oil (MCT) and surfactants (Polyoxyethylene (40) stearate: S1; and oleoyl polyoxyl-6 glycerides: S2) under magnetic stirring (750 rpm) at 80°C.
- the aqueous phase PBS 5 mM
- stirring was performed using a rotor-stator disperser (T25 digital Ultra-Turrax® equipped with a S25N-8G shaft (IKA®-Werke GmbH & Co. KG, Staufen, Germany) at 11,000 rpm.
- the process was designed so that the final emulsion always had a total mass of 5 g.
- the resulting colloidal system was cooled to room temperature under magnetic stirring during 30 min.
- the fluidity of the NE shell was determined by means of DIOLL probe.
- the DIOLL probe was dissolved in ethanol (263 ⁇ M).
- NE was diluted 1:1000 (0.027% w/v).
- 10 ⁇ L of Dioll solution was added to 1 mL NE to reach a 2.6 ⁇ M final concentration of Dioll, corresponding to a Dioll-NE ratio of 1:290 (w/w)
- the sample was incubated for 20 min at room temperature.
- the fluorescence of Dioll solutions (2.6 ⁇ M) in MCT and in water, and the fluorescence of blank NE (without Dioll) were recorded.
- 10 ⁇ L of ethanol was added to 1 mL NE.
- Fluorescence data were obtained using a FP-8500 spectrofluorometer (JASCO applied science, Why, Canada).
- the excitation wavelength was 390 nm and the emission spectra were recorded between 400 and 600 nm at several temperatures ranging from 5 to 27°C in steps of 2°C and at 37°C (2.5 nm bandwidth).
- Laurdan 6-dodecanoyl-2-dimethylaminonaphthalene
- Laurdan is a polarity sensitive fluorophore commonly used for the assessment of liposomes rigidity and the study of biological membranes.
- NE solution when incubated with NE solution, its fluorescence emission spectrum was characteristic of a highly hydrophobic environment, single peak at 440 nm, suggesting that the fluorophore was inserted in the hydrophobic core of the NE.
- DIOLL probe was post-inserted in the NE shell by simple mixing the probe with the NE suspension (Dioll-NE). Insertion of Dioll in the NE shell was checked by measurements of emission spectra of controls. Due to the lack of fluorescent activity in hydrophilic environment, no fluorescence emission was detected when the probe was dissolved in water. Neither blank NE emitted fluorescence. A single peak at 440 nm was observed when Dioll was dissolved in MCT related to the radiative de-excitation of a "locally excited" state of Dioll in oil.
- Dioll hydrophobic tail could be oriented towards the NE oil core, while the hydrophilic and fluorescent naphthalene moiety could be aligned with the PEG components of S1, towards the surrounding water phase.
- NE size, Pdl and surface charge did not vary upon insertion of the probe (size: 105 ⁇ 1 nm, Pdl: 0.21, zeta potential: -18 ⁇ 1 mV).
- Example 5 Distinguishing cancer cells from healthy cells with DIOLL probe
- a large number of pathologies originate in the deregulation of cellular differentiation processes leading to the appearance of non-adapted phenotypes, a phenomenon summarized as abnormal cellular genetic plasticity such as pulmonary, hepatic or cardiac.
- the mechanisms driving these processes are complex and rely heavily on epigenetic control of the genome.
- These epigenetic controls can be influenced by environmental stresses such as infections, toxicological agents or poor nutrition, but also by intrinsic genetic alterations such as those found during tumour development.
- cancer cells have greater genetic plasticity than healthy cells.
- this plasticity which are difficult to quantify since only in vitro functional tests can measure the ability of cancer cells to modulate their differentiation program according to the signals imposed on them.
- a large amount of data from the literature suggests that the fluidity of cancer cell membranes is increased. the inventors thus assumed that, in general, the fluidity of the biological membranes could represent the degree of plasticity of the cell, thus allowing the measurement of a plasticity index based on a biophysical parameter that can easily be quantified by DIOLL probe.
- cancer cells from two different tissues, but with common characteristics allowing their comparison: the mammary gland and the prostate.
- the mammary gland and the prostate used cancer cells from two different tissues, but with common characteristics allowing their comparison: the mammary gland and the prostate.
- these characteristics it is possible to highlight the existence of different forms of tumours with varying and well-characterized degrees of dedifferentiation.
- little aggressive tumours can retain their glandular structure and on another hand, cells can retain their dependence on hormones, while conversely, the most aggressive tumours are hormone-independent and totally unstructured.
- cancer cells are no longer only dedifferentiated, but also acquire new phenotypes that are outliers in relation to their original tissue.
- These tumours testify that after having seen a sharp increase in their plasticity, the phenotype of cancer cells is fixed in an abnormal state and different from their original state, which is then a priori characterized by a reduction in their plasticity.
- the inventors In order to validate the use of the DIOLL probe to measure the genetic plasticity of cancer cells, the inventors first analyzed the expression of a genetic signature associated with this plasticity by grouping together mammary and prostate cell lines ( Figure 13 ).
- luminal cell lines show some conservation of their original mammary characteristics such as their ability to respond to hormones, while the Her2 subgroup is in an intermediate position.
- Cerlaudin-Low There is also a subgroup known as "Claudin-Low” with outlier mesenchymal differentiation.
- Table 5 summarizes the different lines studied and their known characteristics.
- Table 5 Known Mammary gland and prostate tumour cell lines and their specifications Human tumour cell lines Specifications Mammary gland MCF-7 Luminal cell lines responding to hormones, which are very close to epithelial cells ZR-75 BT20 Basal cell lines, dedifferentiated HCC1954 HCC1937 HS578T "Claudin-low" cell lines, aberrant mesenchymal differentiation MDA-MB-231 MDA-MB-436 Prostate LNCaP Hormone-sensitive epithelial adenocarcinoma epithelial cells C4-2B Cell line derived from the LNCap line, hormone-independent PC-3 Very aggressive metastatic cell line, total loss of its prostate markers, hormone-independence
- HMEC cells representing normal mammary epithelial luminal progenitors and WPMY-1 cells corresponding to the prostatic stromal compartment (presence of a normal mesenchymal phenotype).
- WPMY-1 cells corresponding to the prostatic stromal compartment (presence of a normal mesenchymal phenotype).
- membrane fluidity reflects cellular plasticity, independently of epithelial or mesenchymal character.
- GP generalized polarization
- basal cell lines also called epithelial cell lines
- HCC1954 and HCC1937 were subjected during three weeks to an aberrant mesenchymal differentiation protocol (HCC1954mes/HCC1937mes) through a combination of growth factor (TGFb at 10 ⁇ g/ml) and hormones (hydrocortisone 500nM).
- HMEC Human mammary epithelial cells
- ZEB1 Human mammary epithelial cells
- Doxycycline at 2 ⁇ g/ml can dynamically activate the expression of the transcription factor ZEB1 causing a epithelial-mesenchymal transition mechanism.
- LNCaP which is a basal cell line
- PC-3 which an aggressive metastatic cell line
- C4-2B cell line which are mesenchymal cell lines derived from LNCap
- WPMY-1 which is an epithelial and mesenchymal control cell line.
- exosomes from the HMEC cells described above were purified, as described in Example 3, in order to analyse the GP of their membrane. Regardless of the method used, spectrofluorometry ( Figure 18A ) or flow cytometry ( Figure 18B ), the inventors demonstrate that the fluidity of the membranes of these exosomes was perfectly correlated with that of the cells from which they originated, thus making them excellent witnesses of the degree of genetic plasticity of these cells.
- HMEC cells were mediated from 0 to 12 days by the ZEB1 transcription factor, leading to an evolutive phenotype from differentiated HMEC cells (0 days) to dedifferentiated HMEC cells (12 days).
Landscapes
- Health & Medical Sciences (AREA)
- Life Sciences & Earth Sciences (AREA)
- Chemical & Material Sciences (AREA)
- Immunology (AREA)
- Engineering & Computer Science (AREA)
- Molecular Biology (AREA)
- Biomedical Technology (AREA)
- Hematology (AREA)
- Urology & Nephrology (AREA)
- Physics & Mathematics (AREA)
- Biochemistry (AREA)
- Pathology (AREA)
- General Physics & Mathematics (AREA)
- General Health & Medical Sciences (AREA)
- Analytical Chemistry (AREA)
- Cell Biology (AREA)
- Biotechnology (AREA)
- Microbiology (AREA)
- Medicinal Chemistry (AREA)
- Food Science & Technology (AREA)
- Organic Chemistry (AREA)
- Chemical Kinetics & Catalysis (AREA)
- Optics & Photonics (AREA)
- Nuclear Medicine, Radiotherapy & Molecular Imaging (AREA)
- Organic Low-Molecular-Weight Compounds And Preparation Thereof (AREA)
- Investigating Or Analysing Materials By The Use Of Chemical Reactions (AREA)
- Investigating, Analyzing Materials By Fluorescence Or Luminescence (AREA)
- Medicines Containing Antibodies Or Antigens For Use As Internal Diagnostic Agents (AREA)
- Oncology (AREA)
Priority Applications (5)
| Application Number | Priority Date | Filing Date | Title |
|---|---|---|---|
| EP19306175.1A EP3795643A1 (fr) | 2019-09-23 | 2019-09-23 | Sonde fluorescente et ses applications |
| US17/762,664 US20220390458A1 (en) | 2019-09-23 | 2020-09-22 | Fluorescent probe and applications thereof |
| ES20788996T ES3064523T3 (en) | 2019-09-23 | 2020-09-22 | Fluorescent probe and applications thereof |
| EP20788996.5A EP4034603B8 (fr) | 2019-09-23 | 2020-09-22 | Sonde fluorescente et ses applications |
| PCT/EP2020/076445 WO2021058490A2 (fr) | 2019-09-23 | 2020-09-22 | Sonde fluorescente et ses applications |
Applications Claiming Priority (1)
| Application Number | Priority Date | Filing Date | Title |
|---|---|---|---|
| EP19306175.1A EP3795643A1 (fr) | 2019-09-23 | 2019-09-23 | Sonde fluorescente et ses applications |
Publications (1)
| Publication Number | Publication Date |
|---|---|
| EP3795643A1 true EP3795643A1 (fr) | 2021-03-24 |
Family
ID=68281336
Family Applications (2)
| Application Number | Title | Priority Date | Filing Date |
|---|---|---|---|
| EP19306175.1A Withdrawn EP3795643A1 (fr) | 2019-09-23 | 2019-09-23 | Sonde fluorescente et ses applications |
| EP20788996.5A Active EP4034603B8 (fr) | 2019-09-23 | 2020-09-22 | Sonde fluorescente et ses applications |
Family Applications After (1)
| Application Number | Title | Priority Date | Filing Date |
|---|---|---|---|
| EP20788996.5A Active EP4034603B8 (fr) | 2019-09-23 | 2020-09-22 | Sonde fluorescente et ses applications |
Country Status (4)
| Country | Link |
|---|---|
| US (1) | US20220390458A1 (fr) |
| EP (2) | EP3795643A1 (fr) |
| ES (1) | ES3064523T3 (fr) |
| WO (1) | WO2021058490A2 (fr) |
Family Cites Families (1)
| Publication number | Priority date | Publication date | Assignee | Title |
|---|---|---|---|---|
| AU759945B2 (en) * | 1998-08-20 | 2003-05-01 | Regents Of The University Of California, The | Methods for labeling beta-amyloid plaques and neurofibrillary tangles |
-
2019
- 2019-09-23 EP EP19306175.1A patent/EP3795643A1/fr not_active Withdrawn
-
2020
- 2020-09-22 WO PCT/EP2020/076445 patent/WO2021058490A2/fr not_active Ceased
- 2020-09-22 ES ES20788996T patent/ES3064523T3/es active Active
- 2020-09-22 US US17/762,664 patent/US20220390458A1/en active Pending
- 2020-09-22 EP EP20788996.5A patent/EP4034603B8/fr active Active
Non-Patent Citations (11)
| Title |
|---|
| AMARO ET AL., J. PHYS. D: APPL. PHYS., vol. 50, 2017, pages 9 |
| BAUMGART, T. ET AL.: "Large-scale fluid/fluid phase separation of proteins and lipids in giant plasma membrane vesicles", PROC. NATL. ACAD. SCI., 2007 |
| CHENIOUR ET AL., RSCADV., vol. 6, 2016, pages 5547 - 5557 |
| DINIC ET AL., BIOCHIMICA ET BIOPHYSICA ACTA, vol. 1808, 2011, pages 298 - 306 |
| H. M. KIMH. J. CHOOS. Y. JUNGY. G. KOW. H. PARKS. J. JEONC. H. KIMT. JOOB. R. CHO, CHEMBIOCHEM, vol. 8, 2007, pages 553 - 559 |
| PARASASSI ET AL., BIOPHYSICAL JOURNAL, vol. 66, January 1994 (1994-01-01), pages 120 - 132 |
| PARASASSI ET AL., BIOPHYSICAL SOCIETY, vol. 60, July 1991 (1991-07-01), pages 179 - 189 |
| PARASASSIGRATTON, JOURNAL OF FLUORESCENCE, vol. 5, no. 1, 1995 |
| SERGE MAZERES ET AL: "Characterization of M-laurdan, a versatile probe to explore order in lipid membranes", F1000RESEARCH, 25 July 2014 (2014-07-25), XP055679055, DOI: 10.12688/f1000research.4805.1 * |
| SEZGIN ET AL., CHEMPHYSCHEM, vol. 16, 2015, pages 1387 - 1394 |
| STEWART, ANALYTICAL BIOCHEMISTRY, vol. 104, 1980, pages 10 - 14 |
Also Published As
| Publication number | Publication date |
|---|---|
| EP4034603A2 (fr) | 2022-08-03 |
| EP4034603B8 (fr) | 2026-05-06 |
| ES3064523T3 (en) | 2026-04-27 |
| WO2021058490A2 (fr) | 2021-04-01 |
| EP4034603B1 (fr) | 2026-02-11 |
| US20220390458A1 (en) | 2022-12-08 |
| EP4034603C0 (fr) | 2026-02-11 |
| WO2021058490A3 (fr) | 2021-04-29 |
Similar Documents
| Publication | Publication Date | Title |
|---|---|---|
| Martinic et al. | Near-infrared optical imaging of necrotic cells by photostable lanthanide-based metallacrowns | |
| Ouyang et al. | FLIM as a promising tool for cancer diagnosis and treatment monitoring | |
| Mikhalyov et al. | Electronic ground and excited state properties of dipyrrometheneboron difluoride (BODIPY): Dimers with application to biosciences | |
| Kamiya et al. | An enzymatically activated fluorescence probe for targeted tumor imaging | |
| Juhasz et al. | Fluorescent probe partitioning in giant unilamellar vesicles of ‘lipid raft’mixtures | |
| Liu et al. | Biodistribution studies of nanoparticles using fluorescence imaging: a qualitative or quantitative method? | |
| Matikonda et al. | Core remodeling leads to long wavelength fluoro-coumarins | |
| Lai et al. | Quantification of lipid droplets polarity for evaluating non-alcoholic fatty liver disease via fluorescence lifetime imaging | |
| Wijesinghe et al. | pH dependent transfer of nano-pores into membrane of cancer cells to induce apoptosis | |
| Alonso et al. | Interaction of miltefosine with intercellular membranes of stratum corneum and biomimetic lipid vesicles | |
| Kaewsuya et al. | Fluorescent determination of cardiolipin using 10-N-nonyl acridine orange | |
| Barioni et al. | Miltefosine and BODIPY-labeled alkylphosphocholine with leishmanicidal activity: aggregation properties and interaction with model membranes | |
| Inoue et al. | Synthesis and photophysical properties of a new push–pull pyrene dye with green-to-far-red emission and its application to human cellular and skin tissue imaging | |
| Chinigò et al. | Polymethine dyes-loaded solid lipid nanoparticles (SLN) as promising photosensitizers for biomedical applications | |
| Bondelli et al. | Fluorescent probes for optical investigation of the plasma membrane | |
| Sot et al. | Phase-selective staining of model and cell membranes, lipid droplets and lipoproteins with fluorescent solvatochromic pyrene probes | |
| Haidekker et al. | Phospholipid-bound molecular rotors: synthesis and characterization | |
| Wu et al. | A DIE responsive NIR-fluorescent cell membrane probe | |
| Liu et al. | Piperazine multi-substituted triarylboron compound as an aqueous soluble fluorescent probe for imaging nucleoli, nuclear matrix and nuclear membrane | |
| Rao et al. | New AIE-active terpyridyl-based pyridinium salt with good water-soluble: membrane-permeable probe for cellular endoplasmic reticulum imaging | |
| Socaciu et al. | Carotenoids in DPPC vesicles: membrane dynamics | |
| JPWO2018174253A1 (ja) | ニトロベンゼン誘導体またはその塩およびそれらの用途 | |
| Marquezin et al. | Spectroscopic characterization of 2-amino-N-hexadecyl-benzamide (AHBA), a new fluorescence probe for membranes | |
| EP3795643A1 (fr) | Sonde fluorescente et ses applications | |
| Kim et al. | Two‐photon fluorescent probes for biomembrane imaging: effect of chain length |
Legal Events
| Date | Code | Title | Description |
|---|---|---|---|
| PUAI | Public reference made under article 153(3) epc to a published international application that has entered the european phase |
Free format text: ORIGINAL CODE: 0009012 |
|
| STAA | Information on the status of an ep patent application or granted ep patent |
Free format text: STATUS: THE APPLICATION HAS BEEN PUBLISHED |
|
| AK | Designated contracting states |
Kind code of ref document: A1 Designated state(s): AL AT BE BG CH CY CZ DE DK EE ES FI FR GB GR HR HU IE IS IT LI LT LU LV MC MK MT NL NO PL PT RO RS SE SI SK SM TR |
|
| AX | Request for extension of the european patent |
Extension state: BA ME |
|
| STAA | Information on the status of an ep patent application or granted ep patent |
Free format text: STATUS: REQUEST FOR EXAMINATION WAS MADE |
|
| 17P | Request for examination filed |
Effective date: 20210922 |
|
| RBV | Designated contracting states (corrected) |
Designated state(s): AL AT BE BG CH CY CZ DE DK EE ES FI FR GB GR HR HU IE IS IT LI LT LU LV MC MK MT NL NO PL PT RO RS SE SI SK SM TR |
|
| STAA | Information on the status of an ep patent application or granted ep patent |
Free format text: STATUS: EXAMINATION IS IN PROGRESS |
|
| 17Q | First examination report despatched |
Effective date: 20220826 |
|
| STAA | Information on the status of an ep patent application or granted ep patent |
Free format text: STATUS: THE APPLICATION IS DEEMED TO BE WITHDRAWN |
|
| 18D | Application deemed to be withdrawn |
Effective date: 20230106 |