EP3809334A1 - Structure d'évaluation pour données chronologiques - Google Patents
Structure d'évaluation pour données chronologiques Download PDFInfo
- Publication number
- EP3809334A1 EP3809334A1 EP19203894.1A EP19203894A EP3809334A1 EP 3809334 A1 EP3809334 A1 EP 3809334A1 EP 19203894 A EP19203894 A EP 19203894A EP 3809334 A1 EP3809334 A1 EP 3809334A1
- Authority
- EP
- European Patent Office
- Prior art keywords
- time series
- multiple instances
- iterations
- generated
- distance measure
- Prior art date
- Legal status (The legal status is an assumption and is not a legal conclusion. Google has not performed a legal analysis and makes no representation as to the accuracy of the status listed.)
- Withdrawn
Links
Images




Classifications
-
- G—PHYSICS
- G06—COMPUTING OR CALCULATING; COUNTING
- G06N—COMPUTING ARRANGEMENTS BASED ON SPECIFIC COMPUTATIONAL MODELS
- G06N3/00—Computing arrangements based on biological models
- G06N3/02—Neural networks
- G06N3/08—Learning methods
- G06N3/084—Backpropagation, e.g. using gradient descent
-
- G—PHYSICS
- G06—COMPUTING OR CALCULATING; COUNTING
- G06N—COMPUTING ARRANGEMENTS BASED ON SPECIFIC COMPUTATIONAL MODELS
- G06N3/00—Computing arrangements based on biological models
- G06N3/02—Neural networks
- G06N3/04—Architecture, e.g. interconnection topology
- G06N3/045—Combinations of networks
-
- G—PHYSICS
- G06—COMPUTING OR CALCULATING; COUNTING
- G06N—COMPUTING ARRANGEMENTS BASED ON SPECIFIC COMPUTATIONAL MODELS
- G06N3/00—Computing arrangements based on biological models
- G06N3/02—Neural networks
- G06N3/04—Architecture, e.g. interconnection topology
- G06N3/044—Recurrent networks, e.g. Hopfield networks
- G06N3/0442—Recurrent networks, e.g. Hopfield networks characterised by memory or gating, e.g. long short-term memory [LSTM] or gated recurrent units [GRU]
-
- G—PHYSICS
- G06—COMPUTING OR CALCULATING; COUNTING
- G06N—COMPUTING ARRANGEMENTS BASED ON SPECIFIC COMPUTATIONAL MODELS
- G06N3/00—Computing arrangements based on biological models
- G06N3/02—Neural networks
- G06N3/04—Architecture, e.g. interconnection topology
- G06N3/047—Probabilistic or stochastic networks
-
- G—PHYSICS
- G06—COMPUTING OR CALCULATING; COUNTING
- G06N—COMPUTING ARRANGEMENTS BASED ON SPECIFIC COMPUTATIONAL MODELS
- G06N3/00—Computing arrangements based on biological models
- G06N3/02—Neural networks
- G06N3/04—Architecture, e.g. interconnection topology
- G06N3/0475—Generative networks
-
- G—PHYSICS
- G06—COMPUTING OR CALCULATING; COUNTING
- G06N—COMPUTING ARRANGEMENTS BASED ON SPECIFIC COMPUTATIONAL MODELS
- G06N3/00—Computing arrangements based on biological models
- G06N3/02—Neural networks
- G06N3/08—Learning methods
- G06N3/088—Non-supervised learning, e.g. competitive learning
-
- G—PHYSICS
- G06—COMPUTING OR CALCULATING; COUNTING
- G06N—COMPUTING ARRANGEMENTS BASED ON SPECIFIC COMPUTATIONAL MODELS
- G06N3/00—Computing arrangements based on biological models
- G06N3/02—Neural networks
- G06N3/08—Learning methods
- G06N3/094—Adversarial learning
-
- G—PHYSICS
- G06—COMPUTING OR CALCULATING; COUNTING
- G06N—COMPUTING ARRANGEMENTS BASED ON SPECIFIC COMPUTATIONAL MODELS
- G06N3/00—Computing arrangements based on biological models
- G06N3/02—Neural networks
- G06N3/08—Learning methods
- G06N3/0985—Hyperparameter optimisation; Meta-learning; Learning-to-learn
Definitions
- Various examples generally relate to configuring a data generation algorithm, such as a generative adversarial network, that is configurated to generate a training dataset comprising a training time series of data points.
- Various examples specifically relate to an evaluation framework of generated time series of data points provided by the data generation algorithm
- Time-dependent information arises in many fields ranging from meteorology, medicine to stock markets.
- the analysis of such time series of data points is a central goal in visual analytics, statistics, or machine learning (ML) and many related approaches exist.
- ML machine learning
- a machine learning algorithm can detect features in the time series and classify the features. Thereby, it would be possible to detect malfunctioning of machines, implement predictive maintenance, detect wear-out of machines, detect abnormal system states of a machine, etc. Various such use cases are conceivable.
- a machine-learning (ML) algorithm is trained based on training data. It is necessary to accurately train the ML algorithm, based on a sufficient amount of training data, as well as a balanced training dataset (i.e., each feature class is equally well represented).
- ML experts often face situations where these criteria are not satisfied. For example, when commissioning a new machine, a cold-start problem may occur: here, because the machine is only about to commence operation, a measurement dataset provided by the machine is not yet available for training. Transfer learning - i.e., relying on measurement datasets from further machines, e.g., of the same type - is not always in appropriate solution: in particular, feature classes can even vary significantly between different machines of the same type.
- the training dataset can be generated based on a comparable limited amount of information, i.e., a small measurement dataset of a measurement.
- the training dataset may not only include generated data, but also measurement data.
- GANs Generative Adversarial Networks
- the techniques described herein generally solve this problem by providing an evaluation framework for assessing the quality of generated training datasets including time series of data points.
- the evaluation framework can include a workflow for visual analytics (VA) of the generated time series of data points obtained from a data generation algorithm.
- VA visual analytics
- Such workflow provides human-machine interaction to guide an user in the evaluation of training datasets and enabling the user to select the appropriate configuration of the data generation algorithm.
- the workflow makes real and generated time series of data points comparable by combining VA with algorithmic methods. Thereby, the techniques enable the user to trust the GAN configuration.
- the evaluation framework can generally include one or more views.
- the various views can have a different level of abstraction or dimensionality reduction.
- a first view (labeled iteration view, hereinafter) can include one or more plots that show, as a function the iteration, at least one distance measure between the generated time series of data points and the reference time series of data points.
- different iterations correspond to different configurations of the GANs.
- different configurations can correspond to different parameter values of parameters of the configuration.
- the iteration view corresponds to an overview visualization at a high level of abstraction that helps the user to identify interesting iterations of the GAN generation process.
- a second view (labeled instance view, hereinafter) can include, for a selected one of the iterations or for multiple selected iterations of the plurality of iterations, a plot of multiple instances of the generated time series of data points using the configuration at that iteration.
- the various instances can correspond to the outputs of the data generation algorithm at the respective configuration of the respective iteration, using different seed values (e.g., different instantiation noise).
- the instances of the time series may be ordered using, e.g., Principal Components Analysis (PCA), to facilitate comparison by juxtaposition.
- PCA Principal Components Analysis
- a method of configuring a data generation algorithm for generating a generated dataset includes a time series of data points.
- the method includes obtaining multiple instances of a reference time series of data points.
- the method also includes iteratively adjusting a configuration of the data generation algorithm, based on the multiple instances of the reference time series.
- the method also includes executing the data generation algorithm with the respectively adjusted configuration, to thereby obtain a plurality of iterations of multiple instances of a generated time series of data points.
- the method further includes outputting, to a human-machine-interface, a first view of at least one distance measure.
- the at least one distance measure is between the multiple instances of the reference time series and the multiple instances of the generated time series.
- the first view provides the at least one distance measure as a function of the plurality of iterations.
- the method further includes obtaining, from the human-machine-interface, a user input indicative of a selected iteration of the plurality of iterations.
- the at least one distance measure comprises a first distance measure which is based on nearest-neighbor distances of each of the multiple instances of the generated time series to the multiple instances of the reference time series.
- the at least one distance measure comprises a second distance measure which is based on nearest-neighbor distances of each of the multiple instances of the reference time series to the multiple instances of the generated time series.
- the first view may comprise a first plot of the first distance measure and may further comprise a second plot of the second distance measure.
- the first plot and the second plot may have a common axis associated with the plurality of iterations.
- the first plot and the second plot of the first view may include 2-D heatmap plots for the first distance measure and the second distance measure as a function of the plurality of iterations and a function of the multiple iterations.
- the at least one distance measure may comprise a first distance measure indicative of a similarity between time-domain shapes of the data points of the generated time series with respect to the reference time series.
- the at least one distance measure may comprise a second distance measure indicative of a variation strength of time-domain shapes of the data points of the generated time series with respect to the reference time series.
- the first view comprises at least one plot showing the at least one distance measure for each one of the multiple instances of the reference time series and/or the generated time series.
- the method may further include: outputting, to the human-machine-interface, a second view comprising an amplitude or phase of the multiple instances of the generated time series for the selected iteration of the plurality of iterations.
- the second view may comprise a first plot in which the amplitude or phase of the multiple instances of the reference time series is shown.
- the second view may comprise a second plot in which the amplitude or phase of the multiple instances of the generated time series is shown for the selected iteration of the plurality of iterations.
- the first plot and the second plot may share a common axis for the multiple instances.
- the plot of the second view may comprise 2-D heatmaps for the amplitude or phase of the selected iteration of the plurality of iterations of the generated time series and of the reference time series, as a function of the multiple iterations and as a function of time.
- the method may further comprise: obtaining, from the human-machine-interface, a further user input indicative of a selected instance of the multiple instances of the selected iteration of the plurality of iterations, and outputting, to the human-machine-interface, a third view indicative of the amplitude or phase of the selected instance of the multiple instances of the selected iteration of the plurality of iterations, as a function of time.
- the third view may comprise at least one line plot of the amplitude or phase of the selected instance of the multiple instances of the selected iteration of the plurality of iterations.
- the line plot may comprise a statistical reference of the amplitude or phase of the multiple instances of the reference time series.
- the method may further comprise: sorting at least one of the multiple instances of the reference time series or the generated time series.
- said sorting is based on at least one of a further user input, the at least one distance measure, or a principle component analysis of the data points of each one of the multiple instances of the at least one of the reference time series or the generated time series.
- the method may further comprise, based on the user input, configuring at least one of the data generation algorithm or a training process of the data generation algorithm.
- the method may further comprise: based on the user input, adjusting a parameter space sampling scheme of the configuration of the data generation algorithm during a training process of the data generation algorithm.
- the generated dataset is for training a machine-learning algorithm.
- the method may further comprise: executing the data generation algorithm based on the user input, to thereby obtain the generated dataset, and training the machine-learning algorithm using the generated dataset.
- the method may further comprise: using the trained machine-learning algorithm to recognize features in sensor data.
- the data generation algorithm comprises a generative adversarial network comprising a generator and a discriminator.
- a computer program or a computer-program product or a computer-readable storage medium includes program code.
- the program code can be executed by at least one processor. Executing the program code causes the at least one processor to perform a method of configuring a data generation algorithm for generating a generated dataset for a machine-learning algorithm.
- the generated dataset includes a time series of data points.
- the method includes obtaining multiple instances of a reference time series of data points.
- the method also includes iteratively adjusting a configuration of the data generation algorithm, based on the multiple instances of the reference time series.
- the method also includes executing the data generation algorithm with the respectively adjusted configuration, to thereby obtain a plurality of iterations of multiple instances of a generated time series of data points.
- the method further includes outputting, to a human-machine-interface, a first view of at least one distance measure.
- the at least one distance measure is between the multiple instances of the reference time series and the multiple instances of the generated time series.
- the first view provides the at least one distance measure as a function of the plurality of iterations.
- the method further includes obtaining, from the human-machine-interface, a user input indicative of a selected iteration of the plurality of iterations.
- a device includes program code.
- the program code can be executed by at least one processor. Executing the program code causes the at least one processor to perform a method of configuring a data generation algorithm for generating a generated dataset for a machine-learning algorithm.
- the generated dataset includes a generated time series of data points.
- the method includes obtaining multiple instances of a reference time series of data points.
- the method also includes iteratively adjusting a configuration of the data generation algorithm, based on the multiple instances of the reference time series.
- the method also includes executing the data generation algorithm with the respectively adjusted configuration, to thereby obtain a plurality of iterations of multiple instances of a generated time series of data points.
- the method further includes outputting, to a human-machine-interface, a first view of at least one distance measure.
- the at least one distance measure is between the multiple instances of the reference time series and the multiple instances of the generated time series.
- the first view provides the at least one distance measure as a function of the plurality of iterations.
- the method further includes obtaining, from the human-machine-interface, a user input indicative of a selected iteration of the plurality of iterations.
- circuits and other electrical devices generally provide for a plurality of circuits or other electrical devices. All references to the circuits and other electrical devices and the functionality provided by each are not intended to be limited to encompassing only what is illustrated and described herein. While particular labels may be assigned to the various circuits or other electrical devices disclosed, such labels are not intended to limit the scope of operation for the circuits and the other electrical devices. Such circuits and other electrical devices may be combined with each other and/or separated in any manner based on the particular type of electrical implementation that is desired.
- any circuit or other electrical device disclosed herein may include any number of microcontrollers, a graphics processor unit (GPU), integrated circuits, memory devices (e.g., FLASH, random access memory (RAM), read only memory (ROM), electrically programmable read only memory (EPROM), electrically erasable programmable read only memory (EEPROM), or other suitable variants thereof), and software which co-act with one another to perform operation(s) disclosed herein.
- any one or more of the electrical devices may be configured to execute a program code that is embodied in a non-transitory computer readable medium programmed to perform any number of the functions as disclosed.
- the techniques can be used to assess a result of a data generation algorithm training process; alternatively or additionally, the techniques can be used during the data generation algorithm training process, and it is possible to configure the data generation algorithm training process based on the techniques described herein to thereby find the appropriate configuration.
- the data generation algorithm can generate a generated dataset.
- the data generation algorithm may do so based on a reference dataset that can include measurement data.
- the datasets include multiple instances of a time series of data points. I.e., time-resolved data is considered.
- the generated dataset implements a training dataset for training an ML algorithm.
- Another example would relate to the generated dataset implementing a test dataset.
- the test dataset can be used to test, e.g., functionality of an integrated circuit.
- various examples are described with respect to the generated dataset implementing a training dataset, for sake of simplicity.
- the training dataset is for training an ML algorithm.
- similar techniques can be readily applied for different purposes of the generated dataset.
- An example implementation is a GAN including a generator and a discriminator.
- GAN including a generator and a discriminator.
- VAE Variational Autoencoder
- configuring GAN can include determining a configuration of the generator of the GAN and/or of the discriminator of the GAN. For example, one or more parameter values of parameters of the configuration of the GAN can be set. For example, it would be possible to set hyperparameter values of hyperparameters of the configuration of the GAN.
- Example hyperparameters include: type of noise; number of layers of the generator; number of layers of the discriminator; hyperparameters of the generator; hyperparameters of the discriminator; etc..
- an appropriate configuration may be a configuration that enables to generate a training dataset including multiple instances of a time series of data points for accurately training an ML algorithm.
- the generated time series should mimic reference time series of a reference dataset (e.g., real measurement data, etc.) accurately.
- a time-domain shape of the data points of the generated time series should be exhibiting a strong similarity with the time-domain shape of the reference time series. I.e., the time-domain evolution of amplitude and/or phase of the data points should be similar for the generated time series and the reference time series, ( ii ) A variation strength of the time-domain shapes of the data points of the generated time series should be approximately equal to the variation strength of the time-domain shapes of the data points of the reference time series.
- multiple feature classes included in the reference dataset may not be appropriately reflected in the generated dataset obtained from the GAN. For instance, a given one of the different feature classes may be overrepresented. Then, the variation strength of the time-domain shapes of the data points of the multiple instances of the generated time series may be smaller than the variation strength of the time-domain shapes of the data points of the multiple instances of the reference time series. This is because not all required time-domain shapes are included in the generated dataset.
- the techniques described herein can be generally used to evaluate the performance of a GAN or a training process of the GAN.
- Various techniques described herein provide an evaluation framework that enable to accurately assess whether the multiple instances of the generated time series of data points appropriately mimics the multiple instances of the reference time series of data points, e.g., taking into account the above-identified criteria ( i ) and ( ii ).
- the techniques described herein facilitate a fast and reliable evaluation by a user. In the techniques described herein it is typically not required that the user has specific domain knowledge of the particular use case/information content included in the time series of data points. Rather, the evaluation framework facilitates an analysis of the generated dataset based on statistical figures of merits and, as such, is widely applicable across various use cases.
- the techniques can find application in various use cases.
- the information content of the datasets can vary.
- the datasets could include time series of medical measurement data points such as electrocardiograms, blood-flow data, etc; another example includes speech measurement data points, e.g., voice recordings; another example includes industry measurement data points such as flow measurements in turbines or windparks or engines, data points of an acceleration or position sensor, e.g., of trains, subways, airplanes, temperature data points, e.g., for electrical power transmission equipment, pressure data points, e.g., for subsea equipment, and so forth.
- the datasets can capture a time-domain dynamics of a physical or technical or physiological process.
- the GAN training process can have a plurality of iterations. For each iteration of the plurality of iterations, the parameter values of parameters of a configuration of the GAN are varied. Then, based on multiple instances of a reference time series of data points, the GAN can be executed with the respectively adjusted configuration. Per iteration, the GAN outputs multiple instances of the time series of data points. As a result of the GAN training process, a plurality of iterations of multiple instances of a generated time series of data points can be obtained. Thus, there are, firstly, multiple iterations, and, secondly, each iteration has multiple instances of the time series of data points.
- different instances of the reference time series can be associated with different seed values for the operation of the GAN, e.g., noise having a random contribution that is provided as an input to the generator. It has been found that it is difficult to evaluate such a large amount of data.
- this is achieved by outputting, to a human-machine-interface (HMI), one or more views.
- HMI human-machine-interface
- Each view can include one or more plots.
- a first view includes at least one distance measure between the multiple instances of the reference time series and the multiple instances of the generated time series, as a function of the plurality of iterations of the training process.
- heatmap plots could be used in which color/contrast is used to encode the value of the distance measure; thereby, the distance measure can be shown for each instance.
- Another option would be a line plot that encodes a distance measure averaged or otherwise condensed across the instances.
- the evaluation framework is not limited to the first view.
- one or more further views can be activated.
- a second view can include amplitude and/or phase as a function of the multiple instances of a selected one of the plurality of iterations.
- the selected one of the plurality of iterations can be obtained from a user input that is made based on the first view.
- the evaluation framework could include a third view that illustrates the amplitude and/or phase of a selected instance of a selected iteration, as a function of time.
- the third view can include a respective line plot of the amplitude or phase.
- the selected instance may be determined based on a user input indicative thereof that is made based on the second view.
- the first view can provide a general overview of the behavior of the training process, while the second and third views can provide a higher level of detail.
- the user can navigate through the multiple views by selecting iterations or selecting instances of interest. Such continued user-machine-interaction can make the large amount of data processable and accessible for evaluation.
- FIG. 1 is a flowchart of a method according to various examples.
- a training process of a GAN is executed.
- the training process can include a plurality of iterations.
- the GAN is executed with a respective configuration.
- the configuration of the GAN is iteratively adjusted, e.g., a configuration of the generator and/or a configuration of the discriminator of the GAN.
- parameter values of the parameters of the generator and/or the discriminator can be altered.
- backpropagation can be used, along with gradient descent, to sample the parameter space of the parameter values of the generator and the discriminator.
- weights of the respective neural networks may be adjusted as parameter values.
- the execution of the GAN is based on multiple instances of a reference time series of data points, also obtained as part of box 1001.
- the reference time series of data points can be obtained from a measurement.
- a generated dataset including, for each of the plurality of iterations, multiple instances of a generated time series of data points is obtained, at box 1002.
- the generated dataset is a candidate for a training dataset of a ML algorithm
- Box 1003 includes outputting, to an HMI, one or more views of an evaluation framework.
- the performance of the GAN is evaluation in view of the training process. In other words, the performance of the GAN can be evaluated for the different configurations associated with the plurality of iterations of the training process.
- the first view includes at least one distance measure between the multiple instances of the reference time series and the multiple instances of the generated time series, as a function of the plurality of iterations.
- the configuration of the GAN associated with the selected iteration of the plurality of iterations can be used to then determine a training dataset.
- box 1001 - box 1003 are reexecuted, using the adjusted configuration of the training process.
- a parameter space sampling scheme of the configuration of the GAN during the training process can be adjusted based on the user input (e.g., deviating from gradient descent). Thereby, an appropriate configuration can be quickly found, because the parameter space of available configurations is efficiently sampled, towards an optimum.
- Yet another option would be associated with adjusting a hyperparameter value of a hyperparameter of the GAN, e.g., a number of layers of the discriminator and/or the generator, a type of noise considered, etc..
- the GAN can be executed, in accordance with the configuration of box 1004, i.e., based on the user input.
- the training dataset is obtained and, at box 1005, the ML algorithm can be trained based on the training dataset.
- the features can be recognized in sensor data, e.g., from a machine, a medical equipment, surveillance equipment, etc..
- box 1003 provides an evaluation framework for the performance of the GAN. Details with respect to the evaluation framework and a workflow associated there with are described next in connection with FIG. 2 .
- FIG. 2 is a schematic illustration of a workflow facilitating and evaluation of the performance of a GAN.
- the workflow includes the execution of an evaluation framework 104.
- a reference dataset is obtained; i.e., multiple instances of a reference time series 101 are obtained.
- the multiple instances of the reference time series 101 are provided as an input to a GAN 102.
- the training process of the GAN is executed (cf. FIG. 1 : box 1001). Accordingly, the GAN 102 outputs a plurality of iterations, each iteration including multiple instances of a generated times series 103 of data points.
- An evaluation framework 104 enables the evaluation of the performance of the GAN 102.
- the plurality of iterations of the multiple instances of the generated time series 103 are provided to the evaluation framework 104 at 1013.
- the multiple instances of the reference time series are provided to the evaluation framework.
- the evaluation framework 104 provides, at 1014, one or more views to a user 105; and obtains, at 1015, one or more user inputs from the user 105.
- the user 105 may interact with the evaluation framework to get further insight about the data and their properties. After a rigorous exploration of the data, he or she can decide to terminate the training process if the desired behavior is achieved; a respective configuration of the GAN can be selected. Otherwise, he or she can adjust the configuration of the GAN.
- the configuration of the GAN 102 is adjusted or set based on a feedback, provided by the evaluation framework at 1016.
- the user 105 starts the process by executing the GAN 102, to generate a plurality of iterations, each iteration including multiple instances of the generated time series 103.
- the evaluation framework 104 is then used to check whether the GAN configuration and the generated time series fulfill the desired requirements, e.g., at least for one of the plurality of iterations. If this is the case, the user 105 has succeeded to generate realistic time series and can stop the configuration process.
- the training dataset can be generated using the respective configuration. Otherwise he or she can re-execute the GAN 102 with a different configuration - e.g., adjusted parameter values or hyperparameter values - and repeat the investigations using the evaluation framework 104.
- the evaluation framework 104 can be used during the training process, e.g., by configuring the training process. As the training process can take up to several days, such approach may help to save valuable time by making sure during the training process that the variation of the parameter values of the configuration of the GAN 102 is going in the right direction or restart the training process if an unexpected behavior is detected.
- FIG. 3 schematically illustrates aspects with respect to the GAN 102.
- the GAN 102 includes the generator 121 and the discriminator 122.
- the discriminator obtains, as an input, the multiple instances of the reference time series 101.
- the generator 121 obtains, as an input, noise 109.
- the generator 121 outputs the multiple instances of the generated time series 103 of data points. These are compared, at the discriminator 122 to the multiple instances of the reference time series 101.
- the output of the discriminator 122 is an indication 123 whether the generated time series 103 can be distinguished from the reference time series 101.
- a GAN can be briefly described as a minimax game between two neural networks, i.e., the generator and the discriminator.
- the discriminator is typically a binary classifier that tries to maximize its log-likelihood to learn to perfectly distinguish between the real and the generated data.
- the generator is typically trying to minimize the log-probability of the generated samples that are recognized as false.
- the configuration of the generator 121 and the discriminator 122 is accordingly adjusted in accordance with the respective losses across the plurality of iterations.
- a challenge is to decide if the data produced by generator 121 sufficiently represent the original reference dataset.
- Much efforts are made by researchers to discover suitable metrics to evaluate the performance of GAN and can substitute a human judge.
- the discriminator 122 and generator 121 losses cannot be considered as a measure of GAN performance and this ML approach lacks an objective function that defines an appropriate end of iteration with suitable data quality.
- Various evaluation methods have been described in Theis, L.; van den Oord, A.; and Bethge, M. 2016. A note on the evaluation of generative models. In International Conference on Learning Representations , such as Parzen window or Maximum Mean Discrepancy (MMD). As proven in id., the use of these methods has various disadvantages. Other methods i.e.
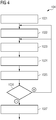
- FIG. 4 is a flowchart of a method according to various examples.
- the method of FIG. 4 illustrates an example implementation of the execution of the evaluation framework 104, i.e., an example implementation of box 1003 of FIG. 1 .
- FIG. 4 illustrates a method including continued interaction between a user and the machine in order to evaluate the quality of multiple instances of a generated time series.
- the evaluation framework 104 provides multiple views. Based on the multiple views, user inputs are received. Based on the user inputs, it is possible to navigate between the multiple views. Furthermore, based on the user inputs, it is possible to configure the GAN 102 and/or a training process of the GAN 102.
- a first view is output.
- the first view can be labeled iteration view.
- the first view includes one or more plots that indicate at least one distance measure between multiple instances of the reference time series 101 in multiple instances of the generated time series 103, as a function of the iteration. For example, different plots can illustrate different distance measures.
- the multiple plots can share an axis associated with the plurality of iterations.
- a user input is received that is indicative of a selected iteration of the plurality of iterations, based on the first view.
- a second view is output.
- the second view may be labeled instance view.
- the one or more plots of the second view include at least an amplitude or phase of the multiple instances of the generated time series 103 for the selected iteration of box 1022, e.g., as a function of time.
- the instance view can include the multiple instances of the reference time series 101.
- a third view e.g., labeled selected sample view - that is indicative of the data points of the selected instance of the generated time series (for the selected iteration of the plurality iterations), as indicated by the further user input of box 1024.
- the third view may include a line plot of the amplitude or phase of the selected instance, as a function of time.
- the GAN 102 and/or the respective training process is configured, based on the previous user inputs.
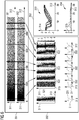
- FIG. 5 and FIG. 6 schematically illustrate plots of multiple views provided by the evaluation framework 104 (cf. FIG. 2 ).
- FIG. 5 and FIG. 6 correspond to each other, but the illustrated data is different; this is because a different configuration of GANs is used in FIG. 5 and FIG. 6 , as will be explained in further detail below.
- FIG. 5 and FIG. 6 illustrate a first view 391 (upper part in FIG. 5 and FIG. 6 ), the iteration view.
- the iteration view 391 that includes two plots 301, 302.
- the two plots 301, 302 share a common axis 312 that is associated with the plurality of iterations.
- the iteration view 391 shows at least one distance measure as a function of the iteration.
- the iteration view 391 gives the user a general impression about the behavior of GAN as a function of the iterations of the training process.
- the user can interactively select interesting iterations in the first view 391 and get more insights about the selected iterations in further views 392, 393. This will permit the user to identify the iteration with the best behavior.
- a second view 392 (middle part of FIG. 5 and FIG. 6 ), the instance view, comprises two plots 321, 322 (note that the plot 322 is provided multiple times).
- the plots 321, 322 share an axis 311 that is associated with the multiple instances.
- the plots 321, 322, 331, 332 is provided
- a third view 393 (lower part and right side of FIG. 5 and FIG. 6 ) - the selected sample view - includes multiple plots 333-334 to further investigate time series at particular iterations and instances selected by the user.
- the multiple plots 333-334 share a common axis 313 that is associated with time.
- the plots 321-322 of the instance view 392 display the data points of all instances of the time series (plot 321: reference time series; plot 322: generated time series) at a certain iteration, respectively (in FIG. 5 , the plot 322 is respectively shown for iterations 40, 198, 382, 614, 769, 899, and 978, respectively; as illustrated by the arrows; these iterations are also highlighted in the plots 301, 302 of the iteration view 391).
- a 2-D heatmap is used for the plots 321, 322.
- the 2-D heatmap encodes, as contrast or color, the amplitude of the data points as a function of instance along axis 311 and as a function of time along axis 313.
- the plots 331-332 illustrate a time-dependent distribution of the amplitude and/or phase data points for a respective iteration.
- the plots 331-332 are sometimes labeled time-histogram views, as the show the variation of the data points for a given iteration.
- the amplitude and/or phase of the data points spreads out; this is consistent with the assumption that different feature classes are represented by the multiple instances.
- the instance view 392 is used to depict the data points across multiple instances of the time series for a given iteration and enable a detailed and rigorous exploration of the generated time series and their properties.
- Each 2-D heatmap represents all the data of a specific iteration where each row corresponds to a specific instance of the time series. This visualization permits the user to compare a high number of time series in an efficient manner.
- the time series of a given instance selected in the instance view 392 can then be visualized as line plots 333-334 of the selected sample view 393.
- the line plots 333-334 show the time-domain evolution of the amplitude and/or phase of the data points of a given instance of a reference time series and/or a generated time series; and optionally a statistical reference (e.g., a median or average or a percentile taken across all time series of a kind).
- a statistical reference e.g., a median or average or a percentile taken across all time series of a kind.
- the amplitude and/or phase are illustrated for the instances highlighted in the plots 322 using a square bracket (light full line; bold full line; dotted line).
- the plots 333 and 334 of the selected sample view 393 also include a statistical reference of the amplitude of phase of the multiple instances of the reference time series 101 (e.g., percentiles; dashed areas).
- the plot 334 shows a difference between the data points of a given instance of the generated time series and this statistical reference.
- a rigorous investigation of some selected time series is made possible with the selected sample view 393.
- the plot 333 depicts the median of the instances of the reference time series and the amount of data falling in the 68th, 95th and 99.7th percentile. The user may add further instances of the reference or generated time series at different iterations, to compare them.
- the plot 334 highlights the element-wise difference between the selected instance of the generated time series and the median across all instances of the reference time series.
- the views 391 and 392 include the axis 311 that shows properties as a function of the instance.
- the sorting can arrange the sequence of instances along the axis 311. To make both the reference and generated time series comparable, the same sorting is generally applied to the generated time series and the reference time series.
- sorting can be based on the PCA, or on a user input, or on the at least one distance measure of the iteration view 391. For instance the sorting could be executed prior to box 1021 of FIG. 4 .
- the sorting based on PCA can be applied to the multiple instances of the reference time series, to transform the data points of each reference time series into uncorrelated components.
- the multiple instances of the reference time series are then sorted based on the first/primary principal component.
- the PCA could be trained based on the reference time series of the reference dataset and the applied to the generated time series of the training dataset.
- the least one distance measure can use various underlying distance metrics, e.g., Euclidean Distance (ED) or Dynamic Time Warping (DTW).
- ED Euclidean Distance
- DTW Dynamic Time Warping
- the user may select a metric for the distance measure. For example, the user may select either ED or DTW.
- the metric could also be predefined.
- a nearest-neighbor distance can be determined. I.e., it is possible to determine, for a given instance of the generated time series the closest instance of the reference time series (using the respective distance metric)- or vice versa; this minimum distance is then the nearest-neighbor distance.
- the plot 301 corresponds to a first distance measure and the plot 302 corresponds to a second distance measure.
- the first distance measure of the plot 301 is the Incoming Nearest Neighbor Distances (INND); and the second distance measure of the plot 302 is the Outgoing Nearest Neighbor Distances (ONND).
- the INND and ONND are also resolved for each one of the multiple instances along axis 311, but this is generally optional. The order of the instances is determined based on sorting, e.g., using the PCA.
- the plot 301 illustrates, for each instance of the generated time series, the minimum value of the distance metric to any instance of the reference time series (i.e., the nearest-neighbor distance to the multiple instances of the reference time series), as INNDs.
- the nearest-neighbor distances are defined within each iteration of the plurality of iterations.
- the plot 302 illustrates, for each instance of the reference time series 101, the nearest-neighbor distance to the multiple instances of the generated time series 103, as ONNDs.
- the calculation of the ONNDs is also illustrated by the pseudo-code of table 1 below Table 1: Pseudo-code for calculation of ONNDs of various instances of the reference time series.
- the 2-D heatmap plots 301, 302 illustrate INNDs and ONNDs as a function of instances along the axis 311 and as a function of iterations along the axis 312.
- the intensity of the color of each pixel of the 2-D heatmap plots highlights the value of the INNDs or ONNDs, respective.
- a dark pixel represents a high distance value
- a brighter pixel denotes a lower distance value.
- the use case illustrates that the evaluation framework 104 enables an exploration of the behavior of the GAN over the iterations and an investigation of the similarity between the reference and generated time series. Hence, the presented human-centered approach gives the opportunity to build a relationship of trust between the user and the AI algorithm.
- Circulation 101(23):e215-e220 Circulation Electronic Pages: http://circ.ahajournals.org/content/101/23/e215.full PMID:1085218;doi:10.1161/01.CIR.101.23.e215 .).
- the considered reference dataset consists of 7 long-term Electrocardiogram (ECG) for a period of 14 to 22 hours each. It contains two classes depicting the normal and abnormal behavior. To reduce the training time, only 30 time points from the reference time series are considered. The user used one class in his experiments.
- the performance of GAN is evaluated for two different parameter configurations, namely GAN type 1 and GAN type 2. The corresponding results are depicted in FIG. 5 and 6 , respectively.
- the GAN Iteration Views 391 depicts the INNDs and ONNDs depending on the iterations and instances.
- the first iterations for both scenarios are characterized by high INND and ONND (dark pixels in the heatmap plots 301, 302 of the iteration view 391).
- INND dark pixels in the heatmap plots 301, 302 of the iteration view 391.
- the INNDs for GAN type 1 sharply increase at some iterations, e.g., between iteration 600 and 900.
- GAN type 2 is showing a more stable behavior. In fact, after approximately 300 iterations, the INNDs are almost constant.
- ONNDs in plot 302 of the iteration view 391 of FIG. 5 show that the ONNDs at the top and bottom of the sorted iterations are still high (red circles in FIG. 5 ).
- the expert concludes that the reference time series with an important shift are characterized by a high ONND.
- the multiple instances of the generated time series 103 produced by the first GAN are similar to a specific type of the multiple instances of the reference time series 101, namely the instances that are sorted in the middle (i.e., similar to the respective one or more feature classes).
- GAN model type 1 was not able to reproduce the shift present in the real data and is collapsing to one mode (mode collapse); not all feature classes of the multiple instances of the reference time series are reproduced.
- ONNDs illustrated in plot 302 of FIG. 6 depict a low ONND for all instances of the reference time-series. ONNDs helped the user to verify that the instances of the generated time series are diverse (i.e., show an appropriate variation strength) and do not correspond to a specific feature class, but to almost all real ones.
- the user selects some interesting iterations in the iteration view 391 and continues his investigation in the instance view 392. For both scenarios, the user selected an iteration at the beginning of the training process, certain iterations with low INNDs in the middle of the training process, few iterations characterized by high INND and ONND in GAN type 1 and 2, and some iterations showing a stable behavior within the last hundred iterations of the training process.
- the time-dependent distribution of data points of the generated time series was completely different from the time-dependent distribution of the data points of the reference time series 101.
- An improvement in the performance is noticeable after approximately 200 iterations.
- the time-dependent distribution and the quality of the generated time series are becoming more realistic over the iterations.
- An enhancement in the results is observed between the iterations 382, 614 and 899 for GAN type 1 ( FIG. 5 ) and the iterations 386 and 669 for GAN type 2 ( FIG. 6 ).
- the user selected some instances of the generated time series at different iterations.
- the selected sample view 393 he noticed that at iteration 764 the data points of the generated time series exhibit a strange peak and at iteration 40 noise is generated.
- the evaluation framework 104 helped the user to detect if the data are noisy or have a different behavior from the real data.
- both GAN types were not able to generate realistic time series in the first iterations of the training process at all; the performance increased for subsequent iterations of the training process.
- the data quality can decrease drastically and suddenly, after only a single iteration, i.e. iterations 769 and 480 in the GAN type 1 scenario of FIG. 5 and in the GAN type 2 scenario of FIG. 6 , respectively.
- the user confirms that this is an expected behavior with neural networks because their performance is not monotonic.
- GAN type 2 is re-producing the distribution of the instances of the reference time series much better: the ONND of plot 302 shows smaller values across all instances along axis 311 (the plot 302 has more white pixels for FIG. 6 than for FIG. 5 ). Also, the time-histogram plots 332 resemble the time-histogram plots 331 at least for some iterations.
- the user selected different instances time series from the instance view 392 and visualized them in the selected sample view 393.
- the generated data prove that GAN type 2 is reproducing the shift present in the time-domain shapes of the data points of the instances of the reference time series. The variation strength is higher. Differences to statistical median exist.
- our expert used the view 393 to directly compare the time-domain shape of the data points of a given instance of the generated time-series to the time-domain shape of the data points of a given instance of the reference time series. This is illustrated in FIG. 6 for plots 333 and 334.
- the behavior of the data points of the generated time series is similar to the behavior of the data points of the reference data.
- the second GAN type 2 presents a more realistic behavior and was able at iteration 926 to generate time series that are rare in the real dataset.
- the user concludes that GAN type 2 is achieving the desired behavior.
- the proposed evaluation framework helped the users to find a trustworthy GAN configuration with a set of parameters producing the best results.
- FIG. 7 schematically illustrates a device 701.
- the device 701 includes a processor 701 and a memory 702.
- the processor 701 can load program code from the memory 702.
- the processor 701 can execute the program code. This causes the processor 701 to perform techniques as described herein, e.g.: obtaining a reference dataset, e.g., via a data interface 703; performing a training process of a GAN; configuring a GAN based on user input; executing an evaluation framework; outputting views to a user via an HMI 704; receiving user input via the HMI 704; outputting a training dataset obtained from executing the GAN, e.g., via the data interface 703; etc.
- the processor 701 could execute the methods of FIG. 1 or FIG. 4 .
- the proposed evaluation framework is based on at least one visualization techniques, namely a distance measure across multiple iterations, as well as a view for one or more selected iteration including all instances.
- the distance measure is used in a sophisticated manner to compute the INNDs and ONNDs.
- the evaluation framework supports users in the evaluation process. Experts can detect that a configuration of a GAN generates samples which are not diverse. Also, it is possible to verify that a mapping between the generated and the real data is clear, i.e. the generated samples should correspond to an easily recognizable class.
Landscapes
- Engineering & Computer Science (AREA)
- Physics & Mathematics (AREA)
- Theoretical Computer Science (AREA)
- General Health & Medical Sciences (AREA)
- Computing Systems (AREA)
- Biomedical Technology (AREA)
- Biophysics (AREA)
- Computational Linguistics (AREA)
- Data Mining & Analysis (AREA)
- Evolutionary Computation (AREA)
- Life Sciences & Earth Sciences (AREA)
- Molecular Biology (AREA)
- Artificial Intelligence (AREA)
- General Engineering & Computer Science (AREA)
- General Physics & Mathematics (AREA)
- Mathematical Physics (AREA)
- Software Systems (AREA)
- Health & Medical Sciences (AREA)
- Probability & Statistics with Applications (AREA)
- Testing And Monitoring For Control Systems (AREA)
- Information Retrieval, Db Structures And Fs Structures Therefor (AREA)
- User Interface Of Digital Computer (AREA)
Priority Applications (5)
| Application Number | Priority Date | Filing Date | Title |
|---|---|---|---|
| EP19203894.1A EP3809334A1 (fr) | 2019-10-17 | 2019-10-17 | Structure d'évaluation pour données chronologiques |
| US17/765,319 US12462143B2 (en) | 2019-10-17 | 2020-10-05 | Evaluation framework for time series data |
| PCT/EP2020/077805 WO2021073919A1 (fr) | 2019-10-17 | 2020-10-05 | Cadre d'évaluation pour données de série chronologique |
| CN202080087783.5A CN114761971A (zh) | 2019-10-17 | 2020-10-05 | 用于时间序列数据的评价框架 |
| EP20797038.5A EP4022515A1 (fr) | 2019-10-17 | 2020-10-05 | Cadre d'évaluation pour données de série chronologique |
Applications Claiming Priority (1)
| Application Number | Priority Date | Filing Date | Title |
|---|---|---|---|
| EP19203894.1A EP3809334A1 (fr) | 2019-10-17 | 2019-10-17 | Structure d'évaluation pour données chronologiques |
Publications (1)
| Publication Number | Publication Date |
|---|---|
| EP3809334A1 true EP3809334A1 (fr) | 2021-04-21 |
Family
ID=68295998
Family Applications (2)
| Application Number | Title | Priority Date | Filing Date |
|---|---|---|---|
| EP19203894.1A Withdrawn EP3809334A1 (fr) | 2019-10-17 | 2019-10-17 | Structure d'évaluation pour données chronologiques |
| EP20797038.5A Pending EP4022515A1 (fr) | 2019-10-17 | 2020-10-05 | Cadre d'évaluation pour données de série chronologique |
Family Applications After (1)
| Application Number | Title | Priority Date | Filing Date |
|---|---|---|---|
| EP20797038.5A Pending EP4022515A1 (fr) | 2019-10-17 | 2020-10-05 | Cadre d'évaluation pour données de série chronologique |
Country Status (4)
| Country | Link |
|---|---|
| US (1) | US12462143B2 (fr) |
| EP (2) | EP3809334A1 (fr) |
| CN (1) | CN114761971A (fr) |
| WO (1) | WO2021073919A1 (fr) |
Families Citing this family (1)
| Publication number | Priority date | Publication date | Assignee | Title |
|---|---|---|---|---|
| CN119180744A (zh) * | 2023-06-21 | 2024-12-24 | 中兴通讯股份有限公司 | 多视角图像数据的生成方法、装置、终端设备及存储介质 |
Family Cites Families (5)
| Publication number | Priority date | Publication date | Assignee | Title |
|---|---|---|---|---|
| US11663067B2 (en) * | 2017-12-15 | 2023-05-30 | International Business Machines Corporation | Computerized high-speed anomaly detection |
| CN111758108A (zh) * | 2018-01-17 | 2020-10-09 | 非学习人工智能股份有限公司 | 用于对概率分布进行建模的系统和方法 |
| CN109886403A (zh) | 2019-01-28 | 2019-06-14 | 中国石油大学(华东) | 一种基于神经网络模型的工业数据生成方法 |
| CN109902615B (zh) | 2019-02-25 | 2020-09-29 | 中国计量大学 | 一种基于对抗网络的多个年龄段图像生成方法 |
| CN110113288B (zh) | 2019-05-23 | 2021-06-22 | 徐州中矿康普盛通信科技有限公司 | 一种基于机器学习的ofdm解调器的设计和解调方法 |
-
2019
- 2019-10-17 EP EP19203894.1A patent/EP3809334A1/fr not_active Withdrawn
-
2020
- 2020-10-05 US US17/765,319 patent/US12462143B2/en active Active
- 2020-10-05 CN CN202080087783.5A patent/CN114761971A/zh active Pending
- 2020-10-05 WO PCT/EP2020/077805 patent/WO2021073919A1/fr not_active Ceased
- 2020-10-05 EP EP20797038.5A patent/EP4022515A1/fr active Pending
Non-Patent Citations (13)
| Title |
|---|
| AIGNER, W.MIKSCH, S.MULLER, W.SCHUMANN, H.TOMINSKI, C.: "Visual methods for analyzing time- oriented data", IEEE TRANSACTIONS ON VISUALIZATION AND COM-IPUTER GRAPHICS, vol. 14, no. 1, 2008, pages 47 - 60, XP011344453, doi:10.1109/TVCG.2007.70415 |
| AIGNER, W.MIKSCH, S.SCHUMANN, H.TOMINSKI, C.: "Visualization of Time-Oriented Data", 2011, SPRINGER PUB-LISHING COMPANY, INCORPORATED |
| ANNE MARIE DELANEY ET AL: "Synthesis of Realistic ECG using Generative Adversarial Networks", ARXIV.ORG, CORNELL UNIVERSITY LIBRARY, 201 OLIN LIBRARY CORNELL UNIVERSITY ITHACA, NY 14853, 19 September 2019 (2019-09-19), XP081479353 * |
| BOGL MARKUS ET AL: "Visual Analytics for Model Selection in Time Series Analysis", IEEE TRANSACTIONS ON VISUALIZATION AND COMPUTER GRAPHICS, IEEE SERVICE CENTER, LOS ALAMITOS, CA, US, vol. 19, no. 12, December 2013 (2013-12-01), pages 2237 - 2246, XP011529792, ISSN: 1077-2626, [retrieved on 20131016], DOI: 10.1109/TVCG.2013.222 * |
| C ESTEBANSL HYLAND: "Real-valued (medical) time series generation with recurrent conditional gans", ARXIV PREPRINT ARXIV:1706.02633, 2017 |
| CRIST\'OBAL ESTEBAN ET AL: "Real-valued (Medical) Time Series Generation with Recurrent Conditional GANs", ARXIV.ORG, CORNELL UNIVERSITY LIBRARY, 201 OLIN LIBRARY CORNELL UNIVERSITY ITHACA, NY 14853, 8 June 2017 (2017-06-08), XP080768503 * |
| GOGOLOU ANNA ET AL: "Comparing Similarity Perception in Time Series Visualizations", IEEE TRANSACTIONS ON VISUALIZATION AND COMPUTER GRAPHICS, IEEE SERVICE CENTER, LOS ALAMITOS, CA, US, vol. 25, no. 1, January 2019 (2019-01-01), pages 523 - 533, XP011699088, ISSN: 1077-2626, [retrieved on 20181207], DOI: 10.1109/TVCG.2018.2865077 * |
| GOODFELLOW, I.POUGET-ABADIE, J.MIR-ZA, M.XU, B.WARDE-FARLEY, D.OZAIR, S.COURVILLE, A.BENGIO, Y.: "Advances in Neural Information Processing Sys- tems", vol. 27, 2014, CURRAN ASSOCIATES, INC., article "Generative adversarial nets", pages: 2672 - 2680 |
| IVANOV, P. C.MARK, R. G.MIETUS, J. E.MOODY, G. B.PENG, C.-K.STANLEY, H. E.: "Physi-oBank, PhysioToolkit, and PhysioNet: Components of a new research resource for complex physiologic signals", CIRCULATION, vol. 101, no. 23, 13 June 2000 (2000-06-13), pages e215 - e220, Retrieved from the Internet <URL:http://circ.ahajournals.org/content/101/23/e215.full> |
| KAY GREGOR HARTMANN ET AL: "EEG-GAN: Generative adversarial networks for electroencephalograhic (EEG) brain signals", ARXIV.ORG, CORNELL UNIVERSITY LIBRARY, 201 OLIN LIBRARY CORNELL UNIVERSITY ITHACA, NY 14853, 5 June 2018 (2018-06-05), XP080887460 * |
| MINSUK KAHNG ET AL: "GAN Lab: Understanding Complex Deep Generative Models using Interactive Visual Experimentation", ARXIV.ORG, CORNELL UNIVERSITY LIBRARY, 201 OLIN LIBRARY CORNELL UNIVERSITY ITHACA, NY 14853, 5 September 2018 (2018-09-05), XP081187569, DOI: 10.1109/TVCG.2018.2864500 * |
| SALIMANS, T.GOODFELLOW, I.ZAREMBA, W.CHEUNG, V.RAD-IFORD, A.CHEN, X.CHEN, X.: "Advances in Neural Information Processing Systems", vol. 29, 2016, CURRAN ASSOCIATES, INC., article "Improved techniques for training gans", pages: 2234 - 2242 |
| THEIS, L.VAN DEN OORD, A.BETHGE, M.: "A note on the evaluation of generative models", INTERNATIONAL CONFERENCE ON LEARNING REPRESENTATIONS, 2016 |
Also Published As
| Publication number | Publication date |
|---|---|
| CN114761971A (zh) | 2022-07-15 |
| US12462143B2 (en) | 2025-11-04 |
| US20230004783A1 (en) | 2023-01-05 |
| EP4022515A1 (fr) | 2022-07-06 |
| WO2021073919A1 (fr) | 2021-04-22 |
Similar Documents
| Publication | Publication Date | Title |
|---|---|---|
| US11216741B2 (en) | Analysis apparatus, analysis method, and non-transitory computer readable medium | |
| US11468664B2 (en) | Machine learning to predict cognitive image composition | |
| Ahishali et al. | Advance warning methodologies for covid-19 using chest x-ray images | |
| Parvatharaju et al. | Learning saliency maps to explain deep time series classifiers | |
| JP5340204B2 (ja) | 推論装置、その制御方法およびプログラム | |
| US11593299B2 (en) | Data analysis device, data analysis method and data analysis program | |
| CN110472802B (zh) | 一种数据特征评估方法、装置及设备 | |
| US20210124740A1 (en) | Information processing apparatus, information processing method, and computer program | |
| CN116997866A (zh) | 生成用于在工业机器中使用的虚拟传感器 | |
| US11310349B1 (en) | Transforming multivariate time series data into image data to generate image-based predictions | |
| Kilci et al. | Classification of Biscuit Quality With Deep Learning Algorithms | |
| JP2019105871A (ja) | 異常候補抽出プログラム、異常候補抽出方法および異常候補抽出装置 | |
| Mirza et al. | Human heart disease prediction using data mining techniques | |
| US12462143B2 (en) | Evaluation framework for time series data | |
| Jiang et al. | A novel digital twin method based on diffusion models for imbalanced fault diagnosis of rotating machinery | |
| Le et al. | An Internet of Things-Integrated Deep Learning Model for Fault Diagnosis in Industrial Rotating Machines | |
| Hariprasath | Detection of Stress by Machine Learning in IT Industry | |
| EP3933683A1 (fr) | Systèmes et procédés d'imagerie numérique permettant d'analyser les données de pixel d'une image du corps d'un utilisateur avant une épilation pour déterminer une valeur de cheveux piégés spécifique à l'utilisateur | |
| CN113486925A (zh) | 模型训练方法、眼底图像生成方法、模型评估方法及装置 | |
| Nguyen-Trong et al. | Graph Convolutional Network for Occupational Disease Prediction with Multiple Dimensional Data | |
| US20240062103A1 (en) | Machine learning system, edge device, and information processing device | |
| Attar et al. | Automated diagnosis of mitral valve diseases using echocardiographic images: A comparative study of GLCM features and deep learning techniques | |
| JP7804319B2 (ja) | 時系列分類装置、時系列分類プログラム及び時系列分類方法 | |
| Rueckert et al. | Machine Learning Approaches Based on Radiomics–94 | |
| CN110033193A (zh) | 用户信息的处理方法、装置和电子设备 |
Legal Events
| Date | Code | Title | Description |
|---|---|---|---|
| PUAI | Public reference made under article 153(3) epc to a published international application that has entered the european phase |
Free format text: ORIGINAL CODE: 0009012 |
|
| STAA | Information on the status of an ep patent application or granted ep patent |
Free format text: STATUS: THE APPLICATION HAS BEEN PUBLISHED |
|
| AK | Designated contracting states |
Kind code of ref document: A1 Designated state(s): AL AT BE BG CH CY CZ DE DK EE ES FI FR GB GR HR HU IE IS IT LI LT LU LV MC MK MT NL NO PL PT RO RS SE SI SK SM TR |
|
| AX | Request for extension of the european patent |
Extension state: BA ME |
|
| STAA | Information on the status of an ep patent application or granted ep patent |
Free format text: STATUS: THE APPLICATION IS DEEMED TO BE WITHDRAWN |
|
| 18D | Application deemed to be withdrawn |
Effective date: 20211022 |