EP3859329A1 - Procédé, système informatique, et programme de prédiction de caractéristique d'une cible - Google Patents
Procédé, système informatique, et programme de prédiction de caractéristique d'une cible Download PDFInfo
- Publication number
- EP3859329A1 EP3859329A1 EP19864717.4A EP19864717A EP3859329A1 EP 3859329 A1 EP3859329 A1 EP 3859329A1 EP 19864717 A EP19864717 A EP 19864717A EP 3859329 A1 EP3859329 A1 EP 3859329A1
- Authority
- EP
- European Patent Office
- Prior art keywords
- data
- target
- property
- subject
- parameter set
- Prior art date
- Legal status (The legal status is an assumption and is not a legal conclusion. Google has not performed a legal analysis and makes no representation as to the accuracy of the status listed.)
- Pending
Links
Images





Classifications
-
- G—PHYSICS
- G01—MEASURING; TESTING
- G01N—INVESTIGATING OR ANALYSING MATERIALS BY DETERMINING THEIR CHEMICAL OR PHYSICAL PROPERTIES
- G01N33/00—Investigating or analysing materials by specific methods not covered by groups G01N1/00 - G01N31/00
- G01N33/48—Biological material, e.g. blood, urine; Haemocytometers
- G01N33/483—Physical analysis of biological material
- G01N33/4833—Physical analysis of biological material of solid biological material, e.g. tissue samples, cell cultures
- G01N33/4836—Physical analysis of biological material of solid biological material, e.g. tissue samples, cell cultures using multielectrode arrays
-
- G—PHYSICS
- G01—MEASURING; TESTING
- G01N—INVESTIGATING OR ANALYSING MATERIALS BY DETERMINING THEIR CHEMICAL OR PHYSICAL PROPERTIES
- G01N21/00—Investigating or analysing materials by the use of optical means, i.e. using sub-millimetre waves, infrared, visible or ultraviolet light
- G01N21/62—Systems in which the material investigated is excited whereby it emits light or causes a change in wavelength of the incident light
- G01N21/63—Systems in which the material investigated is excited whereby it emits light or causes a change in wavelength of the incident light optically excited
- G01N21/64—Fluorescence; Phosphorescence
- G01N21/6428—Measuring fluorescence of fluorescent products of reactions or of fluorochrome labelled reactive substances, e.g. measuring quenching effects, using measuring "optrodes"
-
- G—PHYSICS
- G01—MEASURING; TESTING
- G01N—INVESTIGATING OR ANALYSING MATERIALS BY DETERMINING THEIR CHEMICAL OR PHYSICAL PROPERTIES
- G01N21/00—Investigating or analysing materials by the use of optical means, i.e. using sub-millimetre waves, infrared, visible or ultraviolet light
- G01N21/62—Systems in which the material investigated is excited whereby it emits light or causes a change in wavelength of the incident light
- G01N21/63—Systems in which the material investigated is excited whereby it emits light or causes a change in wavelength of the incident light optically excited
- G01N21/64—Fluorescence; Phosphorescence
- G01N21/645—Specially adapted constructive features of fluorimeters
- G01N21/6456—Spatial resolved fluorescence measurements; Imaging
- G01N21/6458—Fluorescence microscopy
-
- G—PHYSICS
- G16—INFORMATION AND COMMUNICATION TECHNOLOGY [ICT] SPECIALLY ADAPTED FOR SPECIFIC APPLICATION FIELDS
- G16C—COMPUTATIONAL CHEMISTRY; CHEMOINFORMATICS; COMPUTATIONAL MATERIALS SCIENCE
- G16C20/00—Chemoinformatics, i.e. ICT specially adapted for the handling of physicochemical or structural data of chemical particles, elements, compounds or mixtures
- G16C20/30—Prediction of properties of chemical compounds, compositions or mixtures
-
- G—PHYSICS
- G01—MEASURING; TESTING
- G01N—INVESTIGATING OR ANALYSING MATERIALS BY DETERMINING THEIR CHEMICAL OR PHYSICAL PROPERTIES
- G01N21/00—Investigating or analysing materials by the use of optical means, i.e. using sub-millimetre waves, infrared, visible or ultraviolet light
- G01N21/62—Systems in which the material investigated is excited whereby it emits light or causes a change in wavelength of the incident light
- G01N21/63—Systems in which the material investigated is excited whereby it emits light or causes a change in wavelength of the incident light optically excited
- G01N21/64—Fluorescence; Phosphorescence
- G01N21/6428—Measuring fluorescence of fluorescent products of reactions or of fluorochrome labelled reactive substances, e.g. measuring quenching effects, using measuring "optrodes"
- G01N2021/6439—Measuring fluorescence of fluorescent products of reactions or of fluorochrome labelled reactive substances, e.g. measuring quenching effects, using measuring "optrodes" with indicators, stains, dyes, tags, labels, marks
-
- G—PHYSICS
- G16—INFORMATION AND COMMUNICATION TECHNOLOGY [ICT] SPECIALLY ADAPTED FOR SPECIFIC APPLICATION FIELDS
- G16C—COMPUTATIONAL CHEMISTRY; CHEMOINFORMATICS; COMPUTATIONAL MATERIALS SCIENCE
- G16C20/00—Chemoinformatics, i.e. ICT specially adapted for the handling of physicochemical or structural data of chemical particles, elements, compounds or mixtures
- G16C20/70—Machine learning, data mining or chemometrics
Definitions
- the present invention relates to a method, a computer system, or a program for predicting a property of a target. More specifically, the present invention relates to a method or the like for predicting a property of a target compound.
- An effective method of predicting a property of a target with an unknown property is sought after, regardless of the field.
- Non Patent Literature 1 Non Patent Literature 1
- the objective of the present invention is to provide a method for predicting an unknown property of a target such as a target compound.
- the present invention provides, for example, the following items.
- the present invention can provide a method or the like of predicting an unknown property (e.g., toxicity to or efficacy on the nervous system) of a target such as a target compound.
- an unknown property e.g., toxicity to or efficacy on the nervous system
- target compound refers to a compound targeted for prediction of a property.
- a target compound can be an unknown compound or a known compound.
- properties of a target compound include, but are not limited to, efficacy, toxicity, and mechanism of action.
- efficacy refers to an effect induced as a result of applying an agent to a subject. If an agent is for example an anti-cancer agent, the efficacy can be a direct effect on a subject such as contraction of a cancerous area under X-ray observation, delay in advancement of cancer, and extended survival of a cancer patient, or an indirect effect such as a reduction in a biomarker correlated with advancement of cancer. As used herein, “efficacy" is intended as an effect under any application condition.
- an agent is for example an anti-cancer agent
- the efficacy can be an effect in a specific subject (e.g., 80-year-old or older male) or an effect under a specific application condition (e.g., under concomitant use with another anticancer therapy).
- an agent can have a single efficacy or a plurality of efficacies.
- an agent can have efficacy that varies under different application conditions. In general, efficacy refers to an effect intended to be achieved.
- toxicity refers to an unfavorable effect that is manifested from application of an agent to a subject. In general, toxicity is an effect that is different from the intended effect of an agent. Toxicity can manifest through the same or different mechanism of action from efficacy. If an agent is for example an anti-cancer agent, hepatotoxicity due to killing of normal hepatocytes may manifest concurrently with the efficacy for killing cancer cells via the mechanism of action of suppression of cell proliferation, or toxicity for a neurological dysfunction may manifest via the mechanism of action of membrane stabilization concurrently with efficacy for killing cancer cells via the mechanism of action of suppression of cell proliferation.
- mechanism of action refers to the manner of interaction of an agent with a biological mechanism. If an agent is for example an anti-cancer agent, the mechanism of action can be various levels of events, such as activation of the immune system, killing of cells with a rapid growth rate, blockage of proliferative signaling, blockage of a specific receptor, and inhibition of transcription of a specific gene. If the mechanism of action is identified, efficacy, toxicity, and/or suitable usage form can be predicted based on accumulated information.
- the inventors of the present invention developed an approach of predicting a property of a target compound using multivariate analysis in order to evaluate a property of a target compound with respect to the nervous system in non-clinical trials.
- the method of the invention can deduce a prediction parameter set that is suitable for isolating a response of a known compound by using multivariate analysis on multiple (preferably all) combinations in a parameter set comprising a plurality of candidate parameters.
- Activity data obtained when a target compound is administered to a neuron is analyzed using the prediction parameter set to predict the known compound whose property is similar to a property of the target compound.
- activity data obtained when each of a plurality of known compounds having each of the properties to be isolated e.g., when isolating the property of "presence/absence of toxicity", known compound A with a property of "with toxicity", and known compound B with a property of "without toxicity"
- activity data obtained when each of a plurality of known compounds having each of the properties to be isolated is subjected to multivariate analysis to deduce a prediction parameter set that can isolate such properties. It is possible to predict whether a property of a target compound is "with toxicity" or "without toxicity” by analyzing activity data obtained when the target compound is administered to a neuron by using such a prediction parameter set.
- Deduction of a prediction parameter set in accordance with a property to be isolated enables the prediction of what efficacy the target compound has, what toxicity the target compound has, or what mechanism of action the target compound has. This enables prediction of efficacy, toxicity, or mechanism of action of a target compound in nonclinical trials.
- analysis using human iPS cells enables prediction of the action or toxicity of a compound on the human nervous system, leading to materialization of rapid and cost effective development of a pharmaceutical product or development of compounds in general.
- this methodology can also predict and output, for example, what mechanism of action a target compound has for the predicted efficacy or what mechanism of action a target compound has for the predicted toxicity. In this manner, not only abstract properties, but also specific properties of a target compound can be predicted.
- a known compound is used as a target compound, drug repositioning of the known compound can be performed.
- a new efficacy of the known compound can be found based on the efficacy, toxicity, or mechanism of action predicted by analyzing activity data obtained when the known compound is administered to a neuron. This enables discovery of new efficacy of the known compound and drastic reduction in development cost of a therapeutic drug in nonclinical trials.
- the deduced prediction parameter set would not be dependent on a difference between cell species, difference between samples, or difference between facilities by using data with a difference between cell species, difference between samples, or difference between facilities when deducing a prediction parameter set. This allows construction of a consistent agent evaluation system using neural activity data.
- Such a prediction of a property of a target compound using multivariate analysis can be materialized, for example, with a computer system for predicting a property of a target compound described below.
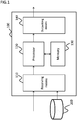
- Figure 1 shows an example of a configuration of the computer system 100 for predicting a property of a target compound of the invention.
- the computer system 100 comprises receiving means 110, a processor 120, a memory 130, and outputting means 140.
- the computer system 100 can be connected to a database unit 200.
- the receiving means 110 is configured to be able to receive data from the outside of the computer system 100.
- the receiving means 110 can, for example, receive data via a network from the outside of the computer system 100, or receive data from a storage medium (e.g., USB memory, optical disk, or the like) or the database unit 200 connected to the computer system 100.
- a storage medium e.g., USB memory, optical disk, or the like
- the type of network is not limited.
- the receiving means 110 can, for example, receive data by utilizing a wireless LAN such as Wi-Fi or receive data via the Internet.
- the receiving means 110 receives activity data for a neuron in response to a known compound or target compound.
- Activity data for a neuron is data that can be obtained by any known methodology.
- Activity data for a neuron is, for example, potential data measured using a micro-electrode array (MEA).
- MEA micro-electrode array
- Such potential data is obtained, for example, by culturing a neuron on an MEA and measuring the activity potential and synaptic current component of the neuron upon administration of a known compound or target compound to the cultured neuron.
- MEA micro-electrode array
- CMOS-MEA utilizing CMOS can be used as the MEA.
- relatively high resolution data can be obtained.
- Activity data for a neuron is, for example, potential data measured using a multipoint electrode.
- potential data is obtained, for example, by applying a multipoint electrode on the brain of an animal and measuring the activity potential of a neuron when a known compound or target compound is administered in an animal experiment.
- Activity data for a neuron can also be, for example, image data obtained by an optical measurement method.
- An optical measurement method is, for example, Ca 2+ imaging.
- image data is obtained by imaging the activity of a neuron when a known compound or target compound is administered to the neuron through Ca 2+ imaging.
- An optical measurement method is, for example, membrane potential imaging using a membrane potential sensitive dye.
- image data is obtained by imaging the activity of a neuron when a known compound or target compound is administered to the neuron through membrane potential imaging.
- use of MEA can be preferable from the viewpoint of temporal resolution. This is because MEA has higher temporal resolution and is capable of more accurately detecting each spike, so that the amount of information obtained on activity data is greater, compared to Ca 2+ imaging and membrane potential imaging. Membrane potential imaging has higher temporal resolution than Ca 2+ imaging.
- MEA can be preferable from the viewpoint of long-term measurement. This is because MEA is less invasive compared to Ca 2+ imaging and membrane potential imaging.
- Ca 2+ imaging or membrane potential imaging can be preferable from the viewpoint of cell resolution. This is because Ca 2+ imaging or membrane potential imaging can mark all cells through microscope observation, so that spatial resolution is higher compared to MEA and therefore raster plot images can be readily created in subsequent processing.
- the receiving means 110 can be configured, for example, to receive an image from converting activity data for a neuron in response to a known compound or a target compound.
- a converted image can be, for example, a raster plot image from converting activity data for a neuron obtained as potential data or activity data for a neuron obtained as an image data, a histogram from converting activity data for a neuron obtained as potential data or activity data for a neuron obtained as an image data, a waveform image converted from activity data for a neuron obtained as potential data, or a frequency intensity map or spectrum intensity map from converting activity data for a neuron obtained as potential data by frequency component analysis (e.g., wavelet transform or Fourier transform (e.g., fast Fourier transform (FFT))).
- frequency component analysis e.g., wavelet transform or Fourier transform (e.g., fast Fourier transform (FFT)
- a spectrum intensity map can be obtained, for example, by applying FFT on a waveform obtained by converting activity data for a neuron obtained as potential data into a waveform (or frequency division waveform) and dividing the waveform by a predetermined time interval (e.g., one second interval).
- a frequency division waveform refers to a waveform from extracting a specific frequency band component.
- a specific frequency band component can be, for example, a ⁇ wave frequency component (about 4 to about 8 Hz), ⁇ wave frequency component (about 8 to about 13 Hz), ⁇ wave frequency component (about 13 to about 30 Hz), ⁇ wave frequency component (about 30 to about 100 Hz), or the like.
- a frequency band component can be a ⁇ wave frequency component.
- a frequency band component can be an ⁇ wave frequency component.
- a frequency band component can be a ⁇ wave frequency component.
- a frequency band component can be a ⁇ wave frequency component.
- Use of a frequency division waveform enables analysis focusing on a phenomenon observed in vivo. For example, a ⁇ wave frequency component of brain waves is enhanced upon an epileptic seizure, so that a property of a target compound associated with epileptic seizure can be analyzed by using a frequency division waveform of a ⁇ wave frequency component.
- a neuron is, for example, a neural stem cell.
- a neural stem cell can be, for example, an animal neural stem cell or a human neural stem cell.
- a neural stem cell is, for example, an iPS cell.
- a neuron can be, for example, a primary neuron harvested from an animal.
- Data received by the receiving means 110 is passed along to the processor 120 for subsequent processing.
- the processor 120 controls the entire operation of the computer system 100.
- the processor 120 reads out a program stored in the memory 130, and executes the program. This allows the computer system 100 to function as an apparatus for executing a desired step.
- the processor 120 can be implemented by a single processor or a plurality of processors. Data processed by the processor 120 is passed along to the outputting means 140 for output.
- a program for executing processing in the computer system 100 data required for executing the program, and the like are stored.
- a program for predicting a property of a target compound e.g., program for materializing the processing shown in Figure 7 , 8 , or 9 described below
- An application implementing any function can be stored in the memory 130.
- a program for converting received potential data or image data into a raster plot image, histogram, waveform image, or the like can be stored.
- how a program is stored in the memory 130 is not limited.
- a program can be preinstalled in the memory 130.
- a program can be installed in the memory 130 by being downloaded via a network.
- the memory 130 can be implemented with any storage means.
- the outputting means 140 is configured to be able to output data to the outside of the computer system 100.
- the mode of how the outputting means 140 is enabled to output information from the computer system 100 is not limited. If the outputting means 140 is, for example, a display screen, information can be outputted on the display screen. Alternatively, if the outputting means 140 is a speaker, information can be outputted via audio from the speaker. Alternatively, if the outputting means 140 is a data writing apparatus, information can be outputted by writing information into a storage medium or the database unit 200 connected to the computer system 100. Alternatively, if the outputting means 140 is a transmitter, data can be outputted by the transmitter sending information out of the computer system 100 via a network. In such a case, the type of network is not limited.
- a transmitter can transmit information via the Internet or via LAN.
- the outputting means 140 can output data after converting the data into a format that is compatible with the hardware or software receiving the output, or after adjusting the data to a response rate that is compatible with the hardware or software receiving the output.
- activity data for a neuron in response to a known compound can be stored in the database unit 200 connected to the computer system 100.
- Activity data for a neuron in response to a known compound can be stored while being associated with a property of the known compound.
- activity data for a neuron in response to a target compound can be stored in the database unit 200.
- data outputted by the computer system 100 e.g., predicted property of a target compound
- An identified prediction parameter can be stored in the database unit 200.
- Data resulting from multivariate analysis on activity data for a neuron in response to a known compound and/or activity data for a neuron in response to a target compound can be stored in the database unit 200.
- Activity data for a neuron in response to a known compound or target compound stored in the database unit 200 can be stored, for example, after removing data representing an outlier value. This can be accomplished, for example, by utilizing a property of a compound that can be identified by the multivariate analysis described below to exclude activity data that does not have the same property as such a property as an outlier value. This can refine data that can be stored in the database unit 200.
- the database unit 200 is provided external to the computer system 100, but the present invention is not limited thereto.
- the database unit 200 can also be provided inside the computer system 100.
- the database unit 200 can be implemented by the same or different storage means as the storage means implementing the memory 130.
- the database unit 200 is configured as a storage unit for the computer system 100.
- the configuration of the database unit 200 is not limited to a specific hardware configuration.
- the database unit 200 can be comprised of a single hardware part or a plurality of hardware parts.
- the database unit 200 can be configured as an external hard disk drive of the computer system 100, or as a storage on the cloud connected via a network.
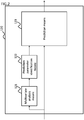
- Figure 2 shows an example of the configuration of the processor 120.
- the processor 120 comprises at least multivariate analysis means 121, prediction parameter identification means 122, and prediction means 123.
- the multivariate analysis means 121 is configured to perform multivariate analysis on inputted data.
- the multivariate analysis means 121 performs multivariate analysis on received activity data for a neuron in response to a first known compound and activity data for a neuron in response to a second known compound.
- Multivariate analysis is, for example, principle component analysis. At least the first principle component and second principle component of data can be computed by principle component analysis.
- principle component analysis can be configured to compute the third principle component, fourth principle component ... n-1st principle component (wherein n is the number of dimensions of inputted data).
- Multivariate analysis is, for example, cluster analysis. Data can be classified into a plurality of clusters by cluster analysis.
- Ward's method can be used as the algorithm of cluster analysis.
- the mean distance, distance between centroids, maximum distance, or minimum distance can also be used.
- the Euclidean distance can be used as an indicator for determining similarity.
- the Mahalanobis distance or Spearman's rank correlation can also be used.
- cosine similarity can also be used as an indicator for determining similarity.
- a combination of Euclidean distance and cosine similarity can also be used as an indicator for determining similarity.
- a threshold value of an indicator for determining similarity can be set to any value in accordance with the data.
- Data inputted into the multivariate analysis means 121 can comprise, for example, a plurality of pieces of data from administering the same compound to different cell species, a plurality of pieces of data from administering the same compound to the same cell species supplied by different vendors, a plurality of pieces of data from administering the same compound to samples of different lots supplied by the same vendor, a plurality of pieces of data from administering the same compound to samples supplied on different dates by the same vendor, or a plurality of pieces of data from testing the same compound at different facilities.
- a prediction parameter set that is not dependent on the difference between samples, difference between cell species, or difference between facilities can be identified with the prediction parameter identification means 122 described below by processing a plurality of pieces of data with the multivariate analysis means 121.
- Data inputted into the multivariate analysis means 121 can be, for example, activity data for a neuron in response to a known compound or a target compound or an image converted therefrom.
- a converted image can be, for example, a raster plot image from converting activity data for a neuron obtained as potential data or activity data for a neuron obtained as an image data, a histogram from converting activity data for a neuron obtained as potential data or activity data for a neuron obtained as an image data, a waveform image converted from activity data for a neuron obtained as potential data, or a frequency intensity map from converting activity data for a neuron obtained as potential data by frequency component analysis (e.g., wavelet transform).
- a converted image can be, for example, an image received by the receiving means 110 or an image converted by the processor 120 in a stage prior to the multivariate analysis means 121.
- the multivariate analysis means 121 performs multivariate analysis on activity data for a neuron in response to a first known compound and activity data for a neuron in response to a second known compound for every combination of each of the candidate parameters in a candidate parameter set.
- the multivariate analysis means 121 can perform multivariate analysis on activity data for a neuron in response to three or more compounds for every combination of each of the candidate parameters in a candidate parameter set.
- a parameter set for multivariate analysis needs to comprise three or more candidate parameters because multivariate analysis cannot be performed with two or fewer candidate parameters. If, for example, a candidate parameter set consists of 10 candidate parameters, every combination of each of the candidate parameters would be 968 parameter sets (each parameter set comprising 3 to 10 candidate parameters).
- the multivariate analysis means 121 performs multivariate analysis on activity data for a neuron in response to a first known compound and activity data for a neuron in response to a second known compound for each of the 968 parameter sets.
- Figure 3 is a diagram describing an example of candidate parameters contained in a candidate parameter set.
- the graph in Figure 3 is a diagram combining a raster plot image and a histogram generated from the raster plot image.
- the diagram shows a raster plot image on the bottom side of the graph, and a histogram on the top side of the graph.
- the vertical axis indicates an electrode
- the horizontal axis indicates time
- black plots represent spikes.
- the vertical axis indicates the spike count per second
- the horizontal axis indicates time.
- candidate parameters include:
- a candidate parameter comprises, for example, a basic activity parameter.
- a basic activity parameter comprises:
- a candidate parameter comprises, for example, a mean value of burst structure parameters for all bursts.
- a burst structure parameter is a parameter related to synchronized burst firing, and includes for example,
- a candidate parameter can comprise a standard deviation or median absolute deviation of burst structure parameters (e.g., at least one of burst duration, spike count in a burst, IBI, IPI, PS, peak time percentage, mean ISI within burst, median ISI within burst, and median/mean ISI within burst) for all bursts.
- a candidate parameter can comprise, for example, a median value of burst structure parameters (e.g., at least one of burst duration, spike count in a burst, IBI, IPI, PS, peak time percentage, mean ISI within burst, median ISI within burst, and median/mean ISI within burst) for all bursts.
- a candidate parameter can comprise, for example, a standard error of burst structure parameters (e.g., at least one of burst duration, spike count in a burst, IBI, IPI, PS, peak time percentage, mean ISI within burst, median ISI within burst, and median/mean ISI within burst) for all bursts.
- a standard error of burst structure parameters e.g., at least one of burst duration, spike count in a burst, IBI, IPI, PS, peak time percentage, mean ISI within burst, median ISI within burst, and median/mean ISI within burst
- a candidate parameter comprises a parameter related to periodicity.
- a parameter related to periodicity comprises, for example, periodicity (periodicity parameter).
- Figure 4A -a is a diagram combining a raster plot image and a histogram generated from the raster plot image.
- the diagram shows a raster plot image on the bottom side of the graph, and a histogram on the top side of the graph.
- the vertical axis indicates an electrode
- the horizontal axis indicates time
- black plots represent spikes.
- the vertical axis indicates the spike count per second
- the horizontal axis indicates time.
- the graphs are, from the top, a raster plot image and histogram when administering a vehicle, a raster plot image and histogram when administering a compound at about 0.1 ⁇ M, a raster plot image and histogram when administering a compound at about 0.3 ⁇ M, a raster plot image and histogram when administering a compound at about 1 ⁇ M, a raster plot image and histogram when administering a compound at about 3 ⁇ M, and a raster plot image and histogram when administering a compound at about 10 ⁇ M.
- Figure 4A -b shows a power spectrum deduced by performing discrete Fourier transform (DFT) on the histogram of Figure 4A -a.
- the vertical axis indicates power, and the horizontal axis indicates frequency.
- the graphs are, from the top, a power spectrum when administering a vehicle, a power spectrum when administering a compound at about 0.1 ⁇ M, a power spectrum when administering a compound at about 0.3 ⁇ M, a power spectrum when administering a compound at about 1 ⁇ M, a power spectrum when administering a compound at about 3 ⁇ M, and a power spectrum when administering a compound at about 10 ⁇ M.
- DFT discrete Fourier transform
- the bandwidth of a frequency band exceeding a threshold value which is about 10% of a peak value of a basic wave, is defined as the dominant frequency band, as shown in Figure 4B , and the entire bandwidth of frequencies contained in a power spectrum is defined as the all frequency band.
- Periodicity can be computer thereby in each power spectrum in Figure 4A -b. If, for example, a plurality of bandwidths exceed the threshold value as shown in Figure 4B , the value of the dominant frequency band is the total value of the plurality of bandwidths.
- Figure 4C is a bar graph showing the values of periodicity and NoB when assuming the value from administering a vehicle as 100%.
- a black bar graph indicates the value of periodicity
- a white bar graph indicates the value of NoB.
- the value of NoB hardly changes in accordance with the compound concentration, whereas the value of periodicity changes significantly in accordance with the compound concentration.
- the value of periodicity can be considered as an indicator reflecting a change in concentration.
- a parameter related to periodicity can comprise, for example, a coefficient of variation (CV) of burst structure parameters (e.g., at least one of burst duration, spike count in a burst, IBI, IPI, PS, peak time percentage, mean ISI within burst, median ISI within burst, and median/mean ISI within burst).
- CV coefficient of variation
- a burst structure parameter e.g., at least one of burst duration, spike count in a burst, IBI, IPI, PS, peak time percentage, mean ISI within burst, median ISI within burst, and median/mean ISI within burst.
- a parameter related to periodicity can comprise, for example, a mean value, standard deviation, standard error, median value, median absolute deviation, or coefficient of variation for all bursts of CV ISI within Burst (coefficient of variation of ISI within burst). Since the coefficient of variation of ISI is computed for each burst for each of these parameters, the mean value, standard deviation, median absolute value, or coefficient of variation for all bursts is computed using a coefficient of variation of ISI for each burst. By including a coefficient of variation of ISI within burst in a candidate parameter set, multivariate analysis is performed while including a concept of regularity of firing within a burst. Thus, an effect of isolating a known compound with varying regularity in firing within a burst and improving the accuracy of prediction of a target compound is attained.
- a parameter related to periodicity is effective in isolating the type of compound that excites the neural network activity (seizure positive compound).
- inclusion of a parameter related to periodicity in a candidate parameter set also has the advantage of being able to increase types of compounds that can be isolated.
- a candidate parameter comprises, for example, a parameter for analyzing a frequency.
- a parameter for analyzing a frequency is, for example, a parameter that can analyze a frequency component of about 250 Hz or less.
- a frequency component of about 250 Hz or less is less than an action potential component (about 1 kHz or greater) and is reflective of a post synaptic current component that is important for a neurological function.
- a property of a compound with respect to a neuron can be detected with a parameter for analyzing a frequency component of about 250 Hz or less.
- a parameter for analyzing a frequency component of about 250 Hz or less is an indicator that can be compared with in vivo brain waves and allows correlation between in vivo and in vitro frequencies to be measured.
- a parameter for analyzing a frequency comprises, for example, intensity computed from potential data or waveform image.
- Such an intensity decomposes potential data or waveform image into a plurality of frequency components, and is represented by the following equation in terms of each of the decomposed frequency component.
- Intensity ⁇ action potential ⁇ sampling period synchronized burst firing period
- a plurality of frequency components include, for example, a ⁇ wave band of about 4 to about 8 Hz, ⁇ wave band of about 8 to about 14 Hz, ⁇ wave band of about 15 to about 30 Hz, ⁇ wave band of about 35 to about 50 Hz, high- ⁇ wave band of about 80 to about 150 Hz, and about 150 to about 200 Hz.
- a waveform image is decomposed into a plurality of frequency components as shown in Figure 5A . Decomposition is performed, for example, by using a band pass filter corresponding to each frequency component.
- Figure 5A schematically shows an example of a waveform image decomposed into a plurality of frequency components.
- the graph shown in Figure 5A is a potential waveform image.
- the vertical axis indicates potential, and the horizontal axis indicates time.
- a periodic waveform comprising a single burst is extracted and decomposed into frequency component of a ⁇ wave band of about 4 to about 8 Hz, ⁇ wave band of about 8 to about 14 Hz, ⁇ wave band of about 15 to about 30 Hz, ⁇ wave band of about 35 to about 50 Hz, high- ⁇ wave band of about 80 to about 150 Hz, and about 150 to about 200 Hz.
- Figure 5B is a graph showing an example of a result of computing the intensity for each frequency component in Figure 5A .
- the vertical axis indicates the value of intensity when assuming the value prior to administration of the compound as 100%.
- Figure 5B shows results at a plurality of concentrations (about 1 ⁇ M, about 10 ⁇ M, about 100 ⁇ M, and about 1 mM).
- the value of intensity changes in accordance with the compound concentration for each frequency component.
- the value of intensity can be considered as an indicator reflecting the change in concentration.
- a parameter for analyzing a frequency comprises, for example, intensity computed from wavelet transform.
- intensity is computed from a scalogram generated by waveform transform of potential data or waveform image.
- intensity can be computed by finding the difference between a scalogram generated by wavelet transform on data prior to administration of a compound and a scalogram generated by wavelet transform on data after administration of the compound.
- the pixel count of the X axis varies by the burst duration, and the pixel count of the Y axis is for example 170 pixels.
- the pixel count of the Y axis occupying each frequency band varies by each frequency band.
- the pixel count of the Y axis of a frequency band of about 5 to about 8 Hz is 21 pixels
- the pixel count of the Y axis of a frequency band of about 8 to about 14 Hz is 15 pixels
- the pixel count of the Y axis of a frequency band of about 15 to about 25 Hz is 24 pixels
- the pixel count of the Y axis of the frequency band of about 30 to about 50 Hz is 31 pixels
- the pixel count of the Y axis of the frequency band of about 70 to about 150 Hz is 34 pixels
- the pixel count of the Y axis of the frequency band of about 150 to about 200 Hz is 13 pixels.
- the intensity of each frequency band cannot be simply compared.
- WT A WT S N X ⁇ N Y f
- WT S is the total value of wavelet transform coefficients of each frequency band
- N X is the pixel count of the X axis
- N Y (f) is the pixel count of the Y axis of each frequency band.
- Intensity can be computed by deriving WT A from a scalogram generated by wavelet transform on data prior to administration of the compound, deriving WT A from a scalogram generated by wavelet transform on data after administration of the compound, and finding the difference between the WT A prior to administration of the compound and the WT A after administration of the compound.
- a parameter for analyzing a frequency comprises, for example, spectrum intensity computed by FFT.
- spectrum intensity is computed from a spectrum intensity map generated by fast Fourier transform (FFT) on a waveform obtained by converting potential data into a waveform and dividing the waveform by a predetermined time interval (e.g., one second interval).
- FFT fast Fourier transform
- the spectrum intensity of each frequency for each 1 Hz from 1 to 250 Hz can be computed from a spectrum intensity map generated by FFT on a waveform.
- Such spectrum intensities can be utilized as 250 parameters.
- a chronological change in multivariate analysis results can be analyzed by utilizing spectrum intensity in a time series using waveforms within a plurality of time intervals. This enables isolation of a known compound and prediction of a target compound based on a chronological change.
- a candidate parameter comprise, for example, a nonlinear time series analysis parameter.
- a nonlinear time series analysis parameter is, for example, a scaling index ⁇ computed by Detrended fluctuation analysis (DFA).
- DFA is a methodology for eliminating non-stationary variable components (trend) and characterizing long-range correlation in fluctuations with a scaling index ⁇ .
- time series ISI can be quantified with scaling index ⁇ by performing DFA on the time series ISI while focusing on the regularity of the time of firing.
- a candidate parameter can comprise, for example, a Z score of the firing interval between electrodes.
- Z score is an indicator of synaptic connection strength of cells.
- Z score is computed, for example, by the following equation.
- Z score N real ⁇ Ave surrogate SD surrogate wherein N real is a value counting spikes with a spike interval (ISI) between two electrodes of 100 ms or less (synchronized spikes). Specifically, this is the total number of those with a difference between the time at which a spike is detected with the first electrode and time at which the spike is detected with the second electrode of 100 ms or less.
- ISI spike interval
- Ave surrogate is the mean value of the number of synchronized spikes obtained by randomly rearranging detected spikes and counting those with ISI between two electrodes of 100 ms or less (synchronized spikes) in the rearranged data, and repeating this a plurality of times (e.g., 100 times).
- SD surrogate is the standard deviation of the number of synchronized spikes obtained by randomly rearranging detected spikes and counting those with ISI between two electrodes of 100 ms or less (synchronized spikes) in the rearranged data, and repeating this a plurality of times (e.g., 100 times). Since Z score is an indicator of synaptic connection strength, multivariate analysis including a Z score enables prediction of a property of a target compound which takes into consideration the effect on synaptic connection strength.
- a candidate parameter can comprise, for example, the following parameters.
- a candidate parameter set can comprise all of the parameters described above, or some of the parameters described above. It can be preferable for a candidate parameter set to comprise at least one of the basic activity parameters, at least one of the burst structure parameters, at least one of the parameters related to periodicity, at least one of the parameters for analyzing a frequency, and at least one of the nonlinear time series analysis parameters. This is because this enables analysis comprising spike information, information on a synaptic current component from frequency analysis, and time series information on spike occurrence from nonlinear time series analysis. It can be still more preferable for a candidate parameter set to comprise all of the candidate parameter sets described above because this enables prediction of a property of a target compound with high accuracy.
- the prediction parameter identification means 122 is configured to identify a prediction parameter set based on a result of multivariate analysis by the multivariate analysis means 121. For example, the prediction parameter identification means 122 identifies a combination of candidate parameters capable of isolating a first known compound and a second known compound as a prediction parameter set, based on a result of multivariate analysis. For example, the prediction parameter identification means 122 can also be configured to identify a combination of candidate parameters capable of isolating three or more compounds as a prediction parameter set based on a result of multivariate analysis.
- a certain combination of candidate parameters can be identified as a prediction parameter set when a significant difference is found from performing a significance test on a first principle component score of activity data for a neuron in response to a first known compound and a first principle component score of activity data for a neuron in response to a second known compound from a result of principle component analysis on the combination of candidate parameters.
- a certain combination of candidate parameters can be identified as a prediction parameter set when a significant difference is found from performing a significance test on the first principle component score of activity data for a neuron in response to the first known compound, the first principle component score of activity data for a neuron in response to the second known compound ...
- first principle component score of activity data for a neuron in response to the nth known compound from a result of principle component analysis on the combination of candidate parameters is performed for every combinations of candidate parameters subjected to multivariate analysis, and one or more combinations of candidate parameters found to have a significant difference is identified as a prediction parameter set.
- the prediction parameter identification means 122 can perform a significance test using any significance test methodology.
- a significance test can be performed using, for example, ANOVA (analysis of variance), or MANOVA (multivariate analysis of variance) for a multivariate test. For example, a significant difference can be found if ANOVA (analysis of variance) or MANOVA (multivariate analysis of variance) is performed and the resulting p value is 0.05 or less.
- the threshold value of p value at which a significant difference is found is not limited to 0.05.
- the threshold value can be any value.
- a certain combination of candidate parameters can be identified as a prediction parameter set when activity data for a neuron in response to a first known compound and activity data for a neuron in response to a second known compound are each classified into separate clusters as a result of cluster analysis for the combination of candidate parameters.
- a certain combination of candidate parameters can be identified as a prediction parameter set when activity data for a neuron in response to the first known compound, activity data for a neuron in response to the second known compound ... activity data for a neuron in response to the nth known compound are all classified into separate clusters as a result of cluster analysis for the combination of candidate parameters.
- cluster analysis is performed for every combination of candidate parameters, and one or more combinations of candidate parameters whose entire data is classified into separate clusters is identified as a prediction parameter set.
- the prediction parameter identification means 122 can be preferable for the prediction parameter identification means 122 to identify a plurality of prediction parameter sets capable of isolating each of a plurality of sets of compound. This is because this enables prediction of a plurality of properties. It can be still more preferable for the prediction parameter identification means 122 to identify a plurality of prediction parameter sets capable of isolating each of a plurality of associated sets of compound. This is because isolation of a plurality of associated sets of compound in stages enable prediction of a property in stages and prediction of a property with high accuracy.
- the prediction means 123 is configured to predict a property from inputted data based on a prediction parameter set identified by the prediction parameter identification means 122.
- the prediction means 123 receives a prediction parameter set from the prediction parameter identification means 122 and receives data for a target compound received by the receiving means 110.
- Data for a target compound can be, for example, activity data for a neuron in response to a target compound or image data converted therefrom (e.g., raster plot image, histogram, waveform image, or the like).
- the prediction means 123 determines which of data for a first known compound and data for a second known compound the data for a target compound is similar to, and predicts the determined property of the first known compound or second known compound as the property of the target compound.
- the prediction means 123 can perform multivariate analysis on data for a target compound for a prediction parameter set and determine which data the data for the target compound is similar to based on the result thereof. If multivariate analysis is, for example, principle component analysis, the prediction means 123 computes a principle component score of data for a target compound for a prediction parameter set and determines whether it is similar based on a principle component plot that plots principle component scores. For example, similarity is determined by the Euclidean distance, cosine similarity, or a combination thereof between principle component plots.
- the prediction means 123 performs cluster analysis on data for a first known compound, data for a second known compound, and data for a target compound for a prediction parameter set and classifies each of the data for the first known compound, data for the second known compound, and data for the target compound into clusters. Similarity is determined based on whether the data for the target compound is classified into the same cluster as the data for the first known compound or the data for the second known compound. In this regard, if the data for the target compound is not classified to neither the cluster to which the data for the first known compound is classified nor the cluster to which the data for the second known compound is classified, the data for the target compound would be similar to neither the data for the first known compound nor the data for the second known compound.
- the prediction means 123 can determine which of the data for the first known compound and the data for the second known compound the data for the target compound is similar to by utilizing support vector machine (SVM).
- SVM support vector machine
- the prediction means 123 can utilize SVM, for a prediction parameter set, to deduce a hyperplane dividing the data for the first known compound and the data for the second known compound and decide whether the data for the target compound belongs to the side of data for the first known compound or the side of data for the second known compound to determine which of data for the first known compound and data for the second known compound the data for the target compound is similar to.
- a processor comprises the multivariate analysis means 121 and the prediction parameter identification means 122, but a processor does not need to comprise the multivariate analysis means 121 and the prediction parameter identification means 122 if a prediction parameter set is predetermined. In such a case, a processor receives a predetermined prediction parameter set to predict a property based on the received prediction parameter set.
- a processor performs multivariate analysis on data for a target compound, data for a first known compound, and data for a second known compound, for a predetermined prediction parameter set, and determines which of the data for the first known compound and the data for the second known compound the data for the target compound is similar to based on the result thereof to predict a determined property of the first known compound or second known compound as the property of the target compound.
- a processor performs principle component analysis on data for a target compound, data for a first known compound, and data for a second known compound, for a predetermined prediction parameter set, and determines which of the data for the first known compound and the data for the second known compound the data is similar to based on a principle component plot (e.g., based on similarity S) to predict a determined property of the first known compound or second known compound as a property of the target compound.
- a principle component plot e.g., based on similarity S
- a processor performs cluster analysis on data for a target compound, data for a first known compound, and data for a second known compound, for a predetermined prediction parameter set, and determines which of the data for the first known compound and the data for the second known compound the data is similar to, based on whether the data for the target compound is classified into the same cluster as the data for the first known compound or the data for the second known compound, to predict a determined property of the first known compound or second known compound as a property of the target compound.
- SVM can be utilized to deduce a hyperplane dividing the data for the first known compound and the data for the second known compound, for a predetermined prediction parameter set, and decide whether the data for the target compound belongs to the side of data for the first known compound or the side of data for the second known compound to determine which of the data for the first known compound and the data for the second known compound the data for the target compound is similar to.
- each constituent element of the computer system 100 is provided within the computer system 100, but the present invention is not limited thereto. Any of the constituent elements of the computer system 100 can also be provided external to the computer system 100. If, for example, each of the processor 120 and memory 130 is comprised of separate hardware parts, each hardware part can be connected via any network. The type of such a network is not limited. Each hardware part can be connected, for example, via LAN, wirelessly, or with a wire.
- the computer system 100 is not limited to a specific hardware configuration.
- the processor 120 comprised of an analog circuit instead of a digital circuit is also within the scope of the invention.
- the configuration of the computer system 100 is not limited to those described above, as long as the function thereof can be materialized.
- each constituent element of the processor 120 is provided within the same processor 120, but the present invention is not limited thereto.
- a configuration with each constituent element of the processor 120 dispersed in a plurality of processor units is also within the scope of the invention.
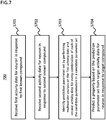
- Figure 7 shows an example of processing in the computer system 100 for predicting a property of a target compound.
- the example shown in Figure 7 describes processing 700 for predicting a property of a target compound.
- the computer system 100 receives first activity data for a neuron in response to a first known compound via the receiving means 110.
- the first activity data can comprise, for example, a plurality of pieces of data from administering the first known compound to different cell species, a plurality of pieces of data from administering the first known compound to the same cell species sample supplied by different vendors, a plurality of pieces of data from administering the first known compound to samples of different lots supplied by the same vendor, a plurality of pieces of data from administering the first known compound to samples supplied on different dates by the same vendor, or a plurality of pieces of data from testing the first known compound at different facilities.
- the received activity data is passed along to the processor 120.
- the computer system 100 receives second activity data for a neuron in response to a second known compound via the receiving means 110.
- the second activity data can comprise, for example, a plurality of pieces of data from administering the second known compound to different cell species, a plurality of pieces of data from administering the second known compound to the same cell species sample supplied by different vendors, a plurality of pieces of data from administering the second known compound to samples of different lots supplied by the same vendor, a plurality of pieces of data from administering the second known compound to samples supplied on different dates by the same vendor, or a plurality of pieces of data from testing the second known compound at different facilities.
- the received activity data is passed along to the processor 120.
- the processor 120 identifies a prediction parameter set by performing multivariate analysis on the first activity data and the second activity data for every combination of each of the candidate parameters in a candidate parameter set.
- the multivariate analysis means 121 of the processor 120 performs multivariate analysis on the first activity data and the second activity data for every combination of each of the candidate parameters in a candidate parameter set
- the prediction parameter identification means 122 of the processor 120 identifies a prediction parameter set based on a result of the multivariate analysis.
- the processor 120 predicts a property based on the prediction parameter set identified at step S703 from the target activity data for a neuron in response to the target compound. For example, the prediction means 123 of the processor 120 predicts a property. The property of the target compound can be predicted in this manner.
- processing can be configured to perform multivariate analysis using a parameter capable of isolating a known property of a first known compound on each of the plurality of pieces of first activity data and pass long only the first activity data with the same property as the known property of the first known compound to the processor 120 for subsequent processing.
- This is performed, for example, by determining whether the first activity data has the same property as the known property of the first known compound and excluding the data, if the data does not have the same property, as an outlier value from data passed along to the processor 120.
- the accuracy of prediction by the processor 120 is further improved by detecting an outlier value and excluding data comprising the outlier value from data passed along to the processor 120.
- the aforementioned step S702 can similarly detect an outlier value of second activity data and exclude data comprising the outlier value from data passed along to the processor 120.
- the aforementioned step S704 can similarly detect an outlier value of target activity data for a neuron in response to a target compound and exclude data comprising the outlier value from data passed along to the processor 120.
- the step of detecting an outlier value by multivariate analysis described above can also be utilized in other applications.
- the step is effective in, for example, lot difference check, quality check, or selection of a cell from different cell species in the manufacture of cells or the like.
- an outlier value can be detected by performing multivariate analysis using a parameter capable of isolating a given property on cells of each of a plurality of lots and determining whether the cells have the same property as the given property in the manufacture of cells. This enables exclusion of a lot with a significant inter-lot difference.
- an outlier value can be detected by performing multivariate analysis using a parameter capable of isolating a desired quality on each of a plurality of cells and determining whether the cells have the same quality as the desired quality in the manufacture of cells. This enables exclusion of cells without the desired quality.
- an outlier value can be detected by performing multivariate analysis using a parameter capable of isolating a desired property on cells of each of a plurality of cell species and determining whether the cells have the same property as the desired property. This enables exclusion of cell species without the desired property.
- Figure 8 shows an example of processing to predict a property of a target compound by the processor 120 at step S704.
- the prediction means 123 of the processor 120 performs multivariate analysis on target activity data with respect to a target compound for a prediction parameter set identified at step S703. This enables comparison of the target activity data with a result of multivariate analysis for a prediction parameter set already performed on first activity data and second activity data.
- Multivariate analysis is, for example, principle component analysis.
- the prediction means 123 computes a principle component score of target activity data.
- Multivariate analysis is, for example, cluster analysis.
- the prediction means 123 classifies target activity data into a cluster by cluster analysis.
- the multivariate analysis performed at step S801 can use the same methodology or different methodology as the multivariate analysis performed at step S703. If, for example, a prediction parameter set is identified by principle component analysis at step S703, principle component analysis can be performed in the same manner or different multivariate analysis (e.g., cluster analysis) can be performed at step S801. If, for example, a prediction parameter set is identified by cluster analysis at step S703, cluster analysis can be performed in the same manner or different multivariate analysis (e.g., principle component analysis) can be performed at step S801.
- the prediction means 123 of the processor 120 can, at step S801, deduce a hyperplane dividing first activity data and second activity data by utilizing SVM, for a prediction parameter set, and determine whether target activity data for a target compound belongs to the side of the first activity data of the hyperplane or the side of the second activity data of the hyperplane.
- the prediction means 123 of the processor 120 determines whether the target activity data is more similar to the first activity data than to the second activity data.
- the prediction means 123 can determine whether data is similar based on a principle component score computed at step S801. For example, similarity of the target activity data to the first activity data and similarity of the target activity data to the second activity data can be computed based on a principle component plot created based on a principle component score.
- target activity data is more similar to first activity data than to second activity data by plotting a first principle component score and second principle component score of the first activity data, plotting a first principle component score and second principle component score of the second activity data, and plotting a first principle component score and second principle component score of the target activity data for a prediction parameter set, and then comparing the Euclidean distance between the plot of the target activity data and the plot of the first activity data with the Euclidean distance between the plot of the target activity data and the plot of the second activity data.
- target activity data is more similar to first activity data than to second activity data by comparing cosine similarity between the plot of the target activity data and the plot of the first activity data with cosine similarity between the plot of the target activity data and the plot of the second activity data.
- target activity data is more similar to first activity data than to second activity data by comparing the Euclidean distance and cosine similarity between the plot of the target activity data and the plot of the first activity data with the Euclidean distance and cosine similarity between the plot of the target activity data and the plot of the second activity data.
- the mean value of all plots can be computed and used as a representative point to find the Euclidean distance or cosine similarity with respect to target activity data.
- similarity is determined by a combination of the Euclidean distance and cosine similarity of principle component plots. This is because, for example, even if the Euclidean distance d 1 between a plot of a target compound (target activity data) and a plot of a first known compound (first activity data) is equal to Euclidean distance d 2 between the plot of the target compound (target activity data) and a plot of a second known compound (second activity data) as shown in Figure 6A , similarly can be distinguished by cosine similarity.
- the prediction means 123 can determine whether target activity data is more similar to first activity data than to second activity data based on which cluster the target activity data is classified into at step S801.
- the prediction means 123 can determine whether target activity data is more similar to first activity data than to second activity data based on, for example, which of the side of the first activity data and the side of the second activity data of a hyperplane deduced by SVM the target activity data of a target compound is determined to belong to at step S801. If the target activity data belongs to the side of the first activity data of the hyperplane, the target activity data is determined to be more similar to the first activity data than to the second activity data. If the target activity data belongs to the side of the second activity data of the hyperplane, the target activity data is determined to be more similar to the second activity data than to the first activity data.
- a property of a first known compound is identified as a property of a target compound. If, for example, the first known compound has a property of "with toxicity”, the property of the target compound is identified as "with toxicity”. If, for example, the first known compound has a property (mechanism of action) of "effective on GABA", the mechanism of action of the target compound is identified as "effective on GABA”.
- the process proceeds to step S804 and identifies the property of the second known compound as a property of the target compound. If, for example, the second known compound has a property of "without toxicity”, the property of the target compound is identified as "without toxicity”. If, for example, the second known compound has a property (mechanism of action) of "effective on K channel", the mechanism of action of the target compound is identified as "effective on K channel”.
- the aforementioned example performed processing 700 using the first activity data for the first known compound and the second activity data for the second known compound, but the processing 700 can also be configured to be performed by additionally using third activity data for a third known compound, fourth activity data for a fourth known compound ... nth activity data for an nth compound (wherein n is an integer that is 3 or greater) .
- similarity of target activity data with each of the first activity data, second activity data ... nth activity data is compared at step S802.
- the processing 700 can be performed by using, for example, first activity data for a first known compound, second activity data for a second known compound ... eleventh activity data for an eleventh known compound.
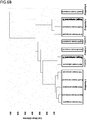
- Figure 6B shows an example of a result when cluster analysis was performed as multivariate analysis at step S801 in such a case.
- Figure 6B shows an example of a result of performing cluster analysis on first to eleventh known compounds and target compound A and target compound B.
- the vertical axis indicates the Euclidean distance.
- compounds with a close Euclidean distance e.g., compounds with a Euclidean distance of about 150 (shown as a two dot chain line in Figure 6B ) or less
- first to fifth known compounds each have the same property 1
- sixth known compound has property 2
- seventh known compound has property 3
- eighth known compound has property 4
- ninth and tenth known compounds each have the same property 5
- eleventh known compound has property 6.
- target compound A is classified into the same cluster as the sixth known compound, so that the compound is predicted to have property 2.
- target compound B is classified into the same cluster as the ninth and tenth known compounds, the compound is predicted to have property 5.
- step S704 can be repeated using a second prediction parameter set.
- the second prediction parameter set can be, for example, a prediction parameter set identified by performing processing of steps S701 to S703 using a third known compound and fourth known compound.
- the second prediction parameter set can be a prediction parameter set identified by performing the processing of steps S701 to S703 using a first known compound and third known compound if the property of the first known compound is identified as the property of the target compound at step S803, or a prediction parameter set identified by performing the processing of steps S701 to step S703 using the second known compound and third known compound if the property of the second known compound is identified as the property of the target compound at step S804.
- the second prediction parameter would correspond to the property of the target compound identified at step S803 or S804 thereby. This can be preferable in terms of being able to identify a property in stages.
- step S704 can be repeated using the second prediction parameter identified by performing the processing of steps S701 to S703 using the third known compound having the property (mechanism of action) of "effective on GABA-A” and the first known compound or fourth known compound having the property (mechanism of action) of "effective on GABA-B".
- This enables identification of a specific property, as to whether the property of the target compound of "effective on GABA" is "effective on GABA-A” or "effective on GABA-B".
- Figure 9 shows an example of processing in the computer system 100 for predicting a property of a target compound.
- the example shown in Figure 7 describes processing 900 for predicting a property of a target compound when a prediction parameter set is predetermined.
- a predetermined prediction parameter set comprises at least one of the candidate parameters described above.
- the computer system 100 receives first activity data for a neuron in response to a first known compound, second activity data for a neuron in response to a second known compound, and target activity data for a neuron in response to a target compound via the receiving means 110.
- the first activity data can comprise, for example, a plurality of pieces of data from administering the first known compound to different cell species, a plurality of pieces of data from administering the first known compound to the same cell species sample supplied by different vendors, a plurality of pieces of data from administering the first known compound to samples of different lots supplied by the same vendor, a plurality of pieces of data from administering the first known compound to samples supplied on different dates by the same vendor, or a plurality of pieces of data from testing the first known compound at different facilities.
- the second activity data can comprise, for example, a plurality of pieces of data from administering the second known compound to different cell species, a plurality of pieces of data from administering the second known compound to the same cell species sample supplied by different vendors, a plurality of pieces of data from administering the second known compound to samples of different lots supplied by the same vendor, a plurality of pieces of data from administering the second known compound to samples supplied on different dates by the same vendor, or a plurality of pieces of data from testing the second known compound at different facilities.
- Received activity data is passed along to the processor 120.
- processing can be configured to perform multivariate analysis using a parameter capable of isolating a known property of a first known compound on each of the plurality of pieces of first activity data and pass long only the first activity data with the same property as the known property of the first known compound to the processor 120 for subsequent processing.
- This is performed, for example, by determining whether the first activity data has the same property as the known property of the first known compound and excluding the data, if the data does not have the same property, as an outlier value from data passed along to the processor 120.
- the accuracy of prediction by the processor 120 is further improved by detecting an outlier value and excluding data comprising the outlier value from data passed along to the processor 120.
- An outlier value can be similarly detected for the second activity data and target activity data for a neuron in response to a target compound to exclude data comprising the outlier value from data passed along to the processor 120.
- the prediction means 123 of the processor 120 performs multivariate analysis for a prediction parameter set on each data.
- Multivariate analysis is, for example, principle component analysis.
- the prediction means 123 computes a principle component score of first activity data, principle component score of second activity data, and principle component score of target activity data by principle component analysis.
- Multivariate analysis is, for example, cluster analysis.
- the prediction means 123 classifies target activity data into a cluster by cluster analysis.
- the prediction means 123 of the processor 120 can, at step S902, deduce a hyperplane dividing first activity data and second activity data by utilizing SVM, for a prediction parameter set, to determine whether target activity data for a target compound belongs to the side of the first activity data of the hyperplane or the side of the second activity data of the hyperplane.
- the prediction means 123 of the processor 120 determines whether the target activity data is more similar to the first activity data than to the second activity data. For example, the prediction means 123 can determine whether the data is similar based on a principle component score computed at step S902. For example, similarity of the target activity data to the first activity data and similarity of the target activity data to the second activity data can be computed based on a principle component plot created based on a principle component score.
- target activity data is more similar to first activity data than to second activity data by plotting a first principle component score and second principle component score of the first activity data, plotting a first principle component score and second principle component score of the second activity data, and plotting a first principle component score and second principle component score of the target activity data, for a prediction parameter set, and then comparing the Euclidean distance between the plot of the target activity data and the plot of the first activity data with the Euclidean distance between the plot of the target activity data and the plot of the second activity data.
- target activity data is more similar to first activity data than to second activity data by comparing cosine similarity between the plot of the target activity data and the plot of the first activity data with cosine similarity between the plot of the target activity data with the plot of the second activity data.
- target activity data is more similar to first activity data than to second activity data by comparing the Euclidean distance and cosine similarity between the plot of the target activity data and the plot of the first activity data with the Euclidean distance and cosine similarity between the plot of the target activity data and the plot of the second activity data.
- the mean value of all plots can be computed and used as a representative point to find the Euclidean distance or cosine similarity with respect to target activity data.
- the prediction means 123 can determine whether target activity data is more similar to first activity data than to second activity data based on which cluster the target activity data is classified into at step S902.
- the prediction means 123 can determined whether target activity data is more similar to first activity data than to second activity data based on, for example, which of the side of the first activity data or the side of the second activity data of a hyperplane deduced by SVM the target activity data of a target compound is determined to belong to at step S902. If the target activity data belongs to the side of the first activity data of the hyperplane, the target activity data is determined to be more similar to the first activity data than to the second activity data. If the target activity data belongs to the side of the second activity data of the hyperplane, the target activity data is determined to be more similar to the second activity data than to the first activity data.
- a property of a first known compound is identified as a property of a target compound. If, for example, the first known compound has a property of "with toxicity”, the property of the target compound is identified as "with toxicity”. If, for example, the first known compound has a property (mechanism of action) of "effective on GABA", the mechanism of action of the target compound is identified as "effective on GABA”.
- step S905 identifies a property of a second known compound as a property of a target compound. If, for example, the first known compound has a property of "without toxicity”, the property of the target compound is identified as "without toxicity”. If, for example, the second known compound has a property (mechanism of action) of "effective on K channel", the mechanism of action of the target compound is identified as "effective on K channel”.
- the aforementioned example performed processing 900 using the first activity data for the first known compound and the second activity data for the second known compound, but the processing 900 can also be performed by additionally using third activity data for a third known compound, fourth activity data for a fourth known compound ... nth activity data for an nth compound (wherein n is an integer that is 3 or greater).
- similarity of target activity data to the first activity data, second activity data ... nth activity data is compared at step S903.
- processing was described as being performed in a specific order, but it should be noted that the order of each processing is not limited to the described order, and is performed in any theoretically feasible order.
- the aforementioned example described prediction of a property of a target compound using the computer system 100, but the subject that can be predicted is not limited to a property of a compound.
- a computer system capable of predicting a property of any target is also within scope of the invention, as long as there is a prediction parameter set capable of isolating the property.
- the present invention can target a neural network as a subject, and a property of an unknown neural network can be predicted with the computer system of the invention.
- a neural network can be, for example, a neural network prepared from an iPS cell.
- multivariate analysis on electrical activity data for a known disease neuron is performed for every combination of each of the candidate parameters in a candidate parameter set (can be the same candidate parameter set as the candidate parameter set used in predicting a property of a compound) to identify a prediction parameter set capable of isolating electrical activity data for different disease neurons.
- This can predict the disease neuron to which the function of an unknown neural network is close, based on the identified prediction parameter set.
- This can identify, for example, the disease neuron whose electrical activity is similar to the electrical activity exhibited by an unknown neural network prepared from a healthy individual, thus can enable prediction of a future disease of the healthy individual.
- multivariate analysis on electric activity data for a known neural network at each part of the brain is performed for every combination of each of the candidate parameters in a candidate parameter set (can be the same candidate parameter set as the candidate parameter set used in predicting a property of a compound) to identify a prediction parameter set capable of isolating electrical activity data for a neural network at each part of the brain. This can predict the part of the brain which has a behavior close to the unknown neural network, based on the identified prediction parameter set.
- the accuracy of prediction can be improved by using data such as gene expression data, synaptic function data, or metabolic function data in addition to electrical activity data.
- data such as gene expression data, synaptic function data, or metabolic function data in addition to electrical activity data.
- a property that can be isolated can also be increased.
- the present invention can target a cell as a subject and predict a property of an unknown cell with the computer system of the invention.
- a candidate parameter set can be a candidate parameter set comprising a parameter for quantitative data (e.g., quantitative data for gene expression, autophagy, mitochondria, or senescent cells) from various cell attribute analysis) to identify a prediction parameter set capable of isolating cell data for patients with different known diseases.
- a candidate parameter set can be a candidate parameter set comprising a parameter for quantitative data (e.g., quantitative data for gene expression, autophagy, mitochondria, or senescent cells) from various cell attribute analysis) to identify a prediction parameter set capable of isolating cell data for patients with different known diseases.
- Such a computer system that can predict a property of any target can have the same configuration as the computer system 100.
- a property of any target can be predicted by the same processing as that of the computer system 100.
- a property of any target can be predicted by the same processing as the processing 700 described above.
- the computer system 100 receives first data for a first subject via the receiving means 110.
- the first subject can be, for example, a first known disease neuron, a neural network of a first part of the brain, cell of a first patient with a known disease, or the like.
- the first data can be electrical activity data for the first known disease neuron, electrical activity data for the neural network of the first part of the brain, and various data (e.g., gene expression data, autophagy data, mitochondria analysis data, senescent cell analysis data, or the like) for the cell of the first patient with a known disease, respectively.
- the received data is passed along to the processor 120.
- the computer system 100 receives second data for a second subject via the receiving means 110.
- the second subject can be, for example, a second known disease neuron, a neural network of a second part of the brain, cell of a second patient with a known disease, or the like.
- the second data can be electrical activity data for the second known disease neuron, electrical activity data for the neural network of the second part of the brain, and various data (e.g., gene expression data, autophagy data, mitochondria analysis data, senescent cell analysis data, or the like) for the cell of the second patient with a known disease, respectively.
- the received activity data is passed along to the processor 120.
- the processor 120 identifies a prediction parameter set by performing multivariate analysis on first data and second data for every combination of each of the candidate parameters in a candidate parameter set.
- the multivariate analysis means 121 of the processor 120 performs multivariate analysis on first data and second data for every combination of each of the candidate parameters in a candidate parameter set
- the prediction parameter identification means 122 of the processor 120 identifies a prediction parameter set based on the result of the multivariate analysis.
- the processor 120 predicts a property based on the prediction parameter set identified at step S703 from the target data for a target.
- the prediction means 123 of the processor 120 predicts a property.
- the target can be, for example, an unknown neural network, a cell of a patient with an unknown disease, or the like, and the target disease can be electrical activity data for the unknown neural network and various data (e.g., gene expression data, autophagy data, mitochondria analysis data, senescent cell analysis data, or the like) for the cell of a patient with an unknown disease, respectively.
- a property of any target can be predicted in this manner.
- processing in each step shown in Figures 7 , 8 , and 9 is described to be materialized with the processor 120 and a program stored in the memory 130, but the present invention is not limited thereto. At least one of the processing of each step shown in Figures 7 , 8 , and 9 can be materialized with a hardware configuration such as a control circuit.
- the processing 700 and 900 can comprise, for example, a step of obtaining data from a subject instead of receiving data (step S701, S702, or step S901 ) . Subsequent steps can be performed by manual calculation based on the obtained data.
- activity data from administrating each of five known compounds (4AP, Phenytoin, PTX (Picrotoxin), Strychnine, and Amoxiciline) to a neuron was obtained using MEA.
- Axol Bioscience's Human iPSC-derived neural stem cells (ax0019) were used as the neurons
- Alpha MED Scientific's MEA 24-well Plate-comfort was used as MEA
- Alpha MED Scientific's MED64-Presto MED-A384iN
- 4AP was administered at a concentration of about 30 ⁇ M.
- Phenytoin was administered at a concentration of about 100 ⁇ M.
- PTX Panethyroxine
- Strychnine was administered at a concentration of about 30 ⁇ M
- Amoxiciline was administered at a concentration of about 100 ⁇ M.
- the obtained data was inputted into the computer system of the invention to perform principle component analysis on the data for every combination of each of the candidate parameters in a candidate parameter set.
- the candidate parameter set consisted of 10 parameters ((1) TS, (2) NoB, (3) IBI, (4) burst duration, (5) spike count in a burst, (6) PS, (7) coefficient of variation of PS, (8) IPI, (9) coefficient of variation of IPI, and (10) periodicity).
- Figures 10A and 10B are diagrams showing a result of predicting a mechanism of action of target compound A in this Example.
- Figure 10A is a graph showing principle component plots of target compound A and five known compounds.
- the horizontal axis indicates the first principle component
- the vertical axis indicates the second principle component.
- Figure 10B(a) is a graph showing the mean value of principle component plots of target compound A, the mean values of principle components plots of each of the five known compounds, and the Euclidean distance.
- Figure 10B(b) shows each Euclidean distance with a bar graph.
- the leftmost bar graph shows the Euclidean distance between the mean value of principle component plots of target compound A and the mean value of principle component plots of 4AP.
- the second bar graph from the left shows the Euclidean distance between the mean value of principle component plots of target compound A and the mean value of principle component plots of Phenytoin.
- the third bar graph from the left shows the Euclidean distance between the mean value of principle component plots of target compound A and the mean value of principle component plots of PTX (Picrotoxin).
- the fourth bar graph from the left shows the Euclidean distance between the mean value of principle component plots of target compound A and the mean value of principle component plots of Strychnine.
- the fifth bar graph from the left shows the Euclidean distance between the mean value of principle component plots of target compound A and the mean value of principle component plots of Amoxiciline.
- the present invention is useful as an invention providing a method of predicting an unknown property (e.g., toxicity to or efficacy on the nervous system) of a target such as a target compound and the like.
- an unknown property e.g., toxicity to or efficacy on the nervous system
Landscapes
- Health & Medical Sciences (AREA)
- Life Sciences & Earth Sciences (AREA)
- Engineering & Computer Science (AREA)
- Chemical & Material Sciences (AREA)
- Physics & Mathematics (AREA)
- Biomedical Technology (AREA)
- Immunology (AREA)
- Analytical Chemistry (AREA)
- Pathology (AREA)
- General Physics & Mathematics (AREA)
- General Health & Medical Sciences (AREA)
- Biochemistry (AREA)
- Optics & Photonics (AREA)
- Nuclear Medicine, Radiotherapy & Molecular Imaging (AREA)
- Theoretical Computer Science (AREA)
- Computing Systems (AREA)
- Food Science & Technology (AREA)
- Medicinal Chemistry (AREA)
- Molecular Biology (AREA)
- Hematology (AREA)
- Biophysics (AREA)
- Urology & Nephrology (AREA)
- Bioinformatics & Computational Biology (AREA)
- Bioinformatics & Cheminformatics (AREA)
- Crystallography & Structural Chemistry (AREA)
- Chemical Kinetics & Catalysis (AREA)
- Investigating Or Analysing Biological Materials (AREA)
- Investigating Or Analyzing Materials By The Use Of Electric Means (AREA)
- Measuring Or Testing Involving Enzymes Or Micro-Organisms (AREA)
Applications Claiming Priority (2)
| Application Number | Priority Date | Filing Date | Title |
|---|---|---|---|
| JP2018183381A JP6558786B1 (ja) | 2018-09-28 | 2018-09-28 | 標的の特性の予測を行うための方法、コンピュータシステム、プログラム |
| PCT/JP2019/038242 WO2020067464A1 (fr) | 2018-09-28 | 2019-09-27 | Procédé, système informatique, et programme de prédiction de caractéristique d'une cible |
Publications (2)
| Publication Number | Publication Date |
|---|---|
| EP3859329A1 true EP3859329A1 (fr) | 2021-08-04 |
| EP3859329A4 EP3859329A4 (fr) | 2022-07-13 |
Family
ID=67614840
Family Applications (1)
| Application Number | Title | Priority Date | Filing Date |
|---|---|---|---|
| EP19864717.4A Pending EP3859329A4 (fr) | 2018-09-28 | 2019-09-27 | Procédé, système informatique, et programme de prédiction de caractéristique d'une cible |
Country Status (4)
| Country | Link |
|---|---|
| US (2) | US20210199639A1 (fr) |
| EP (1) | EP3859329A4 (fr) |
| JP (1) | JP6558786B1 (fr) |
| WO (1) | WO2020067464A1 (fr) |
Families Citing this family (8)
| Publication number | Priority date | Publication date | Assignee | Title |
|---|---|---|---|---|
| CN112667692A (zh) * | 2019-10-16 | 2021-04-16 | 北京一起教育信息咨询有限责任公司 | 一种数据处理方法、装置及电子设备 |
| US20210342645A1 (en) * | 2020-05-04 | 2021-11-04 | International Business Machines Corporation | Combining ensemble techniques and re-dimensioning data to increase machine classification accuracy |
| JP7138995B2 (ja) * | 2020-08-13 | 2022-09-20 | 学校法人東北工業大学 | 脳から取得される波形データに対してバースト解析を行う方法、コンピュータシステム、プログラム、ならびに、バースト解析を用いて標的の状態を予測する方法、コンピュータシステム、プログラム |
| WO2022034801A1 (fr) * | 2020-08-13 | 2022-02-17 | 学校法人東北工業大学 | Procédé, système informatique et programme pour créer une image d'histogramme et procédé, système informatique et programme pour prédire l'état d'un objet à l'aide d'une image d'histogramme |
| US20260029339A1 (en) * | 2022-03-24 | 2026-01-29 | Konica Minolta, Inc. | Prediction device, prediction system, and prediction program |
| CN115236006B (zh) * | 2022-08-04 | 2023-05-23 | 浙江嘉园智能科技有限公司 | 一种电子河长光谱检测数据的处理方法及系统 |
| WO2026004593A1 (fr) * | 2024-06-26 | 2026-01-02 | 富士フイルム株式会社 | Dispositif d'aide à la découverte de médicament, procédé d'exploitation de dispositif d'aide à la découverte de médicament, programme d'exploitation de dispositif d'aide à la découverte de médicament et procédé d'évaluation |
| WO2026004594A1 (fr) * | 2024-06-26 | 2026-01-02 | 富士フイルム株式会社 | Dispositif de support de découverte de médicament, procédé de fonctionnement de dispositif de support de découverte de médicament, programme de fonctionnement de dispositif de support de découverte de médicament et procédé d'évaluation |
Family Cites Families (8)
| Publication number | Priority date | Publication date | Assignee | Title |
|---|---|---|---|---|
| CA2446853A1 (fr) * | 2001-05-15 | 2002-11-21 | Psychogenics Inc. | Systemes et procedes de controle informatique du comportement |
| US7991557B2 (en) * | 2004-06-19 | 2011-08-02 | Genenews Corporation | Computer system and methods for constructing biological classifiers and uses thereof |
| EP1807539A2 (fr) * | 2004-10-29 | 2007-07-18 | Novartis AG | Evaluation de la toxicite d'agents pharmaceutiques |
| US20080118576A1 (en) * | 2006-08-28 | 2008-05-22 | Dan Theodorescu | Prediction of an agent's or agents' activity across different cells and tissue types |
| JP5874876B2 (ja) * | 2011-07-06 | 2016-03-02 | 株式会社メディクローム | 化学物質の生体に対する影響の評価方法 |
| US20140297199A1 (en) * | 2011-11-11 | 2014-10-02 | Cold Spring Harbor Laboratory | Drug screening method and uses thereof |
| WO2015053803A1 (fr) * | 2013-10-08 | 2015-04-16 | University Of Maryland, Baltimore | Procédés pour faire la distinction entre des maladies inflammatoires de l'intestin au moyen de signatures de communautés microbiennes |
| KR20180086438A (ko) * | 2015-11-20 | 2018-07-31 | 에이전시 포 사이언스, 테크놀로지 앤드 리서치 | 다양한 화학 구조를 가지는 생체이물질의 세포 유형 특이적 독성을 예측하기 위한 고처리량 영상화 기반 방법 |
-
2018
- 2018-09-28 JP JP2018183381A patent/JP6558786B1/ja active Active
-
2019
- 2019-09-27 US US17/269,707 patent/US20210199639A1/en not_active Abandoned
- 2019-09-27 EP EP19864717.4A patent/EP3859329A4/fr active Pending
- 2019-09-27 WO PCT/JP2019/038242 patent/WO2020067464A1/fr not_active Ceased
-
2025
- 2025-04-12 US US19/177,515 patent/US20250258156A1/en active Pending
Also Published As
| Publication number | Publication date |
|---|---|
| JP2020051968A (ja) | 2020-04-02 |
| WO2020067464A1 (fr) | 2020-04-02 |
| JP6558786B1 (ja) | 2019-08-14 |
| EP3859329A4 (fr) | 2022-07-13 |
| US20250258156A1 (en) | 2025-08-14 |
| US20210199639A1 (en) | 2021-07-01 |
Similar Documents
| Publication | Publication Date | Title |
|---|---|---|
| US20250258156A1 (en) | Method, computer system, and program for predicting characteristic of target | |
| Zheng et al. | Multiplexing of theta and alpha rhythms in the amygdala-hippocampal circuit supports pattern separation of emotional information | |
| US12205707B2 (en) | Method, computer system, and program for predicting characteristics of target compound | |
| Spencer et al. | Identification of a rhythmic firing pattern in the enteric nervous system that generates rhythmic electrical activity in smooth muscle | |
| Ito et al. | Segregation of visual response properties in the mouse superior colliculus and their modulation during locomotion | |
| EP2498676B1 (fr) | Activité cérébrale en tant que marqueur de maladie | |
| White et al. | Efficient unsupervised algorithms for the detection of seizures in continuous EEG recordings from rats after brain injury | |
| Zhang et al. | Patient-specific seizure prediction from scalp EEG using vision transformer | |
| Denman et al. | The structure of pairwise correlation in mouse primary visual cortex reveals functional organization in the absence of an orientation map | |
| Lodder et al. | Inter-ictal spike detection using a database of smart templates | |
| Ujma et al. | Individual slow-wave morphology is a marker of aging | |
| Hamm et al. | Aberrant cortical ensembles and schizophrenia-like sensory phenotypes in Setd1a+/− mice | |
| Chacko et al. | Distinct phase-amplitude couplings distinguish cognitive processes in human attention | |
| Malezieux et al. | Theta oscillations coincide with sustained hyperpolarization in CA3 pyramidal cells, underlying decreased firing | |
| Bertelsen et al. | Electrophysiologically-defined excitation-inhibition autism neurosubtypes | |
| Cserpan et al. | Variation of scalp EEG high frequency oscillation rate with sleep stage and time spent in sleep in patients with pediatric epilepsy | |
| Iotchev et al. | The “Twin Peaks” method of automated Spike-Wave detection: A two-step, two-criteria Matlab application | |
| Behar et al. | An echo state neural network for foetal ECG extraction optimised by random search | |
| RU2332160C1 (ru) | Способ исследования электроэнцефалограммы человека и животных | |
| Kikuchi et al. | The distribution and nature of responses to broadband sounds associated with pitch in the macaque auditory cortex | |
| Amoroso et al. | PRISMA-CAD: Fully automated method for Computer-Aided Diagnosis of Dementia based on structural MRI data | |
| JP7138995B2 (ja) | 脳から取得される波形データに対してバースト解析を行う方法、コンピュータシステム、プログラム、ならびに、バースト解析を用いて標的の状態を予測する方法、コンピュータシステム、プログラム | |
| JP2020057364A (ja) | 対象化合物の特性の予測を行うための方法、コンピュータシステム、プログラム | |
| Sakkalis et al. | Parametric and nonparametric EEG analysis for the evaluation of EEG activity in young children with controlled epilepsy | |
| JP2020056781A (ja) | 標的の特性の予測を行うための方法、コンピュータシステム、プログラム |
Legal Events
| Date | Code | Title | Description |
|---|---|---|---|
| STAA | Information on the status of an ep patent application or granted ep patent |
Free format text: STATUS: THE INTERNATIONAL PUBLICATION HAS BEEN MADE |
|
| PUAI | Public reference made under article 153(3) epc to a published international application that has entered the european phase |
Free format text: ORIGINAL CODE: 0009012 |
|
| STAA | Information on the status of an ep patent application or granted ep patent |
Free format text: STATUS: REQUEST FOR EXAMINATION WAS MADE |
|
| 17P | Request for examination filed |
Effective date: 20210222 |
|
| AK | Designated contracting states |
Kind code of ref document: A1 Designated state(s): AL AT BE BG CH CY CZ DE DK EE ES FI FR GB GR HR HU IE IS IT LI LT LU LV MC MK MT NL NO PL PT RO RS SE SI SK SM TR |
|
| DAV | Request for validation of the european patent (deleted) | ||
| DAX | Request for extension of the european patent (deleted) | ||
| REG | Reference to a national code |
Ref country code: DE Ref legal event code: R079 Free format text: PREVIOUS MAIN CLASS: G01N0033500000 Ipc: G16C0020300000 |
|
| A4 | Supplementary search report drawn up and despatched |
Effective date: 20220610 |
|
| RIC1 | Information provided on ipc code assigned before grant |
Ipc: G16C 20/70 20190101ALN20220603BHEP Ipc: G01N 33/48 20060101ALI20220603BHEP Ipc: G16C 20/30 20190101AFI20220603BHEP |
|
| STAA | Information on the status of an ep patent application or granted ep patent |
Free format text: STATUS: EXAMINATION IS IN PROGRESS |
|
| 17Q | First examination report despatched |
Effective date: 20240229 |