EP3977478B1 - Computerimplementiertes verfahren und computerprogrammprodukte zur identifikation von zeitfrequenzmerkmalen von physiologischen ereignissen - Google Patents
Computerimplementiertes verfahren und computerprogrammprodukte zur identifikation von zeitfrequenzmerkmalen von physiologischen ereignissen Download PDFInfo
- Publication number
- EP3977478B1 EP3977478B1 EP20734465.6A EP20734465A EP3977478B1 EP 3977478 B1 EP3977478 B1 EP 3977478B1 EP 20734465 A EP20734465 A EP 20734465A EP 3977478 B1 EP3977478 B1 EP 3977478B1
- Authority
- EP
- European Patent Office
- Prior art keywords
- time
- frequency
- physiological signals
- physiological
- signals
- Prior art date
- Legal status (The legal status is an assumption and is not a legal conclusion. Google has not performed a legal analysis and makes no representation as to the accuracy of the status listed.)
- Active
Links
Images


Classifications
-
- G—PHYSICS
- G16—INFORMATION AND COMMUNICATION TECHNOLOGY [ICT] SPECIALLY ADAPTED FOR SPECIFIC APPLICATION FIELDS
- G16H—HEALTHCARE INFORMATICS, i.e. INFORMATION AND COMMUNICATION TECHNOLOGY [ICT] SPECIALLY ADAPTED FOR THE HANDLING OR PROCESSING OF MEDICAL OR HEALTHCARE DATA
- G16H50/00—ICT specially adapted for medical diagnosis, medical simulation or medical data mining; ICT specially adapted for detecting, monitoring or modelling epidemics or pandemics
- G16H50/20—ICT specially adapted for medical diagnosis, medical simulation or medical data mining; ICT specially adapted for detecting, monitoring or modelling epidemics or pandemics for computer-aided diagnosis, e.g. based on medical expert systems
-
- A—HUMAN NECESSITIES
- A61—MEDICAL OR VETERINARY SCIENCE; HYGIENE
- A61B—DIAGNOSIS; SURGERY; IDENTIFICATION
- A61B5/00—Measuring for diagnostic purposes; Identification of persons
- A61B5/24—Detecting, measuring or recording bioelectric or biomagnetic signals of the body or parts thereof
- A61B5/316—Modalities, i.e. specific diagnostic methods
- A61B5/369—Electroencephalography [EEG]
- A61B5/37—Intracranial electroencephalography [IC-EEG], e.g. electrocorticography [ECoG]
-
- A—HUMAN NECESSITIES
- A61—MEDICAL OR VETERINARY SCIENCE; HYGIENE
- A61B—DIAGNOSIS; SURGERY; IDENTIFICATION
- A61B5/00—Measuring for diagnostic purposes; Identification of persons
- A61B5/24—Detecting, measuring or recording bioelectric or biomagnetic signals of the body or parts thereof
- A61B5/316—Modalities, i.e. specific diagnostic methods
- A61B5/369—Electroencephalography [EEG]
- A61B5/372—Analysis of electroencephalograms
- A61B5/374—Detecting the frequency distribution of signals, e.g. detecting delta, theta, alpha, beta or gamma waves
-
- A—HUMAN NECESSITIES
- A61—MEDICAL OR VETERINARY SCIENCE; HYGIENE
- A61B—DIAGNOSIS; SURGERY; IDENTIFICATION
- A61B5/00—Measuring for diagnostic purposes; Identification of persons
- A61B5/40—Detecting, measuring or recording for evaluating the nervous system
- A61B5/4076—Diagnosing or monitoring particular conditions of the nervous system
- A61B5/4094—Diagnosing or monitoring seizure diseases, e.g. epilepsy
-
- A—HUMAN NECESSITIES
- A61—MEDICAL OR VETERINARY SCIENCE; HYGIENE
- A61B—DIAGNOSIS; SURGERY; IDENTIFICATION
- A61B5/00—Measuring for diagnostic purposes; Identification of persons
- A61B5/72—Signal processing specially adapted for physiological signals or for diagnostic purposes
- A61B5/7235—Details of waveform analysis
- A61B5/7253—Details of waveform analysis characterised by using transforms
- A61B5/7257—Details of waveform analysis characterised by using transforms using Fourier transforms
-
- A—HUMAN NECESSITIES
- A61—MEDICAL OR VETERINARY SCIENCE; HYGIENE
- A61B—DIAGNOSIS; SURGERY; IDENTIFICATION
- A61B5/00—Measuring for diagnostic purposes; Identification of persons
- A61B5/72—Signal processing specially adapted for physiological signals or for diagnostic purposes
- A61B5/7235—Details of waveform analysis
- A61B5/7264—Classification of physiological signals or data, e.g. using neural networks, statistical classifiers, expert systems or fuzzy systems
- A61B5/7267—Classification of physiological signals or data, e.g. using neural networks, statistical classifiers, expert systems or fuzzy systems involving training the classification device
-
- A—HUMAN NECESSITIES
- A61—MEDICAL OR VETERINARY SCIENCE; HYGIENE
- A61B—DIAGNOSIS; SURGERY; IDENTIFICATION
- A61B5/00—Measuring for diagnostic purposes; Identification of persons
- A61B5/48—Other medical applications
- A61B5/4836—Diagnosis combined with treatment in closed-loop systems or methods
Definitions
- the present invention relates to a computer implemented method and to computer program products for identifying the characteristic time-frequency features of physiological events.
- the invention can be used to extract the spectral features of the electrophysiological seizure onset patterns and to predict the epileptic focus.
- Recent technological advances in brain recording modalities have enormously increased the amount of available brain data sampled at various spatial and temporal scales. This opens up the possibility to develop algorithmic methods that read these data and extract relevant information for both scientific research and clinical practice.
- a variety of clinical and basic research problems that are associated to a specific temporal event where brain activity is either externally (e.g., electrical stimulation, drug administration) or internally (e.g., epileptic seizures) perturbed, can be analyzed in similar terms by a single methodology that uncovers patterns of physiological signals to determine its spatial, temporal and frequency extent.
- a brain disorder such as epilepsy
- a brain disorder such as epilepsy
- a third of all patients that are drug-resistant for which the success of the resective surgery critically depends on the accurate spatial definition of the epileptogenic zone (EZ).
- EZ epileptogenic zone
- the use of invasive recording techniques to monitor intracranial electroencephalography (iEEG) activity might be required during the pre-surgical evaluation to determine the cortical areas to be resected.
- iEEG intracranial electroencephalography
- US 9326698-B2 discloses a method that detects oscillatory signals representative of discrete events in a patient's body.
- the detected signals may be tested in the context of surrounding background activity to identify anomalous discrete physiological events that are sufficiently different from the surrounding background activity.
- the anomalous discrete physiological events having correlative morphological, time, or location characteristics may be automatically clustered and clusters of anomalous physiological events may be determined that are indicative of at least one region of the patient's body that is associated with a medical condition.
- US 6678548-B1 discloses a method for predicting and detecting epileptic seizure onsets within a unified multiresolution probabilistic framework, enabling a portion of the device to automatically deliver a progression of multiple therapies, ranging from benign to aggressive as the probabilities of seizure warrant.
- x) representing the probability of one or more seizures starting within the next T minutes, given observations x derived from IEEG or other signals, is periodically synthesized for a plurality of prediction time horizons.
- probabilities defined in this manner provide anticipatory timelocalization of events in a synergistic logarithmic-like array of time resolutions, thus effectively circumventing the performance vs. prediction-horizon tradeoff of singleresolution systems.
- the longer and shorter prediction time scales are made to correspond to benign and aggressive therapies respectively.
- the imminence of seizure events serves to modulate the dosage and other parameters of treatment during openloop or feedback control of seizures once activation is triggered.
- Fast seizure onset detection is unified within the framework as a degenerate form of prediction at the shortest, or even negative, time horizon.
- US 2012245481-A1 discloses a method for automatically identifying discrete physiological events such as high-frequency oscillations within the human body and classifying such events for diagnostic purposes.
- the method can detect and classify oscillatory signals representative of discrete events in a patient's body using a high sensitivity, low specificity detector.
- the detected signals may be tested in the context of surrounding background activity to identify anomalous discrete physiologic events that are sufficiently different from the surrounding background activity.
- the anomalous discrete physiologic events may be automatically clustered into clusters of anomalous physiologic events having correlative morphological, time, or location characteristics. At least one cluster of anomalous physiologic events may be determined that is indicative of at least one region of the patient's body that is associated with a medical condition.
- biomarkers are critically built around spectral features that are confined to predefined frequency bands (either high frequency or whole-spectrum) and might fall short to capture patient-specific seizure onset patterns. Yet, there is no adaptive algorithm that extracts the most relevant features for SOZ localization before proceeding to the localization itself. In addition, these biomarkers are typically applied individually to each signal leveraging on its time samples (e.g. US 9326698-B2 , US 2012245481-A1 ) in contrast to a biomarker that outputs a ⁇ decision relying on all signals' time samples simultaneously.
- embodiments of the present invention provide, according to a first aspect, a computer implemented method for identifying time-frequency features of physiological events, as recited in claim 1.
- the proposed method comprises receiving, by a computing system having at least one memory and one or more processors, a time period in which a physiological event occurred; a set of physiological signals associated with said physiological event, each signal of the set corresponding to a different spatial location of a body part of a living being either a human or an animal; a time-frequency region of interest; and a plurality of time-frequency windows defined on the time-frequency region of interest.
- the cited time-frequency region is defined by a minimum and a maximum time instant and a minimum and a maximum frequency, wherein said minimum and maximum time instants are comprised within said time period in which the physiological event occurred and said maximum frequency is lower or equal than the sampling rate of the physiological signals (for example, lower or equal than the Nyquist frequency of the physiological signals).
- the computing system comprises filtering the set of physiological signals within each of said plurality of time-frequency windows, obtaining as a result a filtered set of physiological signals for each time-frequency window. Then, the computing system calculates, for each defined time-frequency window, a given feature for the filtered set of physiological signals, each one of the signals having a given feature value, providing for each time-frequency window a set of feature values. For each time-frequency window, the computing system then also calculates a first quantifier defined as a function of the set of feature values and/or a second quantifier defined as a function of an empirical distribution of the set of feature values.
- the first quantifier is then compared with a given first threshold.
- the computer system may select the time-frequency windows satisfying the first threshold (i.e. being either above or below the threshold).
- this second quantifier is compared with a given second threshold.
- the computing system then can select the time-frequency windows satisfying the second threshold.
- the first and second thresholds are different.
- the physiological event may be an epileptic seizure, the pre-ictal preparation phase, the brain response to a delivered cognitive or electrical stimulus, the brain response to the administration of a drug, etc.
- the physiological signals may particularly comprise intracranial electroencephalography (iEEG) signals.
- the given feature defines an intrinsic attribute of each signal of the filtered set of physiological signals.
- the intrinsic attribute can include the power in band (PIB) of each signal within each time-frequency window or the mean activation (MA).
- the MA is defined as the instantaneous activation of each signal averaged within each time-frequency window, where said instantaneous activation is the continuous power (for instance, obtained via the Hilbert transform) expressed as a z-score with respect to a common pre-ictal baseline distribution defined by pooling together all signals' power values within that band.
- the given feature defines an attribute that indicates how each signal of the filtered set of physiological signals is related with respect to the other signals of the filtered set.
- the attribute can be computed using a correlation strength measure (for instance, the average Pearson correlation or Mutual Information), a betweenness centrality measure, a node degree measure, among others.
- the first quantifier can comprise any of the mean, the standard deviation, the maximum, the global activation (GA), the minimum or the global inactivation (GI) of the set of feature values.
- the GA is defined as the weighted average of the set of positive feature values, where each feature value is weighted by itself.
- the GI is defined as the weighted average of the set of negative feature values, where each feature value is weighted by itself.
- the second quantifier can comprise the Renyi entropy, the Fisher information or the activation entropy (AE) of an empirical distribution of the set of feature values.
- the AE is defined as the Shannon entropy of said empirical distribution.
- the computer system can further compare the set of feature values with a given third threshold for each time-frequency window satisfying the first and/or second threshold, thus defining, for each time-frequency window satisfying the first and/or second threshold, a subset of the filtered set of physiological signals, called relevant filtered physiological signals; and accumulate all relevant filtered physiological signals across time-frequency windows satisfying the first and/or second threshold, thus defining a subset of the set of physiological signals, called relevant physiological signals.
- the time-frequency windows may overlap or not with each other. Likewise, the time-frequency windows may have an equal or different width. Even, the time-frequency windows may be nested windows with initial bound fixed at said minimum time instant and with increasing final bound.
- the recorded signals are intracranial electroencephalography (iEEG) signals
- the physiological event is an epileptic seizure
- the given feature is the mean activation (MA)
- the first and second quantifiers are the global activation (GA) and the activation entropy (AE), respectively
- the first and second thresholds are a lower threshold for GA and an upper threshold for AE, respectively.
- both quantifiers are computed and the computer system further comprises identifying the relevant physiological signals as described above.
- the time-frequency windows satisfying both the first and the second thresholds yield maximal and spatially confined spectral activations, thus ensuring that propagation has not started and that SOZ contacts can be naturally discriminated from other sites.
- the selected time-frequency windows reflect the temporospectral features of the ictal onset patterns and the relevant physiological signals identify the seizure focus.
- the recorded signals can be scalp electroencephalography (EEG) signals and the computing system would detect the ictal onset patterns and the scalp electrodes where the seizure is first manifested.
- EEG scalp electroencephalography
- the recorded signals are also intracranial electroencephalography (iEEG) signals from humans or animals and the physiological event is the brain response to a delivered stimulus or the brain response to the administration of a drug.
- iEEG intracranial electroencephalography
- the computing system would detect and localize the brain response to these perturbations.
- the thresholds can be automatically learned by using a controlled set of signals were the true SOZ patterns and contacts are known a priori (e.g., they have been extensively validated by clinical variables including post-surgical outcome) and using a machine learning algorithm such as linear discriminant or support-vector machine classifiers with cross-validation, among others.
- the embodiments described herein provide a fully unsupervised (as well as supervised if the thresholds are learned in annotated sets) and automatic methodology for identifying time-frequency features of physiological events, such as the epileptic seizure onset, epileptogenic sites responding to electrical stimulation, brain sites that respond to drug administration, brain sites that respond to any kind of cognitive stimulation during a task paradigm, etc.
- the proposed method carries minimal computational costs. Although the method relies on the a priori detection of the physiological event (e.g. the seizure onset time defined by the clinical neurophysiologist), it needs no information about the frequency and temporal windows of interest, two parameters that are automatically extracted from the spectral properties of the signal. Finally, and more importantly, the achieved automatization of the method does not come at the expense of interpretability.
- the output of the analysis (the time-frequency windows and the relevant physiological signals) can be easily understood as describing the spectral properties (characteristic frequency, duration and spatial localization) of an electrophysiological pattern during an event of interest.
- the proposed procedure is particularly suitable to be used as a complementary tool during the pre-surgical evaluation and planning that might help better identify and interpret the regions involved in seizure generation and propagation.
- Fig. 1 illustrates a general overview of a method for identifying time-frequency features of physiological events.
- the method is implemented/executed by a computer and is applied to a set of physiological signals associated with a physiological event, where each signal of said set corresponds to a different spatial location of a body part of a living being, either human or animal.
- the general purpose of the method is: 1) to identify the characteristic time and frequency scale of spectral changes in said physiological signals associated with (preceding, following and/or co-occurring with) a particular event for which the time boundaries are (approximately) known, and 2) if desired, to determine its spatial localization, i.e., the region where it occurred.
- SO seizure onset
- SOZ seizure onset zone
- a time period in which the physiological event occurred besides the physiological signals, as input to the method there is also needed a time period in which the physiological event occurred; a time-frequency region of interest defined by a minimum and a maximum time instant comprised within the time period in which the physiological event occurred and a minimum and a maximum frequency, the latter being limited by each signal's sampling rate (in particular, being lower than or equal to the Nyquist frequency of the physiological signals); and a plurality of time-frequency windows defined on the time-frequency region of interest.
- the plurality of time-frequency windows may overlap or not with each other and may have equal or unequal widths.
- the computer filters the set of physiological signals within each of the time-frequency windows, obtaining a filtered set of physiological signals for each time-frequency window as a result.
- the computer calculates, for each defined time-frequency window, a given feature for the filtered set of physiological signals; where each signal of the filtered set has a given feature value, providing for each time-frequency window a set of feature values.
- the given feature is an intrinsic attribute of each signal of the filtered set of physiological signals, including the power in band (PIB) or the mean activation (MA) of each signal within each time-frequency window.
- the MA is defined as the instantaneous activation of each signal averaged within each time-frequency window, where said instantaneous activation is the continuous power (for instance, obtained via the Hilbert transform) expressed as a z-score with respect to a common pre-ictal baseline distribution defined by pooling together all signals' power values within that band.
- the PIB can be computed using the Hilbert transform method in narrow bands, the wavelet transform, or the Fourier transform.
- the given feature defines an attribute that indicates how each signal of the filtered set is related with regard to the other signals of the filtered set. For example, network measures such as node strength or network centrality built upon within-frequency couplings or cross-frequency coupling can be used.
- the computer for each time-frequency window can calculate a first quantifier defined as a function of the set of feature values (step 1004), such as the mean, the standard deviation, the maximum, the global activation (GA), the minimum or the global inactivation (GI). Particularly, the GA and GI target the largest activations and inactivations in the time-frequency windows, respectively, as will be detailed later.
- a second quantifier defined as a function of an empirical distribution of the set of feature values (step 1007) such as the Fisher information, the Renyi entropy or the activation entropy (AE), that quantifies the structure or confinement of the set of feature values in the time-frequency windows.
- both first and second quantifiers can be calculated (i.e. both steps 1004 and 1007 can be executed).
- step 1004 the calculated first quantifier is compared, step 1005, with a first threshold. Finally, at step 1006, the computer selects only those time-frequency windows satisfying the threshold. The same applies for the second quantifier, as shown at steps 1008 and 1009.
- Fig. 2A graphically depicts (1) a set of physiological signals obtained from 5 sensors; and (2) the time period (highlighted box) in which the physiological event occurred, in this case 0-38 seconds.
- Fig. 2B illustrates (3) the time-frequency region of interest defined by the user (0-30 seconds, 1-150 Hz); and (4) the plurality of time-frequency windows defined on the time-frequency region of interest (nested windows; 4 exemplary windows are shown as highlighted boxes).
- the left-side column (or bottom part) of Fig. 2C the different signals filtered within each time-frequency window are illustrated.
- the given feature is the MA.
- the MA is defined as the instantaneous activation averaged within each time-frequency window, where said instantaneous activation is the continuous power (for instance, obtained via the Hilbert transform) expressed as a z-score with respect to a common pre-ictal baseline distribution defined by pooling together all signals' power values within that band.
- the quantifier for each window is calculated and compared with a threshold.
- the quantifier used is the maximum of all feature values within each window and a common threshold of 100 is used. Windows with max(MA) > 100 are selected. The window selection reveals that the physiological event defined by the highlighted box in Fig.
- HFOs initial HFOs (107-130 Hz) lasting 100 ms (invisible to the naked eye). This pattern of HFOs disappears when considering longer time periods (0-10 s).
- the window selection also reveals that the event is characterized by a prominent pattern of discharges in the beta band (12-31 Hz) at a longer timescale of appearance (0-20 s). Note that, in this example, time-frequency windows in the beta band (12-31 Hz) and time spans around 0-5 s were not selected by the system (these windows are not shown in the figure), reflecting that patterns in the beta band appear progressively some seconds after the onset of the event (compare with Fig. 2A ).
- the physiological event of interest is the epileptic seizure (and in particular the seizure onset) and the physiological signals are EEG recordings acquired from intracranial electrodes.
- the system is provided with the seizure onset time, and with a time-frequency region of interest around this time, with the plurality of time-frequency windows to be explored.
- Patient inclusion was based on the following criteria: a) that the seizure focus had been identified by the epileptologists and b) that ictal onset was confined to a reduced number of contacts.
- SOZ was identified by neurologists using visual inspection.
- Surgical resection or radio-frequency thermocoagulation (RFTC) was planned based on individual SEEG evaluations.
- Intracranial EEG recordings were obtained using 5 to 21 intracerebral multiple contact electrodes that were stereotactically implanted using robotic guidance. Signals were recorded using a standard clinical EEG system with 500 Hz of sampling rate, except for patient 3, where a sampling rate of 250 Hz was used
- the computer selected the marked ictal epoch together with 60 seconds of pre-ictal baseline activity. Artifacted channels were identified by visual inspection and removed prior to data analysis. A band-pass filter (FIR, filter band [1,165] Hz) was used to remove slow drifts and aliasing effects. A notch FIR filter at 50 Hz and its harmonic frequencies was also used to remove the alternate current interference.
- FIR band-pass filter
- the time-frequency region of interest was defined with the following parameters: from 0 to 30 s after seizure onset (SO) and from 1 to 150 Hz.
- SO seizure onset
- the following time-frequency grid was defined for exploration.
- the frequency spectrum was divided into a set of 10 non-overlapping bands.
- a set of nested time windows obtained by fixing the left bound at SO and varying the right bound were considered.
- the frequency spectrum was splitted into 10 non-overlapping bands using the following cutting points: 1, 4.2, 8, 12, 31, 50, 73, 88, 107, 130 and 150 Hz.
- windows with right bound from 100 ms to 30 s after using steps of 100 ms from 100 ms to 5 s and steps of 1 s from 5 to 30 s were considered (i.e., from SO to SO+0.1s, from SO to SO+0.2s, ..., from SO to SO+4.9s, from SO to SO+5s, from SO to SO+6s, ..., from SO to SO+30s).
- the mean activation (MA) (Vila-Vidal et al., 2017) of each recorded signal was computed by the system and used as an intrinsic feature of that signal.
- the MA quantifies the average instantaneous activation of each targeted brain structure for a pre-defined frequency and time windows of interest.
- the instantaneous activation is the continuous power of each signal (for instance, obtained via the Hilbert transform) in a specific band expressed as a z-score with respect to a single pre-ictal baseline distribution defined by pooling together all signals' power values within that band.
- This quantity is estimated from the EEG signals using a two-step procedure, as described in the next paragraph.
- x ( t ) denote a single-channel EEG signal, and let's assume that the time-frequency window of interest is defined by the frequency range [ f 1 , f 2 ] and by time points t 1 and t 2 .
- time points t 1 and t 2 are indexed as samples k 1 and k 2 , respectively.
- a time-varying spectral activation in the frequency range of interest is obtained using the Hilbert transform method.
- Signal power in each narrow band is obtained by squaring the signal envelope (modulus of the analytical signal). Summation of the signal power over all narrow frequency bands is performed to obtain the time-dependent power of each region's EEG signal in the desired frequency of interest [ f 1 , f 2 ] (PIB).
- the resulting values are z-scored with respect to a baseline distribution defined by the power values of all contacts in a non-ictal epoch (in this case, from 60 to 20 seconds before ictal onset) to obtain an activation time series A [ k ] that can be interpreted as a measure of the power change from the pre-ictal state at any given point. Note that A [ k ] can take both positive and negative values.
- activations are averaged in the time window of interest to obtain the MA for each recording site. For the precise estimation of time-averaged activations, artifactinduced noise should be first removed.
- Time-stamps with frequency-specific artifacts simultaneously affecting the majority of EEG signals are detected with a sliding-window analysis (200 samples width, 1 sample step), performed independently in the pre-ictal and ictal epochs. Time windows where the product of the mean correlation and the contact-average signal power is two standard deviations larger than the median are considered as artifacts and are discarded in the subsequent analysis.
- the computing system For each time-frequency window in the exploration grid, the computing system extracted the GA and AE quantifiers from the set of MA values.
- Fig. 3B and 3C show the GA and AE quantifiers for one exemplary seizure, respectively.
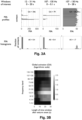
- Figs. 4 summarizes the processing steps to obtain the optimal time-frequency windows for SOZ detection (referred to as seizure onset windows, SOWs) and the SOZ.
- Intracranial EEG signals in the peri-ictal period were band-pass filtered in pre-defined bands of interest spanning the whole spectrum ( Fig. 4A ).
- MAs were obtained for all possible time windows of interest ( Fig. 4B ).
- the computer extracted the GA and AE from the set of MA values ( Fig. 4C ).
- Seizure onset window (SOW) detection was achieved by finding time-frequency windows that maximized the GA under the constraint of low AE to ensure that spectral activations were confined only to a few contacts. All pairs (f, t) were considered by the computing system and two threshold conditions, one per variable, were set. Regarding the first variable, a first or lower threshold was set at the 95-th percentile of the GA distribution. For time-frequency-windows to be considered, they were further required to have a GA above 3 to ensure significant global activations with respect to the pre-ictal state. Additionally, a second or upper threshold of 0.5 was set on the AE. All time-frequency windows satisfying both conditions were preselected as candidates to be SOWs. Finally, for each frequency band the first time windows satisfying the condition were only kept. Finally, for each frequency band only the first set of consecutive time windows fulfilling the required criteria was kept. Fig. 4D shows the selected SOWs for the first seizure of patient 1.
- the SOWs were qualitatively found to pinpoint the characteristic frequency and time windows of the seizure onset patterns.
- the algorithm selected the following SOWs: 107-130 Hz during the first hundreds of milliseconds and 12-31 Hz between 10 and 20 s. Regions of the posterior and anterior hippocampi were selected as being inside the SOZ.
- the inspection of the electrophysiological activity around the seizure onset by epileptologists revealed that the output of the method was qualitatively describing the seizure onset patterns. As seen in Fig.
- the seizure is initiated at a hippocampal level with rapid discharges ( ⁇ 110 Hz) of very low amplitude in the first hundreds of milliseconds after seizure onset, combined with an inverted depolarizing wave.
- These discharges are particularly clear in HP1 and are followed by a drastic decrease in frequency evolving to low-voltage fast-activity (LVFA) at 12-31 Hz that becomes visible 5 seconds after seizure onset and that increases in amplitude as the seizure progresses.
- LVFA low-voltage fast-activity
- activations identified at 12-31 Hz are in fact a combined effect of LVFA activity ( ⁇ 30 Hz) together with slow rhythmic spikes (RS) ( ⁇ 15 Hz) of high amplitude particularly observable between 10 and 20 s.
- the relevant iEEG channels were found by applying a third threshold on the set of MA values.
- the third threshold was induced by the threshold applied on the AE quantifier.
- An upper threshold of 0.5 on the AE quantifier implies that, for each time-frequency windows satisfying the threshold, at least 80% of the contacts lie within the same MA bin.
- the computing system identified the highly populated MA bin (having at least 80% of the contacts), which was used to define the third threshold. Contacts above this bin were considered to be part of the SOZ. This procedure was repeated for all selected SOWs, and SOZ contacts were accumulated, thus obtaining a single SOZ per seizure ( Fig. 4F ).
- the amount of SOZ predictability carried in the pre-ictal activity was also assessed. To do so, time windows spanning from seizure onset into the past, i.e., with final bound at seizure onset and initial bound ranging from 30 s to 0.1 s before seizure onset, with the same spacing as before, were also considered. The average sensitivities and specificities of the method across patients in the pre-ictal period were lower than in the ictal period: 0.77 ⁇ 0.32 (mean ⁇ standard deviation) and 0.77 ⁇ 0.12, respectively. Although the method has a better performance in the ictal period, high sensitivities and specificities indicate that the pre-ictal period contains sufficient information for SOZ prediction.
- the method for seizure onset pattern identification and epileptic focus prediction was also tested with 9 pharmacoresistant epileptic patients admitted at Hospital Clinic for intracranial video-EEG monitoring between January 2017 and March 2019, including patients with extra-temporal lobe epilepsy. These patients underwent stereotactic-EEG presurgical diagnosis at the EEG lab from the Epilepsy Unit in Hospital Clinic, Barcelona, Spain. Intracranial EEG recordings were obtained using intracerebral multiple contact electrodes that were stereotactically implanted using robotic guidance. Signals were recorded using a standard clinical EEG system with 1024 or 2048 Hz of sampling rate.
- the EEG epochs containing a total of 44 seizures were selected, annotated and documented by trained epileptologists from this unit. All seizures were processed by the system using the same configuration and procedure as used with patients from Hospital del Mar without any further adaptation or adjustment. Upon revision with clinicians, the system was qualitatively found to pinpoint the ictal onset patterns in a significant proportion of seizures (73%). A preliminary analysis showed that the system correctly identified the SOZ in 6 of the 9 patients when running blindly.
- the method is used to identify ictal onset patterns in scalp EEG and to pinpoint scalp electrodes where those patterns where first registered.
- the physiological event of interest is also the onset of an epileptic seizure, but the physiological signals are EEG recordings acquired from scalp electrodes.
- the present invention was applied for seizure onset pattern identification in scalp EEG recordings. To this end, 2 patients that underwent non-invasive long-term video-EEG monitoring in 2017 in the Epilepsy Unit at Hospital Clinic, Barcelona, Spain, were selected. Video-EEG was performed using a 64-channel Neurolink 64 inbox-1166A amplifier and recorded at 1024 Hz using NeuroWorks software (Natus Medical Inc.).
- Superficial electrodes were located using the 10/20 International system, using additional electrodes in the frontotemporal regions according the 10/10 system.
- Video-EEG monitoring was performed in the epilepsy unit for 5 d, and antiepileptic drugs were reduced when necessary to facilitate seizure occurrence.
- EEG epochs containing a total of 4 seizures (2 per patient) were selected, annotated and documented by trained epileptologists from the unit. All seizures were processed by the system using the same configuration and procedure as used with intracranial EEG, except for the AE threshold that was set to 0.7. In all cases, the system identified initial gamma rhythms upon seizure onset that lasted for some seconds before propagation. In particular, the system showed that in some cases HFOs (>130 Hz) that had not been identified in visual inspection by the clinicians were also present in the first milliseconds after seizure onset.
- HFOs >130 Hz
- the system is used to detect spectral patterns elicited by electrical stimulation applied with invasive or non-invasive electrodes and to identify the contacts where these patterns occur.
- seven electrodes were implanted with a total of 80 channels.
- the sampling rate of the EEG data was 500 Hz.
- the method was applied to analyze the post-stimulation effect that an electrical stimulation delivered on a specific pair of channels in the frontal cingulate area, and which lasted 25 seconds, had on all recorded channels.
- the time-frequency region of interest was defined with the following parameters: from 0 to 30 s after stimulation offset (SO) and from 1 to 150 Hz.
- the frequency spectrum was divided into a set of 10 non-overlapping bands.
- a set of nested time windows obtained by fixing the left bound at SO and varying the right bound were considered.
- the frequency spectrum was splitted into 10 non-overlapping bands using the following cutting points: 1, 4.2, 8, 12, 31, 50, 73, 88, 107, 130 and 150 Hz.
- windows with right bound from 100 ms to 30 s after stimulation offset (SO) using steps of 100 ms from 100 ms to 5 s and steps of 1 s from 5 to 30 s were considered (i.e., from SO to SO+0.1s, from SO to SO+0.2s, ..., from SO to SO+4.9s, from SO to SO+5s, from SO to SO+6s, ... , from SO to SO+30s).
- the feature used to characterize each EEG signal within each time-frequency window was the average power of each signal in a specific band z-scored with respect to the signal's baseline statistics (i.e., data was demeaned by the baseline mean and then normalized by the baseline standard deviation).
- the system used a 5-seconds artifact-free pre-stimulation period. This quantity was estimated using the following procedure.
- the system estimated the time-dependent power using the Hilbert transform. Then, resulting values of each contact were z-scored with respect to baseline statistics for each contact and frequency band independently. Then, for each time-frequency window of interest, the system computed the average z-scored power over the time-window of interest.
- the system For each time-frequency window, the system computed the GA and selected windows with GA>3, searching for increases in power. The system reported general increases in delta, theta, alpha and beta waves (1-30 Hz) that lasted around 30 seconds after stimulation offset. No effect was found in higher frequencies. Additionally, the system computed the AE and selected windows with GA>3 and AE ⁇ 0.6, searching for spatially confined activations elicited by the stimulation. The system reported an increase in alpha (8-12 Hz) that lasted around 15 seconds and that was visible not only in the frontal cingulate area, but also in distant contacts from the temporal gyri, pinpointing possible propagation paths through fiber tracts.
- the physiological event of interest is the administration of the drug and the physiological signals are EEG recordings acquired from scalp or intracranial electrodes.
- the system is provided with the time period where the drug is infused, with a time-frequency region of interest after this time, with a plurality of time-frequency windows to be explored.
- the method was tested in intracranial electrophysiological data from a freelymoving mouse during a pharmacological experiment reported in a previous publication (Gener et al., 2019).
- the experimental paradigm consisted of 30min baseline period, 30 min following administration of saline, 1 h following administration of the first drug (agonists and antagonists), and 1 h period following administration of the second drug (antagonists following agonists only).
- intracranial recordings sampled at 30Khz were obtained from several electrodes implanted in the prefrontal cortex (PFC) and hippocampus (HPC). A complete description of the experimental design and data recordings is provided in (Gener et al., 2019).
- LFPs HPC local field potential
- DOI 1-(2,5-dimethoxy-4-iodophenyl)-2 amino propane
- HPC HPC local field potential
- time-frequency windows were defined.
- the frequency spectrum was divided into a set of 17 non-overlapping bands using the following cutting points: 1, 4, 8, 12, 20, 30, 40, 50, 60, 70, 80, 90, 100, 110, 120,130,140 and 150 Hz.
- time-domain a set of nested time windows obtained by fixing the left bound at drug administration and varying the right bound were considered.
- a total of 120 time-windows with right bound from 30 s to 1 h after drug administration (DA) were considered, increasing the window size in steps of 30 s (i.e., from DA to DA+30 s, from DA to DA+60s, from DA to DA+90s, ..., from DA to DA+1h).
- the feature used to characterize each LFP signal within each time-frequency window was the average power in band (PIB) normalized with respect to the baseline PIB distribution of that signal in that particular frequency band. This quantity was estimated using a slicing window and a multi-taper method as described in the next paragraph.
- a spectrogram from 1 to 150 Hz was constructed using a slicing window and a multi-taper method. Slicing windows (not to be confused with time windows of interest) with window step and window length equal to 30 s were used. Within each slicing window, power spectral density (PSD) from 1 to 150 Hz was estimated using discrete prolate spheroidal sequences (DPSS) with standardized half bandwidth set to 5 and orders ranging from 1 to 9 (a total of 9 tapers).
- DPSS discrete prolate spheroidal sequences
- Fig. 5A shows the spectrograms for two signals from PFC and HPC. Then, for each frequency band defined above, the PIB was obtained by summating the spectrogram over the frequencies contained in that band.
- the PIB time-course was z-scored with respect to baseline statistics (i.e., data was demeaned by the baseline mean and then normalized by the baseline standard deviation).
- the z-scored PIB reflects the power change of a given signal in a given frequency band elicited by the administration of a drug, with positive (resp. negative) values reflecting increases (resp. decreases) in power with respect to the baseline activity of that contact.
- 5B shows the z-scored PIB time-courses for two exemplary bands showing spectral changes upon drug administration (4-8 Hz and 90-100 Hz).
- the feature of the set of LFP signals was obtained by averaging the z-scored PIB values over the time windows of interest. Note that, with a sampling of 1 PIB value every 30 s, the i-th time window of interest (from DA to DA+ 30i) contains a total of i PIB samples.
- the GA (defined above) computed over Z as the first quantifier was used.
- the GA is the average of the set of Z values over all contacts with positive Z, where each contact's contribution is weighted by the magnitude of its own Z value, thus ensuring that signals with a most prominent increase in power have a higher impact on the final value:
- time-frequency windows with GA > 1.24 (3rd quantile of the GA distribution) were selected.
- the method further identified contacts responsible for this global increase in power by applying a threshold on the Z values. Contacts with with Z > 1.24 were selected.
- GI Global Inactivation
- the GI is defined as the weighted average of the set of Z values over all contacts with negative Z, where each contact's contribution is weighted by the magnitude of its own Z value, thus ensuring that signals with a most prominent decrease in power have a higher impact on the final value:
- time-frequency windows with a GI ⁇ -1.7 (1st quantile of the GI distribution) were selected.
- the method further identified contacts responsible for this global decrease in power by applying a threshold on the Z values. Contacts with Z ⁇ -1.7 were selected.
- Fig. 5C shows the quantifiers used in the two different versions of the system: the Global Activation (GA) targets the most prominent increases in PIB regardless of the contact where they occur, while the Global Inactivation (GI) targets the most prominent decreases in PIB regardless of the contact where they occur. Drug administration occurs at 0 min.
- G Global Activation
- GI Global Inactivation
- Certain aspects of the present invention include process steps or operations and instructions described herein in an algorithmic and/or algorithmic-like form. It should be noted that the process steps and/or operations and instructions of the present invention can be embodied in software, firmware, and/or hardware, and when embodied in software, can be downloaded to reside on and be operated from different platforms used by real-time network operating systems.
Landscapes
- Health & Medical Sciences (AREA)
- Life Sciences & Earth Sciences (AREA)
- Engineering & Computer Science (AREA)
- Physics & Mathematics (AREA)
- Biomedical Technology (AREA)
- Public Health (AREA)
- Medical Informatics (AREA)
- General Health & Medical Sciences (AREA)
- Pathology (AREA)
- Animal Behavior & Ethology (AREA)
- Veterinary Medicine (AREA)
- Biophysics (AREA)
- Molecular Biology (AREA)
- Surgery (AREA)
- Heart & Thoracic Surgery (AREA)
- Psychiatry (AREA)
- Artificial Intelligence (AREA)
- Neurology (AREA)
- Neurosurgery (AREA)
- Physiology (AREA)
- Psychology (AREA)
- Signal Processing (AREA)
- Computer Vision & Pattern Recognition (AREA)
- Mathematical Physics (AREA)
- Fuzzy Systems (AREA)
- Evolutionary Computation (AREA)
- Data Mining & Analysis (AREA)
- Databases & Information Systems (AREA)
- Epidemiology (AREA)
- Primary Health Care (AREA)
- Measurement And Recording Of Electrical Phenomena And Electrical Characteristics Of The Living Body (AREA)
Claims (15)
- Computerimplementiertes Verfahren zum Identifizieren von Zeit-Frequenz-Merkmalen von physiologischen Ereignissen, wobei das Verfahren Folgendes umfasst:a) Empfangen, durch ein Rechensystem:einer Zeitperiode, in der ein physiologisches Ereignis stattgefunden hat;eines Satzes von physiologischen Signalen, die mit dem physiologischen Ereignis verknüpft sind, wobei jedes Signal des Satzes von physiologischen Signalen einem anderen räumlichen Standort eines Körperteils eines Lebewesens entspricht;einer Zeit-Frequenz-Region von Interesse, wobei die Zeit-Frequenz-Region durch einen minimalen und einen maximalen Zeitpunkt und eine minimale und eine maximale Frequenz definiert ist, wobei der minimale und der maximale Zeitpunkt innerhalb der Zeitperiode umfasst sind, in der das physiologische Ereignis stattgefunden hat, und die maximale Frequenz niedriger oder gleich der Abtastrate von den physiologischen Signalen ist; undeiner Vielzahl von Zeit-Frequenz-Fenstern, die auf der Zeit-Frequenz-Region von Interesse definiert sind;b) Filtern des Satzes von physiologischen Signalen innerhalb jedes der Vielzahl von Zeit-Frequenz-Fenstern, wobei als Ergebnis ein gefilterter Satz von physiologischen Signalen für jedes Zeit-Frequenz-Fenster erhalten wird;c) Berechnen eines gegebenen Merkmals für den gefilterten Satz von physiologischen Signalen für jedes definierte Zeit-Frequenz-Fenster durch das Rechensystem, wobei jedes der Signale des gefilterten Satzes von physiologischen Signalen einen gegebenen Merkmalswert aufweist, wobei für jedes Zeit-Frequenz-Fenster ein Satz von Merkmalswerten bereitgestellt wird; undd) Berechnen durch das Rechensystem für jedes Zeit-Frequenz-Fenster mindestens eines von:einem ersten Quantifizierer, der als eine Funktion des Satzes von Merkmalswerten definiert ist, und Vergleichen des berechneten ersten Quantifizierers mit einem gegebenen ersten Schwellenwert, wobei das Rechensystem ferner die Zeit-Frequenz-Fenster auswählt, die den ersten Schwellenwert erfüllen; und/odereinem zweiten Quantifizierer, der als eine Funktion einer empirischen Verteilung des Satzes von Merkmalswerten definiert ist, und Vergleichen des berechneten zweiten Quantifizierers mit einem gegebenen zweiten Schwellenwert, wobei das Rechensystem ferner die Zeit-Frequenz-Fenster auswählt, die den zweiten Schwellenwert erfüllen.
- Verfahren nach Anspruch 1, wobei das gegebene Merkmal, das in Schritt c) berechnet wird, ein intrinsisches Attribut von jedem Signal des gefilterten Satzes von physiologischen Signalen definiert, wobei das intrinsische Attribut mindestens eines von der Leistung im Band (PIB) von jedem Signal innerhalb jedes Zeit-Frequenz-Fensters oder der mittleren Aktivierung (MA) beinhaltet, definiert als die momentane Aktivierung jedes Signals, gemittelt innerhalb jedes Zeit-Frequenz-Fensters, wobei die momentane Aktivierung eine kontinuierliche Leistung ist, ausgedrückt als ein z-Wert in Bezug auf eine gemeinsame präiktale Basislinienverteilung, definiert durch Zusammenfassen aller Leistungswerte der Signale innerhalb dieses Bandes.
- Verfahren nach Anspruch 1, wobei das gegebene Merkmal in Schritt c) ein Attribut definiert, das angibt, wie jedes Signal des gefilterten Satzes von physiologischen Signalen bezüglich der anderen Signale des gefilterten Satzes in Beziehung steht, wobei das Attribut mindestens eines von der durchschnittlichen Pearson-Korrelation, der durchschnittlichen gegenseitigen Information, der Betweenness-Zentralität jedes Signals bezüglich aller anderen Signale innerhalb jedes Zeit-Frequenz-Fensters beinhaltet.
- Verfahren nach einem der vorhergehenden Ansprüche, wobei der erste Quantifizierer mindestens eines von dem Mittelwert, der Standardabweichung, dem Maximum, einer globalen Aktivierung, GA, dem Minimum oder einer globalen Inaktivierung, Gl, des Satzes von Merkmalswerten umfasst, wobei die GA als der gewichtete Durchschnitt des Satzes von positiven Merkmalswerten definiert ist, wobei jeder Merkmalswert für sich gewichtet wird, und wobei die GI als der gewichtete Durchschnitt des Satzes von negativen Merkmalswerten definiert ist, wobei jeder Merkmalswert für sich gewichtet wird.
- Verfahren nach einem der vorhergehenden Ansprüche, wobei der zweite Quantifizierer mindestens eines von der Renyi-Entropie, den Fisher-Informationen oder einer Aktivierungsentropie, AE, einer empirischen Verteilung des Satzes von Merkmalswerten umfasst, wobei die AE als die Shannon-Entropie der empirischen Verteilung definiert ist.
- Verfahren nach einem der vorhergehenden Ansprüche 1 bis 3, wobei der erste Quantifizierer eine globale Aktivierung, GA, umfasst, ein Maß, das als der gewichtete Durchschnitt des Satzes von positiven Merkmalswerten definiert ist, wobei jeder Merkmalswert für sich gewichtet wird, und wobei der zweite Quantifizierer eine Aktivierungsentropie, AE, umfasst, ein Maß, das als die Shannon-Entropie einer empirischen Verteilung des Satzes von Merkmalswerten definiert ist.
- Verfahren nach einem der vorhergehenden Ansprüche, ferner Folgendes umfassend:Vergleichen des Satzes von Merkmalswerten mit einem gegebenen dritten Schwellenwert für jedes Zeit-Frequenz-Fenster, das den ersten und/oder zweiten Schwellenwert erfüllt, wodurch für jedes Zeit-Frequenz-Fenster, das den ersten und/oder zweiten Schwellenwert erfüllt, eine Teilmenge des gefilterten Satzes von physiologischen Signalen definiert wird, die als relevante gefilterte physiologische Signale bezeichnet werden; undAkkumulieren aller relevanten gefilterten physiologischen Signale über Zeit-Frequenz-Fenster, die den ersten und/oder zweiten Schwellenwert erfüllen, wodurch eine Teilmenge des Satzes von physiologischen Signalen definiert wird, die als relevante physiologische Signale bezeichnet werden.
- Verfahren nach einem der vorhergehenden Ansprüche, wobei die Vielzahl von Zeit-Frequenz-Fenstern einander überlappen oder nicht überlappen und/oder eine gleiche oder eine unterschiedliche Breite aufweisen.
- Verfahren nach einem der vorhergehenden Ansprüche, wobei die Vielzahl von Zeit-Frequenz-Fenstern verschachtelte Fenster sind, deren Anfangsgrenze auf den minimalen Zeitpunkt fixiert ist und deren Endgrenze zunimmt.
- Verfahren nach einem der vorhergehenden Ansprüche, wobei das physiologische Ereignis ein epileptischer Anfall oder die Gehirnreaktion auf einen abgegebenen Reiz ist und wobei die physiologischen Signale Signale der Intrakranialelektroenzephalographie, iEEG, oder der Elektroenzephalographie, EEG, der Kopfhaut sind.
- Verfahren nach einem der vorhergehenden Ansprüche, wobei der erste und/oder der zweite Schwellenwert für alle Zeit-Frequenz-Fenster gleich ist.
- Verfahren nach Anspruch 1, wobei der erste und der zweite Schwellenwert unter Verwendung eines Maschinenlernalgorithmus bestimmt werden, der auf den Satz von physiologischen Signalen mit vorherigen Informationen über die Zeit-Frequenz-Fenster von Interesse angewendet wird.
- Verfahren nach Anspruch 7, wobei die ersten, zweiten und/oder dritten Schwellenwerte unter Verwendung eines Maschinenlernalgorithmus bestimmt werden, der auf den Satz von physiologischen Signalen mit vorherigen Informationen über die Zeit-Frequenz-Fenster von Interesse und die relevanten physiologischen Signale angewendet wird.
- Computerlesbares Medium, das ein Computerprogrammprodukt zum Identifizieren von Zeit-Frequenz-Merkmalen von physiologischen Ereignissen enthält, wobei das Computerprogrammprodukt Programmanweisungen umfasst, die auf Folgendem basieren:einer Zeitperiode, in der ein physiologisches Ereignis stattgefunden hat;einem Satz von physiologischen Signalen, die mit dem physiologischen Ereignis verknüpft sind, wobei jedes Signal des Satzes von physiologischen Signalen einem anderen räumlichen Standort eines Körperteils eines Lebewesens entspricht;einer Zeit-Frequenz-Region von Interesse, wobei die Zeit-Frequenz-Region durch einen minimalen und einen maximalen Zeitpunkt und eine minimale und eine maximale Frequenz definiert ist, wobei der minimale und der maximale Zeitpunkt innerhalb der Zeitperiode umfasst sind, in der das physiologische Ereignis stattgefunden hat, und die maximale Frequenz niedriger oder gleich der Abtastrate von den physiologischen Signalen ist; undeiner Vielzahl von Zeit-Frequenz-Fenstern, die auf der Zeit-Frequenz-Region von Interesse definiert sind;Filtern des Satzes von physiologischen Signalen innerhalb jedes der Vielzahl von Zeit-Frequenz-Fenstern, wobei als Ergebnis ein gefilterter Satz von physiologischen Signalen für jedes Zeit-Frequenz-Fenster erhalten wird;Berechnen eines gegebenen Merkmals für den gefilterten Satz von physiologischen Signalen für jedes definierte Zeit-Frequenz-Fenster, wobei jedes der Signale des gefilterten Satzes von physiologischen Signalen einen gegebenen Merkmalswert aufweist, wobei für jedes Zeit-Frequenz-Fenster ein Satz von Merkmalswerten bereitgestellt wird; undBerechnen für jedes Zeit-Frequenz-Fenster mindestens eines von:einem ersten Quantifizierer, der als eine Funktion des Satzes von Merkmalswerten definiert ist, und Vergleichen des berechneten ersten Quantifizierers mit einem gegebenen ersten Schwellenwert, wobei die Programmanweisungen ferner die Zeit-Frequenz-Fenster auswählen, die den ersten Schwellenwert erfüllen; und/odereinem zweiten Quantifizierer, der als eine Funktion einer empirischen Verteilung des Satzes von Merkmalswerten definiert ist, und Vergleichen des berechneten zweiten Quantifizierers mit einem gegebenen zweiten Schwellenwert, wobei die Programmanweisungen ferner die Zeit-Frequenz-Fenster auswählen, die den zweiten Schwellenwert erfüllen.
- Computerlesbares Medium nach Anspruch 14, wobei die Programmanweisungen ferner Folgendes durchführen:Vergleichen des Satzes von Merkmalswerten mit einem gegebenen dritten Schwellenwert für jedes Zeit-Frequenz-Fenster, das den ersten und/oder zweiten Schwellenwert erfüllt, wodurch für jedes Zeit-Frequenz-Fenster, das den ersten und/oder zweiten Schwellenwert erfüllt, eine Teilmenge des gefilterten Satzes von physiologischen Signalen definiert wird, die als relevante gefilterte physiologische Signale bezeichnet werden; undAkkumulieren aller relevanten gefilterten physiologischen Signale über Zeit-Frequenz-Fenster, die den ersten und/oder zweiten Schwellenwert erfüllen, wodurch eine Teilmenge des Satzes von physiologischen Signalen definiert wird, die als relevante physiologische Signale bezeichnet werden.
Applications Claiming Priority (2)
| Application Number | Priority Date | Filing Date | Title |
|---|---|---|---|
| EP19382423.2A EP3745411A1 (de) | 2019-05-27 | 2019-05-27 | Computerimplementiertes verfahren und computerprogrammprodukte zur identifikation von zeitfrequenzmerkmalen von physiologischen ereignissen |
| PCT/EP2020/064532 WO2020239742A1 (en) | 2019-05-27 | 2020-05-26 | A computer implemented method and computer program products for identifying time-frequency features of physiological events |
Publications (3)
| Publication Number | Publication Date |
|---|---|
| EP3977478A1 EP3977478A1 (de) | 2022-04-06 |
| EP3977478C0 EP3977478C0 (de) | 2025-02-19 |
| EP3977478B1 true EP3977478B1 (de) | 2025-02-19 |
Family
ID=66685546
Family Applications (2)
| Application Number | Title | Priority Date | Filing Date |
|---|---|---|---|
| EP19382423.2A Withdrawn EP3745411A1 (de) | 2019-05-27 | 2019-05-27 | Computerimplementiertes verfahren und computerprogrammprodukte zur identifikation von zeitfrequenzmerkmalen von physiologischen ereignissen |
| EP20734465.6A Active EP3977478B1 (de) | 2019-05-27 | 2020-05-26 | Computerimplementiertes verfahren und computerprogrammprodukte zur identifikation von zeitfrequenzmerkmalen von physiologischen ereignissen |
Family Applications Before (1)
| Application Number | Title | Priority Date | Filing Date |
|---|---|---|---|
| EP19382423.2A Withdrawn EP3745411A1 (de) | 2019-05-27 | 2019-05-27 | Computerimplementiertes verfahren und computerprogrammprodukte zur identifikation von zeitfrequenzmerkmalen von physiologischen ereignissen |
Country Status (4)
| Country | Link |
|---|---|
| US (1) | US20220218269A1 (de) |
| EP (2) | EP3745411A1 (de) |
| ES (1) | ES3021588T3 (de) |
| WO (1) | WO2020239742A1 (de) |
Families Citing this family (4)
| Publication number | Priority date | Publication date | Assignee | Title |
|---|---|---|---|---|
| US20220101997A1 (en) * | 2020-09-30 | 2022-03-31 | X Development Llc | Processing time-domain and frequency-domain representations of eeg data |
| US20230012100A1 (en) * | 2021-07-07 | 2023-01-12 | Medtronic, Inc. | Medication monitoring based on local field potential |
| JP2024031661A (ja) * | 2022-08-26 | 2024-03-07 | 国立大学法人東北大学 | 情報処理装置、てんかん手術支援装置、プログラム、情報処理方法 |
| CN117233746B (zh) * | 2023-03-31 | 2026-04-21 | 中国计量大学现代科技学院 | 基于主被动混合成像的目标识别系统及其识别方法 |
Family Cites Families (10)
| Publication number | Priority date | Publication date | Assignee | Title |
|---|---|---|---|---|
| US6678548B1 (en) | 2000-10-20 | 2004-01-13 | The Trustees Of The University Of Pennsylvania | Unified probabilistic framework for predicting and detecting seizure onsets in the brain and multitherapeutic device |
| US6594524B2 (en) | 2000-12-12 | 2003-07-15 | The Trustees Of The University Of Pennsylvania | Adaptive method and apparatus for forecasting and controlling neurological disturbances under a multi-level control |
| US8165683B2 (en) * | 2006-04-21 | 2012-04-24 | Medtronic, Inc. | Method and apparatus for detection of nervous system disorders |
| US20080319505A1 (en) * | 2007-05-09 | 2008-12-25 | Massachusetts Institute Of Technology | Integrated Transcranial Current Stimulation and Electroencephalography Device |
| MX370873B (es) * | 2010-10-15 | 2020-01-08 | Brain Sentinel Inc | Metodo y aparato para detectar convulsiones. |
| US9326698B2 (en) * | 2011-02-18 | 2016-05-03 | The Trustees Of The University Of Pennsylvania | Method for automatic, unsupervised classification of high-frequency oscillations in physiological recordings |
| WO2016025724A1 (en) | 2014-08-15 | 2016-02-18 | The Regents Of The University Of Michigan | Automated detector and classifier of high frequency oscillations and indicator seizure onset |
| US20160287118A1 (en) | 2015-04-01 | 2016-10-06 | The Johns Hopkins University | Computational tool for pre-surgical evaluation of patients with medically refractory epilepsy |
| US20180279939A1 (en) * | 2015-06-09 | 2018-10-04 | The Children's Medical Center Corporation | Method and system for locating seizure focus from interictal data |
| WO2018005981A1 (en) | 2016-07-01 | 2018-01-04 | Seton Healthcare Family | Prediction of preictal state and seizure onset zones based on high frequency oscillations |
-
2019
- 2019-05-27 EP EP19382423.2A patent/EP3745411A1/de not_active Withdrawn
-
2020
- 2020-05-26 US US17/613,996 patent/US20220218269A1/en active Pending
- 2020-05-26 EP EP20734465.6A patent/EP3977478B1/de active Active
- 2020-05-26 WO PCT/EP2020/064532 patent/WO2020239742A1/en not_active Ceased
- 2020-05-26 ES ES20734465T patent/ES3021588T3/es active Active
Non-Patent Citations (1)
| Title |
|---|
| VILA-VIDAL MANEL ET AL: "Detection of recurrent activation patterns across focal seizures: Application to seizure onset zone identification", CLINICAL NEUROPHYSIOLOGY, ELSEVIER, AMSTERDAM, NL, vol. 128, no. 6, 3 April 2017 (2017-04-03), pages 977 - 985, XP085018111, ISSN: 1388-2457, DOI: 10.1016/J.CLINPH.2017.03.040 * |
Also Published As
| Publication number | Publication date |
|---|---|
| WO2020239742A1 (en) | 2020-12-03 |
| ES3021588T3 (en) | 2025-05-27 |
| US20220218269A1 (en) | 2022-07-14 |
| EP3977478C0 (de) | 2025-02-19 |
| EP3977478A1 (de) | 2022-04-06 |
| EP3745411A1 (de) | 2020-12-02 |
Similar Documents
| Publication | Publication Date | Title |
|---|---|---|
| US11771898B2 (en) | Seizure onset classification and stimulation parameter selection | |
| US12193825B2 (en) | Multiscale brain electrode devices and methods for using the multiscale brain electrodes | |
| EP3977478B1 (de) | Computerimplementiertes verfahren und computerprogrammprodukte zur identifikation von zeitfrequenzmerkmalen von physiologischen ereignissen | |
| US11571573B2 (en) | Evaluation of efficacy of epilepsy therapy | |
| Baumgartner et al. | Seizure detection using scalp‐EEG | |
| JP3769023B2 (ja) | 脳の活動状態変化を予測、早期検出、警告、予防または制御するためのシステム | |
| US11980473B2 (en) | Seizure onset zone localization | |
| US6304775B1 (en) | Seizure warning and prediction | |
| US8688209B2 (en) | Device for ambulatory monitoring of brain activity | |
| US20030073917A1 (en) | Patient-specific parameter selection for neurological event detection | |
| US20150351701A1 (en) | Methods, Computer-Readable Media, and Systems for Predicting, Detecting the Onset of, and Preventing a Seizure | |
| Bandarabadi et al. | Early seizure detection using neuronal potential similarity: A generalized low-complexity and robust measure | |
| US8024032B1 (en) | Method and system for the prediction, rapid detection, warning, prevention, or control of changes in the brain states of a subject using hurst parameter estimation | |
| Vila-Vidal et al. | Low entropy map of brain oscillatory activity identifies spatially localized events: A new method for automated epilepsy focus prediction | |
| Feys et al. | Delayed effective connectivity characterizes the epileptogenic zone during stereo-EEG | |
| Aghazadeh et al. | An autonomous real-time single-channel detection of absence seizures in WAG/Rij rats | |
| Vila-Vidal et al. | Identifying the seizure onset zone with intracranial EEG: A systematic comparison between power and connectivity-based biomarkers | |
| Wang et al. | Some highlights on epileptic EEG processing | |
| Graef et al. | A physiologically motivated ECoG segmentation method for epileptic seizure onset zone detection | |
| Shahidi Zandi | Scalp EEG quantitative analysis: automated real-time detection and prediction of epileptic seizures | |
| Jouny et al. | 3Chapter 2 Early Seizure Detection: Considerations and Applications | |
| Osorio | Clinically relevant specifications for seizure prediction and detection systems |
Legal Events
| Date | Code | Title | Description |
|---|---|---|---|
| STAA | Information on the status of an ep patent application or granted ep patent |
Free format text: STATUS: UNKNOWN |
|
| STAA | Information on the status of an ep patent application or granted ep patent |
Free format text: STATUS: THE INTERNATIONAL PUBLICATION HAS BEEN MADE |
|
| PUAI | Public reference made under article 153(3) epc to a published international application that has entered the european phase |
Free format text: ORIGINAL CODE: 0009012 |
|
| STAA | Information on the status of an ep patent application or granted ep patent |
Free format text: STATUS: REQUEST FOR EXAMINATION WAS MADE |
|
| 17P | Request for examination filed |
Effective date: 20211119 |
|
| AK | Designated contracting states |
Kind code of ref document: A1 Designated state(s): AL AT BE BG CH CY CZ DE DK EE ES FI FR GB GR HR HU IE IS IT LI LT LU LV MC MK MT NL NO PL PT RO RS SE SI SK SM TR |
|
| DAV | Request for validation of the european patent (deleted) | ||
| DAX | Request for extension of the european patent (deleted) | ||
| STAA | Information on the status of an ep patent application or granted ep patent |
Free format text: STATUS: EXAMINATION IS IN PROGRESS |
|
| 17Q | First examination report despatched |
Effective date: 20230705 |
|
| GRAP | Despatch of communication of intention to grant a patent |
Free format text: ORIGINAL CODE: EPIDOSNIGR1 |
|
| STAA | Information on the status of an ep patent application or granted ep patent |
Free format text: STATUS: GRANT OF PATENT IS INTENDED |
|
| INTG | Intention to grant announced |
Effective date: 20241017 |
|
| GRAS | Grant fee paid |
Free format text: ORIGINAL CODE: EPIDOSNIGR3 |
|
| GRAA | (expected) grant |
Free format text: ORIGINAL CODE: 0009210 |
|
| STAA | Information on the status of an ep patent application or granted ep patent |
Free format text: STATUS: THE PATENT HAS BEEN GRANTED |
|
| AK | Designated contracting states |
Kind code of ref document: B1 Designated state(s): AL AT BE BG CH CY CZ DE DK EE ES FI FR GB GR HR HU IE IS IT LI LT LU LV MC MK MT NL NO PL PT RO RS SE SI SK SM TR |
|
| REG | Reference to a national code |
Ref country code: GB Ref legal event code: FG4D |
|
| REG | Reference to a national code |
Ref country code: CH Ref legal event code: EP |
|
| REG | Reference to a national code |
Ref country code: IE Ref legal event code: FG4D |
|
| REG | Reference to a national code |
Ref country code: DE Ref legal event code: R096 Ref document number: 602020046307 Country of ref document: DE |
|
| U01 | Request for unitary effect filed |
Effective date: 20250319 |
|
| U07 | Unitary effect registered |
Designated state(s): AT BE BG DE DK EE FI FR IT LT LU LV MT NL PT RO SE SI Effective date: 20250325 |
|
| REG | Reference to a national code |
Ref country code: ES Ref legal event code: FG2A Ref document number: 3021588 Country of ref document: ES Kind code of ref document: T3 Effective date: 20250527 |
|
| U20 | Renewal fee for the european patent with unitary effect paid |
Year of fee payment: 6 Effective date: 20250529 |
|
| PG25 | Lapsed in a contracting state [announced via postgrant information from national office to epo] |
Ref country code: RS Free format text: LAPSE BECAUSE OF FAILURE TO SUBMIT A TRANSLATION OF THE DESCRIPTION OR TO PAY THE FEE WITHIN THE PRESCRIBED TIME-LIMIT Effective date: 20250519 |
|
| PG25 | Lapsed in a contracting state [announced via postgrant information from national office to epo] |
Ref country code: PL Free format text: LAPSE BECAUSE OF FAILURE TO SUBMIT A TRANSLATION OF THE DESCRIPTION OR TO PAY THE FEE WITHIN THE PRESCRIBED TIME-LIMIT Effective date: 20250219 |
|
| PG25 | Lapsed in a contracting state [announced via postgrant information from national office to epo] |
Ref country code: IS Free format text: LAPSE BECAUSE OF FAILURE TO SUBMIT A TRANSLATION OF THE DESCRIPTION OR TO PAY THE FEE WITHIN THE PRESCRIBED TIME-LIMIT Effective date: 20250619 Ref country code: NO Free format text: LAPSE BECAUSE OF FAILURE TO SUBMIT A TRANSLATION OF THE DESCRIPTION OR TO PAY THE FEE WITHIN THE PRESCRIBED TIME-LIMIT Effective date: 20250519 |
|
| PG25 | Lapsed in a contracting state [announced via postgrant information from national office to epo] |
Ref country code: HR Free format text: LAPSE BECAUSE OF FAILURE TO SUBMIT A TRANSLATION OF THE DESCRIPTION OR TO PAY THE FEE WITHIN THE PRESCRIBED TIME-LIMIT Effective date: 20250219 |
|
| PG25 | Lapsed in a contracting state [announced via postgrant information from national office to epo] |
Ref country code: GR Free format text: LAPSE BECAUSE OF FAILURE TO SUBMIT A TRANSLATION OF THE DESCRIPTION OR TO PAY THE FEE WITHIN THE PRESCRIBED TIME-LIMIT Effective date: 20250520 |
|
| PG25 | Lapsed in a contracting state [announced via postgrant information from national office to epo] |
Ref country code: SM Free format text: LAPSE BECAUSE OF FAILURE TO SUBMIT A TRANSLATION OF THE DESCRIPTION OR TO PAY THE FEE WITHIN THE PRESCRIBED TIME-LIMIT Effective date: 20250219 |
|
| PG25 | Lapsed in a contracting state [announced via postgrant information from national office to epo] |
Ref country code: CZ Free format text: LAPSE BECAUSE OF FAILURE TO SUBMIT A TRANSLATION OF THE DESCRIPTION OR TO PAY THE FEE WITHIN THE PRESCRIBED TIME-LIMIT Effective date: 20250219 |
|
| PG25 | Lapsed in a contracting state [announced via postgrant information from national office to epo] |
Ref country code: SK Free format text: LAPSE BECAUSE OF FAILURE TO SUBMIT A TRANSLATION OF THE DESCRIPTION OR TO PAY THE FEE WITHIN THE PRESCRIBED TIME-LIMIT Effective date: 20250219 |
|
| REG | Reference to a national code |
Ref country code: CH Ref legal event code: H13 Free format text: ST27 STATUS EVENT CODE: U-0-0-H10-H13 (AS PROVIDED BY THE NATIONAL OFFICE) Effective date: 20251223 |
|
| PLBE | No opposition filed within time limit |
Free format text: ORIGINAL CODE: 0009261 |
|
| STAA | Information on the status of an ep patent application or granted ep patent |
Free format text: STATUS: NO OPPOSITION FILED WITHIN TIME LIMIT |
|
| REG | Reference to a national code |
Ref country code: CH Ref legal event code: L10 Free format text: ST27 STATUS EVENT CODE: U-0-0-L10-L00 (AS PROVIDED BY THE NATIONAL OFFICE) Effective date: 20251231 |
|
| PG25 | Lapsed in a contracting state [announced via postgrant information from national office to epo] |
Ref country code: CH Free format text: LAPSE BECAUSE OF NON-PAYMENT OF DUE FEES Effective date: 20250531 |
|
| REG | Reference to a national code |
Ref country code: CH Ref legal event code: K11 Free format text: ST27 STATUS EVENT CODE: U-0-0-K10-K11 (AS PROVIDED BY THE NATIONAL OFFICE) Effective date: 20260121 Ref country code: CH Ref legal event code: U11 Free format text: ST27 STATUS EVENT CODE: U-0-0-U10-U11 (AS PROVIDED BY THE NATIONAL OFFICE) Effective date: 20260121 |
|
| 26N | No opposition filed |
Effective date: 20251120 |
|
| GBPC | Gb: european patent ceased through non-payment of renewal fee |
Effective date: 20250526 |
|
| PG25 | Lapsed in a contracting state [announced via postgrant information from national office to epo] |
Ref country code: MC Free format text: LAPSE BECAUSE OF FAILURE TO SUBMIT A TRANSLATION OF THE DESCRIPTION OR TO PAY THE FEE WITHIN THE PRESCRIBED TIME-LIMIT Effective date: 20250219 |
|
| PG25 | Lapsed in a contracting state [announced via postgrant information from national office to epo] |
Ref country code: GB Free format text: LAPSE BECAUSE OF NON-PAYMENT OF DUE FEES Effective date: 20250526 |
|
| PGFP | Annual fee paid to national office [announced via postgrant information from national office to epo] |
Ref country code: ES Payment date: 20260119 Year of fee payment: 6 |
|
| PG25 | Lapsed in a contracting state [announced via postgrant information from national office to epo] |
Ref country code: IE Free format text: LAPSE BECAUSE OF NON-PAYMENT OF DUE FEES Effective date: 20250526 |