EP4018276B1 - Affichage avancé de tendance des données de processus et des alarmes secondaires - Google Patents
Affichage avancé de tendance des données de processus et des alarmes secondaires Download PDFInfo
- Publication number
- EP4018276B1 EP4018276B1 EP20780962.5A EP20780962A EP4018276B1 EP 4018276 B1 EP4018276 B1 EP 4018276B1 EP 20780962 A EP20780962 A EP 20780962A EP 4018276 B1 EP4018276 B1 EP 4018276B1
- Authority
- EP
- European Patent Office
- Prior art keywords
- process data
- time
- max
- visualisation
- data point
- Prior art date
- Legal status (The legal status is an assumption and is not a legal conclusion. Google has not performed a legal analysis and makes no representation as to the accuracy of the status listed.)
- Active
Links
Images


Classifications
-
- G—PHYSICS
- G05—CONTROLLING; REGULATING
- G05B—CONTROL OR REGULATING SYSTEMS IN GENERAL; FUNCTIONAL ELEMENTS OF SUCH SYSTEMS; MONITORING OR TESTING ARRANGEMENTS FOR SUCH SYSTEMS OR ELEMENTS
- G05B19/00—Program-control systems
- G05B19/02—Program-control systems electric
- G05B19/418—Total factory control, i.e. centrally controlling a plurality of machines, e.g. direct or distributed numerical control [DNC], flexible manufacturing systems [FMS], integrated manufacturing systems [IMS] or computer integrated manufacturing [CIM]
- G05B19/4185—Total factory control, i.e. centrally controlling a plurality of machines, e.g. direct or distributed numerical control [DNC], flexible manufacturing systems [FMS], integrated manufacturing systems [IMS] or computer integrated manufacturing [CIM] characterised by the network communication
-
- G—PHYSICS
- G05—CONTROLLING; REGULATING
- G05B—CONTROL OR REGULATING SYSTEMS IN GENERAL; FUNCTIONAL ELEMENTS OF SUCH SYSTEMS; MONITORING OR TESTING ARRANGEMENTS FOR SUCH SYSTEMS OR ELEMENTS
- G05B23/00—Testing or monitoring of control systems or parts thereof
- G05B23/02—Electric testing or monitoring
- G05B23/0205—Electric testing or monitoring by means of a monitoring system capable of detecting and responding to faults
- G05B23/0259—Electric testing or monitoring by means of a monitoring system capable of detecting and responding to faults characterized by the response to fault detection
- G05B23/0267—Fault communication, e.g. human machine interface [HMI]
- G05B23/0272—Presentation of monitored results, e.g. selection of status reports to be displayed; Filtering information to the user
-
- G—PHYSICS
- G05—CONTROLLING; REGULATING
- G05B—CONTROL OR REGULATING SYSTEMS IN GENERAL; FUNCTIONAL ELEMENTS OF SUCH SYSTEMS; MONITORING OR TESTING ARRANGEMENTS FOR SUCH SYSTEMS OR ELEMENTS
- G05B23/00—Testing or monitoring of control systems or parts thereof
- G05B23/02—Electric testing or monitoring
- G05B23/0205—Electric testing or monitoring by means of a monitoring system capable of detecting and responding to faults
- G05B23/0218—Electric testing or monitoring by means of a monitoring system capable of detecting and responding to faults characterised by the fault detection method dealing with either existing or incipient faults
- G05B23/0224—Process history based detection method, e.g. whereby history implies the availability of large amounts of data
- G05B23/024—Quantitative history assessment, e.g. mathematical relationships between available data; Functions therefor; Principal component analysis [PCA]; Partial least square [PLS]; Statistical classifiers, e.g. Bayesian networks, linear regression or correlation analysis; Neural networks
-
- G—PHYSICS
- G05—CONTROLLING; REGULATING
- G05B—CONTROL OR REGULATING SYSTEMS IN GENERAL; FUNCTIONAL ELEMENTS OF SUCH SYSTEMS; MONITORING OR TESTING ARRANGEMENTS FOR SUCH SYSTEMS OR ELEMENTS
- G05B23/00—Testing or monitoring of control systems or parts thereof
- G05B23/02—Electric testing or monitoring
- G05B23/0205—Electric testing or monitoring by means of a monitoring system capable of detecting and responding to faults
- G05B23/0218—Electric testing or monitoring by means of a monitoring system capable of detecting and responding to faults characterised by the fault detection method dealing with either existing or incipient faults
- G05B23/0243—Electric testing or monitoring by means of a monitoring system capable of detecting and responding to faults characterised by the fault detection method dealing with either existing or incipient faults model based detection method, e.g. first-principles knowledge model
- G05B23/0254—Electric testing or monitoring by means of a monitoring system capable of detecting and responding to faults characterised by the fault detection method dealing with either existing or incipient faults model based detection method, e.g. first-principles knowledge model based on a quantitative model, e.g. mathematical relationships between inputs and outputs; functions: observer, Kalman filter, residual calculation, Neural Networks
-
- G—PHYSICS
- G05—CONTROLLING; REGULATING
- G05B—CONTROL OR REGULATING SYSTEMS IN GENERAL; FUNCTIONAL ELEMENTS OF SUCH SYSTEMS; MONITORING OR TESTING ARRANGEMENTS FOR SUCH SYSTEMS OR ELEMENTS
- G05B2219/00—Program-control systems
- G05B2219/20—Pc systems
- G05B2219/24—Pc safety
- G05B2219/24103—Graphical display of proces as function of detected alarm signals
-
- G—PHYSICS
- G05—CONTROLLING; REGULATING
- G05B—CONTROL OR REGULATING SYSTEMS IN GENERAL; FUNCTIONAL ELEMENTS OF SUCH SYSTEMS; MONITORING OR TESTING ARRANGEMENTS FOR SUCH SYSTEMS OR ELEMENTS
- G05B2219/00—Program-control systems
- G05B2219/30—Nc systems
- G05B2219/31—From computer integrated manufacturing till monitoring
- G05B2219/31088—Network communication between supervisor and cell, machine group
-
- G—PHYSICS
- G05—CONTROLLING; REGULATING
- G05B—CONTROL OR REGULATING SYSTEMS IN GENERAL; FUNCTIONAL ELEMENTS OF SUCH SYSTEMS; MONITORING OR TESTING ARRANGEMENTS FOR SUCH SYSTEMS OR ELEMENTS
- G05B2219/00—Program-control systems
- G05B2219/30—Nc systems
- G05B2219/31—From computer integrated manufacturing till monitoring
- G05B2219/31479—Operator select part of process he wants to see, video image is displayed
Definitions
- the present invention is further based on a visualization system, wherein the visualization system is programmed with such a computer program, so that the visualization system, during operation, carries out the method steps specified above in connection with the computer program.
- the process data can be, for example, actual variables or setpoint variables of a controller.
- the mean value can alternatively be a weighted or an unweighted mean value.
- the median value can in particular be an xx% median value, where xx is a suitable value.
- So-called process object views are of great importance for the operation and observation of process engineering plants.
- block symbols are integrated for the process objects, which graphically display not only an important process value but also various status information such as process alarms or simulation results.
- views can also be opened for the process objects, which allow not only the pure observation of a process object but also its operation.
- further views can be opened, for example Trend curves or an alarm view with the process alarms relevant to the respective process object.
- Trend curves usually show the course of a respective process value as a function of time.
- Process alarms are usually shown in the form of a message sequence display, i.e. in the form of a chronological list of the process alarms that have occurred.
- the representation of a trend curve i.e. the temporal course of the determined process data points, corresponds to the state of the art, which is assumed within the scope of the present invention.
- Secondary alarms are alarms that are not set by the process control system, but by the visualization system.
- the visualization system checks for the respective process data point whether the determined mean or median value meets a condition specified by the operator. If - purely as an example - a process alarm is triggered as soon as a process data exceeds the value x, the operator can, for example, specify that a secondary alarm is displayed when the value determined for the respective process data point exceeds the value y, where the value y is sufficiently below the value x. A similar procedure can be used to check whether the value determined for the respective process data point falls below a value z. In the case of a secondary alarm, for example, the corresponding area of the trend curve can be highlighted in color.
- the object of the present invention is to create possibilities that enable the operator to reliably evaluate a trend curve. Furthermore, forecasts should be possible as reliably as possible.
- the predetermined triggering condition can be met, for example, if one of the object sizes exceeds or falls below a certain specified value.
- the display period can, for example, include the present if the operator specifies something like "show me process date x for the past y minutes" or a similar specification.
- the visualization system also displays a predicted process alarm together with the respective predicted process data point whenever the respective predicted minimum and/or the respective predicted maximum fulfills the predetermined triggering condition. This enables the operator to recognize more reliably than in the prior art whether and when there is a specific risk of a process alarm.
- the visualization system displays the determined minima and/or the determined maxima based on an operating input from the at least one operator together with the process data points and suppresses the display of the determined minima and/or the determined maxima based on an inverse operating input from the at least one operator.
- the operator is thus able to display the determined minima and/or the determined maxima in the determined trend curve as required or to hide them from the determined trend curve.
- a visualization system having the features of claim 9.
- a visualization system of the type mentioned at the outset is programmed with a computer program according to the invention, so that the visualization system also carries out the method steps according to the invention of the computer program according to the invention during operation.
- An industrial technical plant 1 is controlled and monitored by a process control system 2.
- the industrial technical plant 1 can, for example, be a process engineering plant. However, it can also be a different plant.
- the process control system 2 comprises control devices for individual parts of the industrial technical plant 1. The effect of the control devices on the respective part of the industrial technical plant 1 and the interaction of the control devices with each other is managed by higher-level computers.
- the process control system 2 knows so-called process objects 3.
- the process objects 3 can be defined, for example, as part of a project planning of the process control system 2.
- An example of a process object 3 is a controller that controls a variable of the industrial technical system 1.
- the process data x, x*, Pi can be, for example, actual variables x, setpoint variables x*, parameters Pi of a controller and the like.
- the parameters Pi can be, for example, the proportional gain, the reset time and the amount of the maximum output variable of the controller.
- the process control system 2 also knows the assignment of the respective process data x, x*, Pi to the process objects 3.
- the process objects 3 can be assigned according to the representation in FIG 2
- the process control system 2 also knows the assignment of the respective process alarms Aj to the process objects 3.
- the process alarms Aj each have a priority.
- the respective priority is in FIG 2 purely as an example, placed in brackets behind the respective process alarm Aj.
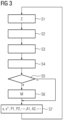
- the process control system 2 executes a control and monitoring procedure which is described below in connection with FIG 3 is explained in more detail.
- the process control system 2 receives a current state Z of the industrial technical plant 1.
- the current state Z includes in particular the actual values x of the controllers.
- the process control system 2 receives from an operator 4 (see FIG 1 ) inputs.
- the inputs can include specifications for the process objects 3, for example new setpoints x* for the controllers or a change in parameters Pi of the controllers.
- the term "operator" is used in a generic sense within the scope of the present invention. It can be a single operator or several people.
- step S3 the process control system 2 determines control variables for the industrial technical plant 1.
- the process control system 2 uses in particular the process data x, x*, Pi assigned to the individual process objects 3.
- step S4 the process control system 2 outputs the determined control variables to the industrial technical plant 1 and thereby controls the industrial technical plant 1.
- the process control system 2 checks in a step S5 whether a triggering condition is met for a process alarm Aj. The test is carried out by the process control system 2 individually for each process object 3 and within the respective process object 3 individually for each process alarm Aj. The question of whether the respective triggering condition is met or not is decided by the process control system 2 on the basis of the process data x, x*, Pi assigned to the respective process object 3.
- the triggering condition can be met, for example, if a process data x, x*, Pi of the corresponding process object 3 - in particular an actual value x - exceeds or falls below a certain predetermined value or if certain value combinations are present or other derived values fall below or exceed certain limits.
- step S6 If the triggering condition is met, the process control system 2 automatically sets the corresponding process alarm Aj in a step S6 and transmits a corresponding alarm message M to a visualization system 5 (see FIG 1 ). Otherwise, if the triggering condition is not met, step S6 is skipped.
- the process control system 2 archives at least the process data x, x*, Pi.
- the process control system 2 usually also archives the currently set process alarms Aj. Archiving takes place in the sense of a history. The respective archived values x, x*, Pi, Aj are therefore assigned the respective recording time. Furthermore, the values already archived are not overwritten. Rather, the new values to be archived are added to the values already archived, so that both the new values to be archived and the values already archived are available for evaluation at a later point in time.
- step S7 the process control system 2 then goes back to step S1.
- the cyclical repetition usually even takes place at a fixed rate.
- the visualization system 5 is programmed with a computer program 6.
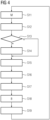
- the computer program 6 comprises machine code 7 which can be processed by the visualization system 5. Due to the processing of the machine code 7, the visualization system 5 carries out (among other things) a visualization method which is described below in connection with FIG 4 is explained in more detail.
- the visualization system 5 receives the transmitted alarm messages M from the process control system 2.
- the visualization system 5 outputs the corresponding process alarms Aj - more precisely: corresponding messages - to the operator 4.
- the output of the respective process alarm Aj to the operator 4 can be done, for example, by means of a visual display. If necessary, the visual Display can be supported by an acoustic message.
- the visualization system 5 checks whether it has received an acknowledgment from the operator 4 for the respective process alarm Aj. As long as this is not the case, the visualization system 5 skips a step S14. If, however, the visualization system 5 has received an acknowledgment from the operator 4 for the corresponding process alarm Aj, the visualization system 5 terminates the output of the respective process alarm Aj to the operator 4 in step S14.
- a step S15 the visualization system 5 receives a selection of a process data item x, x*, Pi from the operator 4.
- the operator 4 can select any process data item x, x*, Pi in step S15.
- this will often be an actual value x.
- the visualization system 5 also receives a display period from the operator 4. Since the display period is determined by the operator 4, the size of the display period is not known in advance - from the perspective of the visualization system 5. From the perspective of the visualization system 5, the display period can therefore in principle be any length.
- the visualization system 5 requests at least the history of the selected process data x, x*, Pi from the process control system 2 for the specified display period. As a rule, in step S16 the visualization system 5 also requests the history of the process alarms Aj assigned to the respective process object 3 from the process control system 2 for the same display period. In a step S17 the visualization system 5 receives the requested process data x, x*, Pi and, if applicable, also the requested process alarms Aj from the process control system 2.
- a step S18 the visualization system 5 determines a graphic 8 (see FIG 1 and 5 ).
- Graphic 8 shows the time course of the selected process data x, x*, Pi for the specified display period.
- Secondary alarms A' can be assigned to the process data points 9. The secondary alarms A' are also determined in step S18.
- Step S18 is carried out in conjunction with FIG 6 will be explained in detail.
- the graphic 8 is output by the visualization system 5 to the operator 4 in a step S19.
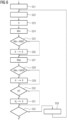
- the visualization system 5 first selects a first process data point 9 in a step S21 (see FIG 5 ).
- the visualization system 5 determines an associated recording period for the selected process data point 9.
- the respective recording period can include several recording times. If - for example - the graphic 8 can include a maximum of 200 process data points 9, but during the entire display period the process data x, x*, Pi and possibly also the process alarms Aj were recorded 10,000 times, the process data x, x*, Pi and possibly also the process alarms Aj from several recording times must necessarily be used together for each process data point 9 in order to determine the respective process data point 9.
- the visualization system 5 determines the associated value of the selected process data point 9 based on the values of the selected process data x, x*, Pi archived in this recording period.
- the visualization system 5 can use the unweighted mean (i.e. the sum of the values divided by the number of values) or the weighted mean (i.e. the sum of the values weighted with a respective weighting factor divided by the sum of the weighting factors) of the values of the selected process data x, x*, Pi as the corresponding value.
- the value of the respective process data point 9 can be represented by a median value, for example.
- the median value can in particular be an xx% median value, where xx is a suitable value between 0 and 100 (limits not included). In most cases the value of xx is between 40 and 60.
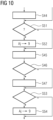
- a step S24 the visualization system 5 then determines the minimum Min of the values of the selected process data x, x*, Pi archived in this recording period.
- the visualization system 5 checks whether the determined minimum Min falls below a minimum value MIN. If this is the case, the visualization system 5 assigns a secondary alarm A' to the process data point 9 in a step S26. Otherwise, step S26 is skipped.
- the minimum value MIN can be set, for example, by the operator 4. In particular, the minimum value MIN can be selected such that as the process data x, x*, Pi becomes smaller and smaller, the secondary alarm A' is triggered before the corresponding process alarm Aj.
- a step S27 the visualization system 5 then determines the maximum Max of the values of the selected process data x, x*, Pi archived in this recording period.
- the visualization system 5 checks whether the determined maximum Max exceeds a maximum value MAX. If this is the case, the visualization system 5 also assigns a secondary alarm A' to the process data point 9 in a step S29. Otherwise, step S29 is skipped.
- the maximum value MAX can be set, for example, by the operator 4. In particular, the maximum value MAX can be selected such that as the process data x, x*, Pi becomes ever larger, the secondary alarm A' is triggered before the corresponding process alarm Aj.
- a step S30 the visualization system 5 checks whether a process alarm Aj is assigned to the process data x, x*, Pi. If this is the case, the visualization system 5 assigns one of the process alarms Aj to the process data point 9 in a step S31. As a rule, the process alarm Aj with the highest priority is assigned in step S31. If the If no process alarm Aj is assigned to process data x, x*, Pi, step S31 is skipped.
- a step S32 the visualization system 5 checks whether it has already carried out steps S22 to S31 for all process data points 9. If this is not the case, the visualization system 5 goes to a step S33 in which the visualization system 5 selects the next process data point 9. The visualization system 5 then goes back to step S22. Otherwise, the procedure of FIG 6 finished.
- steps S24 to S26 as well as steps S27 to S29 as well as steps S30 and S31 are present.
- embodiments are also possible in which only steps S24 to S26 and steps S27 to S29 or only steps S24 to S26 and steps S30 and S31 or only steps S27 to S29 and steps S30 and S31 are present.
- Embodiments are also possible in which only steps S24 to S26 or only steps S27 to S29 are present.
- the graph 8 thus includes a number of process data points 9.
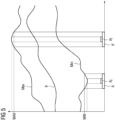
- FIG 5 shows on the one hand the course of the process data points 9.
- FIG 5 shows the course of the determined minima Min and the course of the determined maxima Max. Furthermore, in FIG 5 the determined secondary alarms A' and the associated process alarms Aj are also shown.
- the graphic 8 is output to the operator 4 as it is in FIG 5 is shown.
- the temporal progression of the process data points 9 and the secondary alarms A' are displayed.
- the temporal progression of the determined minima Min and the determined maxima Max are also displayed - if determined.
- the process alarms Aj are also displayed.
- the display of the process alarms Aj is usually carried out, but in However, this is of secondary importance within the scope of the present invention.
- the advantage of the representation according to FIG 5 lies in particular in the fact that in the case where the recording period of a respective process data point 9 includes several recording times, it is often no longer possible to determine from the data value of the respective process data point 9 whether and, if so, why a specific process alarm Aj was triggered or a secondary alarm A' was detected.
- the manner of representation just explained provides the operator 4 with the information why this is the case and at which points he must request a more refined representation of process data x, x*, Pi in order to receive complete information.
- the graphic 8 always corresponds to the representation in FIG 5 to operator 4.
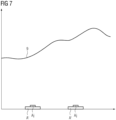
- operator 4 as shown in FIG 1 the visualization system 5 can specify an operating input I+ or an inverse operating input I-. If the operator 4 specifies the operating input I+, the output is made according to the representation in FIG 5 . If operator 4 enters the inverse input I-, the output is as shown in FIG 7 . According to the presentation of FIG 7 only the temporal progression of the process data points 9 and the secondary alarms A' (plus the process alarms Aj, if applicable) are displayed. The temporal progression of the determined minima Min and/or the determined maxima Max are not displayed, however.
- the operator 4 can therefore, as required, display the temporal progression of the determined minima Min and the determined maxima Max in the display of the process data points 9 or hide them from the display of the process data points 9. If necessary, the display or hiding of the minima Min and the maxima Max can also be done individually.
- the display period is specified by the operator 4, it can also happen that the specified display period includes the present.
- the operator 4 can specify to the visualization system 5 that the display period should extend from a point in time in the past, but otherwise in principle freely selectable (for example from a certain time) to "now" or that the display period should extend from "now” for a certain period of time (for example 10 minutes or 3 hours) into the past. If this is the case, i.e. the present is included, the procedure according to the invention is preferably carried out by the methods described below in connection with FIG 8 explained procedure is supplemented.
- FIG 8 builds on the approach of FIG 6
- steps S41 to S47 are present.
- the visualization system 5 uses the determined process data points 9 - i.e., the process data points 9 determined for the display period - to determine a forecast of the future course of the process data points 9.
- the forecast can be determined in the same way as in the prior art. The details of the determination therefore do not need to be discussed in more detail.
- the forecast is made for a forecast horizon H.
- the forecast horizon H extends according to FIG 9 from the present into the future. It is possible that the extent to which the forecast horizon H extends into the future is fixed to the visualization system 5. Alternatively, it is possible that the extent is determined by the visualization system 5 depending on the specified display period, for example as a certain percentage of the display period. Alternatively, it is possible for the extent to be specified to the visualization system 5 by the operator 4. However, the general statement that applies to any forecast is that the forecast becomes more uncertain the further it extends into the future.
- step S42 the visualization system 5 uses the determined minima Min - i.e. the minima Min determined for the display period - to determine a forecast of the future course of the minimum Min.
- the forecast can be determined in the same way as in step S41. The only difference is that the basis for the determination is not the process data points 9, but the minima Min.
- step S43 the visualization system 5 checks whether a forecast minimum Min falls below the minimum value MIN. If this is the case, the visualization system 5 assigns a forecast secondary alarm A' to the corresponding forecast process data point 9 in step S44. Otherwise, step S44 is skipped.
- step S45 the visualization system 5 uses the determined Maxima Max - i.e. the Maxima Max determined for the display period - to determine a forecast of the future course of the maximum Max.
- the forecast can also be determined here in the same way as in step S41. The only difference is that the basis for the determination is not the process data points 9, but the Maxima Max.
- step S46 the visualization system 5 checks whether a forecast maximum Max exceeds the maximum value MAX. If this is the case, the visualization system 5 also assigns a forecast secondary alarm A' to the corresponding forecast process data point 9 in step S47. Otherwise, step S47 is skipped.
- Step S19 as such is not changed.
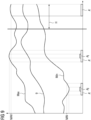
- step S19 as shown in FIG 9 not only a display of the process data points 9 for the display period, but also a display of the forecast process data points 9.
- the associated secondary alarms A' are also displayed for both types of process data points 9.
- the display of the temporal progressions of the minimum Min and the maximum Max can be changed as required and as in FIG 9 displayed or hidden. If required, the associated process alarms Aj can also be displayed for the display period.
- the time "now", i.e. the present, is in FIG 9 indicated by a vertical double line.
- steps S42 to S44 are supplemented by steps S51 and S52 and steps S45 to S47 are supplemented by steps S53 and S54.
- step S51 the visualization system 5 checks whether a predicted minimum Min satisfies the triggering condition. If this is the case, the visualization system 5 assigns a predicted process alarm Aj to the corresponding predicted process data point 9 in step S52. Otherwise, step S52 is skipped.
- step S53 the visualization system 5 checks whether a predicted maximum Max satisfies the triggering condition. If this is the case, the visualization system 5 also assigns a predicted process alarm Aj to the corresponding predicted process data point 9 in step S54. Otherwise, step S54 is skipped.
- steps S51 and S52 and/or steps S53 and S54 are present, as shown in FIG 9 In addition to the actual process alarms Aj transmitted by the process control system 2, the predicted process alarms Aj are also displayed.
- An industrial technical plant 1 is controlled and monitored by a process control system 2. It records process data x, x*, Pi at recording times and archives the recorded process data x, x*, Pi in the form of a history. Based on the selection of a process data x, x*, Pi and the specification of an associated display period by an operator 4 for this display period, a visualization system 5 requests the history of the selected process data x, x*, Pi from the process control system 2 and outputs the associated time course to the operator 4 as a graphic 8.
- the graphic 8 comprises a number of process data points 9.
- the visualization system 5 determines the respective process data point 9 as the mean or median value of the values of the selected process data x, x*, Pi of a respective recording period characteristic of the respective process data point 9. It also determines the minimum Min and/or the maximum Max of the values of the selected process data x, x*, Pi during the respective recording period for the respective process data point 9. Whenever the minimum Min determined for the respective process data point 9 falls below a predetermined minimum value MIN and/or the maximum Max determined exceeds a predetermined maximum value MAX, the visualization system 5 displays a secondary alarm A' together with the respective process data point 9.
- the present invention has many advantages. Firstly, a trend display is possible which is intuitive for the operator 4 is easier to grasp and understand. Furthermore, an improved forecast results, particularly with regard to process alarms Aj and secondary alarms A' that are to be expected in the future. Anticipatory interventions by the operator 4 in the process flow of the industrial technical system 1 are made easier. Furthermore, it cannot happen that secondary alarms A' are not displayed due to an "unfavorable" choice of the display period, which would be displayed if the display period were "favorable". This also applies to the display according to FIG 7 , since here too the determination of the secondary alarms A' is based on the minimum Min and/or the maximum Max, even if the minimum Mini and the maximum Max themselves are not displayed.
Landscapes
- Engineering & Computer Science (AREA)
- Physics & Mathematics (AREA)
- General Physics & Mathematics (AREA)
- Automation & Control Theory (AREA)
- Artificial Intelligence (AREA)
- Evolutionary Computation (AREA)
- Mathematical Physics (AREA)
- Human Computer Interaction (AREA)
- General Engineering & Computer Science (AREA)
- Manufacturing & Machinery (AREA)
- Quality & Reliability (AREA)
- Testing And Monitoring For Control Systems (AREA)
Claims (9)
- Procédé de visualisation de données (x, x*, Pi) de processus par un système (5) de visualisation,- dans lequel on commande et on contrôle une installation (1) technique industrielle par un système (2) de conduite de processus,- dans lequel le système (2) de conduite de processus détecte, à des instants de détection, respectivement des données (x, x*, Pi) de processus et archive au sens d'un historique les données (x, x*, Pi) de processus détectées,- dans lequel le système (5) de visualisation demande, sur la base de la sélection d'une donnée (x, x*, Pi) de processus et de la prescription d'un laps de temps de représentation lui appartenant par au moins une personne (4) de service, par le système (2) de conduite de processus pendant le laps de temps de représentation donné à l'avance, l'historique de la donnée (x, x*, Pi) de processus sélectionnée, et donne la courbe en fonction du temps lui appartenant sous la forme d'un graphique (8) à la au moins une personne (4) de service,- dans lequel le graphique (8) comprend un certain nombre de points (9) de données de processus, caractérisé en ce que- le système (5) de visualisation détermine le point (9) de données de processus respectif, à l'aide des valeurs de la donnée (x, x*, Pi) de processus sélectionnée d'un laps de temps de détection respectif caractérisant le point (9) de données de processus respectif, dans lequel le laps de temps de détection comprend une pluralité d'instants de détection,- le point (9) de données de processus respectif est une valeur moyenne ou une valeur médiane des données (x, x*, Pi) de processus du laps de temps de détection respectif,- le système (5) de visualisation détermine, pour le point (9) de données de processus respectif, également le minimum (Min) et/ou le maximum (Max) des valeurs de la donnée (x, x*, Pi) de processus sélectionnée pendant le laps de temps de détection respectif, et- le système (5) de visualisation contrôle si le minimum déterminé pour le point (9) de données de processus respectif est inférieur à une valeur (MIN) donnée à l'avance et/ou si le maximum (Max) dépasse une valeur (MAX) maximum donnée à l'avance, et le système (5) de visualisation indique, dans le cas où l'un ou les deux contrôles sont positifs, ensemble avec le point (9) de données de processus respectif, une alerte (A') secondaire, dans lequel une alerte (A') secondaire représente une alerte, qui n'est pas donnée par le système de conduite de processus, mais par le système de visualisation.
- Procédé de visualisation suivant la revendication 1, caractérisé- en ce que des données (x, x*, Pi) de processus sont affectées dans le système (2) de conduite de processus à un objet (3) de processus respectif,- en ce que le système (2) de commande de processus donne respectivement automatiquement une alerte (Aj) de processus, si les données (x, x*, Pi) de processus affectées à l'objet (3) de processus respectif satisfont une condition de déclenchement déterminée à l'avance,- en ce que le système (2) de commande de processus détecte, pour chaque objet (3) de processus aux instants de détection, également les alertes (Aj) de processus données instantanément et archive ou met en mémoire, au sens dudit historique, les alertes (Aj) de processus détectées,- en ce que le système (5) de visualisation demande, ensemble avec l'historique de la donnée (x, x*, Pi) de processus sélectionnée pendant le même laps de temps de représentation, également l'historique des alertes (Aj) de processus affectées à l'objet (3) de processus respectif, et- en ce que le système (5) de visualisation indique toujours le point (9) de données de processus lorsque, pendant le laps de temps de détection affecté au point (9) de données de processus respectif, il s'est produit au moins une alerte (Aj) de processus, ensemble avec le point (9) de données de processus respectif, au moins l'une des alertes (Aj) de processus.
- Procédé de visualisation suivant la revendication 2, caractérisé- en ce que le système (5) de visualisation détermine toujours, lorsque le laps de temps de représentation donné à l'avance comprend l'instant présent, à l'aide des points (9) de données de processus déterminés pendant un horizon (H) de pronostic allant de l'instant présent à l'avenir, un pronostic de la courbe à venir des points (9) de données de processus,- en ce que le système (5) de visualisation détermine en outre dans ce cas également, pour l'horizon (H) de pronostic, à l'aide des minimum (Min) déterminés, un pronostic de la courbe à venir du minimum (Min) et/ou, à l'aide des maximums (Max) déterminés, un pronostic de la courbe à venir du maximum (Max), et- en ce que le système (5) de visualisation indique toujours lorsqu'un minimum (Min) pronostiqué respectivement est inférieur à la valeur (MIN) minimum donnée à l'avance et/ou lorsqu'un maximum (Max) pronostiqué respectivement dépasse la valeur (MAX) maximum donnée à l'avance, ensemble avec le point (9) de données processus pronostiqué respectivement, une alerte (A') secondaire pronostiquée.
- Procédé de visualisation suivant la revendication 3, caractérisé
en ce que le système (5) de visualisation indique en outre toujours lorsque le minimum (Min) pronostiqué respectivement et/ou le maximum (Max) pronostiqué respectivement satisfait la condition de déclenchement déterminée à l'avance, ensemble avec le point (9) de données de processus pronostiqué respectivement, une alerte (Aj) de processus pronostiquée. - Programme d'ordinateur d'un système (5) de visualisation, dans lequel le programme d'ordinateur comprend un code machine (7), qui peut être élaboré par le système (5) de visualisation,- dans lequel le système (5) de visualisation, sur la base de l'élaboration du code machine (7), sur la base de la sélection d'une donnée (x, x*, Pi) de processus et de la prescription d'un laps de temps de représentation lui appartenant par une personne (4) de service, par un système (2) de conduite de processus commandant et contrôlant une installation (1) technique industrielle et détectant la donnée (x, x*, Pi) de processus à des instants de détection et l'archivant respectivement au sens d'un historique, demande, pour le laps de temps de représentation donné à l'avance, l'historique de la donnée (x, x*, Pi) de processus sélectionnée et donne la courbe en fonction du temps lui appartenant comme graphique (8) à la au moins une personne (4) de service,- dans lequel le graphique (8) comprend un nombre de points (9) de données de processus, caractérisé en ce que- le système (5) de visualisation détermine, sur la base de l'élaboration du code machine (7), le point (9) de données de processus respectif, à l'aide des valeurs de la donnée (x, x*, Pi) de processus sélectionnée d'un laps de temps de détection respectif caractérisant le point (9) de données de processus respectif, dans lequel le laps de temps de détection comprend une pluralité d'instants de détection,- le point (9) de données de processus respectif est une valeur moyenne ou une valeur médiane des données (x, x*, Pi) de processus du laps de temps de détection respectif,
le système (5) de visualisation détermine, sur la base de l'élaboration du code machine (7),- pour le point (9) de données de processus respectif, également le minimum (Min) et/ou le maximum (Max) des valeurs de la donnée (x, x*, Pi) de processus sélectionnée pendant le laps de temps de détection respectif, et- toujours lorsque le minimum (Min) déterminé pour le point (9) de données de processus respectif est inférieur à une valeur (MIN) minimum donnée à l'avance et/ou le maximum (Max) déterminé dépasse une valeur (MAX) maximum donnée à l'avance indique, ensemble avec le point (9) de données de processus respectif, une alerte (A') secondaire, dans lequel une alerte (A') secondaire représente une alerte, qui n'est pas donnée par le système de conduite de processus, mais par le système de visualisation. - Programme d'ordinateur suivant la revendication 5, caractérisé- en ce que des données (x, x*, Pi) de processus sont affectées dans le système (2) de conduite de processus à un objet (3) de processus respectif,- en ce que le système (2) de commande de processus donne respectivement automatiquement une alerte (Aj) de processus, si les données (x, x*, Pi) de processus affectées à l'objet (3) de processus respectif satisfont une condition de déclenchement déterminée à l'avance, détecte, pour chaque objet (3) de processus aux instants de détection, également les alertes (Aj) de processus données instantanément et archive ou met en mémoire, au sens dudit historique, les alertes (Aj) de processus détectées,- en ce que le système (5) de visualisation, sur la base de l'élaboration du code machine (7), demande, ensemble avec l'historique de la donnée (x, x*, Pi) de processus sélectionnée pendant le même laps de temps de représentation, également l'historique des alertes (Aj) de processus affectées à l'objet (3) de processus respectif, et indique toujours le point (9) de données de processus lorsque, pendant le laps de temps de détection affecté au point (9) de données de processus respectif, il s'est produit au moins une alerte (Aj) de processus, ensemble avec le point (9) de données de processus respectif, au moins l'une des alertes (Aj) de processus.
- Programme d'ordinateur suivant la revendication 6,
caractérisé
en ce que le système (5) de visualisation, sur la base de l'élaboration du code machine (7),- toujours lorsque le système de visualisation détermine, lorsque le laps de temps de représentation donné à l'avance comprend l'instant présent, à l'aide des points (9) de données de processus déterminés pendant un horizon (H) de pronostic allant de l'instant présent à l'avenir, un pronostic de la courbe à venir des points (9) de données de processus,- dans ce cas en outre également, pour l'horizon (H) de pronostic, à l'aide des minimum (Min) déterminés, un pronostic de la courbe à venir du minimum (Min) et/ou, à l'aide des maximums (Max) déterminés, un pronostic de la courbe à venir du maximum (Max), et- toujours lorsqu'un minimum (Min) pronostiqué respectivement est inférieur à la valeur (MIN) minimum donnée à l'avance et/ou lorsqu'un maximum (Max) pronostiqué respectivement dépasse la valeur (MAX) maximum donnée à l'avance, ensemble avec le point (9) de données processus pronostiqué respectivement, une alerte (A') secondaire pronostiquée. - Programme d'ordinateur suivant la revendication 7,
caractérisé
en ce que le système (5) de visualisation, sur la base de l'élaboration du code machine (7), indique, en outre toujours lorsque le minimum (Min) pronostiqué respectivement et/ou le maximum (Max) pronostiqué respectivement satisfait la condition de déclenchement déterminée à l'avance, ensemble avec le point (9) de données de processus pronostiqué respectivement, une alerte (Aj) de processus pronostiquée. - Système de visualisation, dans lequel le système de visualisation est programmé par un programme (6) d'ordinateur suivant l'une des revendications 5 à 8, de manière à ce que le système de visualisation exécute en fonctionnement les stades de procédé indiqués dans le programme correspondant des revendications 5 à 8.
Applications Claiming Priority (2)
| Application Number | Priority Date | Filing Date | Title |
|---|---|---|---|
| EP19198967.2A EP3796119A1 (fr) | 2019-09-23 | 2019-09-23 | Affichage avancé de tendance des données de processus et des alarmes secondaires |
| PCT/EP2020/075820 WO2021058344A1 (fr) | 2019-09-23 | 2020-09-16 | Indicateur de tendance étendue pour des données de processus et des alarmes secondaires |
Publications (3)
| Publication Number | Publication Date |
|---|---|
| EP4018276A1 EP4018276A1 (fr) | 2022-06-29 |
| EP4018276C0 EP4018276C0 (fr) | 2024-11-20 |
| EP4018276B1 true EP4018276B1 (fr) | 2024-11-20 |
Family
ID=68072101
Family Applications (2)
| Application Number | Title | Priority Date | Filing Date |
|---|---|---|---|
| EP19198967.2A Withdrawn EP3796119A1 (fr) | 2019-09-23 | 2019-09-23 | Affichage avancé de tendance des données de processus et des alarmes secondaires |
| EP20780962.5A Active EP4018276B1 (fr) | 2019-09-23 | 2020-09-16 | Affichage avancé de tendance des données de processus et des alarmes secondaires |
Family Applications Before (1)
| Application Number | Title | Priority Date | Filing Date |
|---|---|---|---|
| EP19198967.2A Withdrawn EP3796119A1 (fr) | 2019-09-23 | 2019-09-23 | Affichage avancé de tendance des données de processus et des alarmes secondaires |
Country Status (4)
| Country | Link |
|---|---|
| US (1) | US11892831B2 (fr) |
| EP (2) | EP3796119A1 (fr) |
| CN (1) | CN114424133B (fr) |
| WO (1) | WO2021058344A1 (fr) |
Families Citing this family (1)
| Publication number | Priority date | Publication date | Assignee | Title |
|---|---|---|---|---|
| EP4092502A1 (fr) * | 2021-05-19 | 2022-11-23 | Siemens Aktiengesellschaft | Système de guidage pour une installation technique ayant un diagramme de courbe de tendance |
Family Cites Families (15)
| Publication number | Priority date | Publication date | Assignee | Title |
|---|---|---|---|---|
| US7389204B2 (en) * | 2001-03-01 | 2008-06-17 | Fisher-Rosemount Systems, Inc. | Data presentation system for abnormal situation prevention in a process plant |
| GB0111215D0 (en) * | 2001-05-08 | 2001-06-27 | Curvaceous Software Ltd | Multi-variable process |
| DE102009051446B4 (de) * | 2009-10-30 | 2014-11-27 | Abb Technology Ag | Verfahren und Vorrichtung zur Überwachung eines Prozesses und/oder einer technischen Anlage |
| US9355477B2 (en) * | 2011-06-28 | 2016-05-31 | Honeywell International Inc. | Historical alarm analysis apparatus and method |
| US20130100136A1 (en) | 2011-10-24 | 2013-04-25 | Kim Ordean Van Camp | Sparkline presentations of process control system alarms |
| EP2706488A1 (fr) * | 2012-09-06 | 2014-03-12 | Siemens Aktiengesellschaft | Procédé et système de manipulation d'historique de paramètres de production par lots dans une planification de production ANSI/ISA/95 étendue correspondante |
| CN103869121B (zh) * | 2012-12-14 | 2017-11-28 | 北京普源精电科技有限公司 | 一种波形显示装置及方法 |
| JP6445859B2 (ja) * | 2014-12-16 | 2018-12-26 | 株式会社東芝 | プラント監視装置 |
| US10360249B2 (en) * | 2015-04-10 | 2019-07-23 | Trendminder N.V. | System and method for creation and detection of process fingerprints for monitoring in a process plant |
| EP3264208B1 (fr) * | 2016-06-30 | 2021-01-06 | Siemens Aktiengesellschaft | Procede d'actualisation d'objets de processus dans un systeme d'ingenierie |
| CN107094093A (zh) * | 2017-04-13 | 2017-08-25 | 北京网瑞达科技有限公司 | 网络系统中的网络设备周期性的性能指标数据预测方法 |
| DE102017219549A1 (de) * | 2017-11-03 | 2019-05-09 | Volkswagen Aktiengesellschaft | Verfahren zur Zustandsüberwachung einer Fertigungsanlage |
| EP3480672B1 (fr) * | 2017-11-06 | 2020-02-19 | Siemens Aktiengesellschaft | Procédé de détection et d'affichage d'accès d'opérateur à des objets de traitement ainsi que système d'exploitation |
| CN109034662B (zh) * | 2018-08-31 | 2022-03-25 | 东北大学 | 一种基于工艺流程的生产指标可视化监控系统及方法 |
| CN109639524A (zh) * | 2018-12-13 | 2019-04-16 | 国网上海市电力公司 | 基于流量预测的通信网络数据可视化方法、装置及设备 |
-
2019
- 2019-09-23 EP EP19198967.2A patent/EP3796119A1/fr not_active Withdrawn
-
2020
- 2020-09-16 US US17/762,561 patent/US11892831B2/en active Active
- 2020-09-16 EP EP20780962.5A patent/EP4018276B1/fr active Active
- 2020-09-16 WO PCT/EP2020/075820 patent/WO2021058344A1/fr not_active Ceased
- 2020-09-16 CN CN202080066354.XA patent/CN114424133B/zh active Active
Also Published As
| Publication number | Publication date |
|---|---|
| EP3796119A1 (fr) | 2021-03-24 |
| CN114424133B (zh) | 2025-03-21 |
| EP4018276C0 (fr) | 2024-11-20 |
| US11892831B2 (en) | 2024-02-06 |
| CN114424133A (zh) | 2022-04-29 |
| US20220342409A1 (en) | 2022-10-27 |
| EP4018276A1 (fr) | 2022-06-29 |
| WO2021058344A1 (fr) | 2021-04-01 |
Similar Documents
| Publication | Publication Date | Title |
|---|---|---|
| DE112007003612B4 (de) | Prozesskontrollsystem mit einem Alarmanalysesystem und Verfahren zur Bereitstellung von Statistiken über Alarme von einem Prozesskontrollsystem, Computerprogrammprodukt und computerlesbares Medium | |
| EP3690580B1 (fr) | Visualisation simultanée de données de processus et d'alarmes | |
| DE102012110132A1 (de) | Sparkline-Darstellungen von Prozessleitsystem-Alarmen | |
| DE10241746B4 (de) | Verfahren zur zyklischen Qualitätsbewertung und Prozessüberwachung bei periodischen Produktionsprozessen | |
| EP2250538B1 (fr) | Procédé d'affichage visuel de la qualité de l'énergie transmise sur une installation de transmission d'énergie | |
| EP3056957B1 (fr) | Procédé et dispositif de diagnostic destinés à la surveillance du fonctionnement d'un circuit régulateur | |
| EP2638444B1 (fr) | Visualisation intelligente dans la surveillance de grandeurs de processus et/ou d'installations | |
| EP4018276B1 (fr) | Affichage avancé de tendance des données de processus et des alarmes secondaires | |
| DE102016123235A1 (de) | Betriebsverwaltungssystem zum direkten anzeigen eines arbeitsbefehls auf basis einer betriebsverwaltungsinformation an einer werkzeugmaschine | |
| DE102014016180B4 (de) | Verfahren und Einrichtung zur Verwaltung und Konfiguration von Feldgeräten einer Automatisierungsanlage | |
| EP4370986B1 (fr) | Système de commande pour une installation technique à des vues réduites des images de l'installation | |
| EP3913445A1 (fr) | Affichage provoqué par un alarme de diagrammes d'évolution de tendance dans le contexte d'un fonctionnement et d'une surveillance d'une installation technique | |
| AT522639B1 (de) | Vorrichtung und Verfahren zum Visualisieren oder Beurteilen eines Prozesszustandes | |
| EP4092502A1 (fr) | Système de guidage pour une installation technique ayant un diagramme de courbe de tendance | |
| EP3785091B1 (fr) | Procédé de fabrication automatique de signatures marquées | |
| EP3454154A1 (fr) | Détection automatique des dépendances statistiques entre les messages du processus | |
| EP2450846A1 (fr) | Procédé et dispositif destinés à la sélection de types d'acier | |
| EP3715987A1 (fr) | Procédé et système de gestion de messages dans un système d'automatisation | |
| DE102010011873A1 (de) | Verfahren und Vorrichtung zur Bedienung von softwaregesteuerten Geräten | |
| EP3776117B1 (fr) | Analyse complète de perturbations de dispositifs de commande et d'installations techniques industrielles | |
| EP1708056B1 (fr) | Attribution dynamique des télégrammes d'alarme pour escalade des alarmes | |
| EP4660729A1 (fr) | Analyse informatisée du temps de cycle et/ou de la disponibilité de processus commandés par recette dans des installations de production chimique | |
| EP3701341B1 (fr) | Procédé de traitement assisté par ordinateur de paramètres de fonctionnement d'un système technique | |
| EP4607303A1 (fr) | Affichage de courbes de tendance critiques pendant la commande et l'observation | |
| DE102015008752A1 (de) | Verfahren zum Betreiben eines Produktionsleittechniksystems |
Legal Events
| Date | Code | Title | Description |
|---|---|---|---|
| STAA | Information on the status of an ep patent application or granted ep patent |
Free format text: STATUS: UNKNOWN |
|
| STAA | Information on the status of an ep patent application or granted ep patent |
Free format text: STATUS: THE INTERNATIONAL PUBLICATION HAS BEEN MADE |
|
| PUAI | Public reference made under article 153(3) epc to a published international application that has entered the european phase |
Free format text: ORIGINAL CODE: 0009012 |
|
| STAA | Information on the status of an ep patent application or granted ep patent |
Free format text: STATUS: REQUEST FOR EXAMINATION WAS MADE |
|
| 17P | Request for examination filed |
Effective date: 20220322 |
|
| AK | Designated contracting states |
Kind code of ref document: A1 Designated state(s): AL AT BE BG CH CY CZ DE DK EE ES FI FR GB GR HR HU IE IS IT LI LT LU LV MC MK MT NL NO PL PT RO RS SE SI SK SM TR |
|
| DAV | Request for validation of the european patent (deleted) | ||
| DAX | Request for extension of the european patent (deleted) | ||
| GRAP | Despatch of communication of intention to grant a patent |
Free format text: ORIGINAL CODE: EPIDOSNIGR1 |
|
| STAA | Information on the status of an ep patent application or granted ep patent |
Free format text: STATUS: GRANT OF PATENT IS INTENDED |
|
| INTG | Intention to grant announced |
Effective date: 20240801 |
|
| GRAS | Grant fee paid |
Free format text: ORIGINAL CODE: EPIDOSNIGR3 |
|
| GRAA | (expected) grant |
Free format text: ORIGINAL CODE: 0009210 |
|
| STAA | Information on the status of an ep patent application or granted ep patent |
Free format text: STATUS: THE PATENT HAS BEEN GRANTED |
|
| AK | Designated contracting states |
Kind code of ref document: B1 Designated state(s): AL AT BE BG CH CY CZ DE DK EE ES FI FR GB GR HR HU IE IS IT LI LT LU LV MC MK MT NL NO PL PT RO RS SE SI SK SM TR |
|
| REG | Reference to a national code |
Ref country code: GB Ref legal event code: FG4D Free format text: NOT ENGLISH |
|
| REG | Reference to a national code |
Ref country code: CH Ref legal event code: EP |
|
| REG | Reference to a national code |
Ref country code: DE Ref legal event code: R096 Ref document number: 502020009801 Country of ref document: DE |
|
| REG | Reference to a national code |
Ref country code: IE Ref legal event code: FG4D Free format text: LANGUAGE OF EP DOCUMENT: GERMAN |
|
| U01 | Request for unitary effect filed |
Effective date: 20241126 |
|
| U07 | Unitary effect registered |
Designated state(s): AT BE BG DE DK EE FI FR IT LT LU LV MT NL PT RO SE SI Effective date: 20241202 |
|
| PG25 | Lapsed in a contracting state [announced via postgrant information from national office to epo] |
Ref country code: HR Free format text: LAPSE BECAUSE OF FAILURE TO SUBMIT A TRANSLATION OF THE DESCRIPTION OR TO PAY THE FEE WITHIN THE PRESCRIBED TIME-LIMIT Effective date: 20241120 Ref country code: IS Free format text: LAPSE BECAUSE OF FAILURE TO SUBMIT A TRANSLATION OF THE DESCRIPTION OR TO PAY THE FEE WITHIN THE PRESCRIBED TIME-LIMIT Effective date: 20250320 |
|
| PG25 | Lapsed in a contracting state [announced via postgrant information from national office to epo] |
Ref country code: ES Free format text: LAPSE BECAUSE OF FAILURE TO SUBMIT A TRANSLATION OF THE DESCRIPTION OR TO PAY THE FEE WITHIN THE PRESCRIBED TIME-LIMIT Effective date: 20241120 |
|
| PG25 | Lapsed in a contracting state [announced via postgrant information from national office to epo] |
Ref country code: NO Free format text: LAPSE BECAUSE OF FAILURE TO SUBMIT A TRANSLATION OF THE DESCRIPTION OR TO PAY THE FEE WITHIN THE PRESCRIBED TIME-LIMIT Effective date: 20250220 |
|
| PG25 | Lapsed in a contracting state [announced via postgrant information from national office to epo] |
Ref country code: GR Free format text: LAPSE BECAUSE OF FAILURE TO SUBMIT A TRANSLATION OF THE DESCRIPTION OR TO PAY THE FEE WITHIN THE PRESCRIBED TIME-LIMIT Effective date: 20250221 |
|
| PG25 | Lapsed in a contracting state [announced via postgrant information from national office to epo] |
Ref country code: PL Free format text: LAPSE BECAUSE OF FAILURE TO SUBMIT A TRANSLATION OF THE DESCRIPTION OR TO PAY THE FEE WITHIN THE PRESCRIBED TIME-LIMIT Effective date: 20241120 |
|
| PG25 | Lapsed in a contracting state [announced via postgrant information from national office to epo] |
Ref country code: RS Free format text: LAPSE BECAUSE OF FAILURE TO SUBMIT A TRANSLATION OF THE DESCRIPTION OR TO PAY THE FEE WITHIN THE PRESCRIBED TIME-LIMIT Effective date: 20250220 |
|
| PG25 | Lapsed in a contracting state [announced via postgrant information from national office to epo] |
Ref country code: SM Free format text: LAPSE BECAUSE OF FAILURE TO SUBMIT A TRANSLATION OF THE DESCRIPTION OR TO PAY THE FEE WITHIN THE PRESCRIBED TIME-LIMIT Effective date: 20241120 |
|
| PG25 | Lapsed in a contracting state [announced via postgrant information from national office to epo] |
Ref country code: SK Free format text: LAPSE BECAUSE OF FAILURE TO SUBMIT A TRANSLATION OF THE DESCRIPTION OR TO PAY THE FEE WITHIN THE PRESCRIBED TIME-LIMIT Effective date: 20241120 |
|
| PG25 | Lapsed in a contracting state [announced via postgrant information from national office to epo] |
Ref country code: CZ Free format text: LAPSE BECAUSE OF FAILURE TO SUBMIT A TRANSLATION OF THE DESCRIPTION OR TO PAY THE FEE WITHIN THE PRESCRIBED TIME-LIMIT Effective date: 20241120 |
|
| PLBE | No opposition filed within time limit |
Free format text: ORIGINAL CODE: 0009261 |
|
| STAA | Information on the status of an ep patent application or granted ep patent |
Free format text: STATUS: NO OPPOSITION FILED WITHIN TIME LIMIT |
|
| 26N | No opposition filed |
Effective date: 20250821 |
|
| U20 | Renewal fee for the european patent with unitary effect paid |
Year of fee payment: 6 Effective date: 20250919 |
|
| PGFP | Annual fee paid to national office [announced via postgrant information from national office to epo] |
Ref country code: GB Payment date: 20251002 Year of fee payment: 6 |
|
| REG | Reference to a national code |
Ref country code: CH Ref legal event code: H13 Free format text: ST27 STATUS EVENT CODE: U-0-0-H10-H13 (AS PROVIDED BY THE NATIONAL OFFICE) Effective date: 20260425 |