EP4033700A1 - Verfahren und gerät zum analysieren der wirklichen ursache bei ausfall eines kommunikationssystems, system und computerspeichermedium - Google Patents
Verfahren und gerät zum analysieren der wirklichen ursache bei ausfall eines kommunikationssystems, system und computerspeichermedium Download PDFInfo
- Publication number
- EP4033700A1 EP4033700A1 EP20877967.8A EP20877967A EP4033700A1 EP 4033700 A1 EP4033700 A1 EP 4033700A1 EP 20877967 A EP20877967 A EP 20877967A EP 4033700 A1 EP4033700 A1 EP 4033700A1
- Authority
- EP
- European Patent Office
- Prior art keywords
- variable
- communication system
- real
- variables
- observed
- Prior art date
- Legal status (The legal status is an assumption and is not a legal conclusion. Google has not performed a legal analysis and makes no representation as to the accuracy of the status listed.)
- Pending
Links
Images


Classifications
-
- H—ELECTRICITY
- H04—ELECTRIC COMMUNICATION TECHNIQUE
- H04L—TRANSMISSION OF DIGITAL INFORMATION, e.g. TELEGRAPHIC COMMUNICATION
- H04L41/00—Arrangements for maintenance, administration or management of data switching networks, e.g. of packet switching networks
- H04L41/06—Management of faults, events, alarms or notifications
- H04L41/0631—Management of faults, events, alarms or notifications using root cause analysis; using analysis of correlation between notifications, alarms or events based on decision criteria, e.g. hierarchy, tree or time analysis
-
- H—ELECTRICITY
- H04—ELECTRIC COMMUNICATION TECHNIQUE
- H04L—TRANSMISSION OF DIGITAL INFORMATION, e.g. TELEGRAPHIC COMMUNICATION
- H04L41/00—Arrangements for maintenance, administration or management of data switching networks, e.g. of packet switching networks
- H04L41/06—Management of faults, events, alarms or notifications
- H04L41/0631—Management of faults, events, alarms or notifications using root cause analysis; using analysis of correlation between notifications, alarms or events based on decision criteria, e.g. hierarchy, tree or time analysis
- H04L41/064—Management of faults, events, alarms or notifications using root cause analysis; using analysis of correlation between notifications, alarms or events based on decision criteria, e.g. hierarchy, tree or time analysis involving time analysis
-
- H—ELECTRICITY
- H04—ELECTRIC COMMUNICATION TECHNIQUE
- H04L—TRANSMISSION OF DIGITAL INFORMATION, e.g. TELEGRAPHIC COMMUNICATION
- H04L41/00—Arrangements for maintenance, administration or management of data switching networks, e.g. of packet switching networks
- H04L41/14—Network analysis or design
- H04L41/145—Network analysis or design involving simulating, designing, planning or modelling of a network
-
- H—ELECTRICITY
- H04—ELECTRIC COMMUNICATION TECHNIQUE
- H04L—TRANSMISSION OF DIGITAL INFORMATION, e.g. TELEGRAPHIC COMMUNICATION
- H04L41/00—Arrangements for maintenance, administration or management of data switching networks, e.g. of packet switching networks
- H04L41/14—Network analysis or design
- H04L41/147—Network analysis or design for predicting network behaviour
-
- H—ELECTRICITY
- H04—ELECTRIC COMMUNICATION TECHNIQUE
- H04L—TRANSMISSION OF DIGITAL INFORMATION, e.g. TELEGRAPHIC COMMUNICATION
- H04L41/00—Arrangements for maintenance, administration or management of data switching networks, e.g. of packet switching networks
- H04L41/50—Network service management, e.g. ensuring proper service fulfilment according to agreements
- H04L41/5003—Managing SLA; Interaction between SLA and QoS
- H04L41/5009—Determining service level performance parameters or violations of service level contracts, e.g. violations of agreed response time or mean time between failures [MTBF]
-
- H—ELECTRICITY
- H04—ELECTRIC COMMUNICATION TECHNIQUE
- H04L—TRANSMISSION OF DIGITAL INFORMATION, e.g. TELEGRAPHIC COMMUNICATION
- H04L43/00—Arrangements for monitoring or testing data switching networks
- H04L43/04—Processing captured monitoring data, e.g. for logfile generation
- H04L43/045—Processing captured monitoring data, e.g. for logfile generation for graphical visualisation of monitoring data
-
- H—ELECTRICITY
- H04—ELECTRIC COMMUNICATION TECHNIQUE
- H04L—TRANSMISSION OF DIGITAL INFORMATION, e.g. TELEGRAPHIC COMMUNICATION
- H04L43/00—Arrangements for monitoring or testing data switching networks
- H04L43/08—Monitoring or testing based on specific metrics, e.g. QoS, energy consumption or environmental parameters
- H04L43/091—Measuring contribution of individual network components to actual service level
Definitions
- the present disclosure relates to the field of communication, and in particular to a method for analyzing root cause of a failure of a communication system, a device for analyzing root cause of a failure of a communication system, a system for performing the method for analyzing root cause of a failure, and a computer-readable storage medium.
- KPI Key Performance Indicator
- the present disclosure provides a method for analyzing root cause of a failure of a communication system, a device for analyzing root cause of a failure of a communication system, a system for performing the method for analyzing root cause of a failure, and a computer-readable storage medium. It is possible to effectively find out the cause of the degradation in performance of the communication system by means of the method for analyzing root cause of a failure.
- a method for analyzing root cause of a failure in a communication system including, acquiring a real-time value of a target KPI variable of a communication system and a real-time value of each of a plurality of observed variables of the communication system; inputting each real-time value of each of the plurality of observed variables into a prediction model, to generate a predicted value of the target KPI variable, wherein the prediction model is generated through training of history data of the communication system by a predetermined algorithm; performing a comparison on the generated predicted value of the target KPI variable with the real-time value of the target KPI variable; in response to a determination that deterioration in performance of the communication system occurs, calculating contribution of each observed variable to resulted deterioration in performance of the system, wherein the deterioration in performance of the communication system satisfies at least following predetermined condition, a difference between a predicted value of the target KPI variable and a real-time value of the target KPI variable exceeds
- a system for performing root cause analysis on a communication system including, an offline device storing a prediction model for predicting KPI variables obtained by training of history data of the communication system with a predetermined algorithm; and on line device configured to, perform a real-time monitoring on a KPI variable of the communication system to generate a real-time KPI variable; perform a comparison on the predicted KPI variable output by the prediction model with the real-time KPI variable; in response to a determination that deterioration in performance of the communication system occurs, calculate contribution of each observed variable to deterioration of the real-time KPI variable, wherein the deterioration in performance of the communication system satisfies at least following predetermined condition, a difference between the predicted KPI variable and the real-time KPI variable exceeds a predetermined value; and select top K places of cause variables from a list of contributions of the observed variable ranked by their values in descending order, as candidate root cause variables of the degradation in the real-time KPI variable, where K
- a computer-readable storage medium storing an executable program thereon, which when executed by a processor, causes the processor to carry out the above-mentioned method for analyzing root cause of a failure.
- a device for analyzing root cause of a failure of a communication system including a processor, and a memory storing an executable program thereon, which when executed by the processor, causes the processor to carry out the above-mentioned method for analyzing root cause of a failure.
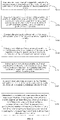
- the method for analyzing root cause of a failure includes following operations.
- a real-time value of a target KPI variable of a communication system and a real-time value of each of a plurality of observed variables of the communication system are acquired.
- each real-time value of each of the plurality of observed variables is input into a prediction model, to generate a predicted value of the target KPI variable, wherein the prediction model is generated through training of history data of the communication system by a predetermined algorithm.
- the generated predicted value of the target KPI variable is compared with the real-time value of the target KPI variable.
- contribution of each observed variable to the deterioration in performance of the system is calculated in response to a determination that deterioration in performance of the communication system occurs, wherein the deterioration in performance of the communication system satisfies at least the following predetermined condition: a difference between a predicted value of the target KPI variable and a real-time value of the target KPI variable exceeds a predetermined value.
- top K places of cause variables in a list of contributions of the observed variable ranked by their values in descending order are selected as candidate root cause variables of degradation in performance of the communication system, where K is a positive integer.
- a real-time value of a target KPI variable and a real-time value of each of a plurality of observed variables may be generated by real-time monitoring of the communication system.
- a monitoring device may be used to monitor a communication system in real time, and then a real-time value of a target KPI variable, and a real-time value of each of a plurality of observed variables may be obtained through communication between the monitoring device and a device that performs a method for analyzing root cause of a failure.
- an operating state of a communication system is monitored online to obtain a real-time value of a target KPI variable and a real-time value of each of a plurality of observed variables.
- a period for collecting the real-time value of the target KPI variable and a period for collecting the real-time value of each observed variable are collected at a time interval T.
- the method for analyzing a root cause of a failure would benefit from a smaller time interval T for a more accurate result.
- the time interval T may be set to 15 minutes for a tradeoff between an amount of calculation and accuracy.
- the history data of the communication system refers to data obtained before the communication system is updated, including the history values of a target KPI variable and the history values of the observed variables before the communication system is updated. Also, it is necessary to make sure that the communication system is operating properly before the update.
- the predetermined algorithm includes a partial least squares (PLS) algorithm.
- PLS partial least squares
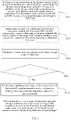
- the method for analyzing a root cause of a failure may further include following operations subsequent to S150, in order to determine the root cause of the failure more accurately.
- a real-time value of each observed variable is monitored, and a determination as to whether or not each real-time value exceeds a predetermined control limit.
- K candidate root cause variables are determined as the final root cause variables, in response to, a determination that the number of times that a real-time value of each candidate root cause variable exceeding a corresponding control limit is greater than a predetermined number of times and/or the time when a real-time value of each candidate root cause variable exceeding the corresponding control limit is earlier than other observed variables.
- control limit of each observed variable in the present disclosure it is not intended to limit the control limit of each observed variable in the present disclosure, while the control limit can set by a technician based on his/her experience. It is apparent that, the final root cause variables are also for reference by technicians.
- K is not intended to specifically limit a value of K in the present disclosure while the value of K can be set by a technician as needed.
- the method for analyzing a root cause of a failure may include following operations for a more accurate prediction.
- a statistic is constructed, and operating status of a communication system is monitored online, where the deterioration in performance of the communication system further includes a deviation of the statistic of the communication system (denoted as T 2 ) from a threshold for the statistic (denoted as T 2 / imit ) of the communication system.
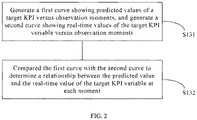
- S130 may include following operations as shown in FIG. 2 , in order to provide to maintenance personnel, a fast and visual comparison between a predicted value and a real-time value of a target KPI variable.
- a first curve showing predicted values of a target KPI versus observation moments is generated, and a second curve showing real-time values of the target KPI variable versus observation moments is generated.
- the first curve is compared with the second curve to determine a relationship between the predicted value and the real-time value of the target KPI variable at each moment.
- a momentary contribution of each observed variable at each observation moment within a predetermined period is calculated.
- a cumulative contribution of each observed variable within a predetermined period is calculated.
- An observed variable whose cumulative contribution exceeds a second predetermined contribution within the predetermined period, is determined.
- the observed variables having the number of times that a momentary contribution exceeding the first predetermined contribution being greater than a predetermined number of times, while having a cumulative contribution exceeding the second predetermined contribution, are sorted.
- both the momentary contribution of each observed variable and the total contribution of the observed variable are taken into account, so that the contribution of each observed variable can be sorted objectively.
- a prediction model is constructed through a PLS algorithm.
- construction of the prediction model include:
- the most relevant observed variable to the target KPI variable can be automatically selected from a large number of observed variables, as input data of a PLS algorithm, thereby reducing the amount of calculation during construction of a prediction model.
- the inventor of the present application found that most of the effective observed variables of a communication system (that is, the observed variables most related to the target KPI variable) have significant linear correlation characteristics. That is, the communication system is a linear system in which more than a second predetermined percentage (denoted as D%) of effective variables have linear correlation characteristics.
- the first predetermined percentage is no more than the second predetermined percentage (i.e., E ⁇ D). In some embodiments, the first predetermined percentage E% is ranged from 50% to 70%, and the second predetermined percentage D% is ranged from 70% to 90%.
- the PLS algorithm is especially suitable for prediction of a linear system. Therefore, in some embodiments, it is possible to first analyze and determine whether a communication system is a linear system, during construction of a prediction model, in order to improve the accuracy of the prediction. S230 would not be performed unless it is determined that the communication system is a linear system. Specifically, construction of a prediction model further includes the following operations prior to S230.
- a correlation coefficient between each observed variable and the target KPI variable is determined respectively based on the cross-correlation between the history values of the target KPI variable and the history values of a respective one of a plurality of observed variables.
- a threshold for the correlation coefficient is calculated through a significance test.
- the communication system is determined as a linear system, then S230 is performed.
- the communication system is determined as a non-linear system.
- another prediction model may be constructed with some other algorithms.
- calculation of the correlation coefficient between each observed variable and the target KPI variable includes following operations.
- a correlation coefficient matrix P between the KPI variable and other observed variables and a delay matrix L are calculated through the cross-correlation. That is, a delay l ( l ⁇ Z) is introduced for two statistical sequences x i and x j , where
- a threshold for the correlation coefficient is calculated through a significance test in which a statistic T is constructed to obtain the threshold for the correlation coefficient po.
- D is ranged from 70%-90%.
- the variables with the correlation coefficient in the top E% are selected from a large number of observed variables, as the input of PLS model, where E ⁇ D.
- E is ranged from 50% to 70%.
- T [ t 1 , t 2 ,..., x A ] ⁇ R N ⁇ A is a score matrix;
- a statistic T 2 is constructed for monitoring of the operating status of a communication system online.
- Each real-time value of the observed variable is input into the above prediction model to generate a prediction variable of a target KPI.
- RBC Reconstruction Based Contribution
- the system includes an offline device 110 and an on line device 120.
- a prediction model for predicting KPI variables obtained by training of history data of the communication system with a predetermined algorithm, is stored in the offline device 110.
- the on line device 120 is configured to perform the following operations.
- Real-time monitoring is performed on a KPI variable of the communication system to generate a real-time KPI variable.
- a comparison is performed on the predicted KPI variable output by the prediction model with the real-time KPI variable.
- Contribution of each observed variable to deterioration of the real-time KPI variable is calculated in response to a determination that deterioration in performance of the communication system occurs, wherein the deterioration in performance of the communication system satisfies at least the following predetermined condition: a difference between the predicted KPI variable and the real-time KPI variable exceeds a predetermined value.
- Top K places of cause variables in a list of contributions of the observed variable ranked by their values in descending order, are selected as candidate root cause variables of the degradation in the real-time KPI variable, where K is a positive integer.
- the prediction model is constructed by the off line device 110 can with the following operations.
- a cross-correlation is performed on the history values of the target KPI variable of a communication system with the history values of each of a plurality of observed variables, in the history data of the communication system, such that an observed variable whose correlation with the history values of the target KPI variable exceeding a first predetermined percentage is identified, and the history values of the observed variable are selected as input variables.
- the input variables are used as input data, the history values of the target KPI variable are used as predictive data, and training is performed with a predetermined algorithm to obtain the prediction model.
- the predetermined algorithm is a PLS algorithm.
- a computer-readable storage medium storing an executable program thereon, which when executed by a processor, causes the processor to carry out the above-mentioned method for analyzing root cause of a failure according to the present disclosure.
- the device includes a processor 901, and a memory 902 storing an executable program thereon, which when executed by the processor 901, causes the processor 901 to carry out the above-mentioned method for analyzing root cause of a failure according to the present disclosure.
- the computer-readable storage media includes volatile and nonvolatile, removable and non-removable media implemented in any method or technology for storing information such as computer-readable instructions, data structures, program modules or other data.
- the computer-readable storage media include, but are not limited to, RAM, ROM, EEPROM, flash memory or other memory technologies, CD-ROM, digital versatile disks (DVD) or other optical disk storage, magnetic boxes, tapes, magnetic disk storage or other magnetic storage media, or any other media that can be used to store desired information and can be accessed by a computer.
- the sampling interval for the observed data is 15 minutes, and data of a total of 10 days under a normal operating condition are collected. 92 observed variable sequences and 1 KPI variable sequence are generated with blank data sequence and constant data sequence removed.
- Cross-correlation analysis shows that the correlation threshold for a statistic T is 0.24, and 89 out of 92 variables exceed the correlation threshold, thus it can be considered that the system satisfied linear characteristics.
- a prediction model for the target KPI is established by a PLS algorithm.
- a monitoring indicator T 2 is constructed for real-time monitoring of the system.
- FIG. 5 The result of real-time monitoring is shown in FIG. 5 , with data of 10 days normal operation before upgrading, and data of 7 days after upgrading.
- X-coordinate of FIG. 5 represents a time sequence, in which, number 500 represents the 500th data collected in the time sequence, number 1000 represents the 1000th data collected in the time sequence, and number 1500 represents the 1500th data collected in time sequence.
- Y-coordinate represents values of the target KPI.
- the indicator line 1 is a line of predictive data in performance
- the indicator line 2 is a line for real-time data in performance. It is noted that deterioration in performance of the upgraded system occurs from 960th sampled data, as reflected in predictive data. As shown in FIG.
- the monitoring indicator T 2 (that is, statistic T 2 ) exceeds the control limit.
- X-coordinate of FIG. 6 represents a time sequence, in which, number 500 represents the 500th data collected in the time sequence, number 1000 represents the 1000th data collected in the time sequence, and number 1500 represents the 1500th data collected in time sequence.
- Y-coordinate represents statistical values of the target KPI.
- the horizontal line in the chart area is the control limit of the statistic T 2
- the curve is the monitoring value of the T 2 indicator).
- a one-day duration is taken for analysis, that is, 96 sampled data is taken.
- top five i.e., K equals to 5 in this case
- observed variables with the highest cumulative contribution are given by the system for performing root cause analysis, they are variables No. 18, No. 27, No. 19, No. 42 and No. 79.
- variable No. 18 has the highest cumulative contribution, and thus, variable No. 18 is considered to be the root cause of the failure.
- analysis is performed on the contribution for each variable separately. An alarm is raised each time when a contribution exceeds a control limit.
- variable No. 18 has the greatest number of alarms, and variable No. 18 initiated an alarm first, and thus it can be considered that variable No. 18 causes propagation of the failure.
- predicted values of a target KPI can be generated by construction of a prediction model. It is possible to have a fast determination as to whether or not a failure occurs to a communication system, through a comparison of a predicted value of a target KPI variable with a real-time value of the target KPI variable. Then, it is possible to have a fast determination on the root cause of the failure that causes deterioration in the performance of the communication system, through a calculation of the contribution of each observed variable to the deterioration of the target KPI variable, without manual troubleshooting, thus improving the efficiency of the root cause analysis of the failure.
Landscapes
- Engineering & Computer Science (AREA)
- Computer Networks & Wireless Communication (AREA)
- Signal Processing (AREA)
- Data Exchanges In Wide-Area Networks (AREA)
- Debugging And Monitoring (AREA)
- Telephonic Communication Services (AREA)
Applications Claiming Priority (2)
| Application Number | Priority Date | Filing Date | Title |
|---|---|---|---|
| CN201910975121.0A CN110635952B (zh) | 2019-10-14 | 2019-10-14 | 通信系统的故障根因分析方法、系统和计算机存储介质 |
| PCT/CN2020/115602 WO2021073343A1 (zh) | 2019-10-14 | 2020-09-16 | 通信系统的故障根因分析方法、装置、系统和计算机存储介质 |
Publications (2)
| Publication Number | Publication Date |
|---|---|
| EP4033700A1 true EP4033700A1 (de) | 2022-07-27 |
| EP4033700A4 EP4033700A4 (de) | 2022-11-30 |
Family
ID=68974878
Family Applications (1)
| Application Number | Title | Priority Date | Filing Date |
|---|---|---|---|
| EP20877967.8A Pending EP4033700A4 (de) | 2019-10-14 | 2020-09-16 | Verfahren und gerät zum analysieren der wirklichen ursache bei ausfall eines kommunikationssystems, system und computerspeichermedium |
Country Status (3)
| Country | Link |
|---|---|
| EP (1) | EP4033700A4 (de) |
| CN (1) | CN110635952B (de) |
| WO (1) | WO2021073343A1 (de) |
Families Citing this family (14)
| Publication number | Priority date | Publication date | Assignee | Title |
|---|---|---|---|---|
| CN110635952B (zh) * | 2019-10-14 | 2021-03-16 | 中兴通讯股份有限公司 | 通信系统的故障根因分析方法、系统和计算机存储介质 |
| CN110888755B (zh) * | 2019-11-15 | 2023-04-11 | 亚信科技(中国)有限公司 | 一种微服务系统异常根因节点的查找方法及装置 |
| CN111338921A (zh) * | 2020-02-21 | 2020-06-26 | 深圳壹账通智能科技有限公司 | 一种系统性能预测方法、装置、计算机设备和存储介质 |
| CN113422690A (zh) * | 2020-03-02 | 2021-09-21 | 烽火通信科技股份有限公司 | 一种业务质量劣化预测方法及系统 |
| CN113518373B (zh) | 2020-04-10 | 2025-12-30 | 中兴通讯股份有限公司 | 识别问题小区的方法、电子设备、计算机可读介质 |
| CN113556258B (zh) * | 2020-04-24 | 2022-12-27 | 西安华为技术有限公司 | 一种异常检测方法及装置 |
| CN111865407B (zh) * | 2020-06-11 | 2021-11-30 | 烽火通信科技股份有限公司 | 光通道性能劣化智能预警方法、装置、设备及存储介质 |
| CN114154770B (zh) * | 2020-09-08 | 2026-01-06 | 中国移动通信有限公司研究院 | 一种指标根因分析方法、装置及设备 |
| CN112087334B (zh) * | 2020-09-09 | 2022-10-18 | 中移(杭州)信息技术有限公司 | 告警根因分析方法、电子设备和存储介质 |
| CN114723197B (zh) * | 2021-01-04 | 2025-05-13 | 中国移动通信有限公司研究院 | 一种故障根因定位方法、装置及电子设备 |
| CN112929363B (zh) * | 2021-02-04 | 2022-05-17 | 北京字跳网络技术有限公司 | 视频领域性能参数异常的根因分析方法及设备 |
| CN113282884B (zh) * | 2021-04-28 | 2023-09-26 | 沈阳航空航天大学 | 通用根因分析方法 |
| US12530815B2 (en) | 2021-08-12 | 2026-01-20 | Nokia Technologies Oy | Method, apparatus and computer program |
| CN116956195B (zh) * | 2023-08-02 | 2025-12-19 | 安特仪表集团有限公司 | 电能表数据冻结处理方法、装置、电子设备及存储介质 |
Family Cites Families (10)
| Publication number | Priority date | Publication date | Assignee | Title |
|---|---|---|---|---|
| US9075713B2 (en) * | 2012-05-24 | 2015-07-07 | Mitsubishi Electric Research Laboratories, Inc. | Method for detecting anomalies in multivariate time series data |
| US9401851B2 (en) * | 2014-03-28 | 2016-07-26 | Verizon Patent And Licensing Inc. | Network management system |
| CN104537260B (zh) * | 2015-01-14 | 2018-02-09 | 清华大学 | 基于缓慢特征回归的动态软测量方法和系统 |
| US10031510B2 (en) * | 2015-05-01 | 2018-07-24 | Aspen Technology, Inc. | Computer system and method for causality analysis using hybrid first-principles and inferential model |
| US20170364819A1 (en) * | 2016-06-17 | 2017-12-21 | Futurewei Technologies, Inc. | Root cause analysis in a communication network via probabilistic network structure |
| EP3590228B1 (de) * | 2017-03-01 | 2025-07-16 | Telefonaktiebolaget LM Ericsson (Publ) | Verfahren und vorrichtung zur vorhersage von leistungskennzahlen unter verwendung von künstlichem leben |
| CN109063886B (zh) * | 2018-06-12 | 2022-05-31 | 创新先进技术有限公司 | 一种异常检测方法、装置以及设备 |
| CN109710983B (zh) * | 2018-12-04 | 2020-11-27 | 北京大学 | 一种基于关键性能指标的柴油机气缸分层故障诊断方法 |
| CN109884892B (zh) * | 2019-02-28 | 2022-08-02 | 杭州电子科技大学 | 基于交叉相关时滞灰色关联分析的流程工业系统预测模型 |
| CN110635952B (zh) * | 2019-10-14 | 2021-03-16 | 中兴通讯股份有限公司 | 通信系统的故障根因分析方法、系统和计算机存储介质 |
-
2019
- 2019-10-14 CN CN201910975121.0A patent/CN110635952B/zh active Active
-
2020
- 2020-09-16 WO PCT/CN2020/115602 patent/WO2021073343A1/zh not_active Ceased
- 2020-09-16 EP EP20877967.8A patent/EP4033700A4/de active Pending
Also Published As
| Publication number | Publication date |
|---|---|
| EP4033700A4 (de) | 2022-11-30 |
| CN110635952A (zh) | 2019-12-31 |
| CN110635952B (zh) | 2021-03-16 |
| WO2021073343A1 (zh) | 2021-04-22 |
Similar Documents
| Publication | Publication Date | Title |
|---|---|---|
| EP4033700A1 (de) | Verfahren und gerät zum analysieren der wirklichen ursache bei ausfall eines kommunikationssystems, system und computerspeichermedium | |
| Hu et al. | Predictive maintenance of systems subject to hard failure based on proportional hazards model | |
| Jouin et al. | Prognostics of PEM fuel cell in a particle filtering framework | |
| CN110084271B (zh) | 一种图片类别的识别方法和装置 | |
| CN106951984B (zh) | 一种系统健康度动态分析预测方法及装置 | |
| CN106886481B (zh) | 一种系统健康度静态分析预测方法及装置 | |
| CN116664001B (zh) | 一种基于人工智能的学员技能评估方法及系统 | |
| KR101984248B1 (ko) | 원자력 발전설비의 기계학습식 예측진단장치 | |
| CN111931334B (zh) | 一种用于评估电缆设备运行可靠性的方法及系统 | |
| US20210405610A1 (en) | Maintenance Recommendation System and Maintenance Recommendation Method | |
| Nielsen | Value of information of structural health monitoring with temporally dependent observations | |
| US20240412921A1 (en) | Enhanced transformer fault forecasting based on dissolved gases concentration and their rate of change | |
| Kirschenmann et al. | Decision dependent stochastic processes | |
| CN117272844B (zh) | 配电盘工作寿命的预测方法及系统 | |
| KR101967633B1 (ko) | 원자력 발전설비의 기계학습식 예측진단장치 | |
| Kosgodagan et al. | Expert judgment in life-cycle degradation and maintenance modelling for steel bridges | |
| Lannoy et al. | Expertise, safety, reliability, and decision making: practical industrial experience | |
| KR101983603B1 (ko) | 증강현실을 활용한 원자력 발전설비의 기계학습식 예측진단장치 | |
| CN118261417A (zh) | 氢氧化锂生产过程风险监控预警方法及系统 | |
| EP4315074B1 (de) | Computerimplementiertes verfahren zur aktualisierung eines modellparameters für ein modell | |
| KR20140110323A (ko) | 실시간 성적 분포 및 등급컷 추정 방법 | |
| Amleh et al. | Estimations with step-stress partially accelerated life tests for Ailamujia distribution under Type-I censored data | |
| CN116777281A (zh) | 一种基于arima模型的电力设备质量趋势预测方法及装置 | |
| CN117709939A (zh) | 一种基于贝叶斯理论的维修性评估方法 | |
| JP2005242712A (ja) | プラントの保守計画策定方法及び保守計画策定用プログラム |
Legal Events
| Date | Code | Title | Description |
|---|---|---|---|
| STAA | Information on the status of an ep patent application or granted ep patent |
Free format text: STATUS: THE INTERNATIONAL PUBLICATION HAS BEEN MADE |
|
| PUAI | Public reference made under article 153(3) epc to a published international application that has entered the european phase |
Free format text: ORIGINAL CODE: 0009012 |
|
| STAA | Information on the status of an ep patent application or granted ep patent |
Free format text: STATUS: REQUEST FOR EXAMINATION WAS MADE |
|
| 17P | Request for examination filed |
Effective date: 20220421 |
|
| AK | Designated contracting states |
Kind code of ref document: A1 Designated state(s): AL AT BE BG CH CY CZ DE DK EE ES FI FR GB GR HR HU IE IS IT LI LT LU LV MC MK MT NL NO PL PT RO RS SE SI SK SM TR |
|
| REG | Reference to a national code |
Ref country code: DE Ref legal event code: R079 Free format text: PREVIOUS MAIN CLASS: H04L0012240000 Ipc: H04L0041063100 |
|
| A4 | Supplementary search report drawn up and despatched |
Effective date: 20221027 |
|
| RIC1 | Information provided on ipc code assigned before grant |
Ipc: H04L 43/045 20220101ALN20221021BHEP Ipc: H04L 41/5009 20220101ALI20221021BHEP Ipc: H04L 41/147 20220101ALI20221021BHEP Ipc: H04L 41/14 20220101ALI20221021BHEP Ipc: H04L 41/0631 20220101AFI20221021BHEP |
|
| DAV | Request for validation of the european patent (deleted) | ||
| DAX | Request for extension of the european patent (deleted) | ||
| STAA | Information on the status of an ep patent application or granted ep patent |
Free format text: STATUS: EXAMINATION IS IN PROGRESS |
|
| 17Q | First examination report despatched |
Effective date: 20240611 |