EP4047351A1 - Verfahren zum nachweis von durch umweltbelastung in pflanzenmaterial beeinflussbaren pflanzenkrankheiten und physiologischen eigenschaften - Google Patents
Verfahren zum nachweis von durch umweltbelastung in pflanzenmaterial beeinflussbaren pflanzenkrankheiten und physiologischen eigenschaften Download PDFInfo
- Publication number
- EP4047351A1 EP4047351A1 EP21157707.7A EP21157707A EP4047351A1 EP 4047351 A1 EP4047351 A1 EP 4047351A1 EP 21157707 A EP21157707 A EP 21157707A EP 4047351 A1 EP4047351 A1 EP 4047351A1
- Authority
- EP
- European Patent Office
- Prior art keywords
- plant material
- plant
- electromagnetic waves
- diseases
- analysis
- Prior art date
- Legal status (The legal status is an assumption and is not a legal conclusion. Google has not performed a legal analysis and makes no representation as to the accuracy of the status listed.)
- Withdrawn
Links
Images


Classifications
-
- G—PHYSICS
- G01—MEASURING; TESTING
- G01N—INVESTIGATING OR ANALYSING MATERIALS BY DETERMINING THEIR CHEMICAL OR PHYSICAL PROPERTIES
- G01N21/00—Investigating or analysing materials by the use of optical means, i.e. using sub-millimetre waves, infrared, visible or ultraviolet light
- G01N21/17—Systems in which incident light is modified in accordance with the properties of the material investigated
- G01N21/25—Colour; Spectral properties, i.e. comparison of effect of material on the light at two or more different wavelengths or wavelength bands
- G01N21/31—Investigating relative effect of material at wavelengths characteristic of specific elements or molecules, e.g. atomic absorption spectrometry
-
- G—PHYSICS
- G01—MEASURING; TESTING
- G01N—INVESTIGATING OR ANALYSING MATERIALS BY DETERMINING THEIR CHEMICAL OR PHYSICAL PROPERTIES
- G01N33/00—Investigating or analysing materials by specific methods not covered by groups G01N1/00 - G01N31/00
- G01N33/02—Food
- G01N33/025—Fruits or vegetables
-
- G—PHYSICS
- G01—MEASURING; TESTING
- G01N—INVESTIGATING OR ANALYSING MATERIALS BY DETERMINING THEIR CHEMICAL OR PHYSICAL PROPERTIES
- G01N21/00—Investigating or analysing materials by the use of optical means, i.e. using sub-millimetre waves, infrared, visible or ultraviolet light
- G01N21/84—Systems specially adapted for particular applications
- G01N2021/8466—Investigation of vegetal material, e.g. leaves, plants, fruits
-
- G—PHYSICS
- G01—MEASURING; TESTING
- G01N—INVESTIGATING OR ANALYSING MATERIALS BY DETERMINING THEIR CHEMICAL OR PHYSICAL PROPERTIES
- G01N21/00—Investigating or analysing materials by the use of optical means, i.e. using sub-millimetre waves, infrared, visible or ultraviolet light
- G01N21/84—Systems specially adapted for particular applications
- G01N21/85—Investigating moving fluids or granular solids
- G01N2021/8592—Grain or other flowing solid samples
-
- G—PHYSICS
- G01—MEASURING; TESTING
- G01N—INVESTIGATING OR ANALYSING MATERIALS BY DETERMINING THEIR CHEMICAL OR PHYSICAL PROPERTIES
- G01N21/00—Investigating or analysing materials by the use of optical means, i.e. using sub-millimetre waves, infrared, visible or ultraviolet light
- G01N21/17—Systems in which incident light is modified in accordance with the properties of the material investigated
- G01N21/25—Colour; Spectral properties, i.e. comparison of effect of material on the light at two or more different wavelengths or wavelength bands
- G01N21/31—Investigating relative effect of material at wavelengths characteristic of specific elements or molecules, e.g. atomic absorption spectrometry
- G01N21/35—Investigating relative effect of material at wavelengths characteristic of specific elements or molecules, e.g. atomic absorption spectrometry using infrared light
- G01N21/359—Investigating relative effect of material at wavelengths characteristic of specific elements or molecules, e.g. atomic absorption spectrometry using infrared light using near infrared light
-
- G—PHYSICS
- G01—MEASURING; TESTING
- G01N—INVESTIGATING OR ANALYSING MATERIALS BY DETERMINING THEIR CHEMICAL OR PHYSICAL PROPERTIES
- G01N21/00—Investigating or analysing materials by the use of optical means, i.e. using sub-millimetre waves, infrared, visible or ultraviolet light
- G01N21/84—Systems specially adapted for particular applications
- G01N21/85—Investigating moving fluids or granular solids
-
- G—PHYSICS
- G01—MEASURING; TESTING
- G01N—INVESTIGATING OR ANALYSING MATERIALS BY DETERMINING THEIR CHEMICAL OR PHYSICAL PROPERTIES
- G01N2201/00—Features of devices classified in G01N21/00
- G01N2201/12—Circuits of general importance; Signal processing
- G01N2201/129—Using chemometrical methods
-
- G—PHYSICS
- G01—MEASURING; TESTING
- G01N—INVESTIGATING OR ANALYSING MATERIALS BY DETERMINING THEIR CHEMICAL OR PHYSICAL PROPERTIES
- G01N2201/00—Features of devices classified in G01N21/00
- G01N2201/12—Circuits of general importance; Signal processing
- G01N2201/129—Using chemometrical methods
- G01N2201/1296—Using chemometrical methods using neural networks
Definitions
- the invention relates to a method for detecting plant diseases in plant material and/or physiological properties influenceable by environmental stress in plant material, an analysis assembly for detecting plant diseases in plant material, an arrangement for detecting plant diseases in plant material, and a control unit for controlling an analysis assembly and/or for receiving data from an analysis assembly.
- plant diseases can occur in plant material used therein.
- the infection of plant material with plant diseases is typically detrimental, as plant diseases can dramatically change the properties of the plant material.
- Many biotic agents such as virus, fungi, bacteria, nematodes, insects, molluscs, mammals, arthropods can cause imbalance in the physiology of the vital plant material parts. These biotic agents can attack the tissue of the plant material and cause chemical changes in the systemic tissues that are not affected.
- maize leaf infection by fungi can cause physiological changes in the root of the plant material, even if the roots of the plant material are not infected ( Balmer et al, The Plant Journal (2013) 74, 213-225 ).
- leaf infestation by pests can cause root metabolite changes in tea plants ( Yang et al. J. Agric. Food Chem. 2019, 67, 19, 5465-5476 ).
- different leaf pests affect root metabolic responses in cabbage plants ( Karssemeijer et al, Plant Cell Environ. 2020; 43:775-786 .).
- Sugar beet root and crown rot, induced by the soil-borne fungus Rhizoctonia solani has an influence on quality components in sugarbeets.
- R. solani infestation led to an enormous increase of reducing sugars as glucose and fructose.
- the molassegenic components sodium and amino-N showed minimal or no reaction to infestation, whereas potassium increased with increasing disease severity ( J. Buddemeyer; B.
- Determining plant diseases in plant material is relatively time consuming as well as labour and cost intensive. Furthermore, typically only a small portion of the plant material is analysed to determine if plant diseases are present in the plant material. However, if only parts of the plant material are infected with plant diseases, such plant infections can be overlooked, resulting in unreliability of the detection of plant diseases.
- a method for detecting plant diseases in plant material and/or physiological properties influenceable by environmental stress in plant material comprising receiving plant material, emitting electromagnetic waves towards the plant material, receiving electromagnetic waves, converting the received electromagnetic waves into a spectral signal, and preferably processing the spectral signal, determining plant diseases in the plant material and/or physiological properties, in particular metabolites, influenceable by environmental stress in the plant material.
- plant material that may be used in the present invention encompasses various embodiments of plant, including but not limited to, the leaf, root, beet, tuber, stem, fruit, and other plant tissues of any section of the plant, callus or an adventive embryo-like tissue (referred to hereinafter as "callus, etc.” or simply “callus”), or a complete plant,
- a preferable form of the plant material used in the method of the present invention is root, beet or tuber.
- Plant material can be root crops and/or tuber crops, in particular of the species Beta vulgaris and/or Solanum tuberosum. Plant material can be a part of root crops and/or tuber crops, in particular of the species Beta vulgaris and/or Solanum tuberosum.
- plant material comprises or is one or several of the following group: sugar beet, spinach beet, swiss chard, beetroot, bicwurzel, potato.
- Plant material can be a small or large part of a plant material portion, in particular a part of a plant material portion that is used for production processes and/or breeding processes. Plant material can comprise or consist of one or several parts of a plant.
- Plant material can for example comprise or consist of a leaf or a part thereof, in particular a stamped-out part of a leaf.
- Plant material can for example comprise or consist of several leaves or parts thereof, in particular a stamped-out parts of several leaves.
- receiving plant material is conducted by receiving a truckload of plant material and/or a container of plant material and/or a goods wagon of plant material and/or an amount of plant material from a plot for breeding processes and/or an amount of plant material for field trail and/or plant material of a green house.
- the electromagnetic waves that are emitted the plant material lie within the infrared spectrum (0,7 ⁇ m - 1000 ⁇ m) and/or in the microwave region (2 cm -1 - 130 cm -1 ) and/or in the visible spectrum (380 nm - 750 nm) and/or in the ultraviolet spectrum. (10 nm - 380 nm)
- the spectral signal is converted by using spectroscopy, in particular near-infrared spectroscopy (NIRS) mid-infrared spectroscopy and/or far-infrared spectroscopy and/or terahertz spectroscopy and/or ultraviolet-visible spectroscopy (UV-Vis) and/or Raman spectroscopy and/or laser-induced breakdown spectroscopy (LIBS) and/or fluorescent spectroscopy, and/or images as well as hyperspectral images and/or combination of images and/or hyperspectral images with spectroscopy methods and/or combinations of different spectroscopic methods and/or fluorescence imaging.
- NIRS near-infrared spectroscopy
- UV-Vis ultraviolet-visible spectroscopy
- LIBS laser-induced breakdown spectroscopy
- fluorescent spectroscopy and/or images as well as hyperspectral images and/or combination of images and/or hyperspectral images with spectroscopy methods and/or combinations of different spectroscopic methods and/or
- the electromagnetic waves are reflected from the plant material and the reflected electromagnetic waves are received, in particular with a sensor that is adapted to receive electromagnetic waves.
- the electromagnetic waves are reflected from the plant material, or a part thereof.
- the electromagnetic waves can also be, at least partly, emitted through the plant material and the electromagnetic waves can be received, in particular with a sensor that is adapted to receive electromagnetic waves.
- the electromagnetic waves are emitted through the plant material, or a part thereof.
- the received electromagnetic waves are converted into a spectral signal, wherein the spectral signal is generated dependent on the received electromagnetic waves.
- the method comprises processing the spectral signal for determining plant diseases in the plant material.
- Processing the spectral signal for determining plant diseases in the plant material can be carried out to determine plant diseases in the plant material or at least in a part of the plant material.
- plant diseases are determined dependent on the spectral signal, in particular dependent on information of the spectral signal.
- Plant diseases can for example be determined in sugar beets.
- determining plant diseases comprises determining if one or several of the following plant diseases, in particular sugar beet diseases, are present in the plant material and/or determining an infestation rate of one or several of the following plant diseases, in particular sugar beet diseases:
- Pest infestation caused by one or several of the following group: wireworm, cutworm, moth, aphid, pygmy mangold beetle, silver Y moth, spotted snake millipede, beet weevil, tortoise beetle, flea beetle, cicade, moth species, cockchafer, crane fly, springtail, darkling beetle, beet fly, beet leafminer, beet moth, garden or glass house symphylid, springtail, southern sugar beet weevil, true weevil, Lixus subtilis Sturm, Lygus, bright-line brown-eye, African cotton, leafworm, grey beet weevil, two-spotted spider mite, thrips.
- determining plant diseases and pest infestations comprises determining if one or several of the plant diseases and pest infestations shown in the following table, in particular sugar beet diseases, are present in the plant material and/or induced a change in the plant material and/or determining an infestation rate of one or several of the following plant diseases, in particular sugar beet diseases: Bacteria and Rickettsia Common name of disease Causal organisms Bacterial vascular necrosis and rot Pectobacterium carotovorum supsp. betavasculorum Bacterial leaf spot Pseudomonas syringae p.v.
- Botrytis cinerea Aphanomyces seedling disease Aphanomyces cochlioides Rhizoctonia seedling disease Rhizoctonia solani Pythium seedling disease Pythium ultimum and P. aphanidermatum Phoma seedling disease Phoma betae Aphanomyces chronic root rot Aphanomyces cochlioides Charcoal rot Macrophomina phaseolina Fusarium yellows Fusarium oxysporum f. sp. betae Fusarium root rot Fusarium oxysporum f. sp.
- Tortoise beetle Cassida spp. Wireworms Agriotes spp. White grubs Phyllophaga spp. Cockchafer / chafer grubs Melolontha spp. Symphylids Scutigurella immaculata Millipedes Blaniulus gutulatus marsh cranefly / leatherjacket Tipula paludosa Pigmy mangold beetle Atomaria linearis Green peach aphid Myzus persicae Black bean aphid Aphis fabae Sugar beet root aphid Pemphigus betae Slugs Deroceras reticulatum, D.
- Plant diseases can for example be determined in potatoes. Preferably, determining if one or several of the following plant diseases, in particular potato diseases, are present in the plant material, and/or determining an infestation rate of one or several of the following plant diseases, in particular potato diseases:
- Physiological changes in root crops due to growing or storage condition as well as stress can be also detected according to the present invention.
- Such changes include in particular:
- Physiological properties influenceable by environmental stress in plant material is preferably understood to be physiological properties changeable by and/or affectable by environmental stress in plant material.
- physiological properties influenceable by environmental stress in plant material is understood to be physiological properties changed by and/or affected by environmental stress in plant material.
- Physiological properties changed by and/or affected by environmental stress in plant material are in particular understood to be physiological properties of the plant material, wherein the physiological properties have been changed and/or affected by environmental stress.
- Physiological properties influenceable by environmental stress in plant material can in particular be changed by one or several influences of the following list:
- the method steps can be carried out in an order that deviates from the listed order. However, it is preferred if the method steps are carried out in the listed order, in particular one after the other.
- spectroscopy has the potential to predict plant biochemical constituents such as nutrients and secondary metabolite, indicative of biotic stress, such as plant diseases. Therefore, using spectroscopy, plant diseases can reliably be determined and/or detected in an automated manner. Spectroscopy is particularly advantageous, as infected plant material can have a different spectral information than healthy plant material.
- the symptoms and stress caused by the pathogens as well as by insects and/or environmental stress factors can change pigmentation, alter surface temperature, and/or change in metabolites or metabolites contents.
- sugar beets can be susceptible to a number of different viruses that can be transmitted by insects, fungi, nematodes, seed and/or physical contact. All these viruses may decrease the potential yield of the root crop and for example can affect the extractability of sugar within a sugar production process.
- the solution described herein has the advantage that some plant diseases can only or more accurately be determined and/or detected in specific parts of the plant material and with the solution described herein it is possible to analyse specific parts of the plant material, such as for example leaves that are part of the plant material.
- the solution described herein has the advantage that from determining diseases and/or physiological properties influenceable by environmental stress further important information can be derived, for example on storage loss of components in the plant material.
- further important information can be derived, for example on storage loss of components in the plant material.
- sugar beets with plant diseases can have a higher loss in sugar content and/or a bad storability behaviour compared to sugar beets without plant diseases.
- plant diseases can have an influence on the consistency of the plant material. This can lead to problems during chopping and/or slicing of plant material.
- further steps such as steps in a production processes, agronomic practices or breeding processes can be improved.
- the method comprises generating calibration data, including taking a sample of plant material, preferably with and/or without plant diseases and/or with and/or without physiological properties influenceable by environmental stress, and preferably moving the sample along a sensor that is adapted to receive electromagnetic waves, calibration analysis of the plant material by evaluating plant diseases in the plant material, for example by visual scoring of a plant disease and/or by analysis of metabolites and/or components present in the plant material, spectroscopic analysis of the sample by, preferably continuously, emitting electromagnetic waves towards the sample, receiving electromagnetic waves, and converting the received electromagnetic waves into a spectral signal, comparing the results of the spectroscopic analysis with the results of the calibration analysis.
- the sample of plant material can for example comprise of 10 kg or 20 kg or 30 kg of plant material. Other amounts of plant material can also be used.
- receiving electromagnetic waves can be understood as receiving electromagnetic waves that are reflected from and/or transmitted through and/or emitted by the sample.
- Calibration analysis can comprise at least one or several measurements, such as for example visual scoring, wherein the at least one measurement can be conducted on the plant material.
- calibration data can be generated, Visual scoring of plant disease can also be conducted on plant material such as crops in the fields before sampling, in particular for leaf infection by Cercospora.
- the spectroscopic analysis is carried out continuously.
- calibration data is generated by repeatedly taking samples and conducting spectroscopic analyses of the samples.
- calibration data is generated by repeatedly comparing results of spectroscopic analyses with results from calibration analyses. It is preferred if this procedure is repeated several times, in particular more than 100 times, preferably more than 1000 times.
- this procedure conducted on plant material with different plant diseases and/or on plant material with different plant material conditions, such as on relatively wet plant material, on relatively dry plant material, on plant material with varying components and/or ingredients.
- Generating calibration data can also be carried out in a static process, wherein the sample of plant material is not moved along a sensor.
- the sample is located at a defined position, in particular under and/or over a sensor that is adapted to receive electromagnetic waves.
- An advantage of generating calibration data in the described way is that the calibration data can be used for reliably determining plant diseases in plant material even for plant material with different components and/or properties and/or with different conditions.
- generating calibration data comprises developing and/or optimising and/or validating a calibration model, wherein developing and/or optimising and/or validating the calibration model comprises generating a calibration set, a cross-validation set, and an independent validation set.
- the calibration set comprises results obtained from spectroscopic analysis of a first part of the sample of plant material.
- the cross-validation set comprises results obtained from spectroscopic analysis of a second part of the sample of plant material.
- the independent validation set comprises results obtained from spectroscopic analysis of a third part of the sample of plant material. It is preferred if the first part, the second part, and the third part of the sample are parts of different and independent samples of plant material.
- the calibration model can be generated from the calibration set.
- the cross-validation set can be used for developing, in particular improving, the calibration model.
- the independent validation set can be used for validating the calibration model. It is preferably that the independent validation set is not used for changing and/or developing the calibration model. However, it is also possible to use examples from the independent validation set for extending or improving calibration.
- the method comprises comparing the spectral signal with calibration data and/or at least one reference value and dependent on the comparison determine presence and/or quantification and/or qualification of plant diseases and/or physiological properties influenceable by environmental stress in the plant material.
- a specific value for example at a specific wavelength of a spectral signal can be compared with a reference value.
- the spectral signal can be compared with calibration data and dependent on the comparison of the calibration data and the spectral signal, it can be determined if plant diseases and/or physiological properties influenceable by environmental stress are present in the plant material.
- the said reference value is understood by a person skilled in the art, e.g.
- the qualitative and quantitative method include visual rating, detection by imaging system.
- image analysis technologies can pave the way for an agile systems biology approach to create reference value, also the combination of feature selection and growth modelling supporting the biological interpretation of plant growth, physiological changes, and stress tolerance.
- the comparison of the spectral signal with the calibration data and/or the at least one reference value can be used to determine the presence of plant diseases and/or physiological properties influenceable by environmental stress in the plant material. It is further preferred, if the comparison of the spectral signal with the calibration data and/or the at least one reference value can be used to determine the quantification of plant diseases and/or physiological properties influenceable by environmental stress in the plant material, in particular the number of plant diseases and/or the intensity of the one or more plant diseases present in the plant material and/or the intensity of environmental factors.
- the comparison of the spectral signal with the calibration data and/or the at least one reference value can be used to conduct a qualification of plant diseases or environmental factors in the plant material, in particular by determining a severity and/or a class of the plant diseases or class of environmental stress factors present in the plant material.
- generating calibration data and/or generating at least one reference value comprises conducting a plurality of reference spectral signals, wherein preferably the plurality of reference spectral signals is converted from electromagnetic waves reflected from and/or transmitted through plant material without plant diseases and/or plant material with plant diseases and/or plant material from different environmental regions, or at least a part thereof.
- the calibration data is derived using multiple and/or multivariate and/or linear regression analysis, and/or wherein the calibration data is derived from multivariate analysis including spectral preprocessing preferably by differentiating the spectral signals using mathematical classification options and/or filtering, in particular using mathematical filtering methods, and/or averaging spectral signals to one spectral signal, and/or carrying out multiple and/or multivariate and/or linear regression analysis for generating calibration data, wherein preferably the calibration data is derived using principle component analysis (PCA), and/or multiple linear regression (MLR), and/or partial least squares (PLS) regression, and/or machine learning, in particular using neuronal networks.
- PCA principle component analysis
- MLR multiple linear regression
- PLS partial least squares
- the spectral signal is classified into a classification of infestation classes and/or different plant diseases and/or metabolites.
- a classification of infestation classes and/or different plant diseases and/or metabolites it is possible to classify plant diseases and environmental stress factors that are present in the plant material from information in the spectral signal.
- determining plant diseases and/or physiological properties influenceable by environmental stress in the plant material comprises processing the spectral signal for determining plant diseases and/or physiological properties influenceable by environmental stress in the plant material, and/or wherein processing the spectral signal and/or generating calibration data comprises one or several of the following steps: preprocessing the spectral signal for correcting and/or eliminating overlaying effects, wherein preferably preprocessing is conducted using Standard Normal Variate (SNV) and/or multiplicative scatter correction (MSC), and/or first derivatives, and/or second derivatives, and/or smoothing and/or a combination of Derivative and SNV, wherein preferably preprocessing is conducted before multiple and/or multivariate and/or linear regression analysis is carried out, and/or removing spectral signals that are not converted from electromagnetic waves reflected from and/or emitted through the plant material, preferably by differentiating the spectral signals using classification and/or filtering, in particular using mathematical filtering methods and/or averaging spect
- determining plant diseases and/or physiological properties influenceable by environmental stress in the plant material comprises processing the spectral signal for determining plant diseases and/or physiological properties influenceable by environmental stress in the plant material, and/or wherein processing the spectral signal and/or generating calibration data comprises one or several of the following steps:
- An advantage of such a preprocessing is that the spectral signal can be corrected and failures in recorded spectral signals do not lead to poor or wrong results. If unwanted overlaying effects are present in the recorded spectral signals, these effects can be eliminated by using such a preprocessing.
- Multiplicative scatter correction is a standard normalization technique that aims to correct spectral signals in such a way that they are as close as possible to a reference spectrum, generally the mean of the data set, by changing the scale and the offset of the spectral signals.
- Calculating the first derivatives and/or the second derivatives can also be used for preprocessing the obtained spectral signals.
- Regression analysis is a set of statistical processes for estimating the relationships between a dependent variable, which is often called the 'outcome variable', and one or more independent variables, which is often called 'predictors', 'covariates', or 'features'.
- the most common form of regression analysis is linear regression, in which a line or a more complex linear combination is determined, wherein the line most closely fits the data according to a specific mathematical criterion.
- Averaging spectral signals to one spectral signal can be conducted by averaging several spectral signals obtained during generating calibration data to one spectral signal that shows an average of the several spectral signals.
- the method comprises: detecting metabolites and/or components of the plant material and/or determining sugar beet diseases in the plant material.
- a metabolite is in particular understood to be an intermediate or end product of metabolism.
- the method comprises chopping and/or slicing the plant material into plant material pieces, and/or homogeneously distributing the plant material onto a transport device, preferably with a roller that is arranged above the transport device, and/or adjusting the plant material, in particular by adjusting the height of the plant material and/or by compressing the plant material and/or by smoothing the surface of the plant material, preferably with the roller.
- chopping the plant material into plant material pieces is conducted by cutting and/or crumbling the plant material into plant material pieces. After chopping the plant material into plant material pieces, the plant material pieces can still be referred to as plant material.
- slicing the plant material into plant material pieces is conducted by slicing and/or cutting the plant material into plant material pieces. After slicing the plant material pieces, the plant material pieces can still be referred to as plant material.
- Preferably conveying the plant material using the transport device is conducted along a transport direction, wherein a stream of the plant material is generated.
- the stream of the plant material moves along the transport direction.
- the transport device is understood to be a device for conveying plant material.
- the transport device can be adapted to convey the plant material.
- the transport device comprises a conveyor belt.
- the method comprises arranging the, preferably homogeneously distributed, plant material onto a transport device, and/or conveying the plant material using the transport device, wherein preferably the plant material is conveyed towards a sensor, wherein the sensor is adapted to receive electromagnetic waves.
- the electromagnetic waves that are emitted towards the plant material lie within the infrared spectrum, in particular in the near-infrared spectrum, and/or in the visible spectrum and/or in the ultraviolet spectrum.
- the electromagnetic waves have at least one wavelength, wherein the wavelength of the electromagnetic waves lies in the range of 10 nm to 3,000,000 nm, in particular in the range of 780 nm to 2500 nm, 10 preferably in the range of 850 nm to 1650 nm.
- the spectral signal is converted by using spectroscopy, in particular near infrared spectroscopy and/or mid-infrared spectroscopy and/or far infrared-spectroscopy and/or terahertz spectroscopy and/or microwave-spectroscopy and/or ultraviolet-visible spectroscopy (UV-Vis) and/or Raman spectroscopy and/or laser-induced breakdown spectroscopy (LIBS), and or hyperspectral images, and/or fluorescence images and/or combination of hyperspectral images with spectroscopy methods and/or combinations of different spectroscopic methods.
- spectroscopy in particular near infrared spectroscopy and/or mid-infrared spectroscopy and/or far infrared-spectroscopy and/or terahertz spectroscopy and/or microwave-spectroscopy and/or ultraviolet-visible spectroscopy (UV-Vis) and/or Raman spectroscopy and/or laser-induced breakdown spectroscopy (LIBS), and
- the electromagnetic waves are reflected from and/or emitted through the plant material that is arranged on the transport device.
- the electromagnetic waves are received, in particular with a sensor that is adapted to receive electromagnetic waves.
- the electromagnetic waves are reflected from and/or emitted through the plant material.
- the received electromagnetic waves are converted into a spectral signal, wherein the spectral signal is generated dependent on the received electromagnetic waves.
- the method comprises continuously recording received electromagnetic waves, and/or continuously converting the received electromagnetic waves into spectral signals.
- Continuously recording received electromagnetic waves is particularly advantageous, as in such a way the method described herein can be applied onto continuous processes, such as for example continuous processes within a sugar production factory in which sugar beet pieces are continuously conveyed on a conveyor belt.
- Continuously converting the received electromagnetic waves into spectral signals is particularly advantageous, as in such a way the method described herein can be applied onto continuous processes, such as for example continuous processes within a sugar production factory in which sugar beet pieces are continuously conveyed on a conveyor belt.
- the plant material while emitting electromagnetic waves towards the plant material the plant material is arranged on the transport device and/or conveyed using the transport device, and/or wherein the wavelength of the electromagnetic waves lies in the ultraviolet (UV) spectrum and/or in the visible spectrum and/or in the infrared spectrum and/or in the microwave spectrum and/or in the terahertz-spectrum, wherein preferably the wavelength of the electromagnetic waves lies in the range of 10 nm to 3000 ⁇ m.
- UV ultraviolet
- the electromagnetic waves are received from at least one spectrometer and/or at least one spectrophotometer.
- the at least one spectrometer and/or the at least one spectrophotometer are preferably of the following group: ultraviolet-visible (UV/Vis) spectrophotometer, near-infrared (NIR) spectrometer, Raman spectrometer.
- UV/Vis ultraviolet-visible
- NIR near-infrared
- Raman spectrometer Raman spectrometer
- chopping the plant material into plant material pieces is conducted using a chopping device, wherein the chopping device is configured to cut and/or crumble the plant material into substantially equal sized plant material pieces and/or wherein slicing the plant material into plant material pieces is conducted using a slicing device, wherein the slicing device is configured to cut and/or slice the plant material into plant material pieces that are preferably formed as thin elongated strips and/or slices.
- the plant material can be cut and/or crumbled with the chopping device and/or cut and/or sliced with the slicing device, wherein the chopping device and/or the slicing device comprises blades and/or knifes for cutting the plant material into plant material pieces.
- the plant material pieces can for example be formed as thin elongated strips, which are also often, and in particular in the sugar production industry, referred to as cossettes.
- the species of the plant material is a root crop and/or a tuber crop, in particular Beta vulgaris and/or Solanum tuberosum, or at least a part thereof, and/or wherein the plant material comprises or consists of sugar beets, and/or wherein the plant material is introduced to a production process for processing the plant material in a processing industry, and/or wherein the plant material is introduced to a breeding process.
- the processing industry can for example be sugar production industry, potato processing industry or other plant processing industries. Breeding process is understood to be a plant breeding process, in particular for breeding the plant material.
- the method comprises introducing plant material into a breeding process, and/or changing at least one breeding parameter, dependent on the determination of plant diseases in the plant material and/or physiological properties influenceable by environmental stress in the plant material.
- the breeding process could be changed e.g. by using results from the analysis with the method as described herein to select a plant that has increased resistance and/or tolerance to a particular stress condition.
- the breeding process could be changed e.g. by starting or strengthening a breeding program or weakening the input into a breeding program based on the information about the presence of stress conditions (e.g. diseases) revealed by the data gained from the spectroscopic analysis, e.g.
- the breeding process could be changed e.g. by combining variety information (e.g. the genetic and/or genomic sequence of the varieties) with information about the detection of stress conditions (e.g. diseases), e.g. the data show that specific varieties/genotypes, with specific genomic sequences, have higher or lower levels of stress conditions (e.g. disease scoring based on the calibration) and the information is then used to select varieties/genotypes with the specific genomic sequences and introduce these specific genomic parts into other varieties/genotypes that lack these genomic parts.
- variety information e.g. the genetic and/or genomic sequence of the varieties
- information about the detection of stress conditions e.g. diseases
- the data show that specific varieties/genotypes, with specific genomic sequences, have higher or lower levels of stress conditions (e.g. disease scoring based on the calibration) and the information is then used to select varieties/genotypes with the specific genomic sequences and introduce these specific genomic parts into other varieties/genotypes that lack these genomic parts.
- the growth/cultivation conditions of the plants could be improved in a way that reduces the stress condition for the plant.
- a product e.g. sugar
- the data received from the spectroscopic analysis and combined with the geographic location and other environmental information might be of value to certain stakeholders in the agricultural industry and/or food industry and/or insurance industry and/or data industry and/or political decision makers and/or legal entities and or any other stakeholders. Such information could be made available or be implemented by digital farming platforms and/or combined with other data to create additional value. This method could improve marketing and sales for seed companies or agricultural suppliers by selecting or recommending the right varieties that are adapted/tolerant/resistant for the stress conditions.
- the method comprises producing a product, preferably raw juice and/or sugar and/or starch, from the plant material, changing at least one sugar production parameter, in particular extraction parameters, and/or dosages of additives, and/or electric field pulses, and/or pulse numbers, and/or process temperature, and/or conveying speed and/or duration of plant material pieces in reactor and/or at least one drying process parameter, dependent on the determination of plant diseases and/or physiological properties influenceable by environmental stress in the plant material.
- a product preferably raw juice and/or sugar and/or starch
- raw juice is a product within a sugar production process, wherein sugar is produced from sugar beets.
- sugar is produced from sugar beets.
- the sugar extraction process for extracting sugar from sugar beet pieces can be adapted dependent on the determination of plant diseases in the sugar beets.
- the sugar extraction process can be adapted to the determined plant diseases that are currently in the sugar production process, which can for example lead to an improved sugar yield.
- a method for generating calibration data for the determination of diseases in plant material and/or physiological properties influenceable by environmental stress in plant material comprising taking a sample of plant material, preferably with and/or without plant diseases and/or with and/or without physiological properties influenceable by environmental stress, and preferably moving the sample along a sensor that is adapted to receive electromagnetic waves, calibration analysis of the plant material by evaluating plant diseases and/or physiological properties, in particular metabolites, influenceable by environmental stress in the plant material, for example by visual scoring and/or analysis of components and/or metabolism of a plant disease and/or physiological properties, in particular metabolites, influenceable by environmental stress present in the plant material, spectroscopic analysis of the sample by, preferably continuously, emitting electromagnetic waves towards the sample, receiving electromagnetic waves, and converting the received electromagnetic waves into a spectral signal, comparing the results of the spectroscopic analysis with the results of the calibration analysis.
- an analysis assembly for detecting plant diseases in plant material and/or physiological properties influenceable by environmental stress in plant material, wherein the analysis assembly is arranged to emit electromagnetic waves towards plant material pieces, wherein the analysis assembly is arranged to receive reflected and/or emitted electromagnetic waves, wherein the analysis assembly is arranged to convert the received reflected electromagnetic waves into a spectral signal, wherein the analysis assembly is processing the spectral signal for determining plant diseases and/or physiological properties, in particular metabolites, influenceable by environmental stress in the plant material.
- an arrangement for detecting plant diseases in plant material and/or physiological properties influenceable by environmental stress in plant material comprising a receiving section for receiving plant material, a chopping device for chopping the plant material into plant material pieces, an analysis assembly described herein.
- the receiving section can be a section and/or station for receiving plant material from transport vehicles, such as for example trucks and/or trains.
- the receiving section can be an inlet of the chopping device and/or slicing device, wherein the plant material is introduced to the chopping device and/or slicing through the inlet.
- a control unit for controlling an analysis assembly as described herein and/or for receiving data from an analysis assembly as described herein and controlling at least one production parameter, in particular extraction parameters and/or dosages of additives, and/or electric field pulses and/or pulse numbers and/or process temperature and/or conveying speed and/or duration of plant material pieces in a reactor and/or at least one drying process parameter dependent on the determination of plant diseases in the plant material and/or physiological properties influenceable by environmental stress in the plant material.
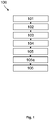
- Fig. 1 shows a schematic representation of an example of a method 100 for detecting plant diseases in plant material.
- the method 100 comprises the steps described in the following.
- a step 101 receiving plant material.
- a step 102 emitting electromagnetic waves towards the plant material.
- a step 103 receiving electromagnetic waves.
- a step 104 converting the received electromagnetic waves into a spectral signal.
- a step 105 determining plant diseases in the plant material.
- a step 105a generating calibration data, including taking a sample of plant material, preferably with and/or without plant diseases, calibration analysis of the plant material by evaluating plant diseases in the plant material, for example by visual scoring of a plant disease that is present in the plant material, spectroscopic analysis of the sample by, preferably continuously, emitting electromagnetic waves towards the sample, receiving electromagnetic waves, and converting the received electromagnetic waves into a spectral signal, comparing the results of the spectroscopic analysis with the results of the calibration analysis.
- comparing the spectral signal with calibration data and/or at least one reference value and dependent on the comparison determine presence and/or quantification and/or qualification of plant diseases in the plant material.
- Fig. 2 shows a schematic representation of an example of a method 100 for detecting plant diseases in plant material.
- the method 100 comprises the steps described in Fig. 1 and the steps describes in following, wherein the preferred order of the steps can be seen in Fig. 2 . In the following, only the steps that have not already been described in regard to Fig. 1 are described.
- a step 101a chopping and/or slicing the plant material into plant material pieces.
- a step 101b homogeneously distributing the plant material onto a transport device, preferably with a roller that is arranged above the transport device.
- a step 101c adjusting the plant material, in particular by adjusting the height of the plant material and/or by compressing the plant material and/or by smoothing the surface of the plant material, preferably with the roller.
- a step 101d arranging the, preferably homogeneously distributed, plant material onto a transport device.
- a step 101e conveying the plant material using the transport device, wherein preferably the plant material is conveyed towards a sensor, wherein the sensor is adapted to receive reflected electromagnetic waves.
- a step 103a continuously recording received reflected electromagnetic waves, and/or continuously converting the received electromagnetic waves into spectral signals.
- a step 106a introducing plant material into a breeding process, changing at least one breeding parameter, dependent on the determination of plant diseases in the plant material.
- Fig. 3 shows an example of an analysis assembly 4 for detecting plant diseases in plant material.
- plant material such as for example plant material from the species Beta vulgaris and/or Solanum tuberosum, in particular sugar beets and/or potatoes
- a receiving device 13 receives plant material from the species Beta vulgaris and/or Solanum tuberosum, in particular sugar beets and/or potatoes
- the plant material is cut and/or crumbled into plant material pieces using a cutting and/or crumbling device 14, comprising a rotating cutting part 16 in a housing 15.
- the plant material pieces fall onto a conveyor belt 5 of a transport device 2.
- the plant material pieces contact the roller 6, they are spread on the conveyor belt 5 and are subject to a compressive force as a function of the distance between the roller 6 and the conveyor belt 5.
- the so-compressed plant material pieces have a smooth surface and a constant height.
- Scrapers 8,19 are provided on the roller 6 and the conveyor belt 5 and continuously clean the roller surface and belt during operation, thus avoiding the cross-mixing of two different plant material pieces for example from different samples. Moreover, a clumping or accumulation of plant material pieces on the conveyor belt 5 and the roller 6 can be ruled out, which could otherwise severely disturb the comparative homogenization of the sample flow.
- a sensor head 9 is arranged with a light source 10 and a sensor 11 for detecting the electromagnetic waves from the smooth surface of the stream of plant material pieces in the wavelength range from 850 nm to 1650 nm.
- the sensor head 9 can be elevated at a fixed distance of 200 to 250 mm to the surface of the smooth flow of plant material pieces and can be pivoted as desired relative to the stream of plant material pieces. In this way, it is possible to sense and record the entire width of the stream of plant material pieces.
- the sensor 11 continuously records reflected electromagnetic waves and transmits it via an optical fiber 17 to a spectrometer 18, which converts the spectrally resolved radiation wavelengths into digitized, the spectral signals at regular intervals of 30 ms.
- a processor 12 By comparison with suitable calibration data, plant diseases can be determined in the plant material.
- Fig. 4 shows an example of several spectral signals 400 obtained from using near-infrared spectroscopy on plant material, wherein in this example the plant material consists of sugar beet pieces.
- electromagnetic waves are emitted towards sugar beet pieces that are arranged on a transport device by using an electromagnetic wave source.
- reflected electromagnetic waves are received by using a sensor, wherein the sensor is arranged for detecting the reflected electromagnetic waves from the surface of the sugar beet pieces.
- the received reflected electromagnetic waves are converted into a spectral signal using a near-infrared spectrometer.
- reflected electromagnetic waves in the wavelength range from 850 nm to 1650 nm are received.
- the absorbance A is plotted versus the wavelength W (in nm).
- W in nm
- the spectral signals 410 represent typical curves representing spectral signals of sugar beet pieces that are not infected with a plant disease.
- the spectral signals 421 and 422 show a deviation of the absorbance, in particular in the range of about 850 nm to 1300 nm. In this region, the absorbance is much lower for the spectral signals 421 and 422 when compared to the spectral signals 410.
- the spectral signals 421 and 422 represent typical curves representing spectral signals of sugar beet pieces that are infected with the plant disease "Rhizoctonia".
- determining the plant disease "Rhizoctonia” can be achieved with an approach based on the slope of the spectral signal in the area of wavelengths between about 870 nm and 910 nm. Determining the slope in this region also allows a raw screening, wherein the screening is robust due to the nearly independence from the reference values and in particular from the absolute values of the absorbance. This is possible because of the significant influence of the plant disease "Rhizoctonia" on the slope in the area of wavelengths between about 870 nm and 910 nm.
- Such spectral signals can be obtained for example by using an analysis assembly as shown in Fig. 3 .
- the method for determining plant diseases can be applied as described in the following example: Sugar beets with RHC (Rhizoctonia) and GTSC (girt scab) symptoms were collected and sorted by a visual scoring, wherein the visual scoring ranges from 1 to 9 with 1 for lowest and 9 for highest severity of visually detectable plant diseases. Each of these classes contained about 10-20 sugar beets. In the laboratory, first whole sugar beets were measured and then the same sugar beets were chopped using a chopping device. Then spectral signals obtained with NIRS were created and evaluated. A calibration was performed by multivariate regression methods between spectral signals and the rating done by visual scoring.
- RHC Rhizoctonia
- GTSC girt scab
- the NIR spectral signal obtained from analysis on chopped sugar beets showed a better match with visual scoring than a NIR spectral signal obtained from non-chopped whole sugar beets.
- RHC the calibration showed good results with low filtering. This can be seen in the following table, were the correlation is indicated by R 2 and for most of the tests lies above 95.
- R 2 is the coefficient of correlation. Different filtering and different count of components were conducted. Filtering component R 2 RHC low 1 95.32 RHC normal 5 97.73 RHC normal 1 89.44 GTSC low 1 96.90 GTSC normal 1 96.36
- the method can be applied for numerous plant diseases such as for example the following listed and described plant diseases that can occur in sugar beets:
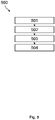
- Fig. 5 shows a schematic representation of an example of a method for generating calibration data for the determination of diseases in plant material.
- the method 500 comprises the steps described in the following.
- a step 501 taking a sample of plant material.
- calibration analysis of the plant material by evaluating plant diseases in the plant material, for example by visual scoring of a plant disease that is present in the plant material.
- spectroscopic analysis of the sample by, preferably continuously, emitting electromagnetic waves towards the sample, receiving electromagnetic waves, and converting the received electromagnetic waves into a spectral signal.
- a step 504 comparing the results of the spectroscopic analysis with the results of the calibration analysis.
Landscapes
- Physics & Mathematics (AREA)
- Life Sciences & Earth Sciences (AREA)
- Chemical & Material Sciences (AREA)
- Health & Medical Sciences (AREA)
- Immunology (AREA)
- Food Science & Technology (AREA)
- Analytical Chemistry (AREA)
- Biochemistry (AREA)
- General Health & Medical Sciences (AREA)
- General Physics & Mathematics (AREA)
- Engineering & Computer Science (AREA)
- Pathology (AREA)
- Spectroscopy & Molecular Physics (AREA)
- Medicinal Chemistry (AREA)
- Investigating Or Analysing Biological Materials (AREA)
Priority Applications (5)
| Application Number | Priority Date | Filing Date | Title |
|---|---|---|---|
| EP21157707.7A EP4047351A1 (de) | 2021-02-17 | 2021-02-17 | Verfahren zum nachweis von durch umweltbelastung in pflanzenmaterial beeinflussbaren pflanzenkrankheiten und physiologischen eigenschaften |
| EP22706290.8A EP4295137A1 (de) | 2021-02-17 | 2022-02-16 | Verfahren zur analyse von pflanzenmaterial, zur bestimmung von pflanzenmaterialkomponenten und zur erkennung von pflanzenkrankheiten in pflanzenmaterial |
| US18/277,357 US20240125711A1 (en) | 2021-02-17 | 2022-02-16 | Methods for analyzing plant material, for determining plant material components and for detecting plant diseases in plant material |
| JP2023549982A JP2024509757A (ja) | 2021-02-17 | 2022-02-16 | 植物材料を分析し、植物材料成分を決定し、植物材料中の植物病害を検出するための方法 |
| PCT/EP2022/053786 WO2022175309A1 (en) | 2021-02-17 | 2022-02-16 | Methods for analyzing plant material, for determining plant material components and for detecting plant diseases in plant material |
Applications Claiming Priority (1)
| Application Number | Priority Date | Filing Date | Title |
|---|---|---|---|
| EP21157707.7A EP4047351A1 (de) | 2021-02-17 | 2021-02-17 | Verfahren zum nachweis von durch umweltbelastung in pflanzenmaterial beeinflussbaren pflanzenkrankheiten und physiologischen eigenschaften |
Publications (1)
| Publication Number | Publication Date |
|---|---|
| EP4047351A1 true EP4047351A1 (de) | 2022-08-24 |
Family
ID=74666641
Family Applications (1)
| Application Number | Title | Priority Date | Filing Date |
|---|---|---|---|
| EP21157707.7A Withdrawn EP4047351A1 (de) | 2021-02-17 | 2021-02-17 | Verfahren zum nachweis von durch umweltbelastung in pflanzenmaterial beeinflussbaren pflanzenkrankheiten und physiologischen eigenschaften |
Country Status (1)
| Country | Link |
|---|---|
| EP (1) | EP4047351A1 (de) |
Cited By (4)
| Publication number | Priority date | Publication date | Assignee | Title |
|---|---|---|---|---|
| CN117807511A (zh) * | 2024-02-29 | 2024-04-02 | 北京佳格天地科技有限公司 | 基于光谱分析的作物病害识别方法及相关装置 |
| CN118626810A (zh) * | 2024-08-14 | 2024-09-10 | 山东省农业技术推广中心(山东省农业农村发展研究中心) | 玉米种子抗逆性数据分析与处理方法 |
| CN121259991A (zh) * | 2025-12-04 | 2026-01-02 | 吉林农业大学 | 一种基于多生理指标协同的草莓灰霉病预警系统及方法 |
| CN121280745A (zh) * | 2025-12-09 | 2026-01-06 | 南京农业大学 | 基于时序图像分析的镉砷复合污染植物响应动态监测系统 |
Citations (3)
| Publication number | Priority date | Publication date | Assignee | Title |
|---|---|---|---|---|
| EP1894461A1 (de) * | 2006-08-31 | 2008-03-05 | Monsanto Agrar Deutschland GmbH | System zur Echtzeit-Analyse von Silagefutter |
| US20120293801A1 (en) * | 2011-05-20 | 2012-11-22 | Seiko Epson Corporation | Feature value estimation device and corresponding method, and spectral image processing device and corresponding method |
| US20190041334A1 (en) * | 2016-03-31 | 2019-02-07 | Foss Analytical A/S | System for and method of performing laser induced breakdown spectroscopy |
-
2021
- 2021-02-17 EP EP21157707.7A patent/EP4047351A1/de not_active Withdrawn
Patent Citations (3)
| Publication number | Priority date | Publication date | Assignee | Title |
|---|---|---|---|---|
| EP1894461A1 (de) * | 2006-08-31 | 2008-03-05 | Monsanto Agrar Deutschland GmbH | System zur Echtzeit-Analyse von Silagefutter |
| US20120293801A1 (en) * | 2011-05-20 | 2012-11-22 | Seiko Epson Corporation | Feature value estimation device and corresponding method, and spectral image processing device and corresponding method |
| US20190041334A1 (en) * | 2016-03-31 | 2019-02-07 | Foss Analytical A/S | System for and method of performing laser induced breakdown spectroscopy |
Non-Patent Citations (9)
| Title |
|---|
| B. SHAWT.H. THOMASD.T. COOKE: "Responses of sugar beet (Beta vulgaris L.) to drought and nutrient deficiency stress", PLANT GROWTH REGULATION, vol. 37, 2002, pages 77 - 83 |
| BALMER ET AL., THE PLANT JOURNAL, vol. 74, 2013, pages 213 - 225 |
| I. YORDANOVV. VELIKOVAT. TSONEV: "Plant response to drought, acclimation, and stress tolerance", PHOTOSYNTETICA, vol. 38, no. 1, 2000, pages 171 - 186 |
| J. BUDDEMEYERB. MARLANDER, JOURNAL OF PLANT DISEASES AND PROTECTION, vol. 112, no. 2, 2005, pages 105 - 117 |
| KARSSEMEIJER ET AL., PLANT CELL ENVIRON, vol. 43, 2020, pages 775 - 786 |
| LEI LI ET AL: "A Review of Imaging Techniques for Plant Phenotyping", SENSORS, vol. 14, no. 11, 24 October 2014 (2014-10-24), pages 20078 - 20111, XP055294910, DOI: 10.3390/s141120078 * |
| LI DAOLIANG ET AL: "Modern imaging techniques in plant nutrition analysis: A review", COMPUTERS AND ELECTRONICS IN AGRICULTURE, ELSEVIER, AMSTERDAM, NL, vol. 174, 16 May 2020 (2020-05-16), XP086173404, ISSN: 0168-1699, [retrieved on 20200516], DOI: 10.1016/J.COMPAG.2020.105459 * |
| NCAMA KHAYELIHLE ET AL: "Non-destructive prediction of 'Marsh' grapefruit susceptibility to postharvest rind pitting disorder using reflectance Vis/NIR spectroscopy", SCIENTIA HORTICULTURAE, ELSEVIER, AMSTERDAM, NL, vol. 231, 5 January 2018 (2018-01-05), pages 265 - 271, XP085349290, ISSN: 0304-4238, DOI: 10.1016/J.SCIENTA.2017.12.028 * |
| YANG ET AL., J. AGRIC. FOOD CHEM., vol. 67, no. 19, 2019, pages 5465 - 5476 |
Cited By (5)
| Publication number | Priority date | Publication date | Assignee | Title |
|---|---|---|---|---|
| CN117807511A (zh) * | 2024-02-29 | 2024-04-02 | 北京佳格天地科技有限公司 | 基于光谱分析的作物病害识别方法及相关装置 |
| CN117807511B (zh) * | 2024-02-29 | 2024-04-26 | 北京佳格天地科技有限公司 | 基于光谱分析的作物病害识别方法及相关装置 |
| CN118626810A (zh) * | 2024-08-14 | 2024-09-10 | 山东省农业技术推广中心(山东省农业农村发展研究中心) | 玉米种子抗逆性数据分析与处理方法 |
| CN121259991A (zh) * | 2025-12-04 | 2026-01-02 | 吉林农业大学 | 一种基于多生理指标协同的草莓灰霉病预警系统及方法 |
| CN121280745A (zh) * | 2025-12-09 | 2026-01-06 | 南京农业大学 | 基于时序图像分析的镉砷复合污染植物响应动态监测系统 |
Similar Documents
| Publication | Publication Date | Title |
|---|---|---|
| EP4047351A1 (de) | Verfahren zum nachweis von durch umweltbelastung in pflanzenmaterial beeinflussbaren pflanzenkrankheiten und physiologischen eigenschaften | |
| Yan et al. | Combining multi-dimensional convolutional neural network (CNN) with visualization method for detection of aphis gossypii glover infection in cotton leaves using hyperspectral imaging | |
| Susič et al. | Discrimination between abiotic and biotic drought stress in tomatoes using hyperspectral imaging | |
| US20240125711A1 (en) | Methods for analyzing plant material, for determining plant material components and for detecting plant diseases in plant material | |
| Simko et al. | Phenomic approaches and tools for phytopathologists | |
| Al-Saddik et al. | Assessment of the optimal spectral bands for designing a sensor for vineyard disease detection: the case of ‘Flavescence dorée’ | |
| Rady et al. | Hyperspectral imaging for detection of codling moth infestation in GoldRush apples | |
| George et al. | Sustainable sweetpotato production in the United States: Current status, challenges, and opportunities | |
| Furuya et al. | Prediction of insect-herbivory-damage and insect-type attack in maize plants using hyperspectral data | |
| Park et al. | Hyperspectral reflectance imaging for nondestructive evaluation of root rot in Korean ginseng (Panax ginseng Meyer) | |
| Poolsawat et al. | Laboratory and field evaluations of resistance to Sphaceloma ampelinum causing anthracnose in grapevine | |
| Venugopal et al. | Edge effects influence the abundance of the invasive Halyomorpha halys (Hemiptera: Pentatomidae) in woody plant nurseries | |
| Fonseca de Oliveira et al. | An approach using emerging optical technologies and artificial intelligence brings new markers to evaluate peanut seed quality | |
| Punnuri et al. | Genome-wide association mapping of resistance to the sorghum aphid in Sorghum bicolor | |
| Goffnett et al. | Preharvest herbicide treatments affect black bean desiccation, yield, and canned bean color | |
| Galieni et al. | Surveying soil-borne disease development on wild rocket salad crop by proximal sensing based on high-resolution hyperspectral features | |
| Panda et al. | Multi-environment evaluation of rice genotypes: impact of weather and culm biochemical parameters against sheath blight infection | |
| Siegwart et al. | Differentiating oriental fruit moth and codling moth (Lepidoptera: Tortricidae) larvae using near-infrared spectroscopy | |
| Zerdoner et al. | Detection of Botrytis cinerea severity in rose petals using hyperspectral imaging for plant breeding applications | |
| Brown et al. | Presymptomatic leaf reflectance of fusarium virguliforme-infected soybean plants in greenhouse conditions | |
| EFSA Panel on Plant Health (PLH) et al. | Pest risk assessment of African Leucinodes species for the European Union | |
| Prasetyo et al. | Detection of Fusarium spp. infection in potato (Solanum tuberosum L.) during postharvest storage through visible–near-infrared and shortwave–near-infrared reflectance spectroscopy | |
| Andidi | High-Throughput Phenotyping to Evaluate Metribuzin Sensitivity of Potato (Solanum tuberosum L.) | |
| Shrestha et al. | Employing Spectral Features to Accelerate Sorghum Phenotyping Against Sap‐Feeding Aphids | |
| Pinto | Peanut plant response to lepidopterous pests defoliation and determination of the economic injury level |
Legal Events
| Date | Code | Title | Description |
|---|---|---|---|
| PUAI | Public reference made under article 153(3) epc to a published international application that has entered the european phase |
Free format text: ORIGINAL CODE: 0009012 |
|
| STAA | Information on the status of an ep patent application or granted ep patent |
Free format text: STATUS: THE APPLICATION HAS BEEN PUBLISHED |
|
| AK | Designated contracting states |
Kind code of ref document: A1 Designated state(s): AL AT BE BG CH CY CZ DE DK EE ES FI FR GB GR HR HU IE IS IT LI LT LU LV MC MK MT NL NO PL PT RO RS SE SI SK SM TR |
|
| STAA | Information on the status of an ep patent application or granted ep patent |
Free format text: STATUS: THE APPLICATION IS DEEMED TO BE WITHDRAWN |
|
| 18D | Application deemed to be withdrawn |
Effective date: 20230225 |