EP4047352A1 - Dispositif d'analyse de signal électromagnétique et programme d'analyse de signal électromagnétique - Google Patents
Dispositif d'analyse de signal électromagnétique et programme d'analyse de signal électromagnétique Download PDFInfo
- Publication number
- EP4047352A1 EP4047352A1 EP20877927.2A EP20877927A EP4047352A1 EP 4047352 A1 EP4047352 A1 EP 4047352A1 EP 20877927 A EP20877927 A EP 20877927A EP 4047352 A1 EP4047352 A1 EP 4047352A1
- Authority
- EP
- European Patent Office
- Prior art keywords
- fitting
- water vapor
- liquid
- property
- frequency
- Prior art date
- Legal status (The legal status is an assumption and is not a legal conclusion. Google has not performed a legal analysis and makes no representation as to the accuracy of the status listed.)
- Withdrawn
Links
- 238000004458 analytical method Methods 0.000 title claims abstract description 39
- 239000007788 liquid Substances 0.000 claims abstract description 227
- 238000001228 spectrum Methods 0.000 claims abstract description 168
- XLYOFNOQVPJJNP-UHFFFAOYSA-N water Chemical compound O XLYOFNOQVPJJNP-UHFFFAOYSA-N 0.000 claims abstract description 158
- 230000006870 function Effects 0.000 claims abstract description 119
- 238000012545 processing Methods 0.000 claims abstract description 90
- 238000010521 absorption reaction Methods 0.000 claims abstract description 74
- 230000003595 spectral effect Effects 0.000 claims abstract description 32
- 239000002131 composite material Substances 0.000 claims abstract description 24
- 238000005315 distribution function Methods 0.000 claims description 61
- 238000002835 absorbance Methods 0.000 description 22
- 238000010586 diagram Methods 0.000 description 21
- 239000012530 fluid Substances 0.000 description 12
- 238000005259 measurement Methods 0.000 description 5
- 238000004364 calculation method Methods 0.000 description 4
- 230000003287 optical effect Effects 0.000 description 4
- 230000008859 change Effects 0.000 description 3
- 238000000034 method Methods 0.000 description 3
- 230000005855 radiation Effects 0.000 description 3
- 238000004891 communication Methods 0.000 description 2
- 230000001186 cumulative effect Effects 0.000 description 2
- 230000009878 intermolecular interaction Effects 0.000 description 2
- 238000010801 machine learning Methods 0.000 description 2
- 230000008569 process Effects 0.000 description 2
- 239000002904 solvent Substances 0.000 description 2
- 238000004611 spectroscopical analysis Methods 0.000 description 2
- 239000000126 substance Substances 0.000 description 2
- 238000012549 training Methods 0.000 description 2
- 238000004566 IR spectroscopy Methods 0.000 description 1
- 238000001514 detection method Methods 0.000 description 1
- 230000000694 effects Effects 0.000 description 1
- 238000005516 engineering process Methods 0.000 description 1
- 229910052739 hydrogen Inorganic materials 0.000 description 1
- 239000001257 hydrogen Substances 0.000 description 1
- 230000003993 interaction Effects 0.000 description 1
- 230000005693 optoelectronics Effects 0.000 description 1
- 230000000704 physical effect Effects 0.000 description 1
- 238000012827 research and development Methods 0.000 description 1
- 230000004044 response Effects 0.000 description 1
- 239000004065 semiconductor Substances 0.000 description 1
- 238000000926 separation method Methods 0.000 description 1
- 238000002834 transmittance Methods 0.000 description 1
Images


Classifications
-
- G—PHYSICS
- G01—MEASURING; TESTING
- G01N—INVESTIGATING OR ANALYSING MATERIALS BY DETERMINING THEIR CHEMICAL OR PHYSICAL PROPERTIES
- G01N21/00—Investigating or analysing materials by the use of optical means, i.e. using sub-millimetre waves, infrared, visible or ultraviolet light
- G01N21/17—Systems in which incident light is modified in accordance with the properties of the material investigated
- G01N21/25—Colour; Spectral properties, i.e. comparison of effect of material on the light at two or more different wavelengths or wavelength bands
- G01N21/31—Investigating relative effect of material at wavelengths characteristic of specific elements or molecules, e.g. atomic absorption spectrometry
- G01N21/35—Investigating relative effect of material at wavelengths characteristic of specific elements or molecules, e.g. atomic absorption spectrometry using infrared light
- G01N21/3581—Investigating relative effect of material at wavelengths characteristic of specific elements or molecules, e.g. atomic absorption spectrometry using infrared light using far infrared light; using Terahertz radiation
-
- G—PHYSICS
- G01—MEASURING; TESTING
- G01N—INVESTIGATING OR ANALYSING MATERIALS BY DETERMINING THEIR CHEMICAL OR PHYSICAL PROPERTIES
- G01N21/00—Investigating or analysing materials by the use of optical means, i.e. using sub-millimetre waves, infrared, visible or ultraviolet light
- G01N21/17—Systems in which incident light is modified in accordance with the properties of the material investigated
- G01N21/25—Colour; Spectral properties, i.e. comparison of effect of material on the light at two or more different wavelengths or wavelength bands
- G01N21/31—Investigating relative effect of material at wavelengths characteristic of specific elements or molecules, e.g. atomic absorption spectrometry
- G01N21/35—Investigating relative effect of material at wavelengths characteristic of specific elements or molecules, e.g. atomic absorption spectrometry using infrared light
- G01N21/3577—Investigating relative effect of material at wavelengths characteristic of specific elements or molecules, e.g. atomic absorption spectrometry using infrared light for analysing liquids, e.g. polluted water
Definitions
- the present invention relates to an electromagnetic signal analysis apparatus and electromagnetic signal analysis program and, in particular, relates to an apparatus to analyze a property of electromagnetic waves via a liquid sample disposed on an optical path of a spectral device, and a program adopted for this.
- a spectral device causes electromagnetic waves to be transmitted through or reflected off a sample so as to measure physical properties or chemical properties of the sample from a change of the electromagnetic waves that is generated by interaction of the electromagnetic waves and the sample.
- a frequency spectrum of the sample observed by this spectral measurement has a spectrum structure inherent in the sample.
- terahertz waves which is one kind of electromagnetic waves, intermolecular interaction caused by hydrogen bonding, for example, is observed.
- a terahertz wave analysis apparatus whereby terahertz waves are transmitted through or reflected off a liquid sample to be measured that is disposed on an optical path, and the terahertz waves thus applied to the liquid sample are detected by a spectral device so that a terahertz wave signal thus obtained is analyzed to make it possible to clearly visualize a characteristic in accordance with a property of the liquid sample (see, for example, patent document 1).
- a composite waveform of a plurality of fitting functions is fitted to a frequency spectrum obtained from the terahertz wave signal, and a graph is generated using, as parameters, at least two values that determine characteristics of the plurality of fitting functions employed for this fitting.
- an electromagnetic signal analysis apparatus analyzes an electromagnetic signal obtained by a spectral device to detect electromagnetic waves transmitted through or reflected off a liquid sample in a film state that is generated in a space by ejecting a liquid from a nozzle.
- the electromagnetic signal analysis apparatus fits a waveform of a single fitting function or a composite waveform of a plurality of fitting functions to a frequency spectrum at a water vapor absorption frequency, which is a frequency at which absorption of the electromagnetic waves by water vapor is increased, the frequency spectrum at the water vapor absorption frequency being part of a frequency spectrum that is generated based on the electromagnetic signal and represents a property value with respect to a frequency, and the electromagnetic signal analysis apparatus analyzes a property of the liquid sample using at least two values that determine a characteristic of the fitting function used for this fitting.
- the film-state liquid sample is generated in the space by ejecting the liquid from the nozzle, the water vapor is generated from surfaces of the liquid sample, and the electromagnetic waves are transmitted through the water vapor as well. Since this water vapor includes the property of the liquid sample, processing of the frequency spectrum at the frequency at which absorption of the electromagnetic waves by the water vapor is increased makes it possible to analyze the property of the liquid sample. Besides, the frequency spectrum of the water vapor has a peak clear and sharp and accordingly so easy to read that analysis is relatively easy.
- the frequency spectrum caused by the water vapor generated from the liquid sample is approximated by the waveform of the single fitting function or the composite waveform of the plurality of fitting functions in such a manner that the property of the liquid sample is succeeded, and the property of the liquid sample is analyzed based on values concerning the fitting function used for the approximation.
- the electromagnetic signal detected by the spectral device is subjected to analysis that positively utilizes absorption of the electromagnetic waves by the water vapor so that the characteristic inherent in the liquid sample can be easily detected.
- FIG. 1 is a block diagram illustrating a functional configuration example of an electromagnetic signal analysis apparatus according to this embodiment.
- An electromagnetic signal analysis apparatus 10 analyzes an electromagnetic signal obtained by a spectral device 20 as to a liquid sample, and includes, as a functional configuration, a frequency spectrum obtaining unit 11, a water vapor fitting processing unit 12, a liquid fitting processing unit 13, and a property analyzing unit 14.
- the electromagnetic wave to be analyzed by the electromagnetic signal analysis apparatus 10 is, for example, a terahertz wave, infrared radiation, visible radiation, and ultraviolet radiation, and any other electromagnetic wave may be analyzed insofar as the electromagnetic wave includes a frequency band absorbed by water vapor.
- a terahertz wave in particular, because an intermolecular interaction generated in a liquid sample in response to the terahertz wave has a complicated process, spectra observed by spectral measurement overlap one another by such a high degree that it is difficult to extract a peak of a specific frequency as compared with infrared spectroscopy and optoelectronic spectroscopy.
- the electromagnetic signal analysis apparatus 10 can analyze such a terahertz wave signal.
- any of hardware, a DSP (Digital Signal Processor), and software can constitute each of the function blocks 11 to 14.
- each of the function blocks 11 to 14 actually includes a CPU, a RAM, a ROM, and the like of a computer and is implemented by operating an electromagnetic signal analysis program stored in recording media such as the RAM, the ROM, a hard disk, or a semiconductor memory.
- the frequency spectrum obtaining unit 11 obtains a frequency spectrum representing a property value with respect to a frequency that is generated based on an electromagnetic signal detected by the spectral device 20.
- a frequency spectrum representing absorbance as one example of the property value is obtained.
- the frequency spectrum obtaining unit 11 may obtain a frequency spectrum detected by the spectral device 20 or the frequency spectrum obtaining unit 11 itself may generate a frequency spectrum based on an electromagnetic signal generated by the spectral device 20 so as to obtain the frequency spectrum.
- the spectral device 20 causes electromagnetic waves to be transmitted through or reflected off a liquid sample to be measured that is disposed on an optical path and detects the electromagnetic waves thus applied to the liquid sample.
- various known types may be employed as the spectral device 20.
- the spectral device 20 for use in this embodiment includes a predetermined nozzle and ejects a liquid from this nozzle to generate a film state of the liquid sample in a space (above a path of the electromagnetic waves).
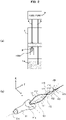
- Fig. 2 is diagrams illustrating a configuration example of a liquid film generation device for use in this embodiment.
- the liquid film generation device includes a container 1, a liquid film cartridge 2, a tube pump 3, an outgoing tube 4, and an incoming tube 5.
- the container 1 includes a collection tank 1a of the liquid.
- the liquid film cartridge 2 includes a nozzle 21 (see Fig. 2(b) ) to eject the liquid and generate a liquid film (hereinafter referred to as a sample liquid film 100).
- the tube pump 3 takes in by suction the liquid to be measured from the collection tank 1a via the incoming tube 5, pressurizes the intake liquid, and discharges the liquid to the liquid film cartridge 2 via the outgoing tube 4.
- the liquid film cartridge 2 ejects, from the nozzle 21, the liquid discharged from the collection tank 1a by the tube pump 3 so as to generate the sample liquid film 100 of a sheet shape having planar surfaces in a space. Side surfaces of the container 1 and the liquid film cartridge 2 have holes close to a height where the sample liquid film 100 is formed. Via the holes, electromagnetic waves are transmitted through the sample liquid film 100.
- the collection tank 1a collects and stores the liquid that flows down from the liquid film cartridge 2.
- the liquid stored in the collection tank 1a is taken in by suction again by the tube pump 3, pressurized, and ejected from the nozzle 21 of the liquid film cartridge 2. In this manner, the liquid in the collection tank 1a circulates, and the sample liquid film 100 is generated by the nozzle 21 in the process of circulation of the liquid.
- Fig. 2(b) is a diagram illustrating the sample liquid film 100 generated by the nozzle 21.
- three-dimensional coordinate axes that define a space are represented by x-y-z.
- a center axis 21a of the nozzle 21 is supposed to be oriented in a y-axis direction.
- a distal end of the nozzle 21 has a slit-shaped opening 21b perpendicular to the center axis 21a, and this slit is supposed to be parallel to an x-axis.
- the liquid ejected from the opening 21b provided in the distal end of the nozzle 21 successively forms a plurality of liquid film planes 101 to 103 perpendicular to one another.
- the first liquid film plane 101 is formed of the liquid ejected from the opening 21b of the nozzle 21 between two string-like fluid columns 111 that flow in a z-y plane due to surface tension of the liquid. That is, the two string-like fluid columns 111 flowing in a smooth arc collide at a fluid column concurrence 121, and form the first liquid film plane 101 between the opening 21b of the nozzle 21 and the fluid column concurrence 121 due to surface tension of the liquid. Consequently, the first liquid film plane 101 is a plane perpendicular to the x-axis and parallel to the z-y plane.
- the second liquid film plane 102 is formed between the first fluid column concurrence 121 and the second fluid column concurrence 122 due to surface tension of the liquid. Consequently, the second liquid film plane 102 is perpendicular to the first liquid film plane 101, and is a plane perpendicular to the x-axis and parallel to the x-y plane.
- the third liquid film plane 103 is formed between the second fluid column concurrence 122 and a third fluid column concurrence 123 due to surface tension of the liquid.
- the third liquid film plane 103 is perpendicular to the second liquid film plane 102, and is a plane perpendicular to the x-axis and parallel to the z-y plane.
- the spectral device 20 causes electromagnetic waves to be transmitted through or reflected off the first liquid film plane 101.
- This first liquid film plane 101 corresponds to the "liquid sample" in the scope of claims.
- liquid film generation device and the nozzle 21 described here is one example and this is not limitative. Any device and any nozzle may be used in this embodiment insofar as the device and the nozzle can generate a liquid film in a space by ejection of the liquid as illustrated in Fig. 2(b) .
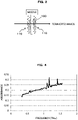
- Fig. 3 is a diagram illustrating how water vapor is generated around the liquid sample generated by the nozzle 21.
- the sample liquid film 100 the liquid sample
- water vapor 110 is generated from surfaces of the sample liquid film 100. Electromagnetic waves advancing on the optical path of the spectral device 20 are transmitted through the water vapor 110 as well and transmitted through or reflected off the sample liquid film 100.
- Fig. 4 is a diagram illustrating one example of a frequency spectrum obtained by the frequency spectrum obtaining unit 11.
- a vertical axis represents absorbance while a horizontal axis represents frequency, and the frequency spectrum in a range of 0 to 2 THz is illustrated.
- the frequency spectrum has a different waveform in accordance with each of liquid samples of different properties. It is difficult to specify where in the waveform a characteristic of the liquid sample appears or in what waveform the characteristic of the liquid sample appears.
- the electromagnetic signal analysis apparatus 10 analyzes this frequency spectrum to clearly exhibit a characteristic in accordance with a property of the liquid sample.
- the water vapor fitting processing unit 12 performs processing to fit a waveform of a single fitting function or a composite waveform of a plurality of fitting functions to a frequency spectrum at a frequency at which absorption of the electromagnetic waves by water vapor is increased, the frequency spectrum at the frequency being part of the frequency spectrum obtained by the frequency spectrum obtaining unit 11.
- the frequency at which absorption of the electromagnetic waves by water vapor is increased will be referred to as “water vapor absorption frequency”
- the frequency spectrum at the water vapor absorption frequency that is generated by the water vapor fitting processing unit 12 will be referred to as "water vapor spectrum”.
- NICT National Research and Development Agency: The National Institute of Information and Communications Technology
- the NICT discloses data of a radio wave attenuation factor of air (including water vapor) to the public.
- a database of HITRANonline disclosed on a website to the public may be employed. Use of such data makes it possible to specify the frequency at which absorption of electromagnetic waves by water vapor is increased.
- Fig. 4 exhibits some frequencies at which peaks of the absorbance are high in extremal manners, and these are the water vapor absorption frequencies.
- the water vapor fitting processing unit 12 performs fitting using, as one example of the fitting function, a plurality of normal distribution functions (Gaussian functions) each having a center frequency, an amplitude, and a width at least one of which is different. That is, the water vapor fitting processing unit 12 individually fits waveforms of the plurality of normal distribution functions each having a center frequency, an amplitude, and a width (such as 1/e width) at least one of which is different to frequency spectra at the plurality of water vapor absorption frequencies in the frequency spectrum obtained by the frequency spectrum obtaining unit 11.
- a plurality of normal distribution functions Gausian functions
- the water vapor fitting processing unit 12 calculates a normal distribution function that minimizes a residual between a value of absorbance at each frequency and a value of a waveform of a normal distribution function at each frequency corresponding to the value of absorbance by optimizing calculation using the center frequency, the amplitude, and the width as variables with respect to each of the plurality of water vapor absorption frequencies.
- the water vapor spectrum generated by the optimizing calculation by the water vapor fitting processing unit 12 can be represented by the following (formula 1).
- ⁇ i a water vapor absorption frequency
- I i an absorbance at the water vapor absorption frequency
- ⁇ 0i a center frequency of a normal distribution function
- a 0i represents an amplitude of the normal distribution function
- a 1i represents a width of the normal distribution function.
- Fig. 5 is a diagram illustrating an example of the water vapor spectrum generated by the water vapor fitting processing unit 12.
- frequency spectra around the plurality of water vapor absorption frequencies at which the peaks of absorbance are extremally high in the whole frequency spectrum illustrated in Fig. 4 are individually approximated by waveforms of a plurality of normal distribution functions.
- the water vapor spectrum illustrated in Fig. 5 illustrates waveforms only of the peak components of absorbance at the plurality of water vapor absorption frequencies.
- the absorbance of the water vapor spectrum illustrated in Fig. 5 indicates a difference value of intensity from a reference value at each of the water vapor absorption frequencies.
- the reference value is a value of absorbance that corresponds to a fundamental portion (base portion) of a waveform that shapes a peak.
- each of absorbances at the plurality of water vapor absorption frequencies is used as the reference value at the plurality of water vapor absorption frequencies.
- the example is described in which the waveform of the single normal distribution function is fitted to the frequency spectrum at the single water vapor absorption frequency (a single peak waveform).
- a composite waveform of a plurality of normal distribution functions may be fitted to the frequency spectrum at the single water vapor absorption frequency.
- the fitting may be performed with the composite waveform.
- the liquid fitting processing unit 13 performs processing to fit the composite waveform of the plurality of fitting functions to the frequency spectrum except for peak components at the water vapor absorption frequencies in the frequency spectrum obtained by the frequency spectrum obtaining unit 11.
- the frequency spectrum generated by the liquid fitting processing unit 13 will be referred to as "liquid spectrum”.
- the liquid fitting processing unit 13 performs fitting with a polynomial function including a plurality of terms as the plurality of fitting functions. That is, the liquid fitting processing unit 13 fits a composite waveform of waveforms respectively specified by terms of orders in a polynomial of an n-th order (n > 1) to the frequency spectrum that is part of the frequency spectrum obtained by the frequency spectrum obtaining unit 11 and from which the peak components as to the water vapor absorption frequencies are separated.
- the terms of orders in the polynomial of the n-th order are equivalent to the "plurality of fitting functions".
- the liquid fitting processing unit 13 calculates the coefficients of the plurality of terms in the polynomial function by optimizing calculation so as to minimize a residual between a value of absorbance at each frequency and a value of a composite waveform (a value of the polynomial function) at each frequency that corresponds to the value of absorbance.
- the liquid spectrum generated by optimizing calculation by the liquid fitting processing unit 13 can be represented by the following (formula 2).
- x represents a variable of a single-variable polynomial (a polynomial having only one indeterminate) and indicates a frequency here.
- Fig. 6 is a diagram illustrating one example of the liquid spectrum generated by the liquid fitting processing unit 13.
- the liquid spectrum generated by the liquid fitting processing unit 13 is the frequency spectrum that has no peak components of absorbance at the water vapor absorption frequencies in the whole frequency spectrum illustrated in Fig. 4 and that is approximated by the composite waveform of the polynomial function.
- Fig. 7 is a diagram illustrating one example of this whole fitting spectrum. That is, in this embodiment, the frequency spectrum as illustrated in Fig. 4 that is obtained by the frequency spectrum obtaining unit 11 is fitted by a frequency spectrum that is a combination of the water vapor spectrum and the liquid spectrum as in the following formula:
- Whole fitting spectrum Water vapor spectrum + Liquid spectrum
- the water vapor fitting processing unit 12 and the liquid fitting processing unit 13 are illustrated as different function blocks, the water vapor spectrum and the liquid spectrum can be simultaneously calculated to obtain the whole fitting spectrum.
- the property analyzing unit 14 analyzes the property of the liquid sample using at least two values including values that determine characteristics of the plurality of fitting functions used for the fitting by the water vapor fitting processing unit 12 and values that determine characteristics of the plurality of fitting functions used for the fitting by the liquid fitting processing unit 13.
- the values that determine the characteristics of the plurality of fitting functions used for the fitting by the water vapor fitting processing unit 12 are the center frequencies, the amplitudes, and the widths (values ⁇ 0i , a 0i , and a 1i in (formula 1) above) of the plurality of normal distribution functions.
- the values that determine the characteristics of the plurality of fitting functions used for the fitting by the liquid fitting processing unit 13 are the coefficients of the polynomial function (value b j in (formula 2) above).
- the property analyzing unit 14 analyzes the property of the liquid sample using at least two of these values ⁇ 0i , a 0i , a 1i , and b j .
- the property analyzing unit 14 may analyze the property of the liquid sample using at least two of the center frequencies ⁇ 0i , the amplitudes a 0i , and the widths a 1i of the plurality of normal distribution functions used for the fitting by the water vapor fitting processing unit 12.
- the property analyzing unit 14 may analyze the property of the liquid sample using at least two of the coefficients b j of the polynomial function used for the fitting by the liquid fitting processing unit 13.
- the property analyzing unit 14 may analyze the property of the liquid sample using at least one of the center frequencies ⁇ 0i , the amplitudes a 0i , and the widths a 1i of the plurality of normal distribution functions used for the fitting by the water vapor fitting processing unit 12 and at least one of the coefficients b j of the polynomial function used for the fitting by the liquid fitting processing unit 13.
- the content of analysis performed by the property analyzing unit 14 is, for example, predetermined statistical processing or functional processing using the above-described at least two values.
- the at least two values used for the statistical processing or the functional processing are the value that determines the characteristic of the plurality of fitting functions used for generation of the water vapor spectrum and the value that determines the characteristic of the plurality of fitting functions used for generation of the liquid spectrum, and both of these values are values that reflect the property of the liquid sample. Consequently, a value that results from the predetermined statistical processing or functional processing using these values is an inherent value that reflects the property of the liquid sample.
- the property of the liquid sample can be identified and liquid samples having the same or similar property can be classified.
- analysis can be performed to detect a change of the property of the liquid sample.
- the property analyzing unit 14 can perform analysis of inputting the above-described at least two values calculated from a liquid sample having an unknown property into a learned model (predicted model) generated by machine learning using a plurality of training data so as to output data indicative of the property of the liquid sample from the predicted model.
- a learned model predicted model
- properties such as a concentration of a specific solvent or dissolvent in a solution, a kind of the solvent or dissolvent contained in the solution, and presence of foreign matter that has gotten mixed in a reference liquid, can be analyzed using the predicted model generated by the machine learning.
- the properties of the liquid sample described here as analysis targets is one example, and this is not limitative.
- the property analyzing unit 14 may generate a predetermined graph using the above-described at least two values as parameters. For example, the property analyzing unit 14 may generate a graph illustrating a relationship between at least two of the center frequencies ⁇ 0i , the amplitudes a 0i , and the widths a 1i of the plurality of normal distribution functions used for generating the water vapor spectrum.
- the property analyzing unit 14 may calculate an area A i of a predetermined region of a normal distribution waveform (a waveform region having an amplitude equal to or larger than 1/e width) from an amplitude a 0j and a width a 1j of each of the plurality of normal distribution functions, and may generate a graph illustrating a relationship between the center frequency ⁇ 0i and the area A i .
- the property analyzing unit 14 may calculate a ratio R xy of an amplitude a 0x or a width a 1x (x is one of 1 to i) of the normal distribution function as the reference to an amplitude a 0y or a width a 1y (y is one of 1 to i; x ⁇ y) of another normal distribution function (the ratio R xy is equivalent to a value indicative of balance between peaks concerning the amplitude a 0i or the width a 1i that characterizes a waveform of a peak component at each water vapor absorption frequency) with respect to each of the plurality of center frequencies ⁇ 0y , and may generate a graph illustrating a relationship between the center frequency ⁇ 0y and the ratio R xy .
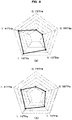
- Fig. 8 is diagrams illustrating one example of graphs generated by the property analyzing unit 14.
- the graphs illustrated in Fig. 8 are radar charts using, as axes, five of the center frequencies ⁇ 0i (indicative of values substantially approximate to center frequencies of the plurality of water vapor absorption frequencies) of the plurality of normal distribution functions used for generating the water vapor spectrum, with the amplitude a 0i , the width a 1i , or the area A i being indicated as values of each of the axes.
- the radar charts in Fig. 8 are examples of radar charts generated when terahertz waves are used as one example of the electromagnetic waves, and five values of the center frequencies ⁇ 0i , namely, 0.75 THz, 0.99 THz, 1.10 THz, 1.16 THz, and 1.41 THz, are used as the axes.
- the five center frequencies ⁇ 0i used here correspond to water vapor absorption frequencies at which terahertz waves are absorbed by a large degree, that is, water vapor absorption frequencies having high peaks.
- a graph may be generated using values concerning the water vapor absorption frequencies at which absorbance is a predetermined value or higher in the water vapor spectrum generated as illustrated in Fig. 5 . All values concerning the plurality of water vapor absorption frequencies may be used to generate a graph.
- a graph may be generated using values concerning a water vapor absorption frequency freely selected from the plurality of water vapor absorption frequencies by a user.
- the radar chart illustrated in Fig. 8(a) is generated from a terahertz wave signal related to a certain liquid sample.
- the radar chart illustrated in Fig. 8(b) is generated from a terahertz wave signal related to a different liquid sample.
- the graphs generated by the property analyzing unit 14 reflect a difference of properties of liquid samples, and the difference of properties clearly appears as a difference of shapes of the graphs.
- characteristics in accordance with the properties of the liquid samples can be explicitly visualized in the forms of the graphs. For example, a characteristic of a liquid sample that has been perceived only by human senses before can be objectively visualized as a form of a radar chart.
- a ratio R i of an amplitude a 0i or a width a 1i of a normal distribution function calculated based on a frequency spectrum of one liquid sample and an amplitude a 0i or a width a 1i of a normal distribution function calculated based on a frequency spectrum of the other liquid sample may be calculated to generate a graph illustrating a relationship between the center frequency ⁇ 0i and the ratio R i .
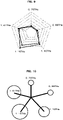
- a plurality of radar charts generated from a plurality of electromagnetic signals may be superposed on one another to be visualized.
- Fig. 9 is a diagram illustrating one example of this.
- a plurality of radar charts obtained by analyzing frequency spectra of an identical liquid sample that are measured by the spectral device 20 a plurality of times at intervals are superposed on one another to be visualized. This example visualizes how a property of the liquid sample changes as time elapses.
- the example of Fig. 9 is a representation of a state change of the single liquid sample in accordance with a time elapse using the plurality of radar charts.
- a plurality of radar charts generated from a plurality of liquid samples may be superposed on one another to be visualized.
- the plurality of liquid samples have an identical property
- the plurality of radar charts generated have substantially the same shapes overlapping one another.
- the radar charts generated have different shapes.
- radar charts when radar charts are generated as to a plurality of liquid samples having unknown properties, it can be easily determined whether the liquid samples share an identical property or have different properties.
- radar charts are individually generated from a single liquid sample having a known property and a plurality of liquid samples having unknown properties, liquid samples having the same known property can be easily identified.
- a ratio R it of an amplitude a 0i or a width a 1i of a normal distribution function calculated based on a frequency spectrum of a liquid sample at a certain point in time and an amplitude a 0i or a width a 1i of a normal distribution function calculated based on a frequency spectrum of the liquid sample at a different point in time may be calculated with respect to each of the plurality of center frequencies ⁇ 0i so as to generate a graph illustrating a relationship between the center frequency ⁇ 0i and the ratio R it .
- a mode of the graphs generated is not limited to radar charts.
- line graphs, column charts, and scattergrams may be generated.
- Pie charts of an amplitude, a width, or an area with respect to each of center frequencies may be generated.
- Bubble charts may be generated in which a vertical axis represents the amplitude, and a horizontal axis represents the width while sizes of circles represent the center frequencies.
- Graphs (such as radar charts, line graphs, column charts, and scattergrams) illustrating a relationship between an amplitude and a width may be generated while center frequencies as a graph element are excluded.
- a branch chart as illustrated in Fig. 10 may be generated.
- a plurality of axes represent the plurality of center frequencies ⁇ 0i
- a length of each of the axes represents one of the amplitude a 0i , the width a 1i , and the area A i of the normal distribution function while sizes of circles drawn on distal ends of the axes represent another of the amplitude a 0i , the width a 1i , and the area A i of the normal distribution function.
- the above is some examples of generating graphs using at least two of the center frequencies ⁇ 0i , the amplitudes a 0i , and the widths a 1i of the plurality of normal distribution functions used for generating the water vapor spectrum.
- the property analyzing unit 14 may generate a graph illustrating a relationship between at least two of the coefficients b j of the polynomial function used for generating the liquid spectrum.
- the graph generated using the at least two of the coefficients b j of the polynomial function may also be, for example, a radar chart, a line graph, a column chart, a scattergram, a pie chart, and a branch chart.
- the property analyzing unit 14 may generate a graph using, as parameters, at least two values including values that determine characteristics of the plurality of fitting functions used for the fitting by the water vapor fitting processing unit 12 and values that determine characteristics of the plurality of fitting functions used for the fitting by the liquid fitting processing unit 13. For example, the property analyzing unit 14 may generate a graph illustrating a relationship between at least one of the center frequencies ⁇ 0i , the amplitudes a 0i , and the widths a 1i of the plurality of normal distribution functions used for the fitting by the water vapor fitting processing unit 12 and at least one of the coefficients b j of the polynomial function used for the fitting by the liquid fitting processing unit 13.
- a graph directly illustrating a relationship between at least one of the center frequency ⁇ 0i , the amplitude a 0i , and the width a 1i and at least one of the coefficients b j of the polynomial function may be generated.
- a graph illustrating a relationship between at least one of the center frequency ⁇ 0i , the amplitude a 0i , and the width a 1i that are obtained from the water vapor spectrum and at least one of the center frequency A 0j , the amplitude a 0j , and the width a 1j that are obtained from the liquid spectrum.
- the liquid fitting processing unit 13 performs first fitting using the polynomial function indicated in (formula 2) as the plurality of fitting functions, and also performs second fitting using the composite waveform of the plurality of normal distribution functions with respect to the frequency spectrum (see Fig. 6 ) obtained by the first fitting.
- Fig. 11 illustrates an example of a branch chart generated by making uniform parameters obtained from the water vapor spectrum and parameters obtained from the liquid spectrum so as to include both of an element of the water vapor spectrum and an element of the liquid spectrum.
- the branch chart illustrated in Fig. 11 is generated in which one of five axes (branches) represents an element of the water vapor spectrum while the other four represent elements of the liquid spectrum.
- the single center frequency ⁇ 0i obtained from the water vapor spectrum is represented by one axis, and one of the amplitude a 0i , the width a 1i , and the area A i of the normal distribution function is represented by a length of the axis while another of the amplitude a 0i , the width a 1i , and the area A i of the normal distribution function is represented by a size of a circle drawn on a distal end of the axis.
- Four center frequencies obtained from the liquid spectrum are represented by four axes, and one of the amplitude a 0j , the width a 1j , and the area A j of the normal distribution function is represented by lengths of the four axes while another of the amplitude a 0j , the width a 1j , and the area A j of the normal distribution function is represented by sizes of circles drawn on distal ends of the four axes.
- the example is described in which after the first fitting is performed using the polynomial function indicated in (formula 2), the second fitting is performed using the composite waveform of the plurality of normal distribution functions with respect to the frequency spectrum thus obtained so as to obtain values of the center frequency ⁇ 0j , the amplitude a 0j , and the width a 1j of the plurality of normal distribution functions concerning the liquid spectrum.
- the invention is not limited to this. That is, fitting with the composite waveform of the plurality of normal distribution functions may be directly performed with respect to the frequency spectrum except for peak components at the water vapor absorption frequencies in the frequency spectrum obtained by the frequency spectrum obtaining unit 11.
- the waveform of the single fitting function or the composite waveform of the plurality of fitting functions is fitted to the frequency spectrum at the water vapor absorption frequency in the frequency spectrum of the electromagnetic signal obtained by the spectral device 20, and the value that determines the characteristic of the fitting function used for the fitting is used to analyze the property of the liquid sample.
- the frequency spectrum at the water vapor absorption frequency reflects the property of water vapor that is generated around the liquid sample. Since this water vapor includes the property of the liquid sample, processing of the frequency spectrum at the water vapor absorption frequency makes it possible to analyze the property of the liquid sample. Besides, the frequency spectrum of the water vapor has a peak clear and sharp and accordingly easy to read. According to the embodiment of the above-described configuration, the frequency spectrum caused by the water vapor generated from the liquid sample is approximated by the waveform of the single fitting function or the composite waveform of the plurality of fitting functions in such a manner that the property of the liquid sample is succeeded, and the property of the liquid sample is analyzed based on values concerning the fitting function used for the approximation.
- the electromagnetic signal detected by the spectral device 20 is subjected to analysis that positively utilizes absorption of the electromagnetic waves by the water vapor so that the characteristic inherent in the liquid sample can be easily detected.
- the composite waveform of the plurality of fitting functions is fitted to the frequency spectrum except for the peak component at the water vapor absorption frequency in the frequency spectrum of the electromagnetic signal obtained by the spectral device 20, and the value that determines the characteristic of the plurality of fitting functions used for the fitting is used to analyze the property of the liquid sample.
- a property of the liquid sample reflected by the frequency spectrum at the water vapor absorption frequency when the electromagnetic waves are transmitted through the water vapor around the liquid sample and a property of the liquid sample reflected by the frequency spectrum at frequencies other than the water vapor absorption frequency when the electromagnetic waves are transmitted through or reflected off the liquid sample are totally analyzed so that the characteristic inherent in the liquid sample can be easily detected.
- the absorbance data itself at the water vapor absorption frequency is not deleted but only the peak component at the water vapor absorption frequency is simply separated to perform the fitting. Consequently, the liquid spectrum can be obtained without lack of spectral data at the water vapor absorption frequency.
- the property of the liquid sample reflected by the electromagnetic waves when the electromagnetic waves are transmitted through or reflected off the liquid sample can be analyzed with higher accuracy than the method disclosed in patent document 1.
- the example is described in which the water vapor fitting processing unit 12 performs the fitting using the plurality of normal distribution functions such as (formula 1), and the property analyzing unit 14 analyzes the property of the liquid sample using the center frequencies, the amplitudes, and the widths of the plurality of normal distribution functions.
- the invention is not limited to this.
- the water vapor fitting processing unit 12 may perform the fitting using the polynomial function such as (formula 2), and the property analyzing unit 14 may analyze the property of the liquid sample using the coefficients of the polynomial function.
- the liquid fitting processing unit 13 performs the fitting using the polynomial function such as (formula 2), and the property analyzing unit 14 analyzes the property of the liquid sample using at least two of the coefficients of the polynomial function.
- the invention is not limited to this.
- the liquid fitting processing unit 13 may perform the fitting using the composite waveform of the plurality of normal distribution functions, and the property analyzing unit 14 may analyze the property of the liquid sample using at least two of the center frequencies, the amplitudes, and the widths of the plurality of normal distribution functions.
- fitting may be performed using the waveform of the single normal distribution function, and the property analyzing unit 14 may analyze the property of the liquid sample using one of a center frequency, an amplitude, and a width of the single normal distribution function.
- the property of the liquid sample is analyzed using at least two values including the values that determine the characteristics of the plurality of fitting functions used for the fitting by the water vapor fitting processing unit 12 and the values that determine the characteristics of the plurality of fitting functions used for the fitting by the liquid fitting processing unit 13.
- the invention is not limited to the above-described examples.
- the configuration is described in which the electromagnetic signal analysis apparatus 10 includes both of the water vapor fitting processing unit 12 and the liquid fitting processing unit 13.
- the electromagnetic signal analysis apparatus 10 may have a configuration including only the water vapor fitting processing unit 12.
- the frequency spectrum obtaining unit 11 may obtain the frequency spectrum at the water vapor absorption frequency instead of obtaining the frequency spectrum at all frequencies.
- the normal distribution function (Gaussian function) is used as one example of functions used for fitting.
- the fitting is implementable even using a Lorentzian function and a Voigt function, for example.
- Probability distribution functions having noncentro-symmetrical shapes namely, asymmetrical shapes, such as a Poisson distribution function (probability mass function, cumulative distribution function) and a chisquare distribution function (probability density function, cumulative distribution function) may be used, and other functions having mountain-shaped waveforms may be used.
- fitting is performed using, as a parameter, a value that represents a characteristic of a probability distribution (such as a central value or a mode of an amplitude, a frequency at which the amplitude value can be obtained, and a frequency width that makes the amplitude equal to or larger than a predetermined value or equal to or less than the predetermined value).
- a value that represents a characteristic of a probability distribution such as a central value or a mode of an amplitude, a frequency at which the amplitude value can be obtained, and a frequency width that makes the amplitude equal to or larger than a predetermined value or equal to or less than the predetermined value.
- the example is described in which the absorbance is used as the property value of the electromagnetic signal to obtain the frequency spectrum that represents the absorbance with respect to the frequency.
- other property values such as a transmittance may be used.
- any of the above-described embodiment is a mere example of embodying to implement the invention with which the technical scope of the invention should not be construed in a limiting sense. That is, the invention is implementable in various manners without departing from the subject matter or the major characteristics.
Landscapes
- Physics & Mathematics (AREA)
- Spectroscopy & Molecular Physics (AREA)
- Health & Medical Sciences (AREA)
- Analytical Chemistry (AREA)
- Life Sciences & Earth Sciences (AREA)
- Chemical & Material Sciences (AREA)
- Biochemistry (AREA)
- General Health & Medical Sciences (AREA)
- General Physics & Mathematics (AREA)
- Immunology (AREA)
- Pathology (AREA)
- Toxicology (AREA)
- Investigating Or Analysing Materials By Optical Means (AREA)
Applications Claiming Priority (2)
| Application Number | Priority Date | Filing Date | Title |
|---|---|---|---|
| JP2019190658A JP7365042B2 (ja) | 2019-10-18 | 2019-10-18 | 電磁波信号解析装置および電磁波信号解析用プログラム |
| PCT/JP2020/038099 WO2021075344A1 (fr) | 2019-10-18 | 2020-10-08 | Dispositif d'analyse de signal électromagnétique et programme d'analyse de signal électromagnétique |
Publications (2)
| Publication Number | Publication Date |
|---|---|
| EP4047352A1 true EP4047352A1 (fr) | 2022-08-24 |
| EP4047352A4 EP4047352A4 (fr) | 2023-11-15 |
Family
ID=75537975
Family Applications (1)
| Application Number | Title | Priority Date | Filing Date |
|---|---|---|---|
| EP20877927.2A Withdrawn EP4047352A4 (fr) | 2019-10-18 | 2020-10-08 | Dispositif d'analyse de signal électromagnétique et programme d'analyse de signal électromagnétique |
Country Status (5)
| Country | Link |
|---|---|
| US (1) | US11680896B2 (fr) |
| EP (1) | EP4047352A4 (fr) |
| JP (1) | JP7365042B2 (fr) |
| KR (1) | KR102565286B1 (fr) |
| WO (1) | WO2021075344A1 (fr) |
Families Citing this family (2)
| Publication number | Priority date | Publication date | Assignee | Title |
|---|---|---|---|---|
| JP7651925B2 (ja) * | 2021-04-13 | 2025-03-27 | 株式会社リコー | 可動装置、画像投影装置、ヘッドアップディスプレイ、物体認識装置、計測装置、ロボット、移動体及び車両 |
| JP2023053726A (ja) * | 2021-10-01 | 2023-04-13 | トヨタ自動車株式会社 | 解析装置、解析方法及び解析プログラム |
Family Cites Families (16)
| Publication number | Priority date | Publication date | Assignee | Title |
|---|---|---|---|---|
| EP0982582B1 (fr) | 1998-08-28 | 2005-06-01 | Perkin-Elmer Limited | Suppression de composantes indésirables dans des spectres mesurés |
| GB2402471B (en) | 2003-06-02 | 2006-01-18 | Teraview Ltd | An analysis method and apparatus |
| US8345254B2 (en) * | 2004-02-13 | 2013-01-01 | David Prystupa | Multiple pass imaging spectroscopy |
| JP2007108151A (ja) | 2005-10-14 | 2007-04-26 | Junzo Umemura | 水蒸気や炭酸ガスによるスペクトル・ノイズのないフーリエ変換赤外分光光度計 |
| US20080123712A1 (en) * | 2006-06-15 | 2008-05-29 | Spectrasensors, Inc. | Measuring water vapor in high purity gases |
| JP2008046574A (ja) | 2006-08-18 | 2008-02-28 | Junichi Nishizawa | 周波数可変テラヘルツ波内視鏡 |
| US7630835B2 (en) * | 2007-10-31 | 2009-12-08 | Honeywell International Inc. | Terahertz sensor to measure humidity and water vapor |
| JP5328319B2 (ja) | 2008-01-29 | 2013-10-30 | キヤノン株式会社 | テラヘルツ波を用いた検査装置及び検査方法 |
| JP2010164511A (ja) | 2009-01-19 | 2010-07-29 | Epson Toyocom Corp | センサーユニット、テラヘルツ分光測定装置およびテラヘルツ分光測定方法 |
| JP2011127950A (ja) * | 2009-12-16 | 2011-06-30 | Hikari Physics Kenkyusho:Kk | 液体薄膜化装置 |
| WO2013173320A1 (fr) * | 2012-05-17 | 2013-11-21 | Regents Of The University Of Minnesota | Spectromètre de mobilité ionique à tube conducteur de particules pour mesure d'aérosol |
| JP6032574B2 (ja) | 2012-08-26 | 2016-11-30 | 国立大学法人大阪大学 | スペクトル分解能とスペクトル確度を向上するフーリエ変換型分光法、分光装置および分光計測プログラム |
| JP6389135B2 (ja) | 2015-03-30 | 2018-09-12 | 日本電信電話株式会社 | 成分濃度分析装置および成分濃度分析方法 |
| JP6266719B1 (ja) | 2016-08-31 | 2018-01-24 | フェムトディプロイメンツ株式会社 | テラヘルツ時間領域分光装置 |
| EP3557230A4 (fr) * | 2016-12-15 | 2020-10-28 | Femto Deployments Inc. | Dispositif d'analyse de signal d'onde térahertz, procédé d'analyse de signal d'onde térahertz et programme d'analyse de signal d'onde térahertz |
| JP7007667B2 (ja) | 2018-03-12 | 2022-02-10 | 国立研究開発法人理化学研究所 | パルス電磁波発生装置および計測装置 |
-
2019
- 2019-10-18 JP JP2019190658A patent/JP7365042B2/ja active Active
-
2020
- 2020-10-08 KR KR1020217037976A patent/KR102565286B1/ko active Active
- 2020-10-08 WO PCT/JP2020/038099 patent/WO2021075344A1/fr not_active Ceased
- 2020-10-08 US US17/437,920 patent/US11680896B2/en active Active
- 2020-10-08 EP EP20877927.2A patent/EP4047352A4/fr not_active Withdrawn
Also Published As
| Publication number | Publication date |
|---|---|
| KR20210154236A (ko) | 2021-12-20 |
| US20220128463A1 (en) | 2022-04-28 |
| WO2021075344A1 (fr) | 2021-04-22 |
| KR102565286B1 (ko) | 2023-08-08 |
| EP4047352A4 (fr) | 2023-11-15 |
| JP2021067475A (ja) | 2021-04-30 |
| JP7365042B2 (ja) | 2023-10-19 |
| US11680896B2 (en) | 2023-06-20 |
Similar Documents
| Publication | Publication Date | Title |
|---|---|---|
| EP2499504B1 (fr) | Mesure de précision de formes d'onde à l'aide d'une déconvolution et d'un fenêtrage | |
| Bowles et al. | Use of filter vectors in hyperspectral data analysis | |
| JP6865972B2 (ja) | テラヘルツ波信号解析装置、テラヘルツ波信号解析方法およびテラヘルツ波信号解析用プログラム | |
| US11680896B2 (en) | Electromagnetic signal analysis apparatus and electromagnetic signal analysis program | |
| Zimmerman et al. | Analysis of allergenic pollen by FTIR microspectroscopy | |
| EP3088871A1 (fr) | Procédé de détection de spectre raman | |
| RU2526889C2 (ru) | Прецизионное измерение формы колебаний | |
| CN108474726A (zh) | 个数分析方法、个数分析装置以及个数分析用记录介质 | |
| TW201923315A (zh) | 頻譜分析裝置及頻譜分析方法 | |
| Tang et al. | Gas–liquid two-phase flow structure in the multi-scale weighted complexity entropy causality plane | |
| US8620976B2 (en) | Precision measurement of waveforms | |
| US10852229B2 (en) | Detection of compounds in material samples utilizing a transformation and subsequent decomposition | |
| TW201321739A (zh) | 訊號分析裝置、訊號分析方法及電腦程式產品 | |
| Zhou et al. | Terahertz signal classification based on geometric algebra | |
| US10690593B2 (en) | Sample analyzer and recording medium recording sample analysis program | |
| TWI855253B (zh) | 電磁波訊號解析裝置及電磁波訊號解析用程式 | |
| CN113167652B (zh) | 用于快速且准确的痕量气体测量的系统和方法 | |
| CN105606540A (zh) | 基于同步二维相关谱自相关峰的定量分析方法 | |
| Fadeyev et al. | Application of independent component analysis method in real-time spectral analysis of gaseous mixtures for acousto-optical spectrometers based on differential optical absorption spectroscopy | |
| Sarwar et al. | A novel statistical framework to address FTIR spectral challenges: Hybrid MARS–PCA/KPCA models for pollutants analysis in honey samples | |
| CN115389450A (zh) | 一种基于太赫兹量子指纹谱的一致性检测方法及中药检测 | |
| US20250377291A1 (en) | Photoacoustic measurement device and photoacoustic measurement method | |
| Zhan et al. | Ultrasonic spectrum for particle concentration measurement in multicomponent suspensions | |
| CN104316488B (zh) | 违禁物品检测方法和装置 | |
| Qin et al. | Application of independent component analysis in real-time optoacoustic spectroscopy detection of gaseous mixtures |
Legal Events
| Date | Code | Title | Description |
|---|---|---|---|
| STAA | Information on the status of an ep patent application or granted ep patent |
Free format text: STATUS: THE INTERNATIONAL PUBLICATION HAS BEEN MADE |
|
| PUAI | Public reference made under article 153(3) epc to a published international application that has entered the european phase |
Free format text: ORIGINAL CODE: 0009012 |
|
| STAA | Information on the status of an ep patent application or granted ep patent |
Free format text: STATUS: REQUEST FOR EXAMINATION WAS MADE |
|
| 17P | Request for examination filed |
Effective date: 20211210 |
|
| AK | Designated contracting states |
Kind code of ref document: A1 Designated state(s): AL AT BE BG CH CY CZ DE DK EE ES FI FR GB GR HR HU IE IS IT LI LT LU LV MC MK MT NL NO PL PT RO RS SE SI SK SM TR |
|
| DAV | Request for validation of the european patent (deleted) | ||
| DAX | Request for extension of the european patent (deleted) | ||
| STAA | Information on the status of an ep patent application or granted ep patent |
Free format text: STATUS: THE APPLICATION HAS BEEN WITHDRAWN |
|
| 18W | Application withdrawn |
Effective date: 20231011 |
|
| A4 | Supplementary search report drawn up and despatched |
Effective date: 20231013 |
|
| RIC1 | Information provided on ipc code assigned before grant |
Ipc: G01N 21/3581 20140101ALI20231009BHEP Ipc: G01N 21/3577 20140101AFI20231009BHEP |