EP4053842A1 - Procédé d'analyse d'une substance de test, analyseur, analyseur, procédé d'entraînement, système d'analyseur et programme d'analyse - Google Patents
Procédé d'analyse d'une substance de test, analyseur, analyseur, procédé d'entraînement, système d'analyseur et programme d'analyse Download PDFInfo
- Publication number
- EP4053842A1 EP4053842A1 EP22160175.0A EP22160175A EP4053842A1 EP 4053842 A1 EP4053842 A1 EP 4053842A1 EP 22160175 A EP22160175 A EP 22160175A EP 4053842 A1 EP4053842 A1 EP 4053842A1
- Authority
- EP
- European Patent Office
- Prior art keywords
- test substance
- data set
- measurement sample
- deep learning
- learning algorithm
- Prior art date
- Legal status (The legal status is an assumption and is not a legal conclusion. Google has not performed a legal analysis and makes no representation as to the accuracy of the status listed.)
- Pending
Links
Images


Classifications
-
- G—PHYSICS
- G01—MEASURING; TESTING
- G01N—INVESTIGATING OR ANALYSING MATERIALS BY DETERMINING THEIR CHEMICAL OR PHYSICAL PROPERTIES
- G01N21/00—Investigating or analysing materials by the use of optical means, i.e. using sub-millimetre waves, infrared, visible or ultraviolet light
- G01N21/62—Systems in which the material investigated is excited whereby it emits light or causes a change in wavelength of the incident light
- G01N21/63—Systems in which the material investigated is excited whereby it emits light or causes a change in wavelength of the incident light optically excited
- G01N21/65—Raman scattering
- G01N21/658—Raman scattering enhancement Raman, e.g. surface plasmons
-
- G—PHYSICS
- G01—MEASURING; TESTING
- G01N—INVESTIGATING OR ANALYSING MATERIALS BY DETERMINING THEIR CHEMICAL OR PHYSICAL PROPERTIES
- G01N33/00—Investigating or analysing materials by specific methods not covered by groups G01N1/00 - G01N31/00
- G01N33/48—Biological material, e.g. blood, urine; Haemocytometers
- G01N33/50—Chemical analysis of biological material, e.g. blood, urine; Testing involving biospecific ligand binding methods; Immunological testing
- G01N33/53—Immunoassay; Biospecific binding assay; Materials therefor
- G01N33/543—Immunoassay; Biospecific binding assay; Materials therefor with an insoluble carrier for immobilising immunochemicals
- G01N33/54353—Immunoassay; Biospecific binding assay; Materials therefor with an insoluble carrier for immobilising immunochemicals with ligand attached to the carrier via a chemical coupling agent
-
- G—PHYSICS
- G01—MEASURING; TESTING
- G01N—INVESTIGATING OR ANALYSING MATERIALS BY DETERMINING THEIR CHEMICAL OR PHYSICAL PROPERTIES
- G01N21/00—Investigating or analysing materials by the use of optical means, i.e. using sub-millimetre waves, infrared, visible or ultraviolet light
- G01N21/17—Systems in which incident light is modified in accordance with the properties of the material investigated
- G01N21/25—Colour; Spectral properties, i.e. comparison of effect of material on the light at two or more different wavelengths or wavelength bands
- G01N21/255—Details, e.g. use of specially adapted sources, lighting or optical systems
-
- G—PHYSICS
- G01—MEASURING; TESTING
- G01N—INVESTIGATING OR ANALYSING MATERIALS BY DETERMINING THEIR CHEMICAL OR PHYSICAL PROPERTIES
- G01N21/00—Investigating or analysing materials by the use of optical means, i.e. using sub-millimetre waves, infrared, visible or ultraviolet light
- G01N21/17—Systems in which incident light is modified in accordance with the properties of the material investigated
- G01N21/25—Colour; Spectral properties, i.e. comparison of effect of material on the light at two or more different wavelengths or wavelength bands
- G01N21/31—Investigating relative effect of material at wavelengths characteristic of specific elements or molecules, e.g. atomic absorption spectrometry
- G01N21/314—Investigating relative effect of material at wavelengths characteristic of specific elements or molecules, e.g. atomic absorption spectrometry with comparison of measurements at specific and non-specific wavelengths
-
- G—PHYSICS
- G01—MEASURING; TESTING
- G01N—INVESTIGATING OR ANALYSING MATERIALS BY DETERMINING THEIR CHEMICAL OR PHYSICAL PROPERTIES
- G01N33/00—Investigating or analysing materials by specific methods not covered by groups G01N1/00 - G01N31/00
- G01N33/48—Biological material, e.g. blood, urine; Haemocytometers
- G01N33/50—Chemical analysis of biological material, e.g. blood, urine; Testing involving biospecific ligand binding methods; Immunological testing
- G01N33/53—Immunoassay; Biospecific binding assay; Materials therefor
- G01N33/543—Immunoassay; Biospecific binding assay; Materials therefor with an insoluble carrier for immobilising immunochemicals
- G01N33/54313—Immunoassay; Biospecific binding assay; Materials therefor with an insoluble carrier for immobilising immunochemicals the carrier being characterised by its particulate form
- G01N33/54346—Nanoparticles
-
- G—PHYSICS
- G01—MEASURING; TESTING
- G01N—INVESTIGATING OR ANALYSING MATERIALS BY DETERMINING THEIR CHEMICAL OR PHYSICAL PROPERTIES
- G01N33/00—Investigating or analysing materials by specific methods not covered by groups G01N1/00 - G01N31/00
- G01N33/48—Biological material, e.g. blood, urine; Haemocytometers
- G01N33/50—Chemical analysis of biological material, e.g. blood, urine; Testing involving biospecific ligand binding methods; Immunological testing
- G01N33/58—Chemical analysis of biological material, e.g. blood, urine; Testing involving biospecific ligand binding methods; Immunological testing involving labelled substances
- G01N33/588—Chemical analysis of biological material, e.g. blood, urine; Testing involving biospecific ligand binding methods; Immunological testing involving labelled substances with semiconductor nanocrystal label, e.g. quantum dots
-
- G—PHYSICS
- G01—MEASURING; TESTING
- G01N—INVESTIGATING OR ANALYSING MATERIALS BY DETERMINING THEIR CHEMICAL OR PHYSICAL PROPERTIES
- G01N33/00—Investigating or analysing materials by specific methods not covered by groups G01N1/00 - G01N31/00
- G01N33/48—Biological material, e.g. blood, urine; Haemocytometers
- G01N33/50—Chemical analysis of biological material, e.g. blood, urine; Testing involving biospecific ligand binding methods; Immunological testing
- G01N33/68—Chemical analysis of biological material, e.g. blood, urine; Testing involving biospecific ligand binding methods; Immunological testing involving proteins, peptides or amino acids
- G01N33/6803—General methods of protein analysis not limited to specific proteins or families of proteins
- G01N33/6806—Determination of free amino acids
- G01N33/6812—Assays for specific amino acids
-
- G—PHYSICS
- G06—COMPUTING OR CALCULATING; COUNTING
- G06N—COMPUTING ARRANGEMENTS BASED ON SPECIFIC COMPUTATIONAL MODELS
- G06N3/00—Computing arrangements based on biological models
- G06N3/02—Neural networks
-
- G—PHYSICS
- G06—COMPUTING OR CALCULATING; COUNTING
- G06N—COMPUTING ARRANGEMENTS BASED ON SPECIFIC COMPUTATIONAL MODELS
- G06N3/00—Computing arrangements based on biological models
- G06N3/02—Neural networks
- G06N3/08—Learning methods
-
- G—PHYSICS
- G16—INFORMATION AND COMMUNICATION TECHNOLOGY [ICT] SPECIALLY ADAPTED FOR SPECIFIC APPLICATION FIELDS
- G16C—COMPUTATIONAL CHEMISTRY; CHEMOINFORMATICS; COMPUTATIONAL MATERIALS SCIENCE
- G16C20/00—Chemoinformatics, i.e. ICT specially adapted for the handling of physicochemical or structural data of chemical particles, elements, compounds or mixtures
- G16C20/20—Identification of molecular entities, parts thereof or of chemical compositions
-
- G—PHYSICS
- G01—MEASURING; TESTING
- G01N—INVESTIGATING OR ANALYSING MATERIALS BY DETERMINING THEIR CHEMICAL OR PHYSICAL PROPERTIES
- G01N2201/00—Features of devices classified in G01N21/00
- G01N2201/12—Circuits of general importance; Signal processing
- G01N2201/121—Correction signals
-
- G—PHYSICS
- G01—MEASURING; TESTING
- G01N—INVESTIGATING OR ANALYSING MATERIALS BY DETERMINING THEIR CHEMICAL OR PHYSICAL PROPERTIES
- G01N2201/00—Features of devices classified in G01N21/00
- G01N2201/12—Circuits of general importance; Signal processing
- G01N2201/129—Using chemometrical methods
- G01N2201/1296—Using chemometrical methods using neural networks
-
- G—PHYSICS
- G16—INFORMATION AND COMMUNICATION TECHNOLOGY [ICT] SPECIALLY ADAPTED FOR SPECIFIC APPLICATION FIELDS
- G16C—COMPUTATIONAL CHEMISTRY; CHEMOINFORMATICS; COMPUTATIONAL MATERIALS SCIENCE
- G16C20/00—Chemoinformatics, i.e. ICT specially adapted for the handling of physicochemical or structural data of chemical particles, elements, compounds or mixtures
- G16C20/70—Machine learning, data mining or chemometrics
Definitions
- the present invention relates to a method for analyzing a test substance contained in a measurement sample, an analyzer, a training method, an analyzer system, and an analysis program.
- Japanese Laid-Open Patent Publication No. 2020-71166 discloses an apparatus for analyzing an object to be analyzed on the basis of a spectrum of light generated by the object to be analyzed that contains any one or more reference objects from among a plurality of reference objects, the apparatus including a processing unit, an input unit, a learning unit, and an analysis unit, in which the processing unit has a recurrent neural network (RNN).
- the input unit accepts entry of scalar data into each cell of the RNN More specifically, assuming now that the spectrum of light measured with use of a spectrometer contains N data D(1) to D(N), where n-th data D(n) represents data of the n-th channel.
- n-Th cell among a plurality of cells connected in chain in an RNN model will be denoted as C(n).
- An input unit 20 inputs the optical spectra that contain N data D(1) to D(N), one by one into the RNN
- the optical spectra generated by the object to be analyzed may vary among the objects to be analyzed, even if originated from the same type of objects to be analyzed.
- the apparatus described in Japanese Laid-Open Patent Publication No. 2020-71166 designed to input the optical spectra one by one into the RNN, may yield different results output from the RNN depending on the input optical spectra, even if the optical spectra were originated from the same type of object to be analyzed, resulting in poor accuracy of analysis.
- the present invention relates to an analytical method for analyzing a test substance contained in a measurement sample, the method including: generating a data set based on a plurality of optical spectra acquired from a plurality of locations in the measurement sample; inputting the data set into a deep learning algorithm having a neural network structure; and outputting information on the test substance, on the basis of an analytical result from the deep learning algorithm. Since being designed to output information on a test substance, with use of a data set based on a plurality of optical spectra acquired from a plurality of locations in the measurement sample, the present invention can provide an analytical method that can analyze a test substance contained in the measurement sample with high accuracy of analysis.
- the present invention relates to a training method for a deep learning algorithm for analyzing a test substance contained in a measurement sample
- the training method includes: generating a data set based on a plurality of optical spectra acquired from a plurality of locations in the measurement sample that contains a known substance whose type, monomer sequence or a combination of atoms has been known; and inputting the data set into a deep learning algorithm having a neural network structure, together with label information that indicates the type, the monomer sequence or the combination of atoms of the known substance that corresponds to the data set.
- the present invention can provide a deep learning algorithm that can analyze a test substance contained in the measurement sample with high accuracy of analysis.
- the present invention relates to an analyzer (100, 100B) for analyzing a test substance contained in a measurement sample, the analyzer including a controller (10, 10B), in which the controller (10, 10B) generates a data set based on a plurality of optical spectra acquired from a plurality of locations in the measurement sample, inputs the data set into a deep learning algorithm having a neural network structure, and outputs information on the test substance, on the basis of an analytical result from the deep learning algorithm. Since being designed to output information on the test substance with use of the data set based on the plurality of optical spectra acquired from the plurality of locations in the measurement sample, the present invention can provide an analyzer that can analyze a test substance contained in the measurement sample with high accuracy of analysis.
- the present invention relates to an analyzer system (1) for analyzing a test substance contained in a measurement sample, the analyzer system including a detector (500) and an analyzer (100, 100B), in which the detector (500) includes a light source (520) and a photodetector (560), the analyzer (100, 100B) includes a controller (10, 10B), and the controller (10, 10B) generates a data set based on a plurality of optical spectra acquired from a plurality of locations in the measurement sample, inputs the data set into a deep learning algorithm having a neural network structure, and outputs information on the test substance, on the basis of an analytical result from the deep learning algorithm.
- the present invention can provide an analyzer system that can analyze a test substance contained in the measurement sample with high accuracy of analysis.
- the present invention relates to an analysis program (134) for a test substance contained in the measurement sample, when run on a computer, designed to execute processes of: generating a data set based on a plurality of optical spectra acquired from a plurality of locations in the measurement sample; inputting the data set into a deep learning algorithm having a neural network structure; and outputting information on the test substance, on the basis of an analytical result from the deep learning algorithm. Since being designed to output information on the test substance with use of the data set based on the plurality of optical spectra acquired from the plurality of locations in the measurement sample, the present invention can provide an analysis program that can analyze a test substance contained in the measurement sample with high accuracy of analysis.
- a test substance contained in a measurement sample may be detected with high accuracy of analysis.
- the method for analyzing a test substance contained in a measurement sample includes: generating a data set based on a plurality of optical spectra acquired from a plurality of locations in the measurement sample; inputting the data set into a deep learning algorithm having a neural network structure; and outputting information on the test substance, on the basis of an analytical result from the deep learning algorithm.
- the test substance may contain at least one selected from the group consisting of amino acid, polypeptide, RNA, DNA, catecholamine, polyamine, and organic acid.
- the "polypeptide” is a compound in which two or more amino acids are linked by a peptide bond.
- the polypeptide is exemplified by dipeptide, oligopeptide, and protein.
- the test substance is contained in a solvent such as water or a buffer solution, or contained in a sample derived from a living body, such as blood, serum, plasma, saliva, ascites, pleural effusion, cerebrospinal fluid, lymph fluid, interstitial fluid, or urine.
- the measurement sample is a sample subjected to optical detection of the test substance.
- the measurement sample is obtainable by contacting the test substance contained in the test sample, with other substance so as to be suited to the optical detection.
- the optical detection method is not limited as long as the optical spectrum may be acquired.
- the optical spectrum is typically Raman spectrum, visible light absorption spectrum, ultraviolet absorption spectrum, fluorescence spectrum, nearinfrared spectrum, or infrared spectrum.
- the Raman spectrum is typically surface enhanced Raman scattering (SERS) spectrum (referred to as SERS spectrum, hereinafter).
- the SERS spectrum is acquired by irradiating a measurement sample that contains an aggregate of a metal nanoparticle bound to the test substance via a linker with excitation light.
- the measurement sample from which the optical spectrum is acquired may be prepared by placing the sample in a liquid state on a base, followed by drying.
- the base employable here is exemplified by glass base such as cover glass, slide glass, or glass-bottomed plate.
- the measurement sample from which the optical spectrum is acquired may also be a sample in a liquid state contained in a transparent vial.
- the optical spectrum may be acquired by causing flow of a measurement sample in a liquid state through a channel, and irradiating the measurement sample that flows through the channel with excitation light.
- the optical spectrum may be acquired by irradiating the measurement sample with light, and detecting scattered light, transmitted light, reflected light, fluorescence, or the like emitted from the test substance or the substance bound to the test substance, with use of a detector.
- the scattered light may be a scattered light (Raman scattered light) whose wavelength is different from a predetermined wavelength of the light incident on the measurement sample.
- a deep learning algorithm trained by training data set 72 is used.
- the training method for a deep learning algorithm includes: generating a data set based on a plurality of optical spectra acquired from a plurality of locations in the measurement sample that contains a known substance whose type, monomer sequence or a combination of atoms has been known; and inputting the data set into a deep learning algorithm having a neural network structure, together with label information that indicates the type, the monomer sequence or the combination of atoms of the known substance that corresponds to the data set.
- the known substance may contain at least one selected from the group consisting of amino acid, polypeptide, RNA, DNA, catecholamine, polyamine, and organic acid, similarly to the test substance.
- the combination of atoms that constitute the known substance is typically a structure or functional group in a molecule that constitutes the known substance, and is exemplified by those causing C-H stretching, O-H stretching, or CH 2 symmetric stretching.
- FIG. 1 illustrates a method with use of SERS spectrum
- the training data set may be acquired by a similar method with use of an optical spectrum other than the SERS spectrum.
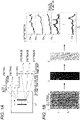
- Fig. 1A illustrates a method for obtaining SERS spectra with use of a slit-scanning confocal Raman microscope.
- the slit scanning confocal Raman microscope employable here may be a laser Raman microscope RAMANtouch/RAMANforce (Nanophoton Corporation), for example. This microscope can irradiate the measurement sample with a line beam, denoted by a reference sign L1, of laser light as excitation light.
- This microscope can acquire 400 SERS spectra, from a single line beam of excitation light L1.
- Each of Spectrum 1 to Spectrum 400 indicates a SERS spectrum acquired from a single line beam of excitation light L1, with the abscissa denoting wavenumber, and the ordinate denoting signal intensity of light at each wavenumber.
- Fig. 1B illustrates a method for acquiring a plurality of SERS spectra 70 from a plurality of locations in a measurement sample that contains a known substance.
- An image presented for step i represents a bright field image of the measurement sample on the slide glass "b", overlaid with lines that indicate locations irradiated with the line beam of the excitation light.
- Reference sign "a" denotes an aggregate of metal nanoparticles.
- the measurement sample is irradiated with the line beam of excitation light to acquire 400 SERS spectra as described previously referring to Fig. 1A . Different locations are irradiated with approximately 20 to 30 line beams of the excitation light, and 400 SERS spectra are acquired on each occasion.
- SERS spectra 70s having SERS equal to or larger than a threshold value appear therein, are selected from the plurality of SERS spectra having been obtained in step i.
- the SERS spectrum 70 that corresponds to SERS generated from the aggregate of the metal nanoparticles may be selected.
- step ii pixels that correspond to the locations irradiated with the excitation light are selected on the image presented for step i, and combined. In the image presented for step ii, the darker the area, the weaker the SERS (i.e., optical signal), meanwhile the brighter the area, the stronger the SERS.
- the image presented for step ii indicates SERS signal intensity in gradation levels typically from 0 to 255.
- the images presented for steps i and ii may be created typically from SERS signal intensity in a fingerprint area, or from the SERS signal intensity in a silent area.
- the images presented for steps i and ii may be created by calculation from the SERS signal intensity in a plurality of wavenumber bands, or from the SERS signal intensity in a single wavenumber band.
- step iii the individual pixels selected in step ii are binarized on the basis of the SERS signal intensity.
- An operator may take part in binarization while setting a threshold value.
- the binarization may rely upon processing such as discriminant analysis, dynamic threshold method, percentile method, mode method, Laplacian histogram method, differential histogram method, and level slicing.
- the wavenumber band is given by a predetermined wavenumber, or given by a wavenumber region with a predetermined range obtainable by dividing the entire wavenumber region.
- the signal intensity of the optical spectrum (SERS in this embodiment) in the wavenumber band means, if the wavenumber band being given by a predetermined wavenumber, the SERS signal intensity at that wavenumber, meanwhile, if the wavenumber band being a wavenumber region with a predetermined range, a representative value of the SERS signal intensity in that wavenumber band (for example, maximum value, average value, or centroid value, for example).
- step iii pixels with the SERS signal intensity equal to or larger than the threshold value are depicted as blank, meanwhile the pixels with the SERS signal intensity smaller than the threshold value are depicted in gray.
- step iv the SERS spectrum 70s of the individual pixels, whose SERS signal intensities having been judged to be equal to or larger than the threshold value in step iii, are selected.
- the SERS spectra 70s acquired in step iv may be subjected to processes such as baseline correction, scatter correction, denoising, scaling, and principal component analysis as necessary.
- optical spectra are acquired from a plurality of locations in the measurement sample, by changing position of irradiation with the excitation light relative to the measurement sample on the slide.
- the optical spectra may be acquired from a plurality of locations in the measurement sample, without changing the position of irradiation with the excitation light. This is because the test substance in the measurement sample, under irradiation with the excitation light, can vary the position due to Brownian motion.
- the optical spectra are acquired from the measurement sample that flows through a flow channel, the optical spectra are obtainable from a plurality of locations in the measurement sample, since position of irradiation with the excitation light varies as the measurement sample flows.
- the excitation light may be irradiated in the form of beam spot, although Fig. 1 illustrates an exemplary case with use of the excitation light in the form of line beam.
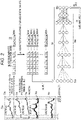
- step v illustrated in Fig. 2 a predetermined number of SERS spectra are randomly extracted from the SERS spectrum 70 obtained in step iv, and then averaged.
- SERS spectrum 70a represents a predetermined number (100, in this case) of extracted SERS spectra.
- the SERS spectrum 70a that contains the extracted predetermined number of SERS spectra 70s is also referred to as a "subset" in this specification.
- the number of SERS spectra 70s contained in one subset may only be plural, and is preferably at least three.
- the upper limit of the number of SERS spectra 70s contained in one subset is not limited, as long as the SERS spectra 70s are extractable from the SERS spectrum 70.
- an average value Ii of the signal intensity in the first wavenumber band is calculated by adding the signal intensity in the first wavenumber band of spectrum 1, the signal intensity in the first wavenumber band of spectrum 2, the signal intensity in the first wavenumber band of spectrum 3, and the signal intensity in the first wavenumber band of spectrum 4, and so on up to the signal intensity in the first wavenumber band of spectrum 100, and then by dividing the sum by the total number of the SERS spectra (100, in this case).
- the arithmetic means I 2 , I 3 , I 4 , I 5 , and so on are similarly calculated. This process is repeated from the first wavenumber band to the 800th wavenumber band, to calculate arithmetic means I 1 to I 800 .
- a data set of the calculated average values I 1 to I 800 is defined to be an averaged spectral data set 72 of the first subset (mean 1).
- Step v and step vi are repeated a predetermined number of times, to obtain an averaged spectral data set 72 of the second subset (mean 2), an averaged spectral data set 72 of the third subset (mean 3), and so on up to an averaged spectral data set 72 of the n-th subset (mean n).
- the averaged spectral data set 72 is an example of a training data set.
- the signal intensities of the optical spectrum (SERS, in this embodiment) in the same wavenumber band are preferably the signal intensities in the same wavenumber band, when viewed among the plurality of SERS spectra 70 as illustrated in Fig. 2 , but are not limited as long as the signal intensities are in a substantially same wavenumber band.
- the averaged spectral data set 72, and a second training data which is label information that indicates the type or the monomer sequence of the known substance contained in the measurement sample on the slide glass b, are input into a deep learning algorithm 50.
- the label information may be a name of the known substance, a monomer sequence name of the known substance, abbreviations representing them, label value, or the like.
- step vii the averaged spectral data set 72 (mean 1) is input into an input layer 50a of the deep learning algorithm 50, and the label information 75 is input into an output layer 50b.
- label information 75 is input into an output layer 50b.
- label information 75 is input into an output layer 50b.
- label information 75 is input into an output layer 50b.
- label information 75 is input into an output layer 50b.
- label information 75 is input into an output layer 50b.
- label information 75 is input into an output layer 50b.
- label information 75 is input into an output layer 50b.
- label information 75 is input into an output layer 50b.
- amino acid X is input as the label information 75.
- Reference sign 50c denotes an intermediate layer of the deep learning algorithm 50.
- weight which corresponds to connection strength of the individual layers in the deep learning algorithm 50 is updated.
- each of the averaged spectral data set 72 (mean 2) and subsequent data sets each of the averaged spectral data set 72 (mean 2) and so on is input into the input layer 50a, the label information 75 is input into the output layer 50b, and the weight is updated in a similar manner. Steps i to vii are optionally repeated also for any other measurement sample that contains the same kind of test substance.
- a learned deep learning algorithm (referred to as a deep learning algorithm 60, hereinafter) is thus created.
- the averaged spectral data set 72 is generated on the basis of the plurality of optical spectra (SER spectrum 70, in this embodiment) acquired from a plurality of locations (400 locations per a single line beam of the excitation light L1) of the measurement sample on the slide glass b. This enables absorption of any variation if occurred in every SER spectrum, and creation of the deep learning algorithm 60 that can output a highly accurate analytical result.
- the deep learning algorithm 50 is not limited as long as it has a neural network structure.
- the deep learning algorithm 50 contains a convolutional neural network, a full-connected neural network, or a combination of them.
- the deep learning algorithm 50 may be an absolutely untrained algorithm or an already-trained algorithm.
- the data that constitutes the averaged spectral data set 72 may alternatively be integrated value, multiplied value, or divided value, in place of the arithmetic mean.
- the integrated value is given by integrating the signal intensities in the same wavenumber band of the individual SERS spectra in the SERS spectrum 70a.
- the multiplied value is given by adding up the signal intensities in the same wavenumber band of the individual SERS spectra in the SERS spectrum 70a, meanwhile the divided value is given by dividing the signal intensities in the same wavenumber band of the individual SERS spectra in the SERS spectrum 70a according to a predetermined order.
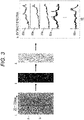
- the data set for analysis is generated in the same manner as steps i to v for generating the averaged spectral data set 72, previously illustrated in section 1-2. (1), and in Figs. 1 and 2 . More specifically, first in step i illustrated in Fig. 3 , the measurement sample to be analyzed is irradiated with twenty to thirty line beams of the excitation light, to acquire SERS spectra. Next, steps ii to iv are carried out to select SERS spectra 80s having SERS equal to or larger than a threshold value, from among the plurality of SERS spectra acquired in step i.
- a method for selecting SERS spectra 80s with SERS equal to or larger than a threshold value is incorporated herein from the explanation above in steps ii to iv in section 1-2. (1).
- This enables, in step iv, selection of the SERS spectra 80, which are SERS spectra ascribed to the aggregated metal nanoparticles.
- step v illustrated in Fig. 4 a predetermined number (100 in this example) of SERS spectra 80a are randomly extracted from the SER spectra 80 having been acquired in step iv, and an averaged spectral data set 82 of the thus extracted predetermined number of SERS spectra 80a is obtained as a data set for analysis.
- step vi the averaged spectral data set 82 is input into an input layer 60a of the learned deep learning algorithm 60.
- the deep learning algorithm 60 outputs an analytical result 85 from an output layer 60c.
- the analytical result 85 contains "amino acid Y" as the type of the known substance, and a probability thereof.
- the analytical result 85 may contain a label that indicates the type of the known substance predicted for the test substance, and a probability that the test substance matches the predicted known substance.
- the analytical result 85 may alternatively contain a label that indicates the monomer sequence of the known substance predicted for the test substance, and the probability that the test substance matches the predicted known substance.
- the analytical result 85 may still alternatively contain a combination of atoms that constitute the known substance predicted for the test substance, and the probability that the test substance matches the predicted known substance.
- the combination of atoms that constitute the known substance is typically a structure or functional group in a molecule that constitutes the known substance, and is exemplified by those causing C-H stretching, O-H stretching, or CH 2 symmetric stretching.
- the analytical result 85 may contain information on types of a plurality of predicted known substances and/or monomer sequences of a plurality of predicted known substances, for a single test substance. In a case where the probability that the test substance matches a predicted known substance is low, the analytical result 85 may contain information such as "unknown substance” or "analysis not possible”.
- the averaged spectral data set 82 is generated on the basis of the plurality of optical spectra (SER spectrum 80, in this embodiment) acquired from a plurality of locations (in this embodiment, 400 locations per a single line beam of the excitation light L1) of the measurement sample on the slide glass b. This enables absorption of any variation if occurred in every SER spectrum, and output of a highly accurate analytical result from the deep learning algorithm 60.
- the method may employ integrated value, multiplied value, or divided value in place of the arithmetic mean, likewise the training data set.
- the optical spectrum is the SERS spectrum
- any optical spectrum other than the SERS spectrum is employable.
- wavelength may alternatively be plotted on the abscissa.
- the measurement sample used for acquiring the training data set and the measurement sample for acquiring the data set for analysis are preferably prepared by the same method.
- a liquid measurement sample was used in the acquisition of the training data set
- use of a liquid measurement sample is preferred also in the acquisition of the data set for analysis.
- a dried measurement sample is preferred also in the acquisition of the data set for analysis.
- FIG. 5 illustrates an outline of the analyzer system 1.
- the analyzer system 1 includes a detector 500 that acquires optical spectra, and an analyzer 100 that trains the deep learning algorithm 50 and outputs information on the test substance with use of the trained deep learning algorithm 60.
- the detector 500 includes a microscopic viewer 510 that magnifies an image of the measurement sample placed thereon, a light source 520 that emits light with which the measurement sample is irradiated (irradiation light), a filter 530 that separates optical paths of the light emitted from the light source 520 and the light (return light) emitted from the measurement sample, a pinhole 540 that narrows the optical path of the return light, a spectrometer 550 that disperses the return light to a predetermined wavelength, a photodetector 560 that receives the return light, and a communication interface 570.
- the light source 520 is preferably a laser light source.
- Type of the laser light source is selectable depending on the wavelength of the irradiation light with which the measurement sample is irradiated.
- the filter 530 is a dichroic filter.
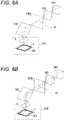
- the pinhole 540 employed in a case where the measurement sample is irradiated with the irradiation light in the form of beam spot, is a pinhole 540a having a circular optical path window w1 as illustrated in Fig. 6A .
- a pinhole 540b having a slit-shaped optical path window w2 illustrated in Fig. 6B is employable, in a case where the measurement sample is irradiated with the irradiation light in the form of line beam.
- the photodetector 560 is typically a CCD camera.
- the photodetector 560 is communicably connected to the analyzer 100 via the communication interface 570.
- the communication interface 570 is typically a USB interface.
- the microscopic viewer 510 includes an objective lens O and a stage S on which a measurement sample MS is placed.
- a broken line indicates an optical path of the return light.
- the detector 500 is exemplified by a laser Raman microscope RAMANtouch/RAMANforce (Nanophoton Corporation), and a multi-focus Raman microscope.
- Detection conditions in a case where the optical spectrum is the SRES spectrum obtained with use of metal nanoparticles are as follows.
- the conditions may be properly set depending on the type of the test substance, material of the metal nanoparticle, and shape of the metal nanoparticle.
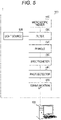
- Fig. 7 illustrates a hardware configuration of the analyzer 100.
- the analyzer 100 is typically constituted by a general-purpose computer, trains the deep learning algorithm 50 with use of a training program 132, and outputs information on the test substance with use of an analysis program 134 and the trained deep learning algorithm 60.
- the analyzer 100 is connected to the detector 500.
- the analyzer 100 includes a controller 10, an input device 16, and an output device 17.
- the analyzer 100 is connected to a media drive 98 and a network 99.
- the controller 10 includes a central processing unit (CPU) 11 that processes data, a main storage device 12 used as a work area for data processing, an auxiliary storage device 13, a bus 14 that transmits data among the individual units, and an interface (I/F) 15 through which data is input or output to or from an external device.
- the input device 16 and the output device 17 are connected to an interface (I/F) 15.
- the input device 16 is a keyboard, a mouse, or the like
- the output device 17 is a liquid crystal display, an organic EL display, or the like.
- the auxiliary storage device 13 is a solid state drive, a hard disk drive, or the like.
- the auxiliary storage device 13 stores a training program 132, an analysis program 134, a training data database (DB) DB1 that stores a training data set and data necessary for generating the data set, an algorithm database (DB) DB2 that stores an algorithm, and a test data database (DB) DB3 that stores a data set for analysis (averaged spectral data set 82) and data necessary for generating the data.
- DB training data database
- DB algorithm database
- DB test data database
- the training data database DB1 stores the plurality of optical spectra 70 acquired from the measurement sample that contains a known substance, the averaged spectral data set 72, and the label information 75.
- the algorithm database DB2 stores the untrained deep learning algorithm 50 and/or the trained deep learning algorithm 60.
- Fig. 8 illustrates a functional configuration diagram of the analyzer 100.
- the analyzer 100 includes a known substance optical spectrum acquisition unit M1, a training data generation unit M2, a deep learning algorithm training unit M3, a test substance optical spectrum acquisition unit M4, a test data generation unit M5, an analytical result acquisition unit M6, a test substance information output unit M7, the training data database DB1, the algorithm database DB2, and the test data database DB3 .
- the known substance optical spectrum acquisition unit M1 corresponds to step S11 illustrated in Fig. 9 .
- the training data generation unit M2 corresponds to steps S14 to S18 illustrated in Fig. 9 .
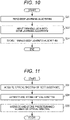
- the deep learning algorithm training unit M3 corresponds to steps S21 to S24 illustrated in Fig. 10 .
- the test substance optical spectrum acquisition unit M4 corresponds to step S31 illustrated in Fig. 11 .
- the test data generation unit M5 corresponds to steps S34 to S36 illustrated in Fig. 11 .
- the analytical result acquisition unit M6 corresponds to steps S41 to S43 illustrated in Fig. 12 .
- the test substance information output unit M7 corresponds to step S44 illustrated in Fig. 12 .
- Figs. 9 and 10 illustrate flows of the training process of the deep learning algorithm executed by the controller 10 according to the training program 132.
- the controller 10 accepts a process start command input through the input device 16 by an operator, and acquires a plurality of optical spectra of a known substance in step S11 illustrated in Fig. 9 . More specifically, the controller 10 receives, from the detector 500, data that represents an optical spectrum detected by the photodetector 560 when the measurement sample that contains a known substance is irradiated with the irradiation light (excitation light). In a case where the data that represents the optical spectrum is stored in the training data database DB1, the controller 10 acquires the optical spectrum of the known substance by reading the data from the training data database DB1.
- step S14 the controller 10 extracts optical spectra ascribed to the test substance or a substance bound to the test substance, from the plurality of optical spectra acquired in step S11.
- the optical spectra ascribed to the test substance or the substance bound to the test substance may be extracted according to the methods of step ii and step iii having been described in section 1-2. (1).
- the controller 10 stores the extracted optical spectra in the training data database DB1.
- step S16 the controller 10 randomly extracts a predetermined number of optical spectra among from the optical spectra extracted in step S14, and acquires an averaged spectral data set 72 from the extracted predetermined number of optical spectra.
- the averaged spectral data set 72 may be acquired by the method of step v having been described in section 1-2. (1).
- the controller 10 stores the acquired averaged spectral data set 72 in the training data database DB1.
- step S18 the controller 10 links the averaged spectral data set 72 acquired in step S16, with the label information 75 that indicates the type of known substance or the monomer sequence of the known substance, and stores the result in the training data database DB1.
- the label information 75 may be received from the input device 16, or may be received from other computer via the network 99.
- step S21 illustrated in Fig. 10 the controller 10 reads the deep learning algorithm 50 from the algorithm database DB2.
- step S22 the controller 10 inputs the averaged spectral data set 72 acquired in step S16 illustrated in Fig. 9 into the input layer of the deep learning algorithm 50, and inputs the label information 75, having been linked with the averaged spectral data set 72 in step S18, into the output layer of the deep learning algorithm 50.
- the deep learning algorithm 50 is thus trained.
- step S24 the controller 10 stores the trained deep learning algorithm 50 (60) in the algorithm database DB2.
- the processes in steps S16 to S24 are repeated to further train the deep learning algorithm 50 (60).
- Figs. 11 and 12 illustrate flows of analytical processes for a test substance executed by the controller 10 according to the analysis program 134.
- step S31 the controller 10 acquires a plurality of optical spectra of the measurement sample that contains the substance to be analyzed. More specifically, the controller 10 receives, from the detector 500, data that represents optical spectra detected by the photodetector 560, when the measurement sample that contains the substance to be analyzed is irradiated with the irradiation light (excitation light). In a case where the data that represents the optical spectra is stored in the test data database DB3, the controller 10 acquires the optical spectrum of the known substance by reading the data from the test data database DB3.
- step S34 the controller 10 extracts the optical spectra ascribed to the test substance or a substance bound to the test substance, from the plurality of optical spectra acquired in step S31.
- the optical spectra ascribed to the test substance or the substance bound to the test substance may be extracted according to the methods of step ii to step iv having been described in section 1-3.
- the controller 10 stores the extracted optical spectra 80 in the test data database DB3.
- step S36 the controller 10 randomly extracts a predetermined number of optical spectra from among the optical spectra extracted in step S34, and acquires an averaged spectral data set 82 from the extracted predetermined number of optical spectra 80a.
- the averaged spectral data set 82 may be acquired by the method of step v having been described in section 1-3.
- the controller 10 stores the acquired averaged spectral data set 82 in the test data database DB3.
- step S34 the processing in step S34 is omissible.
- the controller 10 acquires the averaged spectral data set 82 from the optical spectra acquired in step S31.
- step S41 illustrated in Fig. 12 the controller 10 reads the deep learning algorithm 60 from the algorithm database DB2.
- step S42 the controller 10 inputs the averaged spectral data set 82 acquired in step S36 illustrated in Fig. 11 to the deep learning algorithm 60.
- step S43 the controller 10 outputs an analytical result 85 from the deep learning algorithm 60, and stores the analytical result in the test data database DB3.
- step S44 the controller 10 generates information on the test substance on the basis of the analytical result 85 output from the deep learning algorithm 60, and outputs the information to the output device 17 and/or other computer connected via the network 99.
- the controller 10 also stores information on the test substance in the test data database DB3.
- the information on the test substance may be the analytical result 85 in itself, or may be information obtained by editing the analytical result 85.
- section 2. has described an exemplary case where the analyzer 100 takes part in the training of the deep learning algorithm 50 and the analysis of the test substance, the training of the deep learning algorithm 50 and the analysis of the test substance may rely upon any other computer.
- a training device 100A trains the deep learning algorithm 50
- an analyzer 100B analyzes the test substance.
- Data exchange between the training device 100A and the analyzer 100B is enabled via the media drive 98 or the network 99.
- the training device 100A and/or the analyzer 100B may be directly connected to the detector 500.
- the training device 100A and/or the analyzer 100B may acquire data that represents the optical spectra from the detector 500 via the media drive 98 or the network 99.
- the training device 100A, the analyzer 100B, and the detector 500 may be communicably connected to constitute an analyzer system.
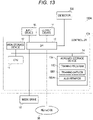
- Fig. 13 illustrates a hardware configuration of the training device 100A.
- the hardware configuration of the training device 100A is basically similar to that of the analyzer 100.
- the training device 100A has an auxiliary storage device 13A, in place of the auxiliary storage device 13 of the analyzer 100.
- the auxiliary storage device 13A stores the training program 132, the training data database (DB) DB1, and an algorithm database (DB) DB2A.
- Fig. 14 illustrates a functional configuration of the training device 100A.
- the training device 100A includes the known substance optical spectrum acquisition unit M1, the training data generation unit M2, the deep learning algorithm training unit M3, the training data database DB1, and the algorithm database DB2A.
- a controller 10A of the training device 100A trains the deep learning algorithm 50 according to the training program 132.
- the training at this time employs the process having been described in section 2-3
- the present embodiment employs the algorithm database DB2A in place of the algorithm database DB2.
- Fig. 15 illustrates a hardware configuration of an analyzer 100B.
- the hardware configuration of the analyzer 100B is basically similar to that of the analyzer 100.
- the analyzer 100B includes an auxiliary storage device 13B, in place of the auxiliary storage device 13 of the analyzer 100.
- the auxiliary storage device 13B stores an analysis program 134, an algorithm database (DB) DB2B, and the test data database DB3.
- DB algorithm database
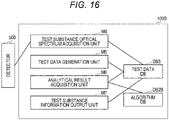
- Fig. 16 illustrates a functional configuration of the analyzer 100B.
- the analyzer 100B includes the test substance optical spectrum acquisition unit M4, the test data generation unit M5, the analytical result acquisition unit M6, the test substance information output unit M7, the algorithm database DB2B, and the test data database DB3 .
- the controller 10B of the analyzer 100B analyzes the test substance according to the analysis program 134 and the deep learning algorithm 60. Although the analysis at this time employs the process having been described in section 2-4, the present embodiment employs the algorithm database DB2B in place of the algorithm database DB2.
- the training program 132 and the analysis program 134 may be stored in a storage medium. That is, each program is stored in a storage medium such as hard disk, semiconductor memory device such as flash memory, or optical disk. Each program may alternatively be stored in a storage medium connectable via a network, such as cloud server. Each program may be provided in a download format, or as a program product stored in a storage medium.
- a storage format of the program in the storage medium is not limited as long as the program is readable by the individual devices.
- the storage in the storage medium is preferably in a nonvolatile manner.
- the SERS spectra were acquired with use of an aggregate of a metal nanoparticle that contains amino acid, dipeptide, or amyloid ⁇ (A ⁇ ), and analytical performances of the analytical method of the present embodiment and a prior method were then compared, on the basis of the spectra.
- optical spectra acquired pixel-wise in step iv having been described in section 1-2. (1) was input into the deep learning algorithm without acquiring the averaged spectral data set, the deep learning algorithm was trained, and analytical performance of the trained deep learning algorithm was verified. Of the plurality of optical spectra, 75% of them was used as the training data, and 25% of them was used as the analytical performance evaluation data.
- Fig. 17A shows the number of amino acid training data (numerals in "Training” column) and the number of the analytical performance evaluation data (numerals in “Test” column) in the prior method;
- Fig. 18A shows the number of dipeptide training data (numerals in "Training column”) and the number of analytical performance evaluation data (numerals in “Test” column);
- Fig. 19A shows the number of A ⁇ training data (numerals in "Training” column) and the number of analytical performance evaluation data (numerals in “Test” column).
- NC represents a negative control to which no sample was added.
- Fig. 17A lists amino acids in threeletter codes.
- Fig. 18A lists dipeptides with use of one-letter code amino acids.
- a ⁇ three spectra were randomly extracted from the training optical spectra, and then averaged to create one averaged spectral data set. This process was repeated substance-wise, to create 3000 averaged spectral data sets. The data sets were input into other unlearned deep learning algorithm together with a label that indicates the substance from which the optical spectra were acquired, to train the deep learning algorithm.
- optical spectra for analytical performance evaluation, 100 spectra were randomly extracted and averaged to create one averaged spectral data set. This process was repeated substance-wise, to create 1000 averaged spectral data sets for amino acid, 350 averaged spectral data sets for dipeptide, and 1500 averaged spectral data sets for A ⁇ . The data sets were input into the deep learning algorithm trained as described above, to obtain analytical results.
- a ⁇ As for A ⁇ , three spectra were randomly extracted from the training optical spectra, and then averaged to create one averaged spectral data set. This process was repeated substance-wise, to create 1500 averaged spectral data sets. The data sets were input into other deep learning algorithm trained as described above, to obtain analytical results.
- Fig. 17B shows the number of amino acid training data (numerals of "Training” column) and the number of analytical performance evaluation data (numerals in “Test” column) in the present embodiment
- Fig. 18B shows the number of dipeptide training data (numerals in "Training” column) and the number of analytical performance evaluation data (numerals in “Test” column)
- Fig. 19B shows the number of A ⁇ training data (numerals in "Training” column) and the number of analytical performance evaluation data (numerals in "Test” column), in a case where 100 spectra were used to create the averaged spectral data set.
- FIG. 19C shows the number of A ⁇ training data (numerals in "Training” column) and the number of analytical performance evaluation data (numerals in "Test” column), in a case where three spectra were used to create the averaged spectral data set.
- NC represents a negative control to which no sample was added.
- Fig. 17B lists amino acids in threeletter codes.
- Fig. 18B lists dipeptides with use of one-letter code amino acids.
- Fig. 20 shows the result of Comparative Example in a case where the test substance was amino acid.
- Fig. 21 shows the result of Example in a case where the test substance was amino acid. The accuracy was found to be higher in Example, for all amino acids.
- Fig. 22 shows the result of Comparative Example in a case where the test substance was dipeptide.
- Fig. 23 shows the result of Example in a case where the test substance was dipeptide. The accuracy was found to be higher in Example, for all dipeptides.
- Fig. 24A shows the result of Comparative Example in a case where the test substance was A ⁇ .
- Fig. 24B shows the result of Example in a case where 100 spectra were used to create the averaged spectral data set, and the test substance was A ⁇ .
- Fig. 24C shows the result of Example in a case where three spectra were used to create the averaged spectral data set, and the test substance was A ⁇ . The accuracy was found to be higher in Examples, for all types of A ⁇ .
Landscapes
- Health & Medical Sciences (AREA)
- Life Sciences & Earth Sciences (AREA)
- Engineering & Computer Science (AREA)
- Physics & Mathematics (AREA)
- Immunology (AREA)
- Chemical & Material Sciences (AREA)
- Molecular Biology (AREA)
- Biomedical Technology (AREA)
- General Health & Medical Sciences (AREA)
- General Physics & Mathematics (AREA)
- Hematology (AREA)
- Urology & Nephrology (AREA)
- Pathology (AREA)
- Biochemistry (AREA)
- Analytical Chemistry (AREA)
- Theoretical Computer Science (AREA)
- Spectroscopy & Molecular Physics (AREA)
- Food Science & Technology (AREA)
- Biotechnology (AREA)
- Microbiology (AREA)
- Cell Biology (AREA)
- Medicinal Chemistry (AREA)
- Computing Systems (AREA)
- Biophysics (AREA)
- Nanotechnology (AREA)
- Bioinformatics & Cheminformatics (AREA)
- Bioinformatics & Computational Biology (AREA)
- Crystallography & Structural Chemistry (AREA)
- Computational Linguistics (AREA)
- Evolutionary Computation (AREA)
- Artificial Intelligence (AREA)
- Software Systems (AREA)
- Mathematical Physics (AREA)
- Data Mining & Analysis (AREA)
- General Engineering & Computer Science (AREA)
- Nuclear Medicine, Radiotherapy & Molecular Imaging (AREA)
- Proteomics, Peptides & Aminoacids (AREA)
- Materials Engineering (AREA)
- Investigating, Analyzing Materials By Fluorescence Or Luminescence (AREA)
- Investigating Or Analysing Materials By Optical Means (AREA)
Applications Claiming Priority (2)
| Application Number | Priority Date | Filing Date | Title |
|---|---|---|---|
| JP2021035593A JP7583393B2 (ja) | 2021-03-05 | 2021-03-05 | 測定試料の調製方法、分析方法、試薬及び試薬キット |
| JP2021035597A JP7820720B2 (ja) | 2021-03-05 | 2021-03-05 | 被検物質の分析方法、分析装置、訓練方法、分析システム、及び分析プログラム |
Publications (1)
| Publication Number | Publication Date |
|---|---|
| EP4053842A1 true EP4053842A1 (fr) | 2022-09-07 |
Family
ID=80628662
Family Applications (2)
| Application Number | Title | Priority Date | Filing Date |
|---|---|---|---|
| EP22160175.0A Pending EP4053842A1 (fr) | 2021-03-05 | 2022-03-04 | Procédé d'analyse d'une substance de test, analyseur, analyseur, procédé d'entraînement, système d'analyseur et programme d'analyse |
| EP22160173.5A Active EP4053556B1 (fr) | 2021-03-05 | 2022-03-04 | Procédé de préparation d'échantillon de mesure, procédé d'analyse, réactif et kit de réactifs |
Family Applications After (1)
| Application Number | Title | Priority Date | Filing Date |
|---|---|---|---|
| EP22160173.5A Active EP4053556B1 (fr) | 2021-03-05 | 2022-03-04 | Procédé de préparation d'échantillon de mesure, procédé d'analyse, réactif et kit de réactifs |
Country Status (3)
| Country | Link |
|---|---|
| US (2) | US20220283154A1 (fr) |
| EP (2) | EP4053842A1 (fr) |
| CN (2) | CN115015211A (fr) |
Families Citing this family (1)
| Publication number | Priority date | Publication date | Assignee | Title |
|---|---|---|---|---|
| CN116030032A (zh) * | 2023-02-16 | 2023-04-28 | 四川省肿瘤医院 | 基于拉曼光谱数据的乳腺癌分析设备、系统及存储介质 |
Citations (4)
| Publication number | Priority date | Publication date | Assignee | Title |
|---|---|---|---|---|
| US20070155021A1 (en) | 2005-12-29 | 2007-07-05 | Intel Corporation | Modification of metal nanoparticles for improved analyte detection by surface enhanced Raman spectroscopy (SERS) |
| US20150177152A1 (en) * | 2007-06-06 | 2015-06-25 | Becton, Dickinson And Company | Near-infrared dyes as surface enhanced raman scattering reporters |
| JP2020071166A (ja) | 2018-11-01 | 2020-05-07 | 浜松ホトニクス株式会社 | スペクトル分析装置およびスペクトル分析方法 |
| JP6778451B1 (ja) * | 2020-01-10 | 2020-11-04 | 日本分光株式会社 | 異物分析方法、異物分析プログラムおよび異物分析装置 |
Family Cites Families (22)
| Publication number | Priority date | Publication date | Assignee | Title |
|---|---|---|---|---|
| JPH04163600A (ja) | 1990-10-29 | 1992-06-09 | Sekisui Chem Co Ltd | 話者認識方法 |
| EP0972183A4 (fr) * | 1997-04-04 | 2006-12-06 | Biosite Inc | Methodes mettant en oeuvre des particules magnetiques pour concentrer des ligands |
| US7321791B2 (en) * | 2003-09-23 | 2008-01-22 | Cambridge Research And Instrumentation, Inc. | Spectral imaging of deep tissue |
| WO2007044025A2 (fr) | 2004-11-22 | 2007-04-19 | Nanosphere, Inc. | Procede de detection d'analytes fonde sur l'illumination evanescente et detection de complexes sonde nanoparticule par diffusion de la lumiere |
| US20100035243A1 (en) * | 2006-07-10 | 2010-02-11 | Nanosphere, Inc. | Ultra-sensitive detection of analytes |
| TWI409457B (zh) * | 2008-06-16 | 2013-09-21 | Ind Tech Res Inst | 表面增強共振拉曼散射光譜奈米粒子探針及其使用方法 |
| GB201503603D0 (en) * | 2015-03-03 | 2015-04-15 | Univ Strathclyde | SERS active nanoparticles |
| US10801964B2 (en) * | 2015-07-30 | 2020-10-13 | The Research Foundation For The State University Of New York | Spectroscopic methods for body fluid age determination |
| US10914683B2 (en) * | 2016-11-03 | 2021-02-09 | Vanderbilt University | Methods and systems for identification of bacteria in biological fluid using raman spectroscopy and applications of same |
| US12136033B2 (en) * | 2017-02-09 | 2024-11-05 | Ramot At Tel-Aviv University Ltd. | Method and system for characterizing a nanostructure by machine learning |
| PL3662271T3 (pl) * | 2017-07-31 | 2024-02-19 | Smiths Detection Inc. | System do określania obecności substancji będącej przedmiotem zainteresowania w próbce |
| JP6438549B1 (ja) * | 2017-08-24 | 2018-12-12 | 日本分光株式会社 | 機械学習を用いた未知化合物の分類方法 |
| EP3682203B1 (fr) * | 2017-09-14 | 2024-08-28 | Polyvalor, Limited Partnership | Procédés et systèmes d'imagerie d'un échantillon par spectroscopie raman |
| JPWO2019073666A1 (ja) * | 2017-10-11 | 2020-12-03 | 株式会社ニコン | 判定装置、判定方法、および判定プログラム |
| US11428638B2 (en) * | 2018-01-12 | 2022-08-30 | The Regents Of The University Of California | Spectroscopic biological material characterization |
| JP6953632B2 (ja) * | 2018-07-09 | 2021-10-27 | オリンパス株式会社 | 光分析装置、光分析方法および学習済みモデル |
| JP7638620B2 (ja) | 2018-11-19 | 2025-03-04 | キヤノン株式会社 | 情報処理装置、情報処理装置の制御方法、プログラム、算出装置、及び算出方法 |
| JP7352365B2 (ja) | 2019-03-22 | 2023-09-28 | シスメックス株式会社 | 細胞の分析方法、深層学習アルゴリズムの訓練方法、細胞分析装置、深層学習アルゴリズムの訓練装置、細胞の分析プログラム及び深層学習アルゴリズムの訓練プログラム |
| US11841373B2 (en) * | 2019-06-28 | 2023-12-12 | Canon Kabushiki Kaisha | Information processing apparatus, method for controlling information processing apparatus, and program |
| JP7520107B2 (ja) * | 2019-08-28 | 2024-07-22 | ベンタナ メディカル システムズ, インコーポレイテッド | 振動分光法を使用して検体固定の持続時間および品質を評価するためのシステムおよび方法 |
| CN114868011A (zh) * | 2019-10-25 | 2022-08-05 | 斯坦福大学托管董事会 | 溶液中颗粒鉴别的系统和方法 |
| US12499419B2 (en) * | 2020-09-30 | 2025-12-16 | X Development Llc | Techniques for predicting the spectra of materials using molecular metadata |
-
2022
- 2022-03-04 EP EP22160175.0A patent/EP4053842A1/fr active Pending
- 2022-03-04 CN CN202210206718.0A patent/CN115015211A/zh active Pending
- 2022-03-04 US US17/686,784 patent/US20220283154A1/en active Pending
- 2022-03-04 CN CN202210218324.7A patent/CN115014886A/zh active Pending
- 2022-03-04 EP EP22160173.5A patent/EP4053556B1/fr active Active
- 2022-03-04 US US17/686,802 patent/US12066433B2/en active Active
Patent Citations (5)
| Publication number | Priority date | Publication date | Assignee | Title |
|---|---|---|---|---|
| US20070155021A1 (en) | 2005-12-29 | 2007-07-05 | Intel Corporation | Modification of metal nanoparticles for improved analyte detection by surface enhanced Raman spectroscopy (SERS) |
| US20150177152A1 (en) * | 2007-06-06 | 2015-06-25 | Becton, Dickinson And Company | Near-infrared dyes as surface enhanced raman scattering reporters |
| JP2020071166A (ja) | 2018-11-01 | 2020-05-07 | 浜松ホトニクス株式会社 | スペクトル分析装置およびスペクトル分析方法 |
| JP6778451B1 (ja) * | 2020-01-10 | 2020-11-04 | 日本分光株式会社 | 異物分析方法、異物分析プログラムおよび異物分析装置 |
| US20210247233A1 (en) * | 2020-01-10 | 2021-08-12 | Jasco Corporation | Foreign matter analysis method, storage medium storing foreign matter analysis program, and foreign matter analysis apparatus |
Non-Patent Citations (2)
| Title |
|---|
| JIAN-AN HUANG ET AL: "SERS discrimination of single amino acid residue in single peptide by plasmonic nanocavities", ARXIV.ORG, CORNELL UNIVERSITY LIBRARY, 201 OLIN LIBRARY CORNELL UNIVERSITY ITHACA, NY 14853, 9 August 2019 (2019-08-09), XP081558001 * |
| WENG SHIZHUANG ET AL: "Deep learning networks for the recognition and quantitation of surface-enhanced Raman spectroscopy", vol. 145, no. 14, 13 July 2020 (2020-07-13), UK, pages 4827 - 4835, XP055943732, ISSN: 0003-2654, Retrieved from the Internet <URL:https://pubs.rsc.org/en/content/articlepdf/2020/an/d0an00492h> DOI: 10.1039/D0AN00492H * |
Also Published As
| Publication number | Publication date |
|---|---|
| US20220283083A1 (en) | 2022-09-08 |
| US20220283154A1 (en) | 2022-09-08 |
| EP4053556A1 (fr) | 2022-09-07 |
| EP4053556B1 (fr) | 2025-05-21 |
| US12066433B2 (en) | 2024-08-20 |
| CN115015211A (zh) | 2022-09-06 |
| CN115014886A (zh) | 2022-09-06 |
Similar Documents
| Publication | Publication Date | Title |
|---|---|---|
| EP2660639B1 (fr) | Procédé et appareil de localisation de particules uniques au moyen d'une analyse d'ondelettes | |
| US20120015825A1 (en) | Analytical systems and methods with software mask | |
| US8182993B2 (en) | Methods and processes for calling bases in sequence by incorporation methods | |
| US20020008211A1 (en) | Fluorescence intensity multiple distributions analysis: concurrent determination of diffusion times and molecular brightness | |
| US7557915B2 (en) | Automated acquisition of spectral data and image data | |
| US20060176479A1 (en) | Monitoring molecular interactions using photon arrival-time interval distribution analysis | |
| Lidke et al. | The role of photon statistics in fluorescence anisotropy imaging | |
| JP2019521316A (ja) | 画像解像度が改良された蛍光イメージングフローサイトメトリー | |
| CN111033230A (zh) | 利用光谱的高速分类进行的实时光谱解析 | |
| US9494779B2 (en) | Optical analysis device, optical analysis method and computer program for optical analysis using single particle detection | |
| CN112240863A (zh) | 测定装置、测定装置的调整方法及计算机存储介质 | |
| US20210156784A1 (en) | Photoanalysis device, photoanalysis method and neural network system | |
| JP2019095206A (ja) | 試料分析システム、表示方法及び試料分析方法 | |
| JP6970112B2 (ja) | 概観画像をセグメント化することにより分散オブジェクトを検査するための方法 | |
| TW202035972A (zh) | 頻譜分析裝置及頻譜分析方法 | |
| JP6708983B2 (ja) | 微小粒子測定装置、情報処理装置及び情報処理方法 | |
| EP4053842A1 (fr) | Procédé d'analyse d'une substance de test, analyseur, analyseur, procédé d'entraînement, système d'analyseur et programme d'analyse | |
| US20100068714A1 (en) | Multivariate detection of molecules in biossay | |
| CN119422203A (zh) | 评估用于生成流式细胞仪数据的荧光染料组合适用性的方法和系统 | |
| US20180106781A1 (en) | Cell analysis using dynamic biophysical methods | |
| US8859996B2 (en) | Methods and systems for image data processing | |
| JP7820720B2 (ja) | 被検物質の分析方法、分析装置、訓練方法、分析システム、及び分析プログラム | |
| JP4792580B2 (ja) | 発光寿命測定装置およびその測定方法 | |
| WO2020239981A1 (fr) | Système de cytométrie par imagerie quantitative hyperspectrale | |
| WO2026052122A1 (fr) | Procédé et appareil de mesure de substance cible en solution, et dispositif électronique |
Legal Events
| Date | Code | Title | Description |
|---|---|---|---|
| PUAI | Public reference made under article 153(3) epc to a published international application that has entered the european phase |
Free format text: ORIGINAL CODE: 0009012 |
|
| STAA | Information on the status of an ep patent application or granted ep patent |
Free format text: STATUS: THE APPLICATION HAS BEEN PUBLISHED |
|
| AK | Designated contracting states |
Kind code of ref document: A1 Designated state(s): AL AT BE BG CH CY CZ DE DK EE ES FI FR GB GR HR HU IE IS IT LI LT LU LV MC MK MT NL NO PL PT RO RS SE SI SK SM TR |
|
| STAA | Information on the status of an ep patent application or granted ep patent |
Free format text: STATUS: REQUEST FOR EXAMINATION WAS MADE |
|
| 17P | Request for examination filed |
Effective date: 20230220 |
|
| RBV | Designated contracting states (corrected) |
Designated state(s): AL AT BE BG CH CY CZ DE DK EE ES FI FR GB GR HR HU IE IS IT LI LT LU LV MC MK MT NL NO PL PT RO RS SE SI SK SM TR |
|
| STAA | Information on the status of an ep patent application or granted ep patent |
Free format text: STATUS: EXAMINATION IS IN PROGRESS |
|
| 17Q | First examination report despatched |
Effective date: 20250926 |