EP4103931B1 - Contrôle d'un échantillon vis-à-vis de la contamination - Google Patents
Contrôle d'un échantillon vis-à-vis de la contamination Download PDFInfo
- Publication number
- EP4103931B1 EP4103931B1 EP20821133.4A EP20821133A EP4103931B1 EP 4103931 B1 EP4103931 B1 EP 4103931B1 EP 20821133 A EP20821133 A EP 20821133A EP 4103931 B1 EP4103931 B1 EP 4103931B1
- Authority
- EP
- European Patent Office
- Prior art keywords
- sample
- decay time
- contamination
- inspecting
- time distribution
- Prior art date
- Legal status (The legal status is an assumption and is not a legal conclusion. Google has not performed a legal analysis and makes no representation as to the accuracy of the status listed.)
- Active
Links
Images






















Classifications
-
- G—PHYSICS
- G01—MEASURING; TESTING
- G01N—INVESTIGATING OR ANALYSING MATERIALS BY DETERMINING THEIR CHEMICAL OR PHYSICAL PROPERTIES
- G01N21/00—Investigating or analysing materials by the use of optical means, i.e. using sub-millimetre waves, infrared, visible or ultraviolet light
- G01N21/62—Systems in which the material investigated is excited whereby it emits light or causes a change in wavelength of the incident light
- G01N21/63—Systems in which the material investigated is excited whereby it emits light or causes a change in wavelength of the incident light optically excited
- G01N21/64—Fluorescence; Phosphorescence
- G01N21/6408—Fluorescence; Phosphorescence with measurement of decay time, time resolved fluorescence
-
- G—PHYSICS
- G01—MEASURING; TESTING
- G01N—INVESTIGATING OR ANALYSING MATERIALS BY DETERMINING THEIR CHEMICAL OR PHYSICAL PROPERTIES
- G01N21/00—Investigating or analysing materials by the use of optical means, i.e. using sub-millimetre waves, infrared, visible or ultraviolet light
- G01N21/62—Systems in which the material investigated is excited whereby it emits light or causes a change in wavelength of the incident light
- G01N21/63—Systems in which the material investigated is excited whereby it emits light or causes a change in wavelength of the incident light optically excited
- G01N21/64—Fluorescence; Phosphorescence
- G01N21/6428—Measuring fluorescence of fluorescent products of reactions or of fluorochrome labelled reactive substances, e.g. measuring quenching effects, using measuring "optrodes"
- G01N21/643—Measuring fluorescence of fluorescent products of reactions or of fluorochrome labelled reactive substances, e.g. measuring quenching effects, using measuring "optrodes" non-biological material
-
- G—PHYSICS
- G01—MEASURING; TESTING
- G01N—INVESTIGATING OR ANALYSING MATERIALS BY DETERMINING THEIR CHEMICAL OR PHYSICAL PROPERTIES
- G01N21/00—Investigating or analysing materials by the use of optical means, i.e. using sub-millimetre waves, infrared, visible or ultraviolet light
- G01N21/84—Systems specially adapted for particular applications
- G01N21/88—Investigating the presence of flaws or contamination
- G01N21/94—Investigating contamination, e.g. dust
-
- G—PHYSICS
- G01—MEASURING; TESTING
- G01N—INVESTIGATING OR ANALYSING MATERIALS BY DETERMINING THEIR CHEMICAL OR PHYSICAL PROPERTIES
- G01N33/00—Investigating or analysing materials by specific methods not covered by groups G01N1/00 - G01N31/00
- G01N33/02—Food
- G01N33/12—Meat; Fish
-
- G—PHYSICS
- G01—MEASURING; TESTING
- G01N—INVESTIGATING OR ANALYSING MATERIALS BY DETERMINING THEIR CHEMICAL OR PHYSICAL PROPERTIES
- G01N21/00—Investigating or analysing materials by the use of optical means, i.e. using sub-millimetre waves, infrared, visible or ultraviolet light
- G01N21/62—Systems in which the material investigated is excited whereby it emits light or causes a change in wavelength of the incident light
- G01N21/63—Systems in which the material investigated is excited whereby it emits light or causes a change in wavelength of the incident light optically excited
- G01N21/64—Fluorescence; Phosphorescence
- G01N21/645—Specially adapted constructive features of fluorimeters
- G01N21/6456—Spatial resolved fluorescence measurements; Imaging
- G01N2021/646—Detecting fluorescent inhomogeneities at a position, e.g. for detecting defects
Definitions
- the present invention relates to the inspection of a sample.
- the present invention relates to the inspection of a food sample for plastic contamination and a decrease in quality caused by intensive light irradiation.
- Materials and products such as food can become contaminated during or after their production. Depending on the type of substance causing the contamination, said contamination can be harmful to health and at the same time difficult to detect with the naked eye. In addition to contamination, the quality of food can also decrease due to incorrect storage and, in particular, exposure to intense light.
- BOUCHARD ALAIN ET AL "Optical characterization of Pseudomonas fluorescens on meat surfaces using time-resolved fluorescence", JOURNAL OF BIOMEDICAL OPTICS, Volume 11, No. 1, January 1, 2006 (2006-01-01), page 014011 , presents an optical system that can detect bacteria on meat surfaces based on the autofluorescence of the bacteria.
- a method for determining the degree of freshness of foodstuffs is known, using at least one energy source from which an energy stream is directed onto the foodstuff to be examined, so that the foodstuff is stimulated to autofluorescence and emits fluorescent radiation, and using a detector which detects the fluorescent radiation emitted by the foodstuff, wherein the detected fluorescent radiation, depending on its wavelength and/or radiation intensity, produces detector signals in the detector, which are compared with reference values and used on the basis of a quality criterion to make a statement about the degree of freshness of the foodstuff.
- a method according to the invention for checking a sample for contamination comprises determining a deviation of a decay time distribution of an autofluorescence of the sample excited by electromagnetic radiation from an expected decay time distribution, wherein the contamination comprises plastic, glass, metal or ceramic or consists of plastic, glass, metal or ceramic.
- the method may further comprise indicating a contamination of the sample when the deviation is associated with the contamination.
- sample as used in the description and the claims is to be understood in particular as water or an organic material.
- the organic material can be, for example, a food of animal or plant origin, such as meat, cheese, fruit, vegetables, etc.
- contaminant as used in the description and the claims is to be understood in particular as a (solid or liquid) substance that is not intended (or suitable) for consumption, such as a plastic and in particular plastic particles smaller than 5 mm (microplastics), smaller than 1 mm, smaller than 0.1 mm or smaller than 0.01 mm.
- the organic material can also be a stool or tissue sample.
- decay time distribution as used in the description and the claims is to be understood in particular as data from which a decay time statistic can be derived.
- electromagnetic radiation as used in the description and the claims is to be understood in particular as electromagnetic radiation of a narrow wavelength range, such as laser radiation.
- the electromagnetic radiation can, for example, have a wavelength in the range from 425 nm to 550 nm, such as 488 nm.
- the electromagnetic radiation can be frequency, phase or amplitude modulated.
- autofluorescence as used in the description and the claims is to be understood in particular as a spontaneous (wavelength-shifted) emission of electromagnetic radiation by the sample material or by the contamination, wherein the spontaneous emission follows (delayed) the excitation of the sample material (by said electromagnetic radiation).
- Contamination can be indicated acoustically, haptically, visually or by an electrical signal.
- the electrical signal can cause a food that has been identified as contaminated to be sorted out and/or cleaned or possibly disposed of.
- the electrical signal can also be used to classify or sort food according to the degree of contamination.
- the method may further comprise decomposing the decay time distribution of the autofluorescence of the sample excited by the electromagnetic radiation into one or more components associated with a material of the sample and one or more residual components.
- the decay time distribution can, for example, be (approximately) decomposable into two or more (possibly partially overlapping) distributions.
- the distributions can be symmetrical to local maxima of the decay time distribution.
- the local maxima of the decay time distribution can be determined in a first step and, in a second step, the decay time distribution can be decomposed into symmetrical distributions (e.g. Gaussian distributions) whose vertices (essentially) coincide with the local maxima.
- the method may further comprise matching the one or more moieties associated with the material of the sample with a characteristic decay time distribution of a foodstuff.
- the characteristic decay time distribution can be derived from a reference measurement or from a large number of reference measurements (e.g. by averaging) or generated artificially (as an idealized decay time distribution).
- the method may further comprise matching the one or more residual fractions with a decay time distribution of the impurity.
- an average decay time of a (Gaussian) distribution assigned to a residual component or an average decay time of the residual component with average decay times of known possible contaminants and, if they match, assigned to one of these contaminants.
- the contamination may, for example, comprise or consist of a plastic, e.g. polyamide, polyethylene, polyvinyl chloride, polyethylene terephthalate, polystyrene, polypropylene, or acrylonitrile butadiene styrene, which has a characteristic decay time distribution.
- a plastic e.g. polyamide, polyethylene, polyvinyl chloride, polyethylene terephthalate, polystyrene, polypropylene, or acrylonitrile butadiene styrene, which has a characteristic decay time distribution.
- a residual portion that cannot be assigned to a known possible contamination e.g. because there is no or only a (too) low agreement between the residual portion and the (Gaussian) distributions assigned to known contamination, can be analyzed to determine whether it has pronounced local maxima that may indicate an unknown contamination or whether it has no pronounced maxima and is to be interpreted as measurement noise.
- a contamination can shadow an area of the sample material and thereby cause a change in the fluorescence spectrum.
- the method can further comprise comparing decay time distributions of the autofluorescence excited by the electromagnetic radiation from two or more different sample volumes or samples. Contamination can be indicated, for example, if a deviation of the two or more decay time distributions from one another lies outside a tolerance range.
- a measure of deviation for example, a function of the distance between the peaks of the distributions, a degree of overlap of the distributions, a difference in the width of the distributions or a (weighted) combination of two or all of these factors can be used.
- a decay time distribution of a sample or a decay time distribution derived from several decay time distributions of different samples can be used as a reference.
- a reference can be generated by a moving average over several measured decay time distributions that do not indicate any contamination.
- the reference determined by moving average over several measured decay time distributions can also be used to detect trends.
- the homogeneity of the samples can also be checked through continuous comparison.
- the method may further comprise determining a shift of the decay time distribution relative to a reference and indicating a quality degradation if the decay time distribution is outside a tolerance range around the reference.
- shift in the decay time distribution is to be understood in particular as a reduction in an (average) decay time. Such a reduction in the (average) decay time can be brought about, for example, by sustained light irradiation.
- a function of the distance between (corresponding) local maxima of the distributions and/or a degree of overlap of the distributions can serve as a measure of the shift.
- the device according to the invention for checking a sample comprises an emitter, designed to emit a frequency-, phase- or amplitude-modulated light and a detector, designed to record an autofluorescence of the sample excited by the electromagnetic radiation, wherein the device is designed to determine a result of the check on the basis of a decay time distribution of the autofluorescence of the sample.
- the device is further designed to indicate contamination of the sample if the decay time distribution of the autofluorescence of the sample deviates from an expected decay time distribution, wherein the contamination comprises plastic, glass, metal or ceramic or consists of plastic, glass, metal or ceramic.
- the device can further be configured to capture a sample outline.
- Detecting the sample outline can be used to reduce interference at the sample edges.
- the device can only use measurement values that are located at measuring points within the sample outline and/or at a certain distance from the sample outline.
- the device may further be configured to locate the contamination relative to the sample outline.
- the size and shape of the contamination can be derived from the sample outline.
- the device can further be configured to report a sample quality issue if the autofluorescence decay time is lower than expected.
- the device may further comprise a knife and be configured to cut a foodstuff.
- the device can be set up for cutting meat or meat products (especially sausage) so that any packaging parts that may get into the sausage during cutting can be detected.
- meat or meat products especially sausage
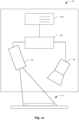
- Fig. 1 shows device 10, which is used to check sample 12.
- Device 10 comprises emitter 14 and detector 16.
- Emitter 14 is set up to emit amplitude-modulated electromagnetic radiation.
- Detector 16 is set up to record autofluorescence (from sample 12) excited by the electromagnetic radiation.
- Device 10 also comprises computer unit 18, which is set up to determine a result of the check on the basis of a decay time distribution of the autofluorescence. As in Fig. 1a and Fig. 1b illustrated, the result can be displayed visually or acoustically to a user of device 10 on display device 10a.
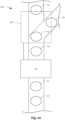
- Fig. 2 shows a possible modification of the Fig. 1 shown arrangement, in which samples 12 are moved past device 10 by means of conveyor system 100.
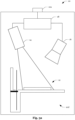
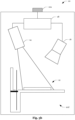
- Computer unit 18 can monitor the conveying speed of conveyor system 100 and Monitoring process synchronize with the conveyor speed. Furthermore, computer unit 18 can indicate contamination of a sample, whereupon conveyor system 100 removes the sample, as shown in Fig. 2a illustrated, sort out using device 10b or as in Fig. 2b illustrated, can be freed from the contamination by means of device 10c.
- Fig. 3 shows another possible modification of the Fig. 1
- device 10 comprises cutting machine 10d.
- Cutting machine 10d has a knife that is intended for cutting food.
- Cutting machine 10d can be, for example, a sausage cutting machine.
- Device 10 can be set up to monitor whether the sausage is contaminated with plastic, for example, during cutting.
- detector 16 can be aligned such that the cut sausage slices (samples 12) come to lie in the detection range of detector 16 after cutting.
- the result can be displayed (visually) to a user of device 10 by means of display device 10a.
- device 10 can emit a signal when a contaminated sample is detected.
- display device 10a can change from a first state (e.g. a green color) to a second state (e.g. a red color) when a contaminated sample 12 is detected.
- display device 10a can output a first acoustic or haptic signal when a non-contaminated sample is detected and a second acoustic or haptic signal when a contaminated sample is detected.
- Device 10 can, for example, be used directly in a sales area and serve both an operator and a customer to detect contamination and take appropriate measures.
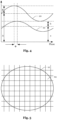
- Fig. 4 illustrates a sinusoidal amplitude modulation 20 of the electromagnetic radiation, which causes a phase-shifted modulation 22 of the autofluorescence by ⁇ .
- detector 16 can divide the surface of sample 12 into (equal-sized) (measurement) segments 24. Detector 16 can determine ⁇ P for each segment 24 individually (once or several times). From the total of all ⁇ P , as shown in Fig. 6 illustrated, decay time distribution 26 can be determined.
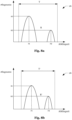
- Fig. 6a illustrates a change in decay time distribution 26 that can result from contamination.
- the Fig. 6a shown changed decay time distribution 26' differs from the decay time distribution 26 in that it can be (essentially) decomposed into two non-overlapping (Gaussian) distributions 28a and 28b.
- (Gaussian) distribution 28a (essentially) agrees with decay time distribution 26 with regard to the decay time at which the maxima of distribution 26 and (Gaussian) distribution 28a can be found
- (Gaussian) distribution 28a is shifted towards higher decay times (by distance D) compared to decay time distribution 26.
- distance D (or a function of distance D) can serve as a measure of the probability of the presence of contamination.
- Further evaluation strategies include specifying a tolerance range T and indicating contamination if a function of the segments of decay time distribution 26' lying outside the tolerance range T exceeds (or falls below) a threshold value, calculating an overlap (spectrum or area-wise) of decay time distribution 26 and decay time distribution 26', etc.
- Fig. 6b illustrates another change in decay time distribution 26 that can result from contamination.
- the modified cooldown distribution 26" shown in Figure 26 differs from cooldown distribution 26 in that, as shown in Fig. 6b' illustrated, can be broken down into three overlapping (Gaussian) distributions 28a, 28b and 28c.
- (Gaussian) distribution 28a can be assigned to a non-contaminated part of sample 12 and (Gaussian) distribution 28b to a contaminated part of sample 12.
- Gaussian distribution 28c which overlaps with (Gaussian) distribution 28a and (Gaussian) distribution 28b, can be assigned to a transition between the non-contaminated part and the contaminated part of sample 12.
- the decomposition can be carried out (in cases of low complexity), for example, by determining (possibly after smoothing) local maxima (vertices) M1, M2 and M3 and, starting from the outer maxima M1 and M3, fitting symmetric distributions to the non-overlapping sections NÜ1 and NÜ2 (or, if necessary, to the sections that overlap as little as possible).
- distances D1, D2 and/or D3 (or a function thereof) between the maximum of the decay time distribution 26 and the local maxima of the decay time distribution 26" can be used to make a statement about the probability of the presence of a contamination.
- a tolerance range T can be set and a contamination can be indicated if a function of the segments of the decay time distribution 26" lying outside the tolerance range T exceeds (or falls below) a threshold value.
- Fig. 6b " illustrates an overlap (spectrum or area-wise) of Decay time distribution 26 and decay time distribution 26" can be determined and if the overlap is too small, the presence of contamination can be concluded.
- An overlap that is too small can be determined, for example, on the basis of a function that includes (an extension or) an integral of the decay time distribution 26" over an area NÜ in which no overlap occurs. Furthermore, an overlap that is too small can be determined, for example, on the basis of a function that includes an integral of the decay time distribution 26 and decay time distribution 26" over the overlap area Ü.
- the totality of all ⁇ P can also lead to a decay time distribution 26 that is composed of several symmetric (Gaussian) distributions.
- a decay time distribution 26 determined by measurement or analysis can serve as a reference and deviations from the reference can be interpreted as evidence of contamination.
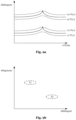
- a moving reference can be formed instead of a static reference, which can be particularly advantageous if the composition of the samples is subject to (natural) fluctuations. If, as in Fig.
- one (or more) of the monitored values such as one or more characteristic decay times, outside a tolerance range T1 and/or T2 around the sliding reference r1 or r2, this can be interpreted as an indication of contamination.
- a tolerance range T1 and/or T2 around the sliding reference r1 or r2
- this can be interpreted as an indication of contamination.
- multidimensional tolerance ranges T1 and T2 can also be formed.
- contamination 30 can be detected as in Fig. 10 illustrated, can be localized.
- each pixel generated by an optical sensor can be assigned a decay time and the pixels can be grouped according to their decay time. If contamination occurs, the contaminated area can be represented by pixels that have a decay time that differs from one or more typical decay times. This enables the contamination to be localized and (with appropriate resolution) the shape and size to be determined and the contamination to be identified.
- contamination 30 can be determined and, if necessary, identified. Furthermore, as in Fig. 11 As indicated, the computer unit 18 can be set up to detect the sample outline 32 and to localize and visualize the contamination 30 relative to the sample outline 32. For example, different colors or brightnesses can be assigned to different values of ⁇ P and each Segment 24 can be assigned a corresponding color or brightness. Furthermore, the detection of sample outline 32 can be used to mark segments 24 that extend beyond the edge of sample 12 or not to take them into account in the determination of the decay time distribution 26.
- Fig. 12 and Fig. 13 illustrate a shift in decay time distribution 26 relative to reference R.
- Such a shift can be caused in foodstuffs and in particular in meat products by prolonged exposure to light. The shift can therefore be used to determine whether there has been light exposure and thus the type of storage and in particular the quality of sample 12. If decay time distribution 26 is outside the tolerance range T, the deterioration in quality can be indicated.
- Fig. 14 shows a flow chart of an exemplary method. The method begins at step 34 by determining whether decay time distribution 26' or 26" deviates from an expected decay time distribution 26. If decay time distribution 26' or 26" deviates from the expected decay time distribution 26, then step 36 indicates that contamination is present.
- Fig. 15 shows a flow chart of an exemplary method.
- the method begins at step 38 with the detection of decay time distribution 26′′′.
- the method continues at step 40 with the determination of the shift of the decay time distribution 26′′′ relative to the reference R. If the decay time distribution is outside the tolerance range T, the quality degradation is indicated in step 42.
- salami made from pork and beef as a typical chopped end product that is often sold in plastic packaging.
- salami is dominated by its typical red colour, which is partly enhanced by the addition of food colouring, for example by the use of natural cochineal (carminic acid).
- CAS registration number RN 1260-17-9 which makes characterization by absorption measurements more difficult.
- fluorescence in which the fluorescent chromophores are selected, other staining can at most lead to a weakening of the fluorescence intensity.
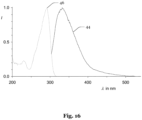
- Fig. 16 shows fluorescence spectrum 44 (maximum at 333 nm) of a natural salami made from pork and beef ("organic product").
- the main part of the fluorescence spectrum 44 extends over the invisible UV range, with a weaker extensions into the visible range, which leads to a faint bluish hue when illuminated with a strong fluorescent lamp.
- the corresponding absorption spectrum 46 (maximum at 295 nm) gives an impression of the light absorption of relevant chromophores for fluorescence.
- the fluorescence decay time of the autofluorescence whose time constant can be measured with high precision, is characteristic of the food product (here the salami) and is therefore of fundamental interest for its identification.
- Plastics can appear in processed foods not only through packaging, transport containers and defective machine parts, but also through their entry into the environment as microplastics. For this reason, initial tests were carried out on three types of salami using the plastics polyamide, polyethylene terephthalate and polyvinyl chloride. Plastic flakes made of PA, PET and PVC from films were placed on the salami as contamination (1-2 mm in size and very difficult or impossible to distinguish from fat etc. with the naked eye).
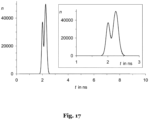
- Fig. 17 illustrates the fluorescence decay behavior of turkey salami after excitation at 488 nm based on the frequency of fluorescence decay times n as a function of time t in ns, where the solid thick curve represents the measured values and the thin dashed curve (almost completely covered by the thick curve) represents a simulated course on Based on a Gaussian analysis (the inset shows a spread representation of the range between 1 and 3 ns).
- Fig. 18 illustrates the fluorescence decay behavior of beef salami after excitation at 488 nm based on the frequency of fluorescence decay times n as a function of time t in ns, where the solid thick curve shows the measured values and the thin dashed curve (almost completely covered by the thick curve) shows a simulated course based on a Gaussian analysis.
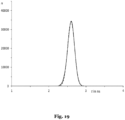
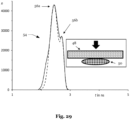
- Fig. 19 illustrates the fluorescence decay behavior of pork salami after excitation at 488 nm based on the number of frequencies of fluorescence decay times n as a function of time t in ns, where the solid thick curve shows the measured values and the thin dashed curve (almost completely covered by the thick curve) shows a simulated course based on a Gaussian analysis.
- Fig. 20 illustrates the change in the fluorescence decay time constant ⁇ of turkey salami as a function of the irradiation dose (dots).
- the relationship between irradiation dose and change can be approximated by an exponential function (first order, shown as a solid curve), with the inset showing a linear evaluation according to first order with a slope of 0.788 and a correlation coefficient of 0.995 (based on 5 measured values).
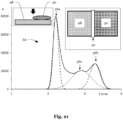
- Fig. 21 illustrates the fluorescence decay behavior of turkey salami 48, which was contaminated with polyamide, in an edge region 52 of the contamination 50.
- the decay time spectrum 54 can be decomposed into three symmetrical (Gaussian) distributions around the maxima 56a, 56b and 56c.
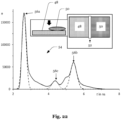
- Fig. 22 illustrates the fluorescence decay behavior of turkey salami 48, which was contaminated with PVC, in an edge region 52 of the contamination 50.
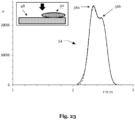
- Fig. 23 illustrates the fluorescence decay behavior of turkey salami 48, which was contaminated with PET, in a peripheral region of the contamination 50. Since the fluorescence decay times of turkey salami 48 and contamination 50 are more similar here, two maxima 56a and 56b are found that are relatively close to each other.
- Fig. 24 illustrates the fluorescence decay behavior of turkey salami 48, which was contaminated with polyamide on a side opposite the irradiation.
- the contamination can again be clearly determined, since there is a convolution of the fluorescence decay times of polyamide and the salami, with the higher penetration depth of the exciting light having a positive effect.
- fragments and chips from a Euronorm E2 container which is used to transport meat in meat production plants, were placed on and under a slice of salami, as well as between two slices of salami.
- a microscope with a 20x magnification lens from Nikon was available to inspect the samples, to which the laser and camera were also attached.
- the salami samples were prepared on a glass slide with the plastics.
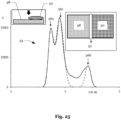
- Fig. 25 illustrates the fluorescence decay behavior of beef salami 48, which was contaminated with a plastic, in an edge region 52 of the contamination 50.
- the relatively weak expression of maximum 56b is due to the small size of the plastic in the 1008 ⁇ 1008 matrix.
- Fig. 26 illustrates the fluorescence decay behavior of beef salami 48, which was contaminated with plastic on a side opposite the irradiation.
- Fig. 30 illustrates the fluorescence decay behavior of two slices of pork salami with a piece of plastic between them. It can be seen that the plastic between the slices can be detected more easily than if it is attached to the back of just one slice, because the second slice adds another reflection surface that reflects more fluorescent light back onto the matrix detector. Three maxima 56a, 56b and 56c can be determined.
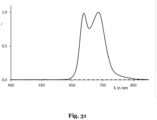
- Fig. 31 illustrates the fluorescence spectrum of a lettuce leaf at an excitation wavelength of 488 nm.
- the fluorescence spectrum of the lettuce leaf shows a Stokes shift of >200 nm, whereas the plastic used fluoresces plastics with a Stokes shift of 20-100 nm. If an optical bandpass filter is used in the beam path, it can be achieved that only the fluorescence signal of the plastic is recorded.
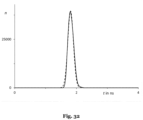
- Fig. 32 illustrates the fluorescence decay behavior of a lettuce leaf without contamination, where the solid, thick curve represents the experimental values and the dashed, thin curve (almost completely covered by the experimental curve) represents a simulated curve based on a Gaussian analysis.
- Fig. 33 illustrates the fluorescence decay behavior of a lettuce leaf which was contaminated on the upper side with red HDPE plastic, where the solid, thick curve represents the experimental values and the dashed, thin curve (mostly covered by the experimental curve) represents a simulated curve based on a Gaussian analysis.
- Fig. 34 illustrates the fluorescence decay behavior of a lettuce leaf that was contaminated on the underside with red HDPE plastic, where the solid, thick curve represents the experimental values and the dashed, thin curve (partially covered by the experimental curve) represents a simulated curve based on a Gaussian analysis.
- the fluorescence of the plastic transmits through the lettuce leaf and is influenced by it.
- Fig. 35 illustrates the fluorescence decay behavior of a salad puree that was contaminated on the top with red HDPE plastic, where the solid, thick curve represents the experimental values and the dashed, thin curve (partially covered by the experimental curve) represents a simulated curve based on a Gaussian analysis.
- Fig. 36 illustrates the fluorescence decay behavior of a salad mixture that was contaminated with the red HDPE plastic under a thin layer, where the solid, thick curve represents the experimental values and the dashed, thin curve (largely covered by the experimental curve) represents a simulated curve based on a Gaussian analysis.
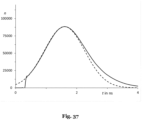
- Fig. 37 illustrates the fluorescence decay behavior of ham that has not been contaminated, whereby the solid, thick curve represents the experimental values and the dashed, thin curve (partially covered by the experimental curve) represents a simulated curve based on a Gaussian analysis.
- Fig. 38 illustrates the fluorescence decay behavior of ham that was contaminated with red HDPE plastic on the surface, where the solid, thick curve represents the experimental values and the dashed and dotted, thin curve represents a simulated course based on a Gaussian analysis.
- the plastic can thus be clearly detected and identified.
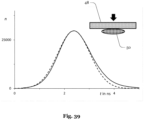
- Fig. 39 illustrates the fluorescence decay behavior of ham that was contaminated with red HDPE plastic on the underside, where the solid, thick curve represents the experimental values and the dashed, thin curve (partially covered by the experimental curve) represents a simulated curve based on a Gaussian analysis.
- Fig. 40 illustrates the fluorescence decay behavior of fish, where the solid, thick curve represents the experimental values and the dashed, thin curve (partially covered by the experimental curve) represents a simulated curve based on a Gaussian analysis.
- a longer exposure time since the fluorescence of the fish is low, results in a larger standard deviation than, for example, with salami.
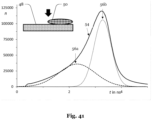
- Fig. 41 illustrates the fluorescence decay behavior of fish that has been contaminated on the surface with HDPE plastic, where the solid, thick curve represents the experimental values and the dashed and dotted, thin curve represents a simulated course based on a Gaussian analysis.
- the fish contaminated with a plastic particle shows two fluorescence maxima in its evaluation.
- the plastic can be clearly detected and identified on the fish.
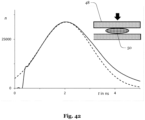
- Fig. 42 illustrates the fluorescence decay behavior of fish that was contaminated with red HDPE plastic on the inside, where the solid, thick curve represents the experimental values and the dashed, thin curve (partially covered by the experimental curve) represents a simulated curve based on a Gaussian analysis.
- a shift in the characteristic fluorescence decay time of the fish can be determined by 0.5 ns, which makes detection of the plastic possible.
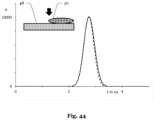
- Fig. 43 illustrates the fluorescence decay behavior of honey, where the solid, thick curve represents the experimental values and the dashed, thin curve (almost completely covered by the experimental curve) represents a simulated curve based on a Gaussian analysis.
- Fig. 45 illustrates the fluorescence decay behavior of honey that has a contamination with red HDPE 3 mm below the surface, where the solid, thick curve represents the experimental values and the dashed, thin curve (almost completely covered by the experimental curve) represents a simulated curve based on a Gaussian analysis.
- the contamination can also be clearly detected here.
- Fig. 46 illustrates the fluorescence decay behavior of honey contaminated with red HDPE 5 mm below the surface, where the solid, thick curve represents the experimental values and the dashed, thin Curve (almost completely covered by the experimental curve) represents a simulated curve based on a Gaussian analysis.
- a shift in the fluorescence decay time can be seen.
- the influence of the fluorescence decay time of honey becomes greater. Nevertheless, detection of the particle under a 5 mm thick layer of honey is possible.
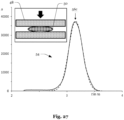
- Fig. 47 illustrates systems 58 for controlling and detecting contamination in food (e.g., plastics in food processing).
- Each system 58 includes light source 60, which may be a laser, laser diode, LED, or similar radiating object that causes autofluorescence.
- Light source 60 emits fluorescence excitation light 62 onto food 64 (here schematically shown as sausage slices) and foreign plastic 66 located on, under, or between the food or foods.
- the food 64 and the foreign plastic 66 are located on a conveyor belt 68 in an in-line process.
- the resulting autofluorescence signal 70 of the food 64 or the plastic 66 radiates back to a detection unit 72, which can be a camera, a photodiode, or something similar that can measure light signals, in particular fluorescence signals, phase shifts or modulation changes that are required to calculate the fluorescence decay time constant.
- the evaluation algorithm shown for the measured data can be carried out by the computer unit (not shown) working in the background, which can also ensure the temporal synchronization between the light source 60 and the detection unit 166.
- the method described above allows the detection of plastic contaminants, in particular polyamide, polyethylene, polyvinyl chloride, polyethylene terephthalate, polystyrene, polypropylene, ABS plastics, in food (in particular meat products such as sausage and salami) using the fluorescence decay time of the autofluorescence and its characteristic decay time constant.
- Preferred meat for meat products is pork, beef, mutton, goat meat and also less common meat such as game - here wild boar, deer, hare or rabbit meat or also rabbit, antelope and kangaroo meat or even poultry meat such as turkey, chicken, goose, duck. or pigeon meat or also fish meat such as trout, bream, perch, salmon, cod, redfish, mackerel, plaice, halibut.
- Laser light can be used for fluorescence excitation, preferably laser light with a wavelength of 488 nm.
- the laser light can be irradiated into the front or back of samples with open or hidden plastic contamination, preferably into the front.
- Modulated laser light can also be used to excite fluorescence and the phase shift of the fluorescence signal can be measured.
- the method described above can also be used for quality control of food (e.g. meat products), in particular for assessing the effect of light by determining the position of the maximum of the fluorescence decay time constant.
- food e.g. meat products
- the result can be displayed, for example, in a vector diagram.
- the complete detection can take place within 50 to 100 ns. This enables very high processing speeds that are hardly limited by the optical detection method. This enables the method to be widely used for various technological applications.
- plastics in processed foods can appear not only through packaging, transport containers and defective machine parts, but also through entry into the environment as microplastics.
- the method shown is suitable for detecting microplastics in food, whereas microplastics are considerably more difficult to detect with other methods due to their small dimensions.
Landscapes
- Health & Medical Sciences (AREA)
- Life Sciences & Earth Sciences (AREA)
- Chemical & Material Sciences (AREA)
- Immunology (AREA)
- Physics & Mathematics (AREA)
- General Physics & Mathematics (AREA)
- Biochemistry (AREA)
- General Health & Medical Sciences (AREA)
- Analytical Chemistry (AREA)
- Pathology (AREA)
- Nuclear Medicine, Radiotherapy & Molecular Imaging (AREA)
- Engineering & Computer Science (AREA)
- Food Science & Technology (AREA)
- Molecular Biology (AREA)
- Chemical Kinetics & Catalysis (AREA)
- Optics & Photonics (AREA)
- Medicinal Chemistry (AREA)
- Investigating, Analyzing Materials By Fluorescence Or Luminescence (AREA)
Claims (13)
- Procédé de vérification d'un échantillon (12) par rapport à une contamination (30), comprenant :la détermination d'une déviation d'une distribution de durée de déclin (26) d'une autofluorescence de l'échantillon (12) excitée par un rayonnement électromagnétique par rapport à une distribution de durée de déclin (R) attendue ;caractérisé en ce quela contamination (30) comprend du plastique, du verre, du métal ou de la céramique ou est constituée de plastique, de verre, de métal ou de céramique.
- Procédé de vérification d'un échantillon (12) selon la revendication 1, comprenant en outre :
l'indication (36) d'une contamination (30) de l'échantillon (12) lorsque la déviation est associée à la contamination (30). - Procédé de vérification d'un échantillon (12) selon la revendication 1 ou 2, comprenant en outre : la décomposition de la distribution de durée de déclin (26) de l'autofluorescence de l'échantillon (12) excitée par le rayonnement électromagnétique en une ou plusieurs parties associées à un matériau de l'échantillon (12) et une ou plusieurs parties résiduelles.
- Procédé de vérification d'un échantillon (12) selon la revendication 3, comprenant en outre : la mise en correspondance de l'une ou des plusieurs parties associées au matériau de l'échantillon (12) avec une distribution de durée de déclin caractéristique d'un produit alimentaire.
- Procédé de vérification d'un échantillon (12) selon l'une quelconque des revendications 1 à 4, dans lequel le rayonnement électromagnétique présente une longueur d'onde dans la plage de 425 nm à 550 nm, de préférence 488 nm.
- Procédé de vérification d'un échantillon (12) selon l'une quelconque des revendications 3 à 5, comprenant en outre :
la mise en correspondance de l'une ou des plusieurs parties résiduelles avec une distribution de durée de déclin de la contamination (30). - Procédé de vérification d'un échantillon (12) selon la revendication 1, dans lequel le plastique comprend du polyamide, du polyéthylène, du chlorure de polyvinyle, du polyéthylène téréphtalate, du polystyrène, du polypropylène ou de l'acrylonitrile-butadiène-styrène.
- Procédé de vérification d'un échantillon (12) selon l'une quelconque des revendications 1 à 7, comprenant en outre :
la comparaison de distributions de durée de déclin (26) de l'autofluorescence excitée par le rayonnement électromagnétique de deux ou plusieurs volumes d'échantillons ou échantillons (12) différents, dans lequel la contamination (30) est indiquée lorsqu'une déviation des deux ou plusieurs distributions de durée de déclin (26) se situe en dehors d'une plage de tolérance. - Procédé de vérification d'un échantillon (12) selon la revendication 1, comprenant en outre :la détermination (40) d'un décalage de la distribution de durée de déclin (26) par rapport à une référence (R) ; etl'indication (42) d'une détérioration de la qualité lorsque la distribution de durée de déclin (26) se situe en dehors d'une plage de tolérance (T) autour de la référence (R).
- Appareil (10) de vérification d'un échantillon (12) par rapport à une contamination (30), comprenant :un émetteur (14) configuré pour émettre un rayonnement électromagnétique modulé en fréquence ou en amplitude ; etun détecteur (16) configuré pour recevoir une autofluorescence de l'échantillon (12) excitée par le rayonnement électromagnétique ;dans lequel l'appareil (10) est configuré pour déterminer un résultat de la vérification sur la base d'une distribution de durée de déclin (26) de l'autofluorescence de l'échantillon (12) ;dans lequel l'appareil (10) est en outre configuré pour indiquer une contamination (30) de l'échantillon (12) lorsque la distribution de temps de déclin (26) de l'autofluorescence de l'échantillon (12) dévie d'une distribution de durée de déclin (R) attendue ;caractérisé en ce quela contamination (30) comprend du plastique, du verre, du métal ou de la céramique ou est constituée de plastique, de verre, de métal ou de céramique.
- Appareil (10) de vérification d'un échantillon (12) selon la revendication 10, dans lequel l'appareil (10) est en outre configuré pour détecter un contour d'échantillon (32) et pour localiser la contamination (30) par rapport au contour d'échantillon (32).
- Appareil (10) de vérification d'un échantillon (12) selon la revendication 10 ou 11, dans lequel l'appareil (10) est en outre configuré pour contester une qualité de l'échantillon (12) lorsqu'une durée de déclin de l'autofluorescence présente des valeurs inférieures à celles attendues.
- Appareil (10) de vérification d'un échantillon (12) selon l'une quelconque des revendications 10 à 12, comprenant en outre :
un couteau, dans lequel l'appareil (10) est configuré pour découper un aliment.
Applications Claiming Priority (2)
| Application Number | Priority Date | Filing Date | Title |
|---|---|---|---|
| DE102020001014.8A DE102020001014A1 (de) | 2020-02-14 | 2020-02-14 | Detektion von Kunststoffen als Fremdsubstanzen in Lebensmitteln unter Verwendung der Fluoreszenzabklingzeit, insbesondere die Detektion von Fremdstoffen in Fleischprodukten |
| PCT/EP2020/083813 WO2021160309A1 (fr) | 2020-02-14 | 2020-11-27 | Contrôle d'un échantillon, en particulier vis-à-vis de la contamination/qualité |
Publications (3)
| Publication Number | Publication Date |
|---|---|
| EP4103931A1 EP4103931A1 (fr) | 2022-12-21 |
| EP4103931C0 EP4103931C0 (fr) | 2024-10-02 |
| EP4103931B1 true EP4103931B1 (fr) | 2024-10-02 |
Family
ID=73790053
Family Applications (1)
| Application Number | Title | Priority Date | Filing Date |
|---|---|---|---|
| EP20821133.4A Active EP4103931B1 (fr) | 2020-02-14 | 2020-11-27 | Contrôle d'un échantillon vis-à-vis de la contamination |
Country Status (3)
| Country | Link |
|---|---|
| EP (1) | EP4103931B1 (fr) |
| DE (1) | DE102020001014A1 (fr) |
| WO (1) | WO2021160309A1 (fr) |
Families Citing this family (2)
| Publication number | Priority date | Publication date | Assignee | Title |
|---|---|---|---|---|
| CN115791739B (zh) * | 2023-01-06 | 2023-04-18 | 广汉市迈德乐食品有限公司 | 一种生牛脂拆封后残留包装塑料识别装置及其方法 |
| DE102023108014A1 (de) | 2023-03-29 | 2024-10-02 | Technische Hochschule Rosenheim, Körperschaft des öffentlichen Rechts | Inspektionsvorrichtung und Verfahren zur optischen Erfassung von Eigenschaften eines auf einer Fördereinrichtung in eine Transportrichtung transportierten Objektes mittels Fluoreszenzanregung |
Family Cites Families (2)
| Publication number | Priority date | Publication date | Assignee | Title |
|---|---|---|---|---|
| DE10315541A1 (de) * | 2003-04-04 | 2004-10-28 | Fraunhofer-Gesellschaft zur Förderung der angewandten Forschung e.V. | Verfahren und Vorrichtung zur Bestimmung des Frischegrades von Lebensmitteln |
| EP2251675A1 (fr) * | 2009-05-15 | 2010-11-17 | Fraunhofer-Gesellschaft zur Förderung der angewandten Forschung e.V. | Procédé de reconnaissance de tissus de cellule atteints d'une tumeur |
-
2020
- 2020-02-14 DE DE102020001014.8A patent/DE102020001014A1/de active Pending
- 2020-11-27 WO PCT/EP2020/083813 patent/WO2021160309A1/fr not_active Ceased
- 2020-11-27 EP EP20821133.4A patent/EP4103931B1/fr active Active
Also Published As
| Publication number | Publication date |
|---|---|
| EP4103931C0 (fr) | 2024-10-02 |
| DE102020001014A1 (de) | 2021-08-19 |
| WO2021160309A1 (fr) | 2021-08-19 |
| EP4103931A1 (fr) | 2022-12-21 |
Similar Documents
| Publication | Publication Date | Title |
|---|---|---|
| Mohd Khairi et al. | Noninvasive techniques for detection of foreign bodies in food: A review | |
| DE102013008003B4 (de) | Messgerät zum Messen eines Oberflächenbelags auf einem Messobjekt, insbesondere auf einem Lebensmittel, und dessen Verwendung | |
| US9410888B2 (en) | Methods, systems and devices for detecting insects and other pests | |
| DE102012023947B4 (de) | Verfahren und Anordnung zur nichtinvasiven, zerstörungsfreien Identifikation von Vogelembryogeschlechtern durch die Vogeleischale hindurch | |
| EP4103931B1 (fr) | Contrôle d'un échantillon vis-à-vis de la contamination | |
| DE102007062112A1 (de) | Verfahren und Vorrichtung zum Beurteilen der Reinheit von Pflanzenölen mit Hilfe der Terahertz-Zeitdomäne-Spektroskopie | |
| DE4300169A1 (de) | Verfahren und Vorrichtung zum Prüfen von Flaschen | |
| DE102005056695A1 (de) | Lateralflussuntersuchungssysteme und -verfahren | |
| DE112008001838T5 (de) | Prüfvorrichtung und Prüfverfahren, welches durchdringende Strahlung verwendet | |
| DE69506268T2 (de) | Diamantenuntersuchung | |
| Downey et al. | Species identification in selected raw homogenized meats by reflectance spectroscopy in the mid-infrared, near-infrared, and visible ranges | |
| DE102016214496A1 (de) | Vorrichtung zur Identifikation von Stoffen | |
| DE102023111681A1 (de) | Verfahren und Vorrichtung zur Detektion von Anomalien in zweidimensionalen digitalen Bildern von Produkten | |
| WO2013189488A1 (fr) | Procédé, dispositif et appareil de mesure portatif pour la détection de produits de dégradation de molécules biologiques dans des couches d'un système de couches | |
| Turgut et al. | Potential of image analysis based systems in food quality assessments and classifications | |
| EP3268725A2 (fr) | Procédé et dispositif permettant l'identification de matières plastiques et/ou de leurs additifs | |
| DE10315541A1 (de) | Verfahren und Vorrichtung zur Bestimmung des Frischegrades von Lebensmitteln | |
| DE69411385T2 (de) | Nachweis bestrahlter proben | |
| US4458531A (en) | Method of and apparatus for examining biological effects in cell-lots | |
| DE102012019471B4 (de) | Vorrichtung und Verfahren zum Ermitteln von Stoffeigenschaften | |
| AT523187A1 (de) | Bestimmung einer Beeinträchtigung einer optischen Oberfläche für IR-Spektroskopie | |
| Li | Development of a structured illumination reflectance imaging system for enhanced detection of subsurface and surface defects in apple fruit | |
| DE102022115138A1 (de) | Vorrichtung und Verfahren zur Detektion von Verschmutzungen auf einem Förderband | |
| Versen et al. | The detection of organic polymers as contaminants in foodstuffs by means of the fluorescence decay of their auto fluorescence | |
| DE102015122399A1 (de) | Verfahren zur Erkennung von Fehlerstellen in schnittfähigen Lebensmitteln und Vorrichtung hierzu |
Legal Events
| Date | Code | Title | Description |
|---|---|---|---|
| STAA | Information on the status of an ep patent application or granted ep patent |
Free format text: STATUS: UNKNOWN |
|
| STAA | Information on the status of an ep patent application or granted ep patent |
Free format text: STATUS: THE INTERNATIONAL PUBLICATION HAS BEEN MADE |
|
| PUAI | Public reference made under article 153(3) epc to a published international application that has entered the european phase |
Free format text: ORIGINAL CODE: 0009012 |
|
| STAA | Information on the status of an ep patent application or granted ep patent |
Free format text: STATUS: REQUEST FOR EXAMINATION WAS MADE |
|
| 17P | Request for examination filed |
Effective date: 20220914 |
|
| AK | Designated contracting states |
Kind code of ref document: A1 Designated state(s): AL AT BE BG CH CY CZ DE DK EE ES FI FR GB GR HR HU IE IS IT LI LT LU LV MC MK MT NL NO PL PT RO RS SE SI SK SM TR |
|
| DAV | Request for validation of the european patent (deleted) | ||
| DAX | Request for extension of the european patent (deleted) | ||
| STAA | Information on the status of an ep patent application or granted ep patent |
Free format text: STATUS: EXAMINATION IS IN PROGRESS |
|
| 17Q | First examination report despatched |
Effective date: 20230724 |
|
| GRAP | Despatch of communication of intention to grant a patent |
Free format text: ORIGINAL CODE: EPIDOSNIGR1 |
|
| STAA | Information on the status of an ep patent application or granted ep patent |
Free format text: STATUS: GRANT OF PATENT IS INTENDED |
|
| INTG | Intention to grant announced |
Effective date: 20240506 |
|
| GRAS | Grant fee paid |
Free format text: ORIGINAL CODE: EPIDOSNIGR3 |
|
| GRAA | (expected) grant |
Free format text: ORIGINAL CODE: 0009210 |
|
| STAA | Information on the status of an ep patent application or granted ep patent |
Free format text: STATUS: THE PATENT HAS BEEN GRANTED |
|
| REG | Reference to a national code |
Ref country code: DE Ref legal event code: R081 Ref document number: 502020009397 Country of ref document: DE Owner name: TECHNISCHE HOCHSCHULE ROSENHEIM, DE Free format text: FORMER OWNER: ANMELDERANGABEN UNKLAR / UNVOLLSTAENDIG, 80297 MUENCHEN, DE |
|
| AK | Designated contracting states |
Kind code of ref document: B1 Designated state(s): AL AT BE BG CH CY CZ DE DK EE ES FI FR GB GR HR HU IE IS IT LI LT LU LV MC MK MT NL NO PL PT RO RS SE SI SK SM TR |
|
| REG | Reference to a national code |
Ref country code: GB Ref legal event code: FG4D Free format text: NOT ENGLISH |
|
| REG | Reference to a national code |
Ref country code: CH Ref legal event code: EP |
|
| REG | Reference to a national code |
Ref country code: IE Ref legal event code: FG4D Free format text: LANGUAGE OF EP DOCUMENT: GERMAN |
|
| REG | Reference to a national code |
Ref country code: DE Ref legal event code: R096 Ref document number: 502020009397 Country of ref document: DE |
|
| U01 | Request for unitary effect filed |
Effective date: 20241101 |
|
| U07 | Unitary effect registered |
Designated state(s): AT BE BG DE DK EE FI FR IT LT LU LV MT NL PT RO SE SI Effective date: 20241112 |
|
| U20 | Renewal fee for the european patent with unitary effect paid |
Year of fee payment: 5 Effective date: 20241114 |
|
| PG25 | Lapsed in a contracting state [announced via postgrant information from national office to epo] |
Ref country code: IS Free format text: LAPSE BECAUSE OF FAILURE TO SUBMIT A TRANSLATION OF THE DESCRIPTION OR TO PAY THE FEE WITHIN THE PRESCRIBED TIME-LIMIT Effective date: 20250202 Ref country code: HR Free format text: LAPSE BECAUSE OF FAILURE TO SUBMIT A TRANSLATION OF THE DESCRIPTION OR TO PAY THE FEE WITHIN THE PRESCRIBED TIME-LIMIT Effective date: 20241002 |
|
| PG25 | Lapsed in a contracting state [announced via postgrant information from national office to epo] |
Ref country code: ES Free format text: LAPSE BECAUSE OF FAILURE TO SUBMIT A TRANSLATION OF THE DESCRIPTION OR TO PAY THE FEE WITHIN THE PRESCRIBED TIME-LIMIT Effective date: 20241002 |
|
| PG25 | Lapsed in a contracting state [announced via postgrant information from national office to epo] |
Ref country code: NO Free format text: LAPSE BECAUSE OF FAILURE TO SUBMIT A TRANSLATION OF THE DESCRIPTION OR TO PAY THE FEE WITHIN THE PRESCRIBED TIME-LIMIT Effective date: 20250102 |
|
| PG25 | Lapsed in a contracting state [announced via postgrant information from national office to epo] |
Ref country code: GR Free format text: LAPSE BECAUSE OF FAILURE TO SUBMIT A TRANSLATION OF THE DESCRIPTION OR TO PAY THE FEE WITHIN THE PRESCRIBED TIME-LIMIT Effective date: 20250103 |
|
| PG25 | Lapsed in a contracting state [announced via postgrant information from national office to epo] |
Ref country code: PL Free format text: LAPSE BECAUSE OF FAILURE TO SUBMIT A TRANSLATION OF THE DESCRIPTION OR TO PAY THE FEE WITHIN THE PRESCRIBED TIME-LIMIT Effective date: 20241002 Ref country code: CZ Free format text: LAPSE BECAUSE OF FAILURE TO SUBMIT A TRANSLATION OF THE DESCRIPTION OR TO PAY THE FEE WITHIN THE PRESCRIBED TIME-LIMIT Effective date: 20241002 |
|
| PG25 | Lapsed in a contracting state [announced via postgrant information from national office to epo] |
Ref country code: RS Free format text: LAPSE BECAUSE OF FAILURE TO SUBMIT A TRANSLATION OF THE DESCRIPTION OR TO PAY THE FEE WITHIN THE PRESCRIBED TIME-LIMIT Effective date: 20250102 |
|
| REG | Reference to a national code |
Ref country code: CH Ref legal event code: PL |
|
| PG25 | Lapsed in a contracting state [announced via postgrant information from national office to epo] |
Ref country code: SM Free format text: LAPSE BECAUSE OF FAILURE TO SUBMIT A TRANSLATION OF THE DESCRIPTION OR TO PAY THE FEE WITHIN THE PRESCRIBED TIME-LIMIT Effective date: 20241002 |
|
| PG25 | Lapsed in a contracting state [announced via postgrant information from national office to epo] |
Ref country code: MC Free format text: LAPSE BECAUSE OF FAILURE TO SUBMIT A TRANSLATION OF THE DESCRIPTION OR TO PAY THE FEE WITHIN THE PRESCRIBED TIME-LIMIT Effective date: 20241002 |
|
| REG | Reference to a national code |
Ref country code: CH Ref legal event code: PL |
|
| PG25 | Lapsed in a contracting state [announced via postgrant information from national office to epo] |
Ref country code: CH Free format text: LAPSE BECAUSE OF NON-PAYMENT OF DUE FEES Effective date: 20241130 |
|
| PG25 | Lapsed in a contracting state [announced via postgrant information from national office to epo] |
Ref country code: SK Free format text: LAPSE BECAUSE OF FAILURE TO SUBMIT A TRANSLATION OF THE DESCRIPTION OR TO PAY THE FEE WITHIN THE PRESCRIBED TIME-LIMIT Effective date: 20241002 |
|
| PLBE | No opposition filed within time limit |
Free format text: ORIGINAL CODE: 0009261 |
|
| STAA | Information on the status of an ep patent application or granted ep patent |
Free format text: STATUS: NO OPPOSITION FILED WITHIN TIME LIMIT |
|
| 26N | No opposition filed |
Effective date: 20250703 |
|
| GBPC | Gb: european patent ceased through non-payment of renewal fee |
Effective date: 20250102 |
|
| PG25 | Lapsed in a contracting state [announced via postgrant information from national office to epo] |
Ref country code: GB Free format text: LAPSE BECAUSE OF NON-PAYMENT OF DUE FEES Effective date: 20250102 |
|
| PG25 | Lapsed in a contracting state [announced via postgrant information from national office to epo] |
Ref country code: IE Free format text: LAPSE BECAUSE OF NON-PAYMENT OF DUE FEES Effective date: 20241127 |
|
| U20 | Renewal fee for the european patent with unitary effect paid |
Year of fee payment: 6 Effective date: 20251008 |
|
| PG25 | Lapsed in a contracting state [announced via postgrant information from national office to epo] |
Ref country code: HU Free format text: LAPSE BECAUSE OF FAILURE TO SUBMIT A TRANSLATION OF THE DESCRIPTION OR TO PAY THE FEE WITHIN THE PRESCRIBED TIME-LIMIT; INVALID AB INITIO Effective date: 20201127 |
|
| PG25 | Lapsed in a contracting state [announced via postgrant information from national office to epo] |
Ref country code: CY Free format text: LAPSE BECAUSE OF FAILURE TO SUBMIT A TRANSLATION OF THE DESCRIPTION OR TO PAY THE FEE WITHIN THE PRESCRIBED TIME-LIMIT; INVALID AB INITIO Effective date: 20201127 |