EP4105649B1 - Procédé d'analyse quantitative, programme d'analyse quantitative et dispositif d'analyse par spectrométrie de fluorescence des rayons x - Google Patents
Procédé d'analyse quantitative, programme d'analyse quantitative et dispositif d'analyse par spectrométrie de fluorescence des rayons x Download PDFInfo
- Publication number
- EP4105649B1 EP4105649B1 EP20918376.3A EP20918376A EP4105649B1 EP 4105649 B1 EP4105649 B1 EP 4105649B1 EP 20918376 A EP20918376 A EP 20918376A EP 4105649 B1 EP4105649 B1 EP 4105649B1
- Authority
- EP
- European Patent Office
- Prior art keywords
- rays
- intensity
- sample
- fluorescent
- thickness
- Prior art date
- Legal status (The legal status is an assumption and is not a legal conclusion. Google has not performed a legal analysis and makes no representation as to the accuracy of the status listed.)
- Active
Links
Images


Classifications
-
- G—PHYSICS
- G01—MEASURING; TESTING
- G01N—INVESTIGATING OR ANALYSING MATERIALS BY DETERMINING THEIR CHEMICAL OR PHYSICAL PROPERTIES
- G01N23/00—Investigating or analysing materials by the use of wave or particle radiation, e.g. X-rays or neutrons, not covered by groups G01N3/00 – G01N17/00, G01N21/00 or G01N22/00
- G01N23/22—Investigating or analysing materials by the use of wave or particle radiation, e.g. X-rays or neutrons, not covered by groups G01N3/00 – G01N17/00, G01N21/00 or G01N22/00 by measuring secondary emission from the material
- G01N23/223—Investigating or analysing materials by the use of wave or particle radiation, e.g. X-rays or neutrons, not covered by groups G01N3/00 – G01N17/00, G01N21/00 or G01N22/00 by measuring secondary emission from the material by irradiating the sample with X-rays or gamma-rays and by measuring X-ray fluorescence
-
- G—PHYSICS
- G01—MEASURING; TESTING
- G01N—INVESTIGATING OR ANALYSING MATERIALS BY DETERMINING THEIR CHEMICAL OR PHYSICAL PROPERTIES
- G01N23/00—Investigating or analysing materials by the use of wave or particle radiation, e.g. X-rays or neutrons, not covered by groups G01N3/00 – G01N17/00, G01N21/00 or G01N22/00
- G01N23/22—Investigating or analysing materials by the use of wave or particle radiation, e.g. X-rays or neutrons, not covered by groups G01N3/00 – G01N17/00, G01N21/00 or G01N22/00 by measuring secondary emission from the material
- G01N23/2206—Combination of two or more measurements, at least one measurement being that of secondary emission, e.g. combination of secondary electron [SE] measurement and back-scattered electron [BSE] measurement
- G01N23/2208—Combination of two or more measurements, at least one measurement being that of secondary emission, e.g. combination of secondary electron [SE] measurement and back-scattered electron [BSE] measurement all measurements being of a secondary emission, e.g. combination of SE measurement and characteristic X-ray measurement
-
- G—PHYSICS
- G01—MEASURING; TESTING
- G01N—INVESTIGATING OR ANALYSING MATERIALS BY DETERMINING THEIR CHEMICAL OR PHYSICAL PROPERTIES
- G01N2223/00—Investigating materials by wave or particle radiation
- G01N2223/07—Investigating materials by wave or particle radiation secondary emission
- G01N2223/076—X-ray fluorescence
-
- G—PHYSICS
- G01—MEASURING; TESTING
- G01N—INVESTIGATING OR ANALYSING MATERIALS BY DETERMINING THEIR CHEMICAL OR PHYSICAL PROPERTIES
- G01N2223/00—Investigating materials by wave or particle radiation
- G01N2223/10—Different kinds of radiation or particles
- G01N2223/101—Different kinds of radiation or particles electromagnetic radiation
- G01N2223/1016—X-ray
-
- G—PHYSICS
- G01—MEASURING; TESTING
- G01N—INVESTIGATING OR ANALYSING MATERIALS BY DETERMINING THEIR CHEMICAL OR PHYSICAL PROPERTIES
- G01N2223/00—Investigating materials by wave or particle radiation
- G01N2223/30—Accessories, mechanical or electrical features
- G01N2223/303—Accessories, mechanical or electrical features calibrating, standardising
- G01N2223/3037—Accessories, mechanical or electrical features calibrating, standardising standards (constitution)
-
- G—PHYSICS
- G01—MEASURING; TESTING
- G01N—INVESTIGATING OR ANALYSING MATERIALS BY DETERMINING THEIR CHEMICAL OR PHYSICAL PROPERTIES
- G01N2223/00—Investigating materials by wave or particle radiation
- G01N2223/30—Accessories, mechanical or electrical features
- G01N2223/304—Accessories, mechanical or electrical features electric circuits, signal processing
-
- G—PHYSICS
- G01—MEASURING; TESTING
- G01N—INVESTIGATING OR ANALYSING MATERIALS BY DETERMINING THEIR CHEMICAL OR PHYSICAL PROPERTIES
- G01N2223/00—Investigating materials by wave or particle radiation
- G01N2223/30—Accessories, mechanical or electrical features
- G01N2223/305—Accessories, mechanical or electrical features computer simulations
Definitions
- the present invention relates to a quantitative analysis method, a quantitative analysis program, and an X-ray fluorescence spectrometer.
- the secondary X-rays include: fluorescent X-rays generated from each component in the sample irradiated with the primary X-rays; and scattered rays of the primary X-rays.
- a wavelength of the fluorescent X-rays has a value intrinsic to each element, and hence a quantitative analysis of a component contained in the sample is performed based on a fluorescent X-ray intensity of a specific wavelength.
- a method of performing the correction there is a method including a matrix correction term in a calibration curve equation and using a matrix correction coefficient in the matrix correction term.
- a fundamental parameter method (the FP method) is used for a representative composition to be analyzed (hereinafter referred to as “representative composition”) as well as a plurality of compositions (hereinafter referred to as “comparative compositions”), in each of which a content of each of analysis components contained in the representative composition is changed by a predetermined content, to thereby calculate theoretical intensities of fluorescent X-rays of the analysis components.
- the matrix correction coefficient is calculated by comparing the theoretical intensities to each other (see NPL 1).
- an analysis depth is usually up to about 20 ⁇ m. In this case, only a region near the front surface of the sample is an analysis region.
- the sample to be analyzed is, for example, oil formed of carbon, oxygen, hydrogen, and other components having small atomic numbers, primary X-rays penetrate deeply into the sample. For example, when a content of Sn in oil is analyzed by measuring a high-energy Sn K ⁇ line, fluorescent X-rays generated from a depth of 3 cm or more from the front surface of the sample are also emitted to the outside of the sample.
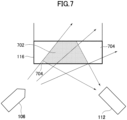
- FIG. 7 is a diagram for illustrating the geometry effect.
- fluorescent X-rays to be measured have high energy and the main components of the sample are light elements, primary X-rays penetrate into a deep position of the sample.
- the geometry effect is highly dependent on an optical system of an apparatus.
- a region in which the fluorescent X-rays emitted from the front surface of the sample are detected by a detector and a region in which the fluorescent X-rays are not detected are present depending on the position at which fluorescent X-rays are generated.
- the influence of the geometry effect depends on optical system conditions of the apparatus. For example, a region of the front surface of the sample irradiated with primary X-rays, an angle (incident angle) between the primary X-rays and the front surface of the sample, a region of the front surface of the sample in which the fluorescent X-rays are detected, and a detection angle, are determined by the optical system conditions.
- a sample is irradiated with primary X-rays and an intensity of emitted fluorescent X-rays is measured. Then, the intensity of the fluorescent X-rays obtained through the measurement and a calibration curve equation expressed by Math. 1 are used to obtain a quantitative value of a component to be analyzed.
- W i is a value representing a mass fraction (mass%) of an analysis component "i", and "a”, "b", and “c” are constants.
- a detection intensity I i is a value representing a measurement intensity of the analysis component "i”
- ⁇ j is a value representing a matrix correction coefficient for a coexisting component "j" of the analysis component "i”.
- W j is a value representing a mass fraction (mass%) of the coexisting component "j”.
- the matrix correction coefficient ⁇ j is calculated by performing a theoretical intensity calculation for a representative composition and a plurality of comparative compositions through use of an FP method.
- W i bI i + c 1 + ⁇ ⁇ j W j
- Math. 1 and Math. 3 are both calibration curve equations of straight line, and handle intercept in different manners.
- Math. 2 is a calibration curve equation of a curved line, and is used when a range of concentration of the analysis component is wide. When the constant "a" of Math. 2 is 0, Math. 2 is identical to Math. 1. In addition, when a net intensity with a background removed is used as the measurement intensity, the intercept "c" of Math. 1 and Math. 3 may be set to 0.
- I Ti represents a theoretical intensity of the analysis component "i".
- K i represents a constant.
- W i represents the mass fraction of the analysis component "i”
- ⁇ represents a density of the sample
- ⁇ j represents an overall absorption coefficient for a component "j" in the sample with respect to analysis lines.
- W j represents the mass fraction of the component "j” in the sample
- "x" represents a position in a depth direction from a front surface of the sample.
- Math. 4 is a fluorescent X-ray intensity theoretical equation in which the primary X-rays entering the sample have a single wavelength and only primary excitation is taken into consideration.
- the theoretical intensity of the analysis component "i" is obtained by integrating from the front surface of the sample to a position at an infinite depth.
- the theoretical intensity equation of Math. 4 also assumes that a part of the fluorescent X-rays generated inside the sample is absorbed inside the sample and all the fluorescent X-rays that have reached the front surface of the sample are detected.
- Math. 5 is derived.
- W i K i ′ I Ti ⁇ ⁇ j W j
- Math. 6 relating to a mass fraction W b of a component "b", being a base material component of the sample, is used to derive Math. 7 from Math. 5.
- the calibration curve method a calculation to be performed to obtain an analysis result is simple, and it is easy to verify the calculation. Accordingly, when a sample, for example, oil, is to be analyzed, the calibration curve method using Math. 1 is generally used for a routine analysis. The calibration curve method is also employed in most standards (for example, JIS standard) used in X-ray fluorescence analyses. In addition, in the routine analysis, for example, oil quality control, a fixed amount of samples are set in liquid sample containers having the same shape to be measured.
- the present invention has been made in view of the above-mentioned problems, and provides a quantitative analysis method, a quantitative analysis program, and an X-ray fluorescence spectrometer, in which a matrix correction coefficient is calculated by calculating a theoretical intensity in which a geometry effect is reflected through use of an FP method, and then a quantitative analysis is performed through use of the matrix correction coefficient, to thereby be able to perform an accurate quantitative analysis in consideration of the influence of the geometry effect.
- the quantitative analysis method further includes: a standard sample measuring step of irradiating a plurality of standard samples containing the analysis components and having known contents with primary X-rays, and measuring the intensity of the fluorescent X-rays emitted from each of the analysis components; a calibration curve creation step of creating a calibration curve expressed by the calibration curve equation for each of the analysis components, based on the intensity of the fluorescent X-rays measured in the standard sample measuring step and the matrix correction coefficient; an unknown sample measuring step of irradiating the unknown sample with primary X-rays, and measuring the intensity of the fluorescent X-rays for each of the analysis components; and a content calculation step of calculating the content of each of the analysis components contained in the unknown sample, based on the intensity of the fluorescent X-rays measured in the unknown sample measuring step and the calibration curve, wherein all the thicknesses of the plurality of standard samples are the same as the thickness set in advance as the thickness of the virtual sample and the thickness of the unknown sample.
- the detection intensity calculation step includes: a division step of dividing a thickness of the virtual sample from the surface of the virtual sample to a predetermined position with fixed intervals; and a total sum calculation step of calculating a total sum of the detection intensity calculated for each of the divisions.
- the detection intensity calculation step includes: an emission intensity calculation step of calculating, assuming that the virtual sample indicated by each of the representative composition and the comparative compositions has been irradiated with primary X-rays, an emission intensity indicating the intensity of the fluorescent X-rays emitted from each of the analysis components, as a function of a position from the front surface of the virtual sample with the geometry effect being ignored; a detection ratio acquisition step of acquiring, assuming that a virtual sample indicated by a given composition has been irradiated with primary X-rays, a detection ratio as the function of the position from the front surface, the detection ratio representing a ratio between an emission intensity indicating the intensity of the fluorescent X-rays emitted from the virtual sample and the detection intensity of the fluorescent X-rays detected under the influence of the geometry effect for the lines of emitted fluorescent X-rays; and a multiplication step of multiplying the emission intensity by the detection ratio to calculate the detection intensity
- the predetermined position is set to: a position at which the detection intensity becomes 0 when a thickness of the unknown sample is larger than a thickness from the front surface to the position at which the detection intensity becomes 0; and a position of a back surface of the unknown sample when the thickness of the unknown sample is smaller than the thickness from the front surface to the position at which the detection intensity becomes 0.
- the detection intensity calculation step is a step of calculating the detection intensity through use of a Monte Carlo simulation, and the detection intensity calculation step includes the steps of: setting, as parameters, a thickness of the virtual sample, the intensity of the primary X-rays to be applied to each position on the front surface of the virtual sample, and an incident angle with respect to the front surface of the primary X-rays; determining, based on randomly determined values, a generation position of the primary X-rays on an X-ray tube target, a direction in which the primary X-rays are emitted, and energy of the primary X-rays; and calculating the intensity of the fluorescent X-rays for a predetermined position using the detection intensity for each trajectory from the generation position of the primary X-rays to the front surface.
- a quantitative analysis program to be executed by a computer used for an X-ray fluorescence spectrometer, the quantitative analysis program causing the computer to execute: a representative composition acquisition step of acquiring a representative composition, which is a composition expressed by contents of analysis components contained in an unknown sample to be analyzed, and which is set to represent the contents of the analysis components; a comparative composition acquisition step of acquiring a plurality of comparative compositions, in each of which the content of one of the analysis components contained in the representative composition is changed by a predetermined content; a detection intensity calculation step of calculating, assuming that a virtual sample having a thickness set in advance and being indicated by each of the representative composition and the comparative compositions has been irradiated with primary X-rays, a detection intensity indicating an intensity of fluorescent X-rays detected under the influence of a geometry effect through use of a fundamental parameter method; and a matrix correction coefficient calculation step of calculating a matrix correction coefficient ⁇ j for each of the analysis components through use of
- the quantitative analysis program further causes the computer to execute: a standard sample measuring step of irradiating a plurality of standard samples containing the analysis components and having known contents with primary X-rays, and measuring the intensity of the fluorescent X-rays emitted from each of the analysis components; a calibration curve creation step of creating a calibration curve expressed by the calibration curve equation for each of the analysis components, based on the intensity of the fluorescent X-rays measured in the standard sample measuring step and the matrix correction coefficient; an unknown sample measuring step of irradiating the unknown sample with primary X-rays, and measuring the intensity of the fluorescent X-rays for each of the analysis components; and a content calculation step of calculating the content of each of the analysis components contained in the unknown sample, based on the intensity of the fluorescent X-rays measured in the unknown sample measuring step and the calibration curve, wherein all the thicknesses of the plurality of standard samples are the same as the thickness set in advance as the thickness of the virtual sample and the thickness of the unknown sample.
- the X-ray fluorescence spectrometer is further configured to carry out: a standard sample measuring step of irradiating a plurality of standard samples containing the analysis components and having known contents with primary X-rays, and measuring the intensity of the fluorescent X-rays emitted from each of the analysis components; a calibration curve creation step of creating a calibration curve expressed by the calibration curve equation for each of the analysis components, based on the intensity of the fluorescent X-rays measured in the standard sample measuring step and the matrix correction coefficient; an unknown sample measuring step of irradiating the unknown sample with primary X-rays, and measuring the intensity of the fluorescent X-rays for each of the analysis components; and a content calculation step of calculating the content of each of the analysis components contained in the unknown sample, based on the intensity of the fluorescent X-rays measured in the unknown sample measuring step and the calibration curve, wherein all the thicknesses of the plurality of standard samples are the same as the thickness set in advance as the thickness of the virtual sample and the thickness of the unknown sample
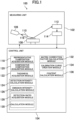
- FIG. 1 is a diagram for illustrating an outline of an X-ray fluorescence spectrometer 100.
- the X-ray fluorescence spectrometer 100 includes a measuring unit 102 and a control unit 104.
- the measuring unit 102 includes an X-ray source 106, a sample stage 108, an X-ray filter 110, a detector 112, and a counter 114.
- the measuring unit 102 irradiates a sample 116 with primary X-rays to measure an intensity of the fluorescent X-rays emitted from the sample 116.
- the X-ray source 106 irradiates a front surface of the sample 116 with primary X-rays through the X-ray filter 110. Fluorescent X-rays are emitted from the sample 116 irradiated with the primary X-rays.
- the sample 116 is arranged on the sample stage 108.
- the sample stage 108 may be configured so that a height at which the sample 116 is arranged can be changed.
- the X-ray filter 110 absorbs a specific wavelength component contained in the primary X-rays.
- the X-ray filter 110 may be arranged at both locations between the X-ray source 106 and the sample 116, and between the sample 116 and the detector 112. There is also a case in which the X-ray filter 110 is not used depending on an analysis line.
- the detector 112 is, for example, a silicon drift semiconductor detector (SDD) having excellent energy resolution.
- the SDD simultaneously measures full energy fluorescent X-rays.
- the detector 112 measures the intensity of the fluorescent X-rays, and outputs a pulse signal having a pulse height corresponding to the energy of the measured fluorescent X-rays.
- the counter 114 Based on the pulse heights, the counter 114 counts the pulse signal output as the intensities measured by the detector 112.
- the counter 114 is a multichannel analyzer, and counts the pulse signal output by the detector 112 for each of channels corresponding to the energy of the fluorescent X-rays, and outputs the count as the intensity of the fluorescent X-rays.
- the control unit 104 controls operations of each part of the measuring unit 102.
- the control unit 104 also receives a user's input to perform a quantitative analysis.
- the control unit 104 is a computer included in the X-ray fluorescence spectrometer 100, and includes a storage unit (not shown) storing a program therein.
- the control unit 104 may be a computer provided outside the X-ray fluorescence spectrometer 100 and connected to the X-ray fluorescence spectrometer 100.
- the program is a program to be executed by a computer for use in the X-ray fluorescence spectrometer 100, and is a program for causing the computer to execute each of steps included in a quantitative analysis method that will be described later.
- the control unit 104 includes a representative composition acquisition module 118, a comparative composition acquisition module 120, a thickness acquisition module 122, a detection intensity calculation module 124, a matrix correction coefficient calculation module 132, a calibration curve creation module 134, and a content calculation module 136.
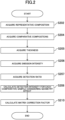
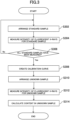
- a function of each module included in the control unit 104 will be described with reference to flow charts of FIG. 2 and FIG. 3 .
- FIG. 2 is a diagram illustrating a method of calculating a matrix correction coefficient
- FIG. 3 is a diagram illustrating a method of calculating a content through use of the matrix correction coefficient.
- the representative composition acquisition module 118 acquires a representative composition, which is a composition expressed by contents of analysis components contained in an unknown sample to be analyzed, and is set to represent the contents of the analysis components (Step S202). Specifically, for example, the user inputs the numerical values of contents shown in Table 1 as a representative composition to an input unit (not shown). The representative composition acquisition module 118 acquires the input data as the representative composition.
- the unit of numerical values in Table 1 is mass%.
- An example of the representative composition expressed by the composition of Table 1 is oil, and a base material thereof is CH 2 . [Table 1] Sn Pb Ca S CH 2 0.10 0.01 0.01 0.01 99.87
- the comparative composition acquisition module 120 acquires a plurality of comparative compositions, in each of which the content of one of the analysis components contained in the representative composition is changed by a predetermined content (Step S204). Specifically, for example, the comparative composition acquisition module 120 acquires each content of a comparative composition formed by increasing the content of Sn of the representative composition by a predetermined content of 0.10 mass% and decreasing the content of CH 2 by 0.10 mass%.
- the comparative composition acquisition module 120 acquires each content of each comparative composition formed by increasing Pb, Ca, or S by 0.10 mass% and decreasing the content of CH 2 by 0.10 mass%. That is, the comparative composition acquisition module 120 acquires comparative compositions exhibiting each content of four comparative compositions. A magnitude of the content to be changed may be the same for each analysis component.
- the thickness acquisition module 122 acquires a thickness set in advance as a thickness of a virtual sample indicated by each of the representative composition and the comparative compositions (Step S205). Specifically, for example, the thickness acquisition module 122 acquires data indicating a thickness of 8.0 mm input by the user as the thickness of the virtual sample. Step S202, Step S204, and Step S205 are in no particular order.
- the detection intensity calculation module 124 calculates a detection intensity indicating an intensity of fluorescent X-rays detected under the influence of a geometry effect through use of a fundamental parameter method, assuming that the virtual sample having the thickness set in advance, and being indicated by each of the representative composition and the comparative compositions, has been irradiated with primary X-rays (Step S206 to Step S208).
- the detection intensity calculation module 124 includes an emission intensity calculation module 126, a detection ratio acquisition module 128, and a calculation module 130, to thereby calculate the detection intensity.
- the emission intensity calculation module 126 calculates an emission intensity indicating the intensity of the fluorescent X-rays emitted from each analysis component, as a function of a position from the front surface of the virtual sample with the geometry effect being ignored, assuming that the virtual sample indicated by each of the representative composition and the comparative compositions has been irradiated with primary X-rays (Step S206). Specifically, first, the emission intensity calculation module 126 divides a thickness of the virtual sample from the front surface of the virtual sample to a predetermined position with fixed intervals.
- the emission intensity calculation module 126 divides a virtual sample set to have a thickness of 8.0 mm into layers of 1.0 mm in a direction perpendicular to the front surface, and calculates the intensity of the fluorescent X-rays emitted from each layer through use of the FP method.
- a position of each layer of the virtual sample set to have a thickness of 8.0 mm is shown in the first column of Table 2.
- An example of an emission intensity of a Sn K ⁇ line calculated for the virtual sample indicated by the representative composition is shown in the second column of Table 2.
- the density of the main component CH 2 is set to 0.9 g/cm 3
- the values of density of the other components are set to a bulk density.
- the detection ratio acquisition module 128 acquires a detection ratio as the function of the position from the front surface, the detection ratio representing a ratio between an emission intensity indicating the intensity of the fluorescent X-rays emitted from the virtual sample and the detection intensity of the fluorescent X-rays detected under the influence of the geometry effect for the lines of emitted fluorescent X-rays (Step S207) .
- the detection ratio acquisition module 128 acquires, for each of the divisions, a ratio at which the fluorescent X-rays emitted from each of the layers divided as described above is detected by the detector 112.
- the measuring unit 102 measures the intensity of the fluorescent X-rays in a state in which a flat plate sample containing the analysis component is arranged on the sample stage 108. In this case, a metal plate or another flat plate sample having a shallow measurement depth is used.
- the measuring unit 102 measures the intensity of the fluorescent X-rays in a state in which the position of the sample stage 108 is moved to each of the positions shown in Table 2 in the direction perpendicular to the front surface of the flat plate sample (that is, moved from 0.5 mm to 7.5 mm at intervals of 1.0 mm).
- the detection ratio acquisition module 128 acquires, as f(x), a ratio of the intensity after the movement to the intensity before the movement.
- the detection ratio acquisition module 128 acquires the detection ratio when the user inputs f(x) obtained in the experiment to the control unit 104.
- An example of the acquired detection ratio is shown in the third column of Table 2.
- FIG. 4 is a graph for showing a relationship between the detection ratio shown in the third column of Table 2 and the position from the front surface of the sample. As shown in FIG. 4 , the detection ratio linearly changes in accordance with the position "x", and the detection ratio becomes 0 at the position 11.0 mm. That is, when the position is larger than a predetermined value, the detection ratio is 0.
- This characteristic is a general characteristic of an energy-dispersive X-ray fluorescence spectrometer.
- the detection ratio acquisition module 128 may acquire f(x) expressed by the product of a relative detection area g(x) and a relative solid angle ⁇ (x).
- the relative detection area g(x) represents an area in which the fluorescent X-rays are detected at the position "x" from the front surface of the sample relative to the front surface of the sample.
- a detection region 702 on the sample 116 changes depending on a 20 angle even when the same detector 112 is used.
- ⁇ (x) is a function that is inversely proportional to the square of the distance between a certain position inside the sample and the detector 112.
- the detection ratio acquisition module 128 may acquire f(x) expressed by the product of the relative detection area g(x) and the relative solid angle ⁇ (x) obtained by a calculation instead of an experiment.
- the calculation module 130 multiplies the emission intensity by the detection ratio to calculate the detection intensity as the function of the position from the front surface (Step S208) .
- the detection intensity calculation module 124 calculates the detection intensity by multiplying the emission intensity at each layer by the detection ratio for each layer.
- An example of the acquired detection intensity is shown in the fourth column of Table 2.
- Table 2 shows only the intensities of the Sn K ⁇ line acquired for the virtual sample indicated by the representative composition. However, in Step S208, total values of the detection intensities for all the analysis components of the representative composition and the comparative compositions are calculated.
- the fluorescent X-rays (analytical lines) for which the detection intensities are to be calculated are the Sn K ⁇ line (25.2 keV), the Pb L ⁇ 1 line (12.6 keV), a Ca K ⁇ line (3.7 keV), and a S K ⁇ line (2.3 keV) for each composition.
- the emission intensity of the Sn K ⁇ line obtained when the distance from the front surface of the sample is 7.5 mm is 61% of that obtained when the distance is 0.5 mm.
- the detection intensity of the Sn K ⁇ line obtained when the distance from the front surface of the sample is 7.5 mm is 20% of that obtained when the distance is 0.5 mm. That is, it can be understood that the detection intensity becomes higher at a position closer to the front surface of the sample.
- the matrix correction coefficient calculation module 132 calculates each matrix correction coefficient ⁇ j for each analysis component through use of the calibration curve equation expressed by Math. 1, Math. 2, or Math. 3 (Step S210).
- W i is a value representing the mass fraction (mass%) of one component "i" included in the analysis components
- "a", "b", and "c" are constants.
- a detection intensity I i is a value calculated in a detection intensity calculation step for the component "i”
- ⁇ j is a value representing the matrix correction coefficient for the component "i” with respect to the coexisting component "j”.
- W j is a value representing the mass fraction (mass%) of the coexisting component "j”.
- the matrix correction coefficient calculation module 132 calculates the matrix correction coefficient based on the total value of the detection intensities calculated in Step S208.
- a matrix correction model used to calculate the matrix correction coefficient is a model using CH 2 as the base material and including the analysis component in a correction term.
- the matrix correction coefficient calculation module 132 calculates ⁇ Pb , ⁇ Ca , and ⁇ S through use of Math. 9 and the comparative compositions, in each composition of which one of the contents of Pb, Ca, and S, being the correcting components, is changed. In the same manner, the matrix correction coefficient calculation module 132 calculates the matrix correction coefficients for cases in which the analysis components are Pb, Ca, and S. Table 3 is an example showing the calculated matrix correction coefficients. [Table 3] Analysis component Correcting component Sn Pb Ca S Sn 0.1318 0.3301 0.1454 0.0642 Pb 0.2687 0.5066 0.3744 0.1028 Ca 0.0311 0.2028 0.0807 0.0233 S 0.0120 0.0990 0.0015 0.0480
- Table 4 is an example showing the matrix correction coefficient in a comparative example. Table 4 shows results of calculating the matrix correction coefficients by calculating theoretical intensities by the FP method through use of the bulk model expressed by Math. 2 based on a related-art method. [Table 4] Analysis component Correcting component Sn Pb Ca S Sn 0.6614 0.6436 0.1443 0.0632 Pb 1.2559 1.0071 0.3623 0.1023 Ca 0.1640 0.4194 0.0808 0.0213 S 0.0782 0.2113 0.0016 0.0480
- the measuring unit 102 irradiates a plurality of standard samples containing analysis components and having known contents with primary X-rays, and measures the intensity of the fluorescent X-rays emitted from each analysis component.
- the standard sample having the thickness acquired in Step S205 is arranged on the sample stage 108 (Step S302).
- the standard sample contains the same components as those of a representative sample, and the content of each component is known.
- Step S304 the standard sample is irradiated with primary X-rays, and the intensities of the Sn K ⁇ line (25.2 keV), the Pb L ⁇ 1 line (12.6 keV), the Ca K ⁇ line (3.7 keV), and the S K ⁇ line (2.3 keV) that have been emitted are measured (Step S304).
- the analysis lines to be measured are the same as the analysis lines for which the detection intensities are to be calculated in Step S208.
- the intensities of the fluorescent X-rays are measured for a sufficient number of standard samples for creating a calibration curve.
- the intensities of the fluorescent X-rays were acquired for eight standard samples having mutually different contents of each component.
- Table 5 is a table showing the content of each of components contained in each standard sample and the intensity of an analysis line corresponding to each component. The intensities of the analysis lines shown in Table 5 are actually measured values, being the results of actual measurement. [Table 5] Sampl e No.
- the calibration curve creation module 134 creates a calibration curve expressed by the calibration curve equation for each analysis component, based on the intensity of the fluorescent X-rays measured in each standard sample measuring step and the matrix correction coefficient (Step S308). Specifically, the calibration curve creation module 134 uses the contents and X-ray intensities for each standard sample shown in Table 5 and the matrix correction coefficients shown in Table 3 to create a calibration curve equation of Math. 1 in which the constants "b" and "c" have been specified.
- the measuring unit 102 irradiates an unknown sample with primary X-rays, and measures the intensity of the fluorescent X-rays for each analysis component.
- the unknown sample containing the same components as those of the representative sample and without knowing contents of the components is arranged on the sample stage 108 (Step S310).
- the thickness of the unknown sample is 8.0 mm, being the thickness acquired in Step S205.
- the unknown sample is irradiated with primary X-rays, and the intensities of the Sn K ⁇ line (25.2 keV), the Pb L ⁇ 1 line (12.6 keV), the Ca K ⁇ line (3.7 keV), and the S K ⁇ line (2.3 keV) that have been emitted are measured.
- the analysis lines to be measured are the same as the analysis lines for which the detection intensities are to be calculated in Step S208.
- the content calculation module 136 calculates the content of each analysis component contained in the unknown sample, based on the intensity of the fluorescent X-rays measured in an unknown sample measuring step of Step S312 and the calibration curve (Step S314). Specifically, for example, the content calculation module 136 calculates each content based on the calibration curve equation (Math. 1) including the constants "b" and "c" determined by the calibration curve, the intensity I i of the fluorescent X-rays acquired in the measuring step, ⁇ i representing the matrix correction coefficient, and W j representing the mass fraction of the coexisting component "j".
- the constants "b" and "c" determined by the calibration curve are the constants acquired in Step S308.
- FIG. 5(a) and FIG. 5(b) are graphs showing a calibration curve of Sn acquired in Step S308.
- FIG. 5(b) is an enlarged graph of a region exhibiting a low content range in FIG. 5(a) .
- the circles of FIG. 5(a) and FIG. 5(b) are data showing relationships between the X-ray intensities and the contents obtained before matrix correction was performed (that is, data shown in Table 5).
- the diamond-shaped marks of FIG. 5(a) and FIG. 5(b) are data showing relationships between the X-ray intensities and the contents (estimated reference values) obtained after the matrix correction was performed through use of the matrix correction coefficients shown in Table 3.
- the straight lines of FIG. 5(a) and FIG. 5(b) are straight lines obtained by approximating the data obtained after the matrix correction by a linear equation.
- FIG. 6(a) and FIG. 6(b) are graphs showing a calibration curve of Sn as a comparative example.
- FIG. 6(b) is an enlarged graph of a region exhibiting a low content range in FIG. 6(a) .
- the circles of FIG. 6(a) and FIG. 6(b) are the same as those of FIGS. 5 .
- the diamond-shaped marks of FIG. 6(a) and FIG. 6(b) are data showing relationships between the X-ray intensities and the contents (estimated reference values) obtained after the matrix correction was performed through use of the matrix correction coefficients (matrix correction coefficients calculated based on the bulk model) shown in Table 4.
- the straight lines of FIG. 6(a) and FIG. 6(b) are the same as those of FIG. 5 .
- the calibration curve creation module 134 may use the contents and the X-ray intensities of each standard sample shown in Table 5 and the matrix correction coefficients shown in Table 3 to acquire the calibration curve equation of Math. 2 with the constants "a", “b", and “c” specified or the calibration curve equation of Math. 3 with the constants "b” and “c” specified.
- the content calculation module 136 calculates the content based on the calibration curve equation (Math. 2 or Math. 3) .
- the analysis component may be a single element, or may be an oxide (for example, SiO 2 ) or another compound.
- the analysis component is a compound such as SiO 2
- the content of SiO 2 is used as W i included in Math. 1 to Math. 3.
- the analysis line for which the intensity is to be measured is fluorescent X-rays ascribable to the element Si.
- the predetermined position set in Step S206 is the position of a back surface of the unknown sample.
- the thickness acquired in Step S205 and the thickness of the unknown sample are the same.
- the predetermined position set in Step S206 is the position at which the detection intensity becomes 0.
- the thickness of the unknown sample may be larger than the thickness acquired in Step S205.
- the detection intensity calculation module 124 may also calculate the detection intensity with the geometry effect taken into consideration through use of a Monte Carlo simulation instead of the processing steps of from Step S206 to Step S208. Specifically, first, the thickness of the virtual sample, the intensity of the primary X-rays to be applied to each position on the front surface of the virtual sample, and an incident angle are set as parameters. Each of the parameters is appropriately set based on the thickness of the unknown sample, specifications of the X-ray source 106, and specifications of the detector 112.
- a generation position of the primary X-rays on an X-ray tube target, a direction in which the primary X-rays are emitted, and the energy of the primary X-rays, are determined based on randomly determined values.
- An optical path of the primary X-rays to the front surface of the virtual sample is determined based on the generation position and the direction.
- the depth at which the primary X-rays penetrate into the virtual sample is determined based on the energy.
- a part of the fluorescent X-rays generated inside the virtual sample irradiated with the primary X-rays is emitted to the outside of the virtual sample, and detected by a virtual detector 112 set at a given position.
- the detection intensity of the detected fluorescent X-rays can be theoretically calculated through use of the FP method by using the Monte Carlo simulation in which the optical path and penetration depth of the above-mentioned primary X-rays are randomly determined values.
- the matrix correction coefficient may be calculated through use of the detection intensity calculated by this method.
- the detection intensity calculation module 124 may calculate the detection intensity based on an X-ray intensity theoretical equation (Math. 10) including: K i which is a constant; W i representing the mass fraction of a measurement component "i" which is one component of a plurality of analysis components; ⁇ representing the density of the representative sample and the plurality of comparative samples; “d” representing the thickness of the representative sample and the plurality of comparative samples; f(x) representing the detection ratio; ⁇ j representing an overall absorption coefficient for the coexisting component "j” with respect to the analysis lines, the coexisting component "j” being a component other than the measurement component "i” among the analysis components; W j representing the mass fraction of the coexisting component "j", and "x” representing the position from the front surface of the sample.
- I Ti K i W i ⁇ ⁇ 0 d f x e ⁇ ⁇ ⁇ j W j ⁇ x dx
- Math. 10 is a mathematical expression converted from Math. 4 used in the related art in consideration of the geometry effect.
- the detection intensity calculation module 124 may calculate the detection intensity by analytically calculating Math. 10.
- the detection intensity calculation module 124 divides a thickness of the sample from the front surface of the sample to the back surface with fixed intervals, and calculates the intensity of the fluorescent X-rays for each of the divisions, to thereby calculate the total sum of the calculate intensities of the fluorescent X-rays.
- a method for this calculation is a method of calculating the detection intensity by approximating the total sum as a value obtained by the X-ray intensity theoretical equation expressed by Math. 10.
- this embodiment may be applied to a method of performing an analysis by a calibration curve method through use of a ratio between a fluorescent X-ray intensity and an intensity of scattered X-rays, for example, Compton scattered X-rays.
- a ratio between a fluorescent X-ray intensity and an intensity of scattered X-rays for example, Compton scattered X-rays.
- the theoretical intensities may be calculated in consideration of the geometry effect, and the matrix correction coefficients may be calculated in the same manner as described above.
- the X-ray fluorescence spectrometer 100 may be any one of the energy-dispersive X-ray fluorescence spectrometer or the wavelength-dispersive X-ray fluorescence spectrometer.
Landscapes
- Physics & Mathematics (AREA)
- Health & Medical Sciences (AREA)
- Life Sciences & Earth Sciences (AREA)
- Chemical & Material Sciences (AREA)
- Analytical Chemistry (AREA)
- Biochemistry (AREA)
- General Health & Medical Sciences (AREA)
- General Physics & Mathematics (AREA)
- Immunology (AREA)
- Pathology (AREA)
- Analysing Materials By The Use Of Radiation (AREA)
Claims (7)
- Procédé d'analyse quantitative pour des mesures de fluorescence de rayons X, comprenant :une étape d'acquisition de composition représentative (S202) consistant à acquérir une composition représentative, laquelle est une composition exprimée par des teneurs de composants d'analyse contenus dans un échantillon inconnu à analyser et est définie pour représenter les teneurs des composants d'analyse ;une étape d'acquisition de compositions comparatives (S204) consistant à acquérir une pluralité de compositions comparatives, et dans chacune d'elles, la teneur de l'un des composants d'analyse contenus dans la composition représentative est modifiée au moyen d'une teneur prédéterminée ;une étape de calcul d'intensité de détection (S208) consistant à, en supposant qu'un échantillon virtuel présentant une épaisseur définie à l'avance et indiqué par chaque composition parmi la composition représentative et les compositions comparatives a été irradié à l'aide de rayons X primaires, calculer une intensité de détection indiquant une intensité de rayons X fluorescents détectés sous l'influence d'un effet de géométrie en utilisant un procédé par paramètres fondamentaux ; etune étape de calcul de coefficient de correction de matrice (S210) consistant à calculer un coefficient de correction de matrice αj pour chacun des composants d'analyse en utilisant une équation de courbe d'étalonnage exprimée par :

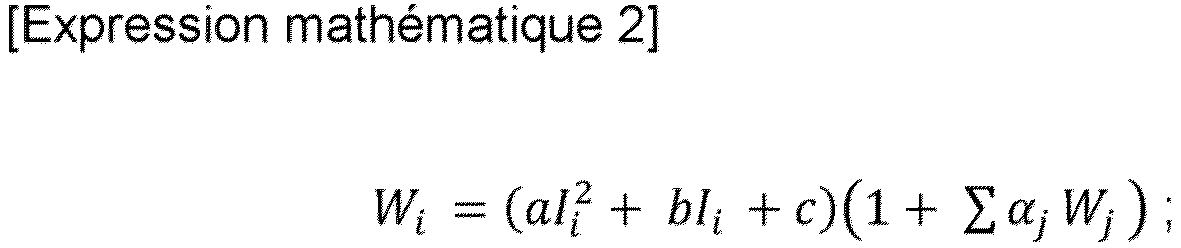
 Expressions mathématiques dans lesquelles :Wi représente une fraction massique d'un composant "i" inclus dans les composants d'analyse ;"a", "b" et "c" représentent chacun une constante ;Ii représente l'intensité de détection calculée pour le composant "i" lors de l'étape de calcul d'intensité de détection ;αj représente le coefficient de correction de matrice pour le composant "i" par rapport à un composant coexistant "j" ; etWj représente une fraction massique du composant coexistant "j",dans lequel l'épaisseur définie à l'avance en tant qu'épaisseur de l'échantillon virtuel et une épaisseur de l'échantillon inconnu sont les mêmes,dans lequel le procédé comprend en outre :une étape de mesure d'échantillons standards (S302, S304, S306) consistant à irradier une pluralité d'échantillons standards contenant les composants d'analyse et présentant des teneurs connues à l'aide de rayons X primaires et à mesurer l'intensité des rayons X fluorescents émis depuis chacun des composants d'analyse ;une étape de création de courbe d'étalonnage (S308) consistant à créer une courbe d'étalonnage exprimée par l'équation de courbe d'étalonnage pour chacun des composants d'analyse, sur la base de l'intensité des rayons X fluorescents mesurée lors de l'étape de mesure d'échantillons standards et du coefficient de correction de matrice ;une étape de mesure d'échantillon inconnu (S310, S312) consistant à irradier l'échantillon inconnu à l'aide de rayons X primaires et à mesurer l'intensité des rayons X fluorescents pour chacun des composants d'analyse ; etune étape de calcul de teneur (S314) consistant à calculer la teneur de chacun des composants d'analyse contenus dans l'échantillon inconnu, sur la base de l'intensité des rayons X fluorescents mesurée lors de l'étape de mesure d'échantillon inconnu et de la courbe d'étalonnage,dans lequel toutes les épaisseurs de la pluralité d'échantillons standards sont les mêmes que l'épaisseur définie à l'avance en tant qu'épaisseur de l'échantillon virtuel et que l'épaisseur de l'échantillon inconnu.
 - Procédé d'analyse quantitative selon la revendication 1, dans lequel l'étape de calcul d'intensité de détection (S208) inclut :une étape de division consistant à diviser une épaisseur de l'échantillon virtuel depuis la surface avant de l'échantillon virtuel jusqu'à une position prédéterminée selon des intervalles fixes ; etune étape de calcul de somme totale consistant à calculer une somme totale de l'intensité de détection calculée pour chacune des divisions.
- Procédé d'analyse quantitative selon la revendication 1 ou 2,
dans lequel l'étape de calcul d'intensité de détection (S208) inclut :une étape de calcul d'intensité d'émission (S206) consistant à, en supposant que l'échantillon virtuel indiqué par chaque composition parmi la composition représentative et les compositions comparatives a été irradié à l'aide de rayons X primaires, calculer une intensité d'émission indiquant l'intensité des rayons X fluorescents émis depuis chacun des composants d'analyse, en fonction d'une position par rapport à la surface avant de l'échantillon virtuel, l'effet de géométrie étant ignoréune étape d'acquisition de rapport de détection (S207) consistant à acquérir, en supposant qu'un échantillon virtuel indiqué par une composition donnée a été irradié à l'aide de rayons X primaires, un rapport de détection en fonction de la position par rapport à la surface avant, le rapport de détection représentant un rapport entre une intensité d'émission indiquant l'intensité des rayons X fluorescents émis depuis l'échantillon virtuel et l'intensité de détection des rayons X fluorescents détectés sous l'influence de l'effet de géométrie pour les lignes de rayons X fluorescents émis ; etune étape de multiplication consistant à multiplier l'intensité d'émission par le rapport de détection pour calculer l'intensité de détection en fonction de la position par rapport à la surface avant. - Procédé d'analyse quantitative selon la revendication 2, dans lequel la position prédéterminée est définie à :une position à laquelle l'intensité de détection devient égale à 0 lorsqu'une épaisseur de l'échantillon inconnu est plus grande qu'une épaisseur depuis la surface avant jusqu'à la position à laquelle l'intensité de détection devient égale à 0 ; etune position d'une surface arrière de l'échantillon inconnu lorsque l'épaisseur de l'échantillon inconnu est plus petite que l'épaisseur depuis la surface avant jusqu'à la position à laquelle l'intensité de détection devient égale à 0.
- Procédé d'analyse quantitative selon la revendication 1,dans lequel l'étape de calcul d'intensité de détection (S208) est une étape de calcul de l'intensité de détection en utilisant une simulation de Monte-Carlo, etdans lequel l'étape de calcul d'intensité de détection (S208) inclut les étapes dedéfinition, en tant que paramètres, d'une épaisseur de l'échantillon virtuel, de l'intensité des rayons X primaires à appliquer sur chaque position sur la surface avant de l'échantillon virtuel et un angle d'incidence par rapport à la surface avant des rayons X primaires ;détermination, sur la base de valeurs déterminées de façon aléatoire, d'une position de génération des rayons X primaires sur une cible de tube à rayons X, d'une direction dans laquelle les rayons X primaires sont émis et de l'énergie des rayons X primaires ; etcalcul de l'intensité des rayons X fluorescents pour une position prédéterminée en utilisant l'intensité de détection pour chaque trajectoire depuis la position de génération des rayons X primaires jusqu'à la surface avant.
- Programme d'analyse quantitative à exécuter par un ordinateur utilisé pour un spectromètre à fluorescence de rayons X (100), le programme d'analyse quantitative forçant l'ordinateur à exécuter :une étape d'acquisition de composition représentative (S202) consistant à acquérir une composition représentative, laquelle est une composition exprimée par des teneurs de composants d'analyse contenus dans un échantillon inconnu à analyser et est définie pour représenter les teneurs des composants d'analyse ;une étape d'acquisition de compositions comparatives (S204) consistant à acquérir une pluralité de compositions comparatives, et dans chacune d'elles, la teneur de l'un des composants d'analyse contenus dans la composition représentative est modifiée au moyen d'une teneur prédéterminée ;une étape de calcul d'intensité de détection (S208) consistant à, en supposant qu'un échantillon virtuel présentant une épaisseur définie à l'avance et indiqué par chaque composition parmi la composition représentative et les compositions comparatives a été irradié à l'aide de rayons X primaires, calculer une intensité de détection indiquant une intensité de rayons X fluorescents détectés sous l'influence d'un effet de géométrie en utilisant un procédé par paramètres fondamentaux ; etune étape de calcul de coefficient de correction de matrice (S210) consistant à calculer un coefficient de correction de matrice αj pour chacun des composants d'analyse en utilisant une équation de courbe d'étalonnage exprimée par :


 Expressions mathématiques dans lesquelles :Wi représente une fraction massique d'un composant "i" inclus dans les composants d'analyse ;"a", "b" et "c" représentent chacun une constante ;Ii représente l'intensité de détection calculée pour le composant "i" lors de l'étape de calcul d'intensité de détection (S208) ;αj représente le coefficient de correction de matrice pour le composant "i" par rapport à un composant coexistant "j" ; etWj représente une fraction massique du composant coexistant "j",dans lequel l'épaisseur définie à l'avance en tant qu'épaisseur de l'échantillon virtuel et une épaisseur de l'échantillon inconnu sont les mêmes,dans lequel le programme d'analyse quantitative force en outre l'ordinateur à exécuter :une étape de mesure d'échantillons standards (S302, S304, S306) consistant à irradier une pluralité d'échantillons standards contenant les composants d'analyse et présentant des teneurs connues à l'aide de rayons X primaires et à mesurer l'intensité des rayons X fluorescents émis depuis chacun des composants d'analyse ;une étape de création de courbe d'étalonnage (S308) consistant à créer une courbe d'étalonnage exprimée par l'équation de courbe d'étalonnage pour chacun des composants d'analyse, sur la base de l'intensité des rayons X fluorescents mesurée lors de l'étape de mesure d'échantillons standards et du coefficient de correction de matrice ;une étape de mesure d'échantillon inconnu (S310, S312) consistant à irradier l'échantillon inconnu à l'aide de rayons X primaires et à mesurer l'intensité des rayons X fluorescents pour chacun des composants d'analyse ; etune étape de calcul de teneur (S314) consistant à calculer la teneur de chacun des composants d'analyse contenus dans l'échantillon inconnu, sur la base de l'intensité des rayons X fluorescents mesurée lors de l'étape de mesure d'échantillon inconnu et de la courbe d'étalonnage,dans lequel toutes les épaisseurs de la pluralité d'échantillons standards sont les mêmes que l'épaisseur définie à l'avance en tant qu'épaisseur de l'échantillon virtuel et que l'épaisseur de l'échantillon inconnu.
 - Spectromètre à fluorescence de rayons X (100), comprenant :un module d'acquisition de composition représentative (118) configuré pour acquérir une composition représentative, qui est une composition exprimée par des teneurs de composants d'analyse contenus dans un échantillon inconnu à analyser et est définie pour représenter les teneurs des composants d'analyse ;un module d'acquisition de compositions comparatives (120) configuré pour acquérir une pluralité de compositions comparatives, et dans chacune d'elles, la teneur de l'un des composants d'analyse contenus dans la composition représentative est modifiée au moyen d'une teneur prédéterminée ;un module de calcul d'intensité de détection (124) configuré pour, en supposant qu'un échantillon virtuel présentant une épaisseur définie à l'avance et indiqué par chaque composition parmi la composition représentative et les compositions comparatives a été irradié à l'aide de rayons X primaires, calculer une intensité de détection indiquant une intensité de rayons X fluorescents détectés sous l'influence d'un effet de géométrie en utilisant un procédé par paramètres fondamentaux ; etun module de calcul de coefficient de correction de matrice (132) configuré pour calculer un coefficient de correction de matrice αj pour chacun des composants d'analyse en utilisant une équation de courbe d'étalonnage exprimée par :
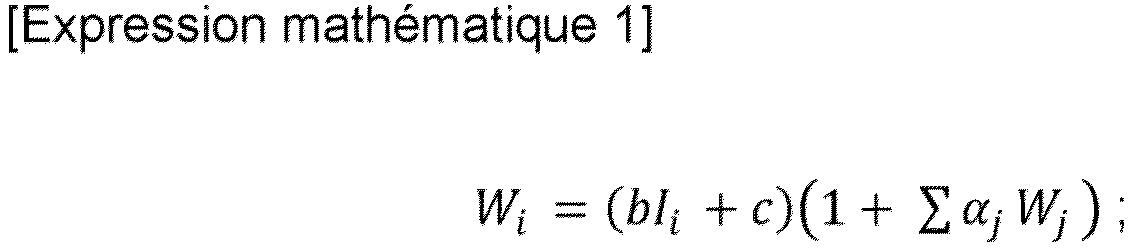

 Expressions mathématiques dans lesquelles :Wi représente une fraction massique d'un composant "i" inclus dans les composants d'analyse ;"a", "b" et "c" représentent chacun une constante ;Ii représente l'intensité de détection calculée pour le composant "i" par le module de calcul d'intensité de détection ;αj représente le coefficient de correction de matrice pour le composant "i" par rapport à un composant coexistant "j" ; etWj représente une fraction massique du composant coexistant "j",dans lequel l'épaisseur définie à l'avance en tant qu'épaisseur de l'échantillon virtuel et une épaisseur de l'échantillon inconnu sont les mêmes,dans lequel le spectromètre à fluorescence de rayons X (100) est en outre configuré pour mettre en oeuvre :une étape de mesure d'échantillons standards (S302, S304, S306) consistant à irradier une pluralité d'échantillons standards contenant les composants d'analyse et présentant des teneurs connues à l'aide de rayons X primaires et à mesurer l'intensité des rayons X fluorescents émis depuis chacun des composants d'analyse ;une étape de création de courbe d'étalonnage (S308) consistant à créer une courbe d'étalonnage exprimée par l'équation de courbe d'étalonnage pour chacun des composants d'analyse, sur la base de l'intensité des rayons X fluorescents mesurée lors de l'étape de mesure d'échantillons standards et du coefficient de correction de matrice ;une étape de mesure d'échantillon inconnu (S310, S312) consistant à irradier l'échantillon inconnu à l'aide de rayons X primaires et à mesurer l'intensité des rayons X fluorescents pour chacun des composants d'analyse ; etune étape de calcul de teneur (S314) consistant à calculer la teneur de chacun des composants d'analyse contenus dans l'échantillon inconnu, sur la base de l'intensité des rayons X fluorescents mesurée lors de l'étape de mesure d'échantillon inconnu et de la courbe d'étalonnage,dans lequel toutes les épaisseurs de la pluralité d'échantillons standards sont les mêmes que l'épaisseur définie à l'avance en tant qu'épaisseur de l'échantillon virtuel et que l'épaisseur de l'échantillon inconnu.
Applications Claiming Priority (2)
| Application Number | Priority Date | Filing Date | Title |
|---|---|---|---|
| JP2020021771A JP6944730B2 (ja) | 2020-02-12 | 2020-02-12 | 定量分析方法、定量分析プログラム及び蛍光x線分析装置 |
| PCT/JP2020/045322 WO2021161631A1 (fr) | 2020-02-12 | 2020-12-04 | Procédé d'analyse quantitative, programme d'analyse quantitative et dispositif d'analyse par spectrométrie de fluorescence des rayons x |
Publications (3)
| Publication Number | Publication Date |
|---|---|
| EP4105649A1 EP4105649A1 (fr) | 2022-12-21 |
| EP4105649A4 EP4105649A4 (fr) | 2023-07-26 |
| EP4105649B1 true EP4105649B1 (fr) | 2024-09-25 |
Family
ID=77292294
Family Applications (1)
| Application Number | Title | Priority Date | Filing Date |
|---|---|---|---|
| EP20918376.3A Active EP4105649B1 (fr) | 2020-02-12 | 2020-12-04 | Procédé d'analyse quantitative, programme d'analyse quantitative et dispositif d'analyse par spectrométrie de fluorescence des rayons x |
Country Status (5)
| Country | Link |
|---|---|
| US (1) | US11782000B2 (fr) |
| EP (1) | EP4105649B1 (fr) |
| JP (1) | JP6944730B2 (fr) |
| CN (1) | CN114787616B (fr) |
| WO (1) | WO2021161631A1 (fr) |
Families Citing this family (6)
| Publication number | Priority date | Publication date | Assignee | Title |
|---|---|---|---|---|
| JP7233756B2 (ja) * | 2021-06-08 | 2023-03-07 | 株式会社リガク | 蛍光x線分析装置 |
| EP4276452B1 (fr) * | 2022-05-13 | 2024-07-03 | Bruker AXS GmbH | Système et procédé de détermination de fractions de masse dans un échantillon d'essai avec des spectromètres de fluorescence de rayons x à dispersion de longueur d'ondes |
| WO2023236540A1 (fr) * | 2023-01-17 | 2023-12-14 | 山东大学 | Appareil et procédé d'analyse de constituants de minerai |
| JP7653718B2 (ja) * | 2023-02-24 | 2025-03-31 | 株式会社リガク | 蛍光x線分析装置 |
| JP7653719B2 (ja) * | 2023-02-24 | 2025-03-31 | 株式会社リガク | 蛍光x線分析装置 |
| EP4597090B1 (fr) * | 2024-02-01 | 2026-04-01 | Bruker AXS SE | Système et procédé d'approximation d'intensités de rayons x pour un échantillon mesuré par un système de détection de rayons x |
Family Cites Families (9)
| Publication number | Priority date | Publication date | Assignee | Title |
|---|---|---|---|---|
| JP2626857B2 (ja) | 1992-05-15 | 1997-07-02 | 理学電機工業株式会社 | ガラスビード法を用いた蛍光x線分析方法 |
| JP3069305B2 (ja) * | 1996-01-29 | 2000-07-24 | 理学電機工業株式会社 | 蛍光x線分析方法および装置 |
| JP3059403B2 (ja) * | 1996-07-18 | 2000-07-04 | 理学電機工業株式会社 | X線分析方法および装置 |
| JP3635337B2 (ja) * | 2001-03-16 | 2005-04-06 | 理学電機工業株式会社 | 蛍光x線分析方法および装置 |
| JP4005547B2 (ja) | 2003-09-04 | 2007-11-07 | エスアイアイ・ナノテクノロジー株式会社 | プラスティックを分析するx線分析装置 |
| JP3965191B2 (ja) | 2005-04-06 | 2007-08-29 | 理学電機工業株式会社 | 蛍光x線分析装置およびそれに用いるプログラム |
| JP5285572B2 (ja) * | 2009-10-26 | 2013-09-11 | 株式会社リガク | 蛍光x線分析装置 |
| JP2011099749A (ja) * | 2009-11-05 | 2011-05-19 | Horiba Ltd | 濃度計測方法及び蛍光x線分析装置 |
| CN107290376B (zh) * | 2017-06-26 | 2019-10-18 | 中国建材检验认证集团股份有限公司 | 一种xrf分析的基体校正系数的计算方法 |
-
2020
- 2020-02-12 JP JP2020021771A patent/JP6944730B2/ja active Active
- 2020-12-04 CN CN202080086958.0A patent/CN114787616B/zh active Active
- 2020-12-04 EP EP20918376.3A patent/EP4105649B1/fr active Active
- 2020-12-04 WO PCT/JP2020/045322 patent/WO2021161631A1/fr not_active Ceased
- 2020-12-04 US US17/793,913 patent/US11782000B2/en active Active
Also Published As
| Publication number | Publication date |
|---|---|
| US11782000B2 (en) | 2023-10-10 |
| EP4105649A1 (fr) | 2022-12-21 |
| JP2021128027A (ja) | 2021-09-02 |
| WO2021161631A1 (fr) | 2021-08-19 |
| CN114787616B (zh) | 2023-12-08 |
| JP6944730B2 (ja) | 2021-10-06 |
| US20230060446A1 (en) | 2023-03-02 |
| CN114787616A (zh) | 2022-07-22 |
| EP4105649A4 (fr) | 2023-07-26 |
Similar Documents
| Publication | Publication Date | Title |
|---|---|---|
| EP4105649B1 (fr) | Procédé d'analyse quantitative, programme d'analyse quantitative et dispositif d'analyse par spectrométrie de fluorescence des rayons x | |
| US7595489B2 (en) | Method and apparatus for material identification | |
| EP3550293B1 (fr) | Analyseur de fluorescence x | |
| US8582717B2 (en) | Concentration measuring method and fluorescent X-ray spectrometer | |
| EP3064931B1 (fr) | Analyse quantitative aux rayons x | |
| CN110312928A (zh) | 荧光x射线分析方法、荧光x射线分析程序以及荧光x射线分析装置 | |
| EP3239702A1 (fr) | Analyseur par fluorescence x | |
| JP2848751B2 (ja) | 元素分析方法 | |
| US7961842B2 (en) | X-ray fluorescence spectrometer and program used therein | |
| JP3889187B2 (ja) | 蛍光x線分析方法およびその装置 | |
| JP3965173B2 (ja) | 蛍光x線分析装置およびそれに用いるプログラム | |
| EP4614137A1 (fr) | Procédé d'analyse par rayons x fluorescents, programme d'analyse et dispositif d'analyse par rayons x fluorescents | |
| JP4523958B2 (ja) | 蛍光x線分析装置およびそれに用いるプログラム | |
| EP3885758B1 (fr) | Procédé d'analyse et analyseur de fluorescence par rayons x | |
| Bamford et al. | Extending the quantitative analytical capabilities of the EDXRF technique for plant‐based samples | |
| JP6713110B2 (ja) | バックグラウンド除去方法及び蛍光x線分析装置 | |
| EP4549876A1 (fr) | Procédé de mesure d'épaisseur, dispositif d'analyse de rayons x, dispositif de traitement d'informations et programme informatique | |
| EP4425161B1 (fr) | Spectromètre à fluorescence à rayons x | |
| US20260110650A1 (en) | X-ray fluorescence spectrometer | |
| JPH09269305A (ja) | 蛍光x線分析方法および装置 | |
| JP2645227B2 (ja) | 蛍光x線分析方法 | |
| Devi et al. | Determination of Sr to Ca ratio in solid carbonate, fluoride, and nitrate samples using the fundamental parameters of EDXRF: experimental and empirical evaluation of non-destructive assays in light matrices | |
| JP2024120519A (ja) | 蛍光x線分析装置 | |
| JPH05264480A (ja) | 蛍光x線分析方法および該方法に使用する装置 | |
| Ward | Determination of arsenic in rocks and ores with a sequential X‐ray spectrometer |
Legal Events
| Date | Code | Title | Description |
|---|---|---|---|
| STAA | Information on the status of an ep patent application or granted ep patent |
Free format text: STATUS: THE INTERNATIONAL PUBLICATION HAS BEEN MADE |
|
| PUAI | Public reference made under article 153(3) epc to a published international application that has entered the european phase |
Free format text: ORIGINAL CODE: 0009012 |
|
| STAA | Information on the status of an ep patent application or granted ep patent |
Free format text: STATUS: REQUEST FOR EXAMINATION WAS MADE |
|
| 17P | Request for examination filed |
Effective date: 20220712 |
|
| AK | Designated contracting states |
Kind code of ref document: A1 Designated state(s): AL AT BE BG CH CY CZ DE DK EE ES FI FR GB GR HR HU IE IS IT LI LT LU LV MC MK MT NL NO PL PT RO RS SE SI SK SM TR |
|
| DAV | Request for validation of the european patent (deleted) | ||
| DAX | Request for extension of the european patent (deleted) | ||
| A4 | Supplementary search report drawn up and despatched |
Effective date: 20230626 |
|
| RIC1 | Information provided on ipc code assigned before grant |
Ipc: G01N 23/223 20060101AFI20230620BHEP |
|
| GRAP | Despatch of communication of intention to grant a patent |
Free format text: ORIGINAL CODE: EPIDOSNIGR1 |
|
| STAA | Information on the status of an ep patent application or granted ep patent |
Free format text: STATUS: GRANT OF PATENT IS INTENDED |
|
| INTG | Intention to grant announced |
Effective date: 20240529 |
|
| GRAS | Grant fee paid |
Free format text: ORIGINAL CODE: EPIDOSNIGR3 |
|
| GRAA | (expected) grant |
Free format text: ORIGINAL CODE: 0009210 |
|
| STAA | Information on the status of an ep patent application or granted ep patent |
Free format text: STATUS: THE PATENT HAS BEEN GRANTED |
|
| AK | Designated contracting states |
Kind code of ref document: B1 Designated state(s): AL AT BE BG CH CY CZ DE DK EE ES FI FR GB GR HR HU IE IS IT LI LT LU LV MC MK MT NL NO PL PT RO RS SE SI SK SM TR |
|
| REG | Reference to a national code |
Ref country code: GB Ref legal event code: FG4D |
|
| REG | Reference to a national code |
Ref country code: CH Ref legal event code: EP |
|
| REG | Reference to a national code |
Ref country code: DE Ref legal event code: R096 Ref document number: 602020038518 Country of ref document: DE |
|
| REG | Reference to a national code |
Ref country code: IE Ref legal event code: FG4D |
|
| REG | Reference to a national code |
Ref country code: NL Ref legal event code: FP |
|
| REG | Reference to a national code |
Ref country code: LT Ref legal event code: MG9D |
|
| PG25 | Lapsed in a contracting state [announced via postgrant information from national office to epo] |
Ref country code: NO Free format text: LAPSE BECAUSE OF FAILURE TO SUBMIT A TRANSLATION OF THE DESCRIPTION OR TO PAY THE FEE WITHIN THE PRESCRIBED TIME-LIMIT Effective date: 20241225 |
|
| PG25 | Lapsed in a contracting state [announced via postgrant information from national office to epo] |
Ref country code: GR Free format text: LAPSE BECAUSE OF FAILURE TO SUBMIT A TRANSLATION OF THE DESCRIPTION OR TO PAY THE FEE WITHIN THE PRESCRIBED TIME-LIMIT Effective date: 20241226 Ref country code: FI Free format text: LAPSE BECAUSE OF FAILURE TO SUBMIT A TRANSLATION OF THE DESCRIPTION OR TO PAY THE FEE WITHIN THE PRESCRIBED TIME-LIMIT Effective date: 20240925 |
|
| PG25 | Lapsed in a contracting state [announced via postgrant information from national office to epo] |
Ref country code: BG Free format text: LAPSE BECAUSE OF FAILURE TO SUBMIT A TRANSLATION OF THE DESCRIPTION OR TO PAY THE FEE WITHIN THE PRESCRIBED TIME-LIMIT Effective date: 20240925 |
|
| PG25 | Lapsed in a contracting state [announced via postgrant information from national office to epo] |
Ref country code: LV Free format text: LAPSE BECAUSE OF FAILURE TO SUBMIT A TRANSLATION OF THE DESCRIPTION OR TO PAY THE FEE WITHIN THE PRESCRIBED TIME-LIMIT Effective date: 20240925 |
|
| PG25 | Lapsed in a contracting state [announced via postgrant information from national office to epo] |
Ref country code: RS Free format text: LAPSE BECAUSE OF FAILURE TO SUBMIT A TRANSLATION OF THE DESCRIPTION OR TO PAY THE FEE WITHIN THE PRESCRIBED TIME-LIMIT Effective date: 20241225 |
|
| PG25 | Lapsed in a contracting state [announced via postgrant information from national office to epo] |
Ref country code: RS Free format text: LAPSE BECAUSE OF FAILURE TO SUBMIT A TRANSLATION OF THE DESCRIPTION OR TO PAY THE FEE WITHIN THE PRESCRIBED TIME-LIMIT Effective date: 20241225 Ref country code: NO Free format text: LAPSE BECAUSE OF FAILURE TO SUBMIT A TRANSLATION OF THE DESCRIPTION OR TO PAY THE FEE WITHIN THE PRESCRIBED TIME-LIMIT Effective date: 20241225 Ref country code: LV Free format text: LAPSE BECAUSE OF FAILURE TO SUBMIT A TRANSLATION OF THE DESCRIPTION OR TO PAY THE FEE WITHIN THE PRESCRIBED TIME-LIMIT Effective date: 20240925 Ref country code: GR Free format text: LAPSE BECAUSE OF FAILURE TO SUBMIT A TRANSLATION OF THE DESCRIPTION OR TO PAY THE FEE WITHIN THE PRESCRIBED TIME-LIMIT Effective date: 20241226 Ref country code: FI Free format text: LAPSE BECAUSE OF FAILURE TO SUBMIT A TRANSLATION OF THE DESCRIPTION OR TO PAY THE FEE WITHIN THE PRESCRIBED TIME-LIMIT Effective date: 20240925 Ref country code: BG Free format text: LAPSE BECAUSE OF FAILURE TO SUBMIT A TRANSLATION OF THE DESCRIPTION OR TO PAY THE FEE WITHIN THE PRESCRIBED TIME-LIMIT Effective date: 20240925 |
|
| REG | Reference to a national code |
Ref country code: AT Ref legal event code: MK05 Ref document number: 1727017 Country of ref document: AT Kind code of ref document: T Effective date: 20240925 |
|
| PG25 | Lapsed in a contracting state [announced via postgrant information from national office to epo] |
Ref country code: IS Free format text: LAPSE BECAUSE OF FAILURE TO SUBMIT A TRANSLATION OF THE DESCRIPTION OR TO PAY THE FEE WITHIN THE PRESCRIBED TIME-LIMIT Effective date: 20250125 Ref country code: PT Free format text: LAPSE BECAUSE OF FAILURE TO SUBMIT A TRANSLATION OF THE DESCRIPTION OR TO PAY THE FEE WITHIN THE PRESCRIBED TIME-LIMIT Effective date: 20250127 |
|
| PG25 | Lapsed in a contracting state [announced via postgrant information from national office to epo] |
Ref country code: RO Free format text: LAPSE BECAUSE OF FAILURE TO SUBMIT A TRANSLATION OF THE DESCRIPTION OR TO PAY THE FEE WITHIN THE PRESCRIBED TIME-LIMIT Effective date: 20240925 Ref country code: SM Free format text: LAPSE BECAUSE OF FAILURE TO SUBMIT A TRANSLATION OF THE DESCRIPTION OR TO PAY THE FEE WITHIN THE PRESCRIBED TIME-LIMIT Effective date: 20240925 |
|
| PG25 | Lapsed in a contracting state [announced via postgrant information from national office to epo] |
Ref country code: ES Free format text: LAPSE BECAUSE OF FAILURE TO SUBMIT A TRANSLATION OF THE DESCRIPTION OR TO PAY THE FEE WITHIN THE PRESCRIBED TIME-LIMIT Effective date: 20240925 |
|
| PG25 | Lapsed in a contracting state [announced via postgrant information from national office to epo] |
Ref country code: AT Free format text: LAPSE BECAUSE OF FAILURE TO SUBMIT A TRANSLATION OF THE DESCRIPTION OR TO PAY THE FEE WITHIN THE PRESCRIBED TIME-LIMIT Effective date: 20240925 Ref country code: EE Free format text: LAPSE BECAUSE OF FAILURE TO SUBMIT A TRANSLATION OF THE DESCRIPTION OR TO PAY THE FEE WITHIN THE PRESCRIBED TIME-LIMIT Effective date: 20240925 |
|
| PG25 | Lapsed in a contracting state [announced via postgrant information from national office to epo] |
Ref country code: CZ Free format text: LAPSE BECAUSE OF FAILURE TO SUBMIT A TRANSLATION OF THE DESCRIPTION OR TO PAY THE FEE WITHIN THE PRESCRIBED TIME-LIMIT Effective date: 20240925 Ref country code: PL Free format text: LAPSE BECAUSE OF FAILURE TO SUBMIT A TRANSLATION OF THE DESCRIPTION OR TO PAY THE FEE WITHIN THE PRESCRIBED TIME-LIMIT Effective date: 20240925 |
|
| PG25 | Lapsed in a contracting state [announced via postgrant information from national office to epo] |
Ref country code: SK Free format text: LAPSE BECAUSE OF FAILURE TO SUBMIT A TRANSLATION OF THE DESCRIPTION OR TO PAY THE FEE WITHIN THE PRESCRIBED TIME-LIMIT Effective date: 20240925 Ref country code: IT Free format text: LAPSE BECAUSE OF FAILURE TO SUBMIT A TRANSLATION OF THE DESCRIPTION OR TO PAY THE FEE WITHIN THE PRESCRIBED TIME-LIMIT Effective date: 20240925 |
|
| REG | Reference to a national code |
Ref country code: DE Ref legal event code: R097 Ref document number: 602020038518 Country of ref document: DE |
|
| PG25 | Lapsed in a contracting state [announced via postgrant information from national office to epo] |
Ref country code: MC Free format text: LAPSE BECAUSE OF FAILURE TO SUBMIT A TRANSLATION OF THE DESCRIPTION OR TO PAY THE FEE WITHIN THE PRESCRIBED TIME-LIMIT Effective date: 20240925 |
|
| PG25 | Lapsed in a contracting state [announced via postgrant information from national office to epo] |
Ref country code: DK Free format text: LAPSE BECAUSE OF FAILURE TO SUBMIT A TRANSLATION OF THE DESCRIPTION OR TO PAY THE FEE WITHIN THE PRESCRIBED TIME-LIMIT Effective date: 20240925 |
|
| REG | Reference to a national code |
Ref country code: CH Ref legal event code: PL |
|
| PLBE | No opposition filed within time limit |
Free format text: ORIGINAL CODE: 0009261 |
|
| STAA | Information on the status of an ep patent application or granted ep patent |
Free format text: STATUS: NO OPPOSITION FILED WITHIN TIME LIMIT |
|
| PG25 | Lapsed in a contracting state [announced via postgrant information from national office to epo] |
Ref country code: LU Free format text: LAPSE BECAUSE OF NON-PAYMENT OF DUE FEES Effective date: 20241204 |
|
| GBPC | Gb: european patent ceased through non-payment of renewal fee |
Effective date: 20241225 |
|
| 26N | No opposition filed |
Effective date: 20250626 |
|
| PG25 | Lapsed in a contracting state [announced via postgrant information from national office to epo] |
Ref country code: SE Free format text: LAPSE BECAUSE OF FAILURE TO SUBMIT A TRANSLATION OF THE DESCRIPTION OR TO PAY THE FEE WITHIN THE PRESCRIBED TIME-LIMIT Effective date: 20240925 |
|
| REG | Reference to a national code |
Ref country code: BE Ref legal event code: MM Effective date: 20241231 |
|
| PG25 | Lapsed in a contracting state [announced via postgrant information from national office to epo] |
Ref country code: GB Free format text: LAPSE BECAUSE OF NON-PAYMENT OF DUE FEES Effective date: 20241225 Ref country code: BE Free format text: LAPSE BECAUSE OF NON-PAYMENT OF DUE FEES Effective date: 20241231 |
|
| PG25 | Lapsed in a contracting state [announced via postgrant information from national office to epo] |
Ref country code: FR Free format text: LAPSE BECAUSE OF NON-PAYMENT OF DUE FEES Effective date: 20241231 |
|
| PG25 | Lapsed in a contracting state [announced via postgrant information from national office to epo] |
Ref country code: CH Free format text: LAPSE BECAUSE OF NON-PAYMENT OF DUE FEES Effective date: 20241231 |
|
| PG25 | Lapsed in a contracting state [announced via postgrant information from national office to epo] |
Ref country code: IE Free format text: LAPSE BECAUSE OF NON-PAYMENT OF DUE FEES Effective date: 20241204 |
|
| PGFP | Annual fee paid to national office [announced via postgrant information from national office to epo] |
Ref country code: NL Payment date: 20251112 Year of fee payment: 6 |
|
| PGFP | Annual fee paid to national office [announced via postgrant information from national office to epo] |
Ref country code: DE Payment date: 20251028 Year of fee payment: 6 |
|
| PG25 | Lapsed in a contracting state [announced via postgrant information from national office to epo] |
Ref country code: HR Free format text: LAPSE BECAUSE OF FAILURE TO SUBMIT A TRANSLATION OF THE DESCRIPTION OR TO PAY THE FEE WITHIN THE PRESCRIBED TIME-LIMIT Effective date: 20240925 |
|
| PG25 | Lapsed in a contracting state [announced via postgrant information from national office to epo] |
Ref country code: CY Free format text: LAPSE BECAUSE OF FAILURE TO SUBMIT A TRANSLATION OF THE DESCRIPTION OR TO PAY THE FEE WITHIN THE PRESCRIBED TIME-LIMIT; INVALID AB INITIO Effective date: 20201204 |