EP4134889A1 - Procédé et système de planification de la chaîne d'approvisionnement en fonction de la demande du client - Google Patents
Procédé et système de planification de la chaîne d'approvisionnement en fonction de la demande du client Download PDFInfo
- Publication number
- EP4134889A1 EP4134889A1 EP21190814.0A EP21190814A EP4134889A1 EP 4134889 A1 EP4134889 A1 EP 4134889A1 EP 21190814 A EP21190814 A EP 21190814A EP 4134889 A1 EP4134889 A1 EP 4134889A1
- Authority
- EP
- European Patent Office
- Prior art keywords
- demand
- curve
- safety stock
- ssc
- supply chain
- Prior art date
- Legal status (The legal status is an assumption and is not a legal conclusion. Google has not performed a legal analysis and makes no representation as to the accuracy of the status listed.)
- Withdrawn
Links
Images


Classifications
-
- G—PHYSICS
- G06—COMPUTING OR CALCULATING; COUNTING
- G06Q—INFORMATION AND COMMUNICATION TECHNOLOGY [ICT] SPECIALLY ADAPTED FOR ADMINISTRATIVE, COMMERCIAL, FINANCIAL, MANAGERIAL OR SUPERVISORY PURPOSES; SYSTEMS OR METHODS SPECIALLY ADAPTED FOR ADMINISTRATIVE, COMMERCIAL, FINANCIAL, MANAGERIAL OR SUPERVISORY PURPOSES, NOT OTHERWISE PROVIDED FOR
- G06Q10/00—Administration; Management
- G06Q10/08—Logistics, e.g. warehousing, loading or distribution; Inventory or stock management
- G06Q10/087—Inventory or stock management, e.g. order filling, procurement or balancing against orders
-
- G—PHYSICS
- G06—COMPUTING OR CALCULATING; COUNTING
- G06Q—INFORMATION AND COMMUNICATION TECHNOLOGY [ICT] SPECIALLY ADAPTED FOR ADMINISTRATIVE, COMMERCIAL, FINANCIAL, MANAGERIAL OR SUPERVISORY PURPOSES; SYSTEMS OR METHODS SPECIALLY ADAPTED FOR ADMINISTRATIVE, COMMERCIAL, FINANCIAL, MANAGERIAL OR SUPERVISORY PURPOSES, NOT OTHERWISE PROVIDED FOR
- G06Q30/00—Commerce
- G06Q30/02—Marketing; Price estimation or determination; Fundraising
- G06Q30/0201—Market modelling; Market analysis; Collecting market data
- G06Q30/0204—Market segmentation
Definitions
- the present invention relates to a computer-implemented method for end-to-end demand material requirements planning (MRP) and a corresponding computer system.
- MRP material requirements planning
- the invention is suitable for being implemented in various supply chain planning systems, where the supply chain planning system must respond to changing demand in the supply chain in due time with sufficient buffers.
- the invention can also be implemented in a supply and inventory planning system in combination with an enterprise resource planning (ERP) system.
- ERP enterprise resource planning
- Some solutions have a simple reorder point, where each stock point is optimized independently. The reorder point is then updated by an inventory settings process e.g., monthly.
- Other solutions have forecasting driven MRP, where statistical models are used to calculate future dependent requirements on a primary distribution centre.
- multi-echelon inventory methods operate in a way, where the stock points in the supply chain are simultaneously optimized.
- the safety stocks are then updated by an inventory settings process with an e.g., monthly frequency.
- One disadvantage with these methods is that often contra-intuitive results with "artificial" service levels are applied. Service levels can for example be increased downstream and lowered midstream. These "artificial" service levels are also hard to control in execution especially when the constraints emerge and disruptions occur.
- Another disadvantage with multi-echelon inventory methods is that the difficulty to handle large order sizes that often create so-called lumpy upstream demand.
- Forecasting driven MRP in particular has a disadvantage that is known as MRP 'nervousness'.
- MRP nervousness is the term used to describe how small demand changes create significant upstream changes - also known as noise. This noise creates a ripple of changes that are hard to understand - and creates therefore problems for the planners using the results of the planning.
- the inventory planning model is determined based on certain input.
- a performance monitor measures the parts supply chain and provides performance metrics.
- the movement of parts through the parts supply chain is also monitored by a supply chain visibility system that keeps track of actual supply chain conditions.
- the feedback from the feedback filter is sent to a feedback controller.
- the feedback controller adjusts the input of the inventory planning model while determining how frequently the inventory planning model is calibrated, and how the inventory planning model is calibrated.
- a threshold value can particularly be specified so that the nervousness or noise can be avoided in exceptional situations.
- this solution does effectively not solve the MRP nervousness problem in general, but merely mitigates the nervousness problem in this particular setup by recalibration with a threshold value.
- an improved method for performing MRP would be advantageous, and in particular a more efficient and/or reliable MRP method would be advantageous.
- the invention is particularly, but not exclusively, advantageous for obtaining significant advances in MRP with respect to an optimum with demand compliance to required service levels while not unnecessarily increasing safety stock levels as suggested in some prior art methods. Simulations presented and explained in more details below demonstrate convincingly the real and tangible effect of the invention.
- the safety stock curve according to the present invention gives an actual service level that is much closer to the target service level compared to Forecast driven MRP and Reorder planning using previous state of the art ways of setting safety stocks levels.
- the benefits of the invention include reaching target service level with a lower total stock amount.
- Simulations of the traditional safety stock methods performed by the present inventor show that actual service levels on a main distribution centre are significantly less than the target service level.
- the same simulations for the method according to the present invention give significantly better actual service levels. This may be due to two main reasons:
- the number of stock points with safety stock are reduced to customer facing stock points. This gives a much more transparent end-to-end of the supply chain planning that is only driven by true customer demand, forecast and the safety stock curve.
- the present invention may also take larger order sizes into account than previously possible.
- a 'supply chain' starting with unprocessed raw materials and ending with the final customer using the finished goods, and the supply chain may thereby link many companies and/or entities together.
- the supply chain may represent material and informational interchanges in the logistical process stretching from acquisition of raw materials to delivery of finished products to the end users.
- a supply chain may also be described as a material flow from suppliers of raw material to the final customers. All vendors, service providers and customers are then links in the supply chain.
- the term 'material' may represent - but not be exclusively limited to - raw material, partly or fully processed raw material, partly or fully assembled parts of a product, and/or parts or full products as the skilled person working with supply chain control and management will immediately understand.
- a 'customer segment' may represent the result of dividing customers into groups based on specific criteria, such as products purchased, customer geographic location, demand patterns, priority of customers (e.g. high/medium/low), etc. as the skilled person working with supply chain control and management will immediately understand.
- 'service level' may be considered a metric, shown e.g. as a percentage or another relative measure, alternatively an absolute measure, which captures the ability to satisfy demand or responsiveness.
- Order fill rates and machine or process up-time are examples of service level measures. It generally measures an ability of the suppliers to provide their materials and goods at the agreed times, quantity, and quality. More particular, a 'target service level' may then represent a desired, intended and/or planned service level that a supply chain management system will attempt or strive to reach under the given circumstances and constraints.
- a distribution centre may be a point of receiving, storing and/or further delivery of materials, i.e. an inventory storage entity/system, a warehouse or similar point in a supply chain.
- a distribution centre may be interpreted broadly as a place in the supply chain where materials from upstream are partly or fully assembled, partly or fully processed, and/or a place where intermediate products or goods are further processed towards a fully manufactured product. Effectively, a distribution centre may then include an assembly site or a manufacturing site in a supply chain as the skilled person working with supply chain control and management will immediately understand.
- At least one distribution centre is a main distribution centre in the sense that said main distribution centre supplies at least one other distribution centre, e.g. said main distribution centre may be a warehouse and said other distribution centre may be a retailer or similar, as the skilled person will understand when being familiar with multi-stage or multi-echelon inventory systems, where an inventory system has a number of coupled inventory or storage installations, typically scattered over a relatively large geographical area.
- the skilled reader is again referred to the book Inventory Control by Sven Axsater, Springer Science+ Business Media, 2006 , particularly chapters 8-10 about multi-echelon inventory systems, said book, especially said chapters 8-10, being hereby incorporated by reference in their entirety.
- the present invention relates generally to the technical field of logistics and supply chain planning. This field may be viewed both from an administrative and a technical point of view, but it should be stressed that the present invention arises out of technical insight in this area, and is based on technical and mathematical considerations made by an inventor having a technical education and training as an engineer.
- the present invention may be implemented on one, or more, computers with specifically adapted algorithms for this purpose, the invention provides quite tangible and direct results directly linked with the real physical world i.e. materials are transported in improved ways thereby saving time, energy and/or resources when implemented in an actual supply chain, hence the invention has a direct impact on the physical reality. This impact has also clearly a direct physical impact, which is beyond mere calculations and transfer of data between computers and entities in a connected network.
- the invention provides an inherent technical effect when implemented on computer in the sense that when materials are moved according to corresponding outputted orders to the supply chain, the technical effects will be significant and measurable, as evidenced by the simulations presented below.
- the present computer-implemented invention when applied to MRP in a specific supply chain, as the skilled person in logistics and supply chain planning will readily understand upon understanding and fully appreciating the invention.
- the safety stock curve may be calculated as a function of said demand fulfilment time (DFT) across the supply chain, preferably the entire supply chain, which is known to be an end-to-end E2E implementation.
- the safety stock curve is then used to drive the E2E supply net requirements planning and BOM explosion e.g., to trigger orders, such as upstream orders (manufacturing, purchase, replenishment, transportation etc.) in due time with sufficient total buffers.
- orders such as upstream orders (manufacturing, purchase, replenishment, transportation etc.) in due time with sufficient total buffers.
- the safety stock curve may be calculated as a function of said demand fulfilment time (DFT) across the supply chain from one, or more, customers segments, at least to said main distribution centre.
- the safety stock curve (SSC) calculated may not directly be related to a specific lead time, which is otherwise expected in other MRP models.
- an order preferably a replenishment order, may be initiated when a projected stock of material in one, or more, distribution centre(s) is below the safety stock curve (SSC).
- SSC safety stock curve
- a calculation of the safety stock curve may depend on, if the demand can be modelled as a continuous demand, more preferably the demand may then be modelled based on a normal distribution or Gamma distribution.
- a continuous demand model may be modelled by using a Normal distribution or Gamma distribution.
- a calculation of the safety stock curve may depend on, if the demand can be modelled as a discrete demand.
- the demand may then be modelled based on Compound Poisson distribution.
- the demand can be modelled as discrete demand if there are few expected consumption lines during DTF, or if the consumption order size variation is significant.
- the mathematics behind the Compound Poisson method is somewhat complex and therefore challenging to directly implement in a computerized solution.
- a reorder point curve may be calculated instead of a safety stock curve (SSC).
- SSC safety stock curve
- both a reorder point curve or a safety stock curve can be used for discrete demand and is typically modelled via a Compound Poisson distribution as described above.
- the difference between the reorder point curve and the safety stock curve is that the reorder point already includes the forecast.
- the calculation of these curves for Compound Poisson distribution is part of the teaching of the present invention.
- the curves for the Compound Poisson are not continuous curves as for Normal and Gamma distribution.
- the curves are preferably stepwise curves. The steps occur when the consumption/sales order lines per DFT triggers a higher reorder point (and thereby a higher safety stock) to meet a desired target service level.
- a buffer curve may be applied to stabilize the MRP method, said buffer curve being calculated so that replenishment orders are fixed in time and/or quantity, if a projected stock stays between the safety stock curve (SSC) and the buffer curve.
- SSC safety stock curve
- a buffer curve can be used to stabilize the MRP calculations.
- the orders are fixed in time and quantity, if the projected stock stays between the safety stock curve and the buffer curve.
- the interval between safety stock curve and the buffer curve is in this way a kind of stabilization buffer.
- the order moves earlier, if projected stock goes below the safety stock curve earlier.
- the order moves later, if the projected stock is above the buffer curve.
- the order is then created where the projected stock goes below the safety stock curve.
- the buffer curve increases over time from zero at the products lead time. The order is in this way never released earlier due to the buffer curve - but the MRP stability is increased when DTF increases.
- a negative safety stock value may be used at one, or more, upstream stock point(s) to reduce total safety stock by utilizing a portfolio effect of the downstream demand variation sources, the skilled person will understand the central limit theorem can used in context with the portfolio effect.
- the negative safety stock is a more transparent way than introducing a decoupling stock point and better way to handle large order.
- the safety stock in said supply chain may increase across possible stock points for storing material until a decoupling stock point - that is not controlled via a negative safety stock - is reached.
- the negative safety stock may be calculated or simulated as the sum of downstream safety stock curves from finished goods minus the safety stock curve for the component.
- the negative safety stock may be different for components used by one product. Some components are used in many products and have relatively higher portfolio effect and thereby a higher negative safety stock than other components that are only used in few products.
- orders may be released to production, supplier and/or transportation when there are supply constraints, such as capacity bottlenecks, preferably the orders are prioritized according to the safety stock curve (SSC).
- SSC safety stock curve
- M_DC, DC2, DC3, DC4 distribution centres
- SSC safety stock curve
- the invention relates to a computer-implemented MRP planning system for controlling materials in a supply chain on one or more computer(s), preferably a system comprising one, or more, computer(s), more preferably a plurality of computers distributed in said supply system, the system comprising:
- the invention in a third aspect, relates to a computer program product being adapted to enable a computer system comprising at least one computer having data storage means in connection therewith to control an computer-implemented system according to the second aspect of the invention, such as a computer program product comprising instructions which, when the program is executed by a computer, cause the computer to carry out the method of the first aspect of the invention.
- This aspect of the invention is particularly, but not exclusively, advantageous in that the present invention may be accomplished by a computer program product enabling a computer system to carry out the operations of the system of the second aspect of the invention when down- or uploaded into the computer system, preferably the computer system comprises a plurality of connected computers for implementing the invention.
- a computer program product may be provided on any kind of computer readable medium, or through a network.
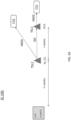
- Figure 1 is an overall schematic outline of a supply chain SC 100.
- the flow of materials or goods is generally from the left towards the right in Figure 1 as indicated by the various block arrows.
- a supply chain infrastructure is indicated in circles with suppliers SUP, sites PLANTS (incl. contract manufacturing organisations CMO), and transport between the suppliers and sites delivering the materials to the various places and sites in the supply chain.
- a distribution centre will below be abbreviated DC, and DCs in plural.
- a main distribution centre is accordingly abbreviated M_DC.
- M_DC main distribution centre
- just one main distribution centre is shown, but the present invention may of course be implemented with a plurality of main distributions centres in the understanding of this concept, as the skilled person in MRP will readily understand once the principle and teaching of the present invention is appreciated.
- one or more main distribution centre(s) may also be called primary distribution centres, whereas the other distribution centres may be called secondary distribution centres in the following.
- the S&OP abbreviation means sales & operation planning.
- the present invention relates to a computer-implemented MRP method for controlling materials in a supply chain SC 100.
- a computer-implemented MRP method for controlling materials in a supply chain SC 100.
- Schematically indicated in the lower right corner of Figure 1 is a corresponding computer COMP functionally connected and integrated with a database DB for storing and retrieving various data, stored in appropriate and various data formats, related to implementing the present invention.
- a plurality of computers and/or databases may be applied for implementing the invention, for example a plurality of geographically distributed computers, incl. handheld devices, that are interconnected for example via the internet, by wire and/or wirelessly, for example a cloud-based computer solution.
- the computer COMP is arranged for receiving customer data CD related to a plurality of customer segments, e.g. high priority customers and other customers, and the corresponding demand from each customer segment, where each customer segment having a specified target service level, such as percentage of service level to be reached.
- the demand from each customer segment may be a predicted, a forecasted and/or a real demand as the skilled person will understand.
- the computer COMP is likewise arranged for receiving material data MD related to a plurality of distribution centres often just called 'locations' in the field of logistics, e.g. M_DC and DC2 as shown in Figure 2A , the data MD being related to the amount of materials on stock in each distribution centre, where at least one distribution centre is a main distribution centre M_DC supplying one, or more, other distribution centres DC2 in the supply chain SC 100.
- Material data includes master data describing the materials, locations, and the supply chain structure etc.
- Customer data CD and material data MD may be automatically collected in the supply chain and transmitted to the computer COMP, such as by use of tracing and tracking technology applicable in a supply chain, as the skilled person will understand. These data may also be manually collected, or in any combination between being automatically and manually collected.
- the computer will output orders, preferably upstream orders and/or replenishment order RO, as schematically indicated by the arrow from the computer COMP, back to the plurality of distribution centres in the supply chain SC in due time as normally performed in MRP, but based on a new and advantageous safety stock curve according to the present invention, as it will be explained below.
- orders preferably upstream orders and/or replenishment order RO, as schematically indicated by the arrow from the computer COMP, back to the plurality of distribution centres in the supply chain SC in due time as normally performed in MRP, but based on a new and advantageous safety stock curve according to the present invention, as it will be explained below.
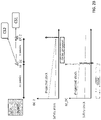
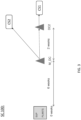
- FIG. 2A is a generic and schematic supply chain with a MRP method according to the present invention, where a distribution centre DC2 is distributing materials to a customer segment CS1 having an independent demand INDD and is in turn supplied from the main distribution centre M_DC thereby experiencing a dependent demand DD from the distribution centre DC2, for example between a warehouse and a retailer like the skilled person in supply chain management will readily understand.
- a distribution centre DC2 is distributing materials to a customer segment CS1 having an independent demand INDD and is in turn supplied from the main distribution centre M_DC thereby experiencing a dependent demand DD from the distribution centre DC2, for example between a warehouse and a retailer like the skilled person in supply chain management will readily understand.
- Each of the distribution centres M_DC and DC2 can of course each have a plurality of customer segments, but for illustrative purposes, the invention is initially explained in this simplified setup, the teaching and general principle of the invention, and the associated benefits, not being limited to this setup, as the skilled person in supply chain management will also readily
- Figure 2B shows that an order proposal is created at DC 2 when the projected stock gets below safety stock.
- the order proposal on DC 2 has a dependent requirement on M_DC.
- This dependent requirement on M_DC reduces the projected stock on M_DC to below safety stock.
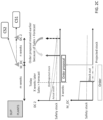
- Figure 2C shows the situation x weeks later.
- the order proposal on DC2 has moved earlier because the sales has been greater than the forecast during the x weeks.
- the dependent requirement from the order proposal on DC2 is also moved earlier.
- This dependent requirement on M_DC is now earlier than the replenishment order on M_DC that is already in progress. There is now a high probability that there will be stock outs on M_DC.
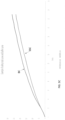
- the invention is particular in calculating a safety stock curve SSC, cf. Figures 5-8 for some examples, in a time phased manner based on the two periods m and n around the main distribution centre M_DC to cover an uncertain until a demand is fulfilled based both on the customer data CD and the material data MD.
- the invention is illustrated with the periods m and n being measured in weeks, e.g. 6 and 2 weeks, but the invention can of course be implemented in any relevant time period for MRP, such as alternatively hours, days, months, or even years.
- the number of time periods may similarly be adjusted to the number of distribution centres as the skilled person will immediately understand, the embodiment with two periods in weeks merely being chosen for illustrative purposes.
- the time until demand is fulfilled is defined as a demand fulfilment time DFT
- the safety stock curve SSC is then calculated as a function of the demand fulfilment time DFT in order to meet said specified target service level, TSL1 and TSL2 in the distribution centres and simultaneously minimize inventory levels in said plurality of distribution centres M_DC and DC2, respectively.
- the invention is then implemented in the supply chain SC 100 by outputting, e.g. from a computer COMP, upstream orders RO to the plurality of distribution centres in said supply chain in due time based on said safety stock curve SSC with resulting advantageous and unexpected results.
- the safety stock curve is used to drive the supply net requirements planning and bill- of-material BOM explosion e.g., to trigger upstream orders such as manufacturing, purchase, replenishment, transportation etc. in due time with sufficient total buffers. This is based on traditional forecast driven supply planning - but using the safety stock curve. Thus, orders are created where the projected stock goes below the safety stock curve.
- Figure 4A with a table of results obtained by a MRP method according to the present invention as compared these two prior art methods and Figure 4B for a number of simulated results.
- Average Forecast 101 units per week, average coefficient of variance CV (weekly) 29%
- Average Forecast 100 per week, average coefficient of variance CV (weekly) 30%
- Method 1 There are generally two existing methods to calculate the safety stocks on DC2 and M_DC in this situation: Method 1:
- the problem with this method is that the order to replenishment of DC2 can be triggered too early (too high safety stock). The result may be out of stock of materials on M_DC and higher stock on D2. The risk of stock out increases, if the higher replenishment order size to DC2 is large compared to the total demand on DC2.
- the method according to this invention instead uses a new safety stock curve SSC to calculate the safety stocks.
- the safety stocks are then not static over time, and surprisingly combines the benefits from both prior art Method 1 and Method 2.
- the safety stock on DC2 in week m is the same as for Method 1.
- the advantage compared to Method 1 is that the planned replenishment order to DC2 is in this way planned in due time - so that the dependent demand on M_DC is known in advance.
- the replenishment order to M_DC is in this way planned in due time (like in Method 2).
- the advantage compared to Method 2 is accordingly that the planned replenishment order to DC2 is in this way planned in due time like Method 2 - but is triggered later due to the lower safety stock on the shorter horizon.
- the replenishment order to M_DC is in this way not triggered too early (like in Method 1).
- FIG 4B there is a summarized statistic overview for a series of simulations like the one shown in Figure 4A with the most important findings from these simulations.
- the invention provides average service levels SL of 99.7% and 96.5% at the secondary and main distribution centre, respectively, against a nominal target of 98% for both. Particularly at the main distribution centre in the Table) this is significantly better than the prior art methods, Method 1 and Method 2, with corresponding service levels of only 92.1% and 91.1%, respectively.
- the invention is superior to the Method 1 and Method 2 known in the prior art for supply chain management and inventory control.
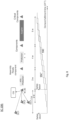
- FIG. 5A schematically shows another supply chain SC 100 with a MRP method according to the present invention with a corresponding safety stock curve SSC (lower graph) across the supply chain SC 100.
- One customer segment CS1 can be categorized as high priority, and the other segment CS2 as normal or lower priority.
- the main distribution centre M_DC can be defined per product, and likewise with the distribution centre DC2.
- Assembly Ready Components ARC
- the components and raw materials comes from suppliers, and the components may be stocked at the supplier as indicated schematically.
- the end-to-end E2E supply chain planning according to the present invention enables that orders are triggered upstream based on the forecast and the time-phased safety stocks for:
- FIG 5B the actual safety stock curve SSC is inserted in the lower graph for illustrating how the invention may be implemented for this specific example.
- Figure 5C the same graph as in Figure 5B is shown with the safety stock curve SSC together with a buffer curve BC for stabilizing the MRP calculations or simulations according to the present invention.
- the safety stock curve can be calculated by using the fill rate method if the demand is continuous and may be modelled by using a Normal distribution.
- the fill rate model may be used to calculate the safety stock curve:
- k is the safety factor based on normal distribution function.
- ⁇ dLT is the standard deviation of demand during demand fulfilment time.
- Q is the average replenishment order size.
- d ⁇ is the average demand per time period.
- DFT is the demand fulfilment time used as the x-axis in the safety stock curve
- ⁇ d 2 is the variance of demand per time period.
- ⁇ LT 2 is the variance of demand fulfilment time d ⁇ dLT is the demand during demand fulfilment time
- Figures 6-8 schematically show other supply chains with a MRP method according to the present invention together with corresponding safety stock curves.
- Figure 6 is similar to Figure 5 , but with production closer to the customer segments to the far right. This is a so-called assembly-to-order, make-to-order, engineer-to-order setup with similar advantages.
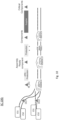
- Figure 7 is similar to Figures 5 and 6 , but with an example of a so-called decoupling stock point.
- main distribution centre M_DC may be defined per product, and the supply chain has assembled ready components (ARC).
- Figure 8 is similar to Figure 7 , but with an example of a so-called partly decoupling stock point. It is different from Figure 7 in that the distribution centre DC1 has a longer lead time and higher replenishment order size as compared to DC2 and DC3. Determining partly decoupling stock point at the main distribution centre M_DC may then be performed in the following steps:
- the invention therefore comprises calculating a dedicated safety stock curve SSC' to this particular situation with a longer lead time and higher replenishment order size with respect to M_DC.
- another safety stack curve SSC may be calculated and applied to order replenishment orders, as schematically in the graph below the supply chain.
- Figures 9-10 schematically shows other supply chains SC 100 with a MRP method according to the present invention.
- Figure 9 shows a supply chain with a high priority customer segment CS1 (supply chain indicated with a dashed line) and a lower priority customer segment CS2, both segments being positioned in two different geographical locations as indicated. Each geographical location has a corresponding distribution centre named DC1 and DC2 supplied by main distribution centre M_DC.
- the supply chain contains Assembly ready components (ARC), components and raw materials from suppliers and components at suppliers as indicated in Figure 9 .
- Figure 10 is similar to Figure 9 , and schematically indicated how stocks can be segregated automatically to use demand segment priorities. Hence, there may be automatica stock segregation so as to respect demand segment priorities:
- FIG 11 is a schematic system-chart representing an out-line of/in detail the operations of the computer-implemented method according to the invention.
- a computer-implemented MRP method for controlling materials in a supply chain SC 100 as illustrated in Figure 1 the method comprising the steps of:
- One or more steps may be performed simultaneously, or in another order than above listed, as the skilled person will readily understand.
- the invention relates to a computer-implemented MRP method for controlling materials in a supply chain SC with customer segments CS1, CS2 as schematically shown in Figures 1 and 2A .
- the invention is advantageous in that there is calculated a safety stock curve SSC in a time-phased manner m, n to cover an uncertainty until a demand is fulfilled based on customer data CD and material data MD.
- the time until demand is fulfilled is a demand fulfilment time DFT, the safety stock curve SSC being calculated as a function of this demand fulfilment time DFT in order to meet specified target service level TSL1, TSL2 and simultaneously minimize inventory levels in said plurality of distribution centres M_DC, DC2, as shown in Figures 5-8 .
- the invention provides advances in MRP with respect to an optimum with demand compliance to required service levels while not unnecessarily increasing safety stock levels. Simulations convincingly demonstrate the effects of the invention, cf. Fig. 4A and 4B .
- the invention can be implemented by means of hardware, software, firmware or any combination of these.
- the invention or some of the features thereof can also be implemented as software running on one or more data processors and/or digital signal processors.
- the individual elements of an embodiment of the invention may be physically, functionally and logically implemented in any suitable way such as in a single unit, in a plurality of units or as part of separate functional units.
- the invention may be implemented in a single unit, or be both physically and functionally distributed between different units and processors.
Landscapes
- Business, Economics & Management (AREA)
- Engineering & Computer Science (AREA)
- Entrepreneurship & Innovation (AREA)
- Accounting & Taxation (AREA)
- Development Economics (AREA)
- Finance (AREA)
- Strategic Management (AREA)
- Economics (AREA)
- Marketing (AREA)
- Physics & Mathematics (AREA)
- General Business, Economics & Management (AREA)
- General Physics & Mathematics (AREA)
- Theoretical Computer Science (AREA)
- Human Resources & Organizations (AREA)
- Operations Research (AREA)
- Quality & Reliability (AREA)
- Tourism & Hospitality (AREA)
- Game Theory and Decision Science (AREA)
- Data Mining & Analysis (AREA)
- Management, Administration, Business Operations System, And Electronic Commerce (AREA)
Priority Applications (2)
| Application Number | Priority Date | Filing Date | Title |
|---|---|---|---|
| EP21190814.0A EP4134889A1 (fr) | 2021-08-11 | 2021-08-11 | Procédé et système de planification de la chaîne d'approvisionnement en fonction de la demande du client |
| US17/884,965 US20230045901A1 (en) | 2021-08-11 | 2022-08-10 | Method and a system for customer demand driven supply chain planning |
Applications Claiming Priority (1)
| Application Number | Priority Date | Filing Date | Title |
|---|---|---|---|
| EP21190814.0A EP4134889A1 (fr) | 2021-08-11 | 2021-08-11 | Procédé et système de planification de la chaîne d'approvisionnement en fonction de la demande du client |
Publications (1)
| Publication Number | Publication Date |
|---|---|
| EP4134889A1 true EP4134889A1 (fr) | 2023-02-15 |
Family
ID=77300839
Family Applications (1)
| Application Number | Title | Priority Date | Filing Date |
|---|---|---|---|
| EP21190814.0A Withdrawn EP4134889A1 (fr) | 2021-08-11 | 2021-08-11 | Procédé et système de planification de la chaîne d'approvisionnement en fonction de la demande du client |
Country Status (2)
| Country | Link |
|---|---|
| US (1) | US20230045901A1 (fr) |
| EP (1) | EP4134889A1 (fr) |
Cited By (2)
| Publication number | Priority date | Publication date | Assignee | Title |
|---|---|---|---|---|
| CN118134202A (zh) * | 2024-04-12 | 2024-06-04 | 简帷(杭州)软件有限公司 | 一种供应链计划中的瓶颈识别方法 |
| CN119444064A (zh) * | 2024-11-01 | 2025-02-14 | 北京沃东天骏信息技术有限公司 | 一种模型训练、库存调拨方法、装置、电子设备、存储介质及程序产品 |
Families Citing this family (1)
| Publication number | Priority date | Publication date | Assignee | Title |
|---|---|---|---|---|
| US12026664B2 (en) * | 2021-10-15 | 2024-07-02 | Dell Products L.P. | Automatically generating inventory-related information forecasts using machine learning techniques |
Citations (2)
| Publication number | Priority date | Publication date | Assignee | Title |
|---|---|---|---|---|
| US20070192213A1 (en) | 2006-01-27 | 2007-08-16 | Peiling Wu | Feedback control theoretic parts inventory management model |
| WO2016066859A1 (fr) * | 2014-10-31 | 2016-05-06 | Ocado Innovation Limited | Système et procédé pour réaliser des commandes de commerce électronique à partir d'une hiérarchie de centres de gestion des commandes |
Family Cites Families (6)
| Publication number | Priority date | Publication date | Assignee | Title |
|---|---|---|---|---|
| US20080300844A1 (en) * | 2007-06-01 | 2008-12-04 | International Business Machines Corporation | Method and system for estimating performance of resource-based service delivery operation by simulating interactions of multiple events |
| US8650062B2 (en) * | 2008-01-18 | 2014-02-11 | Ephiphony, Inc. | Automated replenishment using an economic profit quantity |
| IN2014MU00735A (fr) * | 2014-03-04 | 2015-09-25 | Tata Consultancy Services Ltd | |
| US10002364B2 (en) * | 2014-06-25 | 2018-06-19 | Oracle International Corporation | Consumption-driven forecasting using multi-level heterogeneous input data |
| US10318669B2 (en) * | 2016-06-16 | 2019-06-11 | International Business Machines Corporation | Adaptive forecasting of time-series |
| US11922440B2 (en) * | 2017-10-31 | 2024-03-05 | Oracle International Corporation | Demand forecasting using weighted mixed machine learning models |
-
2021
- 2021-08-11 EP EP21190814.0A patent/EP4134889A1/fr not_active Withdrawn
-
2022
- 2022-08-10 US US17/884,965 patent/US20230045901A1/en active Pending
Patent Citations (2)
| Publication number | Priority date | Publication date | Assignee | Title |
|---|---|---|---|---|
| US20070192213A1 (en) | 2006-01-27 | 2007-08-16 | Peiling Wu | Feedback control theoretic parts inventory management model |
| WO2016066859A1 (fr) * | 2014-10-31 | 2016-05-06 | Ocado Innovation Limited | Système et procédé pour réaliser des commandes de commerce électronique à partir d'une hiérarchie de centres de gestion des commandes |
Cited By (2)
| Publication number | Priority date | Publication date | Assignee | Title |
|---|---|---|---|---|
| CN118134202A (zh) * | 2024-04-12 | 2024-06-04 | 简帷(杭州)软件有限公司 | 一种供应链计划中的瓶颈识别方法 |
| CN119444064A (zh) * | 2024-11-01 | 2025-02-14 | 北京沃东天骏信息技术有限公司 | 一种模型训练、库存调拨方法、装置、电子设备、存储介质及程序产品 |
Also Published As
| Publication number | Publication date |
|---|---|
| US20230045901A1 (en) | 2023-02-16 |
Similar Documents
| Publication | Publication Date | Title |
|---|---|---|
| Kapuscinski et al. | Inventory decisions in Dell's supply chain | |
| US20230045901A1 (en) | Method and a system for customer demand driven supply chain planning | |
| US6415195B1 (en) | Method and system for providing sufficient availability of manufacturing resources to meet unanticipated demand | |
| Krajewski et al. | The value of production schedule integration in supply chains | |
| US6393332B1 (en) | Method and system for providing sufficient availability of manufacturing resources to meet unanticipated demand | |
| US20030014314A1 (en) | Manufacturing flow control method and system | |
| JP2001233414A (ja) | 生産計画方法 | |
| JP2009140350A (ja) | サプライチェーン評価システム、方法、及びプログラム。 | |
| Vandaele et al. | Advanced resource planning | |
| US20230004906A1 (en) | System and methods for automated generation of dispatch schedule | |
| Rohde et al. | Master planning | |
| Mohamed et al. | Mitigating the bullwhip effect and enhancing supply chain performance through demand information sharing: An ARENA simulation study | |
| US20040128214A1 (en) | Inventory management method, inventory management apparatus, and recording medium | |
| US6415194B1 (en) | Method and system for providing sufficient availability of manufacturing resources to meet unanticipated demand | |
| US6397118B1 (en) | Method and system for providing sufficient availability of manufacturing resources to meet unanticipated demand | |
| Rohde et al. | Master planning | |
| Kadam et al. | Theoretical foundations and practical implementation of supply chain optimization a metal fabrication business model | |
| Olanrele et al. | Managing Uncertainty in Production Planning for Fast-Moving Consumer Goods: A Linear Programming and Monte Carlo Simulation Framework | |
| Budiman | Optimal capacity adjustment for supply chain control | |
| Vignaroli | Establishing Inventory Maturity in a Make-To-Order Manufacturing Environment | |
| dos Santos | An Optimization Approach to the Tactical Production Planning in a Filling Company | |
| Ackermann et al. | Computing Optimal Mitigation Plans for Force-Majeure Scenarios in Dynamic Manufacturing Chains | |
| Gallo et al. | A pull management model for a production cell under variable demand conditions | |
| JP2008097330A (ja) | サプライチェーンの効率化支援方法 | |
| Schönsleben | Capacity Management |
Legal Events
| Date | Code | Title | Description |
|---|---|---|---|
| PUAI | Public reference made under article 153(3) epc to a published international application that has entered the european phase |
Free format text: ORIGINAL CODE: 0009012 |
|
| STAA | Information on the status of an ep patent application or granted ep patent |
Free format text: STATUS: THE APPLICATION HAS BEEN PUBLISHED |
|
| AK | Designated contracting states |
Kind code of ref document: A1 Designated state(s): AL AT BE BG CH CY CZ DE DK EE ES FI FR GB GR HR HU IE IS IT LI LT LU LV MC MK MT NL NO PL PT RO RS SE SI SK SM TR |
|
| STAA | Information on the status of an ep patent application or granted ep patent |
Free format text: STATUS: THE APPLICATION IS DEEMED TO BE WITHDRAWN |
|
| 18D | Application deemed to be withdrawn |
Effective date: 20230817 |