EP4199449A1 - Classification automatique d'anomalies corrélées à partir d'un réseau par regroupement interprétable - Google Patents
Classification automatique d'anomalies corrélées à partir d'un réseau par regroupement interprétable Download PDFInfo
- Publication number
- EP4199449A1 EP4199449A1 EP22213017.1A EP22213017A EP4199449A1 EP 4199449 A1 EP4199449 A1 EP 4199449A1 EP 22213017 A EP22213017 A EP 22213017A EP 4199449 A1 EP4199449 A1 EP 4199449A1
- Authority
- EP
- European Patent Office
- Prior art keywords
- network
- anomalies
- clustering
- data
- groups
- Prior art date
- Legal status (The legal status is an assumption and is not a legal conclusion. Google has not performed a legal analysis and makes no representation as to the accuracy of the status listed.)
- Pending
Links
Images



Classifications
-
- H—ELECTRICITY
- H04—ELECTRIC COMMUNICATION TECHNIQUE
- H04L—TRANSMISSION OF DIGITAL INFORMATION, e.g. TELEGRAPHIC COMMUNICATION
- H04L43/00—Arrangements for monitoring or testing data switching networks
- H04L43/06—Generation of reports
- H04L43/062—Generation of reports related to network traffic
-
- H—ELECTRICITY
- H04—ELECTRIC COMMUNICATION TECHNIQUE
- H04L—TRANSMISSION OF DIGITAL INFORMATION, e.g. TELEGRAPHIC COMMUNICATION
- H04L41/00—Arrangements for maintenance, administration or management of data switching networks, e.g. of packet switching networks
- H04L41/06—Management of faults, events, alarms or notifications
- H04L41/0631—Management of faults, events, alarms or notifications using root cause analysis; using analysis of correlation between notifications, alarms or events based on decision criteria, e.g. hierarchy, tree or time analysis
- H04L41/0636—Management of faults, events, alarms or notifications using root cause analysis; using analysis of correlation between notifications, alarms or events based on decision criteria, e.g. hierarchy, tree or time analysis based on a decision tree analysis
-
- G—PHYSICS
- G06—COMPUTING OR CALCULATING; COUNTING
- G06N—COMPUTING ARRANGEMENTS BASED ON SPECIFIC COMPUTATIONAL MODELS
- G06N20/00—Machine learning
-
- G—PHYSICS
- G06—COMPUTING OR CALCULATING; COUNTING
- G06N—COMPUTING ARRANGEMENTS BASED ON SPECIFIC COMPUTATIONAL MODELS
- G06N5/00—Computing arrangements using knowledge-based models
- G06N5/01—Dynamic search techniques; Heuristics; Dynamic trees; Branch-and-bound
-
- H—ELECTRICITY
- H04—ELECTRIC COMMUNICATION TECHNIQUE
- H04L—TRANSMISSION OF DIGITAL INFORMATION, e.g. TELEGRAPHIC COMMUNICATION
- H04L41/00—Arrangements for maintenance, administration or management of data switching networks, e.g. of packet switching networks
- H04L41/06—Management of faults, events, alarms or notifications
- H04L41/0631—Management of faults, events, alarms or notifications using root cause analysis; using analysis of correlation between notifications, alarms or events based on decision criteria, e.g. hierarchy, tree or time analysis
-
- H—ELECTRICITY
- H04—ELECTRIC COMMUNICATION TECHNIQUE
- H04L—TRANSMISSION OF DIGITAL INFORMATION, e.g. TELEGRAPHIC COMMUNICATION
- H04L41/00—Arrangements for maintenance, administration or management of data switching networks, e.g. of packet switching networks
- H04L41/16—Arrangements for maintenance, administration or management of data switching networks, e.g. of packet switching networks using machine learning or artificial intelligence
-
- H—ELECTRICITY
- H04—ELECTRIC COMMUNICATION TECHNIQUE
- H04L—TRANSMISSION OF DIGITAL INFORMATION, e.g. TELEGRAPHIC COMMUNICATION
- H04L43/00—Arrangements for monitoring or testing data switching networks
- H04L43/04—Processing captured monitoring data, e.g. for logfile generation
- H04L43/045—Processing captured monitoring data, e.g. for logfile generation for graphical visualisation of monitoring data
Definitions
- the present disclosure generally relates to network monitoring. More particularly, the present disclosure relates to systems and methods for classifying correlated anomalies through interpretable clustering.
- the management and monitoring systems may include network management systems, financial monitoring systems, medical monitoring, seismic activity monitoring, or any system that performs some management or monitoring of an underlying system or network having time lasting events that have associated severity, urgency, and/or impact on end users.
- the real-time data may include telemetry data, alarms, warnings, Performance Monitoring (PM) data, event information, transaction information, metrics, Key Performance Indicators (KPIs), Call Detail Records (CDR), etc.
- PM Performance Monitoring
- KPIs Key Performance Indicators
- CDR Call Detail Records
- the general objective of management and monitoring systems is for users (e.g., operators, technicians, etc.) to detect service interruption or issues, investigate such service interruption or issues, and provide remediation. Of course, the objective is to simplify the investigation, identify and prioritize events, and utilize resources effectively.
- Real-time anomalies can be detected in the data using counters and KPIs linked to telecommunications network health.
- the anomalies are typically triggered by rules which are manually configured by experts.
- Reported information can include start time, end time, rule type, severity, impacted subscribers, impacted dimensions, auto-diagnostics results of the case, etc.
- Some anomaly detection systems can group correlated anomalies in real time and determine a root cause for the group.
- End users may be interested in having a better understanding of their data content by comparing these groups of correlated anomalies. For example, the end user could wish to identify which groups of correlated anomalies correspond to the following types of profiles:
- the present disclosure relates to systems and methods for classifying correlated anomalies through interpretable clustering.
- the present disclosure can be used in network monitoring to provide users, technicians, network operators and engineers, etc. further insight into network operations for purposes of remediating failures, performance issues, anomalies, etc.
- the objective is to provide domain expertise at the machine learning level.
- a model can process real time data from the network to automatically classify new incoming groups into clusters. Those clusters can be found and labeled through a primary unsupervised clustering step (such as K-means, agglomerative clustering, DBSCAN, etc.), at user demand. Clusters can be described through interpretable clustering (tree learning on cluster labels) (usage for description). Cluster of interest can be deployed (again, tree learning on cluster labels) (usage for automatic classification).
- a method includes steps of receiving network data describing operation of a network including a plurality of anomalies; clustering the network data to obtain clusters of groups of correlated anomalies; responsive to labeling the clusters of groups of correlated anomalies, utilizing the labels for the network data to train a model for automatic classification; and providing the model for automatic classification of additional network data.
- the labeling can be performed by a human expert that determines the label that includes a human comprehensive cluster name.
- the labeling can be performed automatically utilizing a decision tree that provides a cluster description for the label.
- the steps can further include determining the clusters of groups of correlated anomalies are not meaningful and repeating the receiving and clustering.
- the steps can further include utilizing the model to determine whether a category of new incoming groups of correlated anomalies.
- the clustering can include unsupervised machine learning on the network data and the utilizing includes supervised machine learning.
- the steps can further include evaluating an accuracy of the model; and selecting an appropriate level of accuracy.
- the network data can include at least one metric / dimension linked to said group of correlated anomalies, said metric/dimension being selected from: Group duration, Group impacted subscribers, Severity, User Flags, Number of anomalies contained in group, Root cause diagnosis, Presence of approximate periodicities, Nature of rules linked to anomalies, Nature of root cause diagnosis elements targeted, Nature of root cause diagnosis 3GPP cause and Geographic data linked to dimensions.
- the network can be a wireless network.
- the clustering can utilize any of K-means, agglomerative clustering, DBSCAN.
- a required number of clusters can be automatically determined using the elbow method.
- the steps can further include providing a user interface that allows a user to select a profile of the groups of correlated anomalies for data analysis.
- the steps can further include providing a label based on the profile.
- a server in another embodiment, includes at least one processor and memory comprising instructions that, when executed, cause the at least one processor to perform the steps of the foregoing method.
- a non-transitory computer-readable medium having instructions stored thereon for programming at least one processor to perform the steps of the foregoing method.
- the present disclosure relates to systems and methods for classifying correlated anomalies through interpretable clustering.
- the present disclosure can be used in network monitoring to provide users, technicians, network operators and engineers, etc. further insight into network operations for purposes of remediating failures, performance issues, anomalies, etc.
- the objective is to provide domain expertise at the machine learning level.
- a model can process real time data from the network to automatically classify new incoming groups into clusters. Those clusters can be found and labeled through a primary unsupervised clustering step (such as K-means, agglomerative clustering, DBSCAN, etc.), at user demand. Clusters can be described through interpretable clustering (tree learning on cluster labels) (usage for description). Cluster of interest can be deployed (again, tree learning on cluster labels) (usage for automatic classification).
- FIG. 1 is a block diagram of a monitoring system 10 for classifying correlated anomalies through interpretable clustering.
- the monitoring system 10 can be implemented on a server 12 (an embodiment of the server 12 is illustrated in FIG. 2 ), multiple servers 12, in the cloud, etc.
- the monitoring system 10 can be configured to obtain data 14, such as via a network 16, related to the operation of network elements 18.
- the data 14 may be obtained from, without limitation, a network management system (NMS), an element management system (EMS), an operations support system (OSS), a software-defined networking (SDN) controller, an SDN application, a database, one or more servers, etc.
- the network 16 may include the Internet, a wide area network (WAN), a local area network (LAN), a virtual LAN (VLAN), and the like as well as combinations.
- the data 14 can be in a database or the like and obtained from various network elements 18, which ultimately produce the data used by the monitoring system 10.
- the network elements 18 can include switches, routers, terminals, repeaters, aggregation devices, radio equipment, base stations (eNB, gNB), user equipment (UE) 22 (an embodiment of a UE 22 is illustrated in FIG. 3 ), etc. That is, the network elements or nodes may include any devices in a network responsible for some aspect of data processing, switching, and/or transmission.
- the data from the network elements 18 may include telemetry data, alarms, warnings, PM data, events, etc. This data can be real-time or near real-time (e.g., minutes old). In the networking example, PM data is usually provided real-time as well as in 15 minute and 24-hour increments. Further, alarms and warnings are provided immediately upon detection.
- GUI graphical user interface
- the user device 22 may be in a network operations center (NOC) or the like.
- the monitoring system 10 can provide a Web application to the user device 22 for interaction.
- the network 16 can be one or more layers including optical, Ethernet, multiprotocol label switching (MPLS), Internet protocol (IP), wireless, packet, etc.
- the network 16 and the network elements 18 can be a wireless network including a radio access network (RAN).
- RAN radio access network
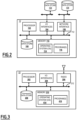
- FIG. 2 is a block diagram of a server 12, which may be used to implement the monitoring system 10.
- the server 12 may be a digital computer that, in terms of hardware architecture, generally includes a processor 102, input/output (I/O) interfaces 104, a network interface 106, a data store 108, and memory 110. It should be appreciated by those of ordinary skill in the art that FIG. 2 depicts the server 12 in an oversimplified manner, and a practical embodiment may include additional components and suitably configured processing logic to support known or conventional operating features that are not described in detail herein.
- the components (102, 104, 106, 308, and 110) are communicatively coupled via a local interface 112.
- the local interface 112 may be, for example, but not limited to, one or more buses or other wired or wireless connections, as is known in the art.
- the local interface 112 may have additional elements, which are omitted for simplicity, such as controllers, buffers (caches), drivers, repeaters, and receivers, among many others, to enable communications.
- the local interface 112 may include address, control, and/or data connections to enable appropriate communications among the aforementioned components.
- the processor 102 is a hardware device for executing software instructions.
- the processor 102 may be any custom made or commercially available processor, a central processing unit (CPU), an auxiliary processor among several processors associated with the server 12, a semiconductor-based microprocessor (in the form of a microchip or chipset), or generally any device for executing software instructions.
- the processor 102 is configured to execute software stored within the memory 110, to communicate data to and from the memory 110, and to generally control operations of the server 12 pursuant to the software instructions.
- the I/O interfaces 104 may be used to receive user input from and/or for providing system output to one or more devices or components.
- the network interface 106 may be used to enable the server 12 to communicate over the network 16, etc.
- the network interface 106 may include, for example, an Ethernet card or adapter or a wireless local area network (WLAN) card or adapter.
- the network interface 106 may include address, control, and/or data connections to enable appropriate communications on the network.
- a data store 108 may be used to store data.
- the data store 108 may include any of volatile memory elements (e.g., random access memory (RAM, such as DRAM, SRAM, SDRAM, and the like)), nonvolatile memory elements (e.g., ROM, hard drive, tape, CDROM, and the like), and combinations thereof.
- the data store 108 may incorporate electronic, magnetic, optical, and/or other types of storage media.
- the data store 108 may be located internal to the server 12, such as, for example, an internal hard drive connected to the local interface 112 in the server 12. Additionally, in another embodiment, the data store 108 may be located external to the server 12 such as, for example, an external hard drive connected to the I/O interfaces 104 (e.g., SCSI or USB connection). In a further embodiment, the data store 108 may be connected to the server 12 through a network, such as, for example, a network-attached file server.
- the memory 110 may include any of volatile memory elements (e.g., random access memory (RAM, such as DRAM, SRAM, SDRAM, etc.)), nonvolatile memory elements (e.g., ROM, hard drive, tape, CDROM, etc.), and combinations thereof. Moreover, the memory 110 may incorporate electronic, magnetic, optical, and/or other types of storage media. Note that the memory 110 may have a distributed architecture, where various components are situated remotely from one another, but can be accessed by the processor 102.
- the software in memory 110 may include one or more software programs, each of which includes an ordered listing of executable instructions for implementing logical functions.
- the software in the memory 110 includes a suitable operating system (O/S) 114 and one or more programs 116.
- O/S operating system
- the operating system 314 essentially controls the execution of other computer programs, such as the one or more programs 116, and provides scheduling, input-output control, file and data management, memory management, and communication control and related services.
- the one or more programs 116 may be configured to implement the various processes, algorithms, methods, techniques, etc. described herein, such as with respect to the monitoring system 10.
- FIG. 3 is a block diagram of a UE 22, which may connect to the monitoring system 10 as well as to operate in the network 16.
- the user device 22 can be a digital device that, in terms of hardware architecture, generally includes a processor 202, input/output (I/O) interfaces 204, a radio 206, a data store 208, and memory 210. It should be appreciated by those of ordinary skill in the art that FIG. 3 depicts the user device 22 in an oversimplified manner, and a practical embodiment may include additional components and suitably configured processing logic to support known or conventional operating features that are not described in detail herein.
- the components (202, 204, 206, 208, and 202) are communicatively coupled via a local interface 212.
- the local interface 212 can be, for example, but not limited to, one or more buses or other wired or wireless connections, as is known in the art.
- the local interface 212 can have additional elements, which are omitted for simplicity, such as controllers, buffers (caches), drivers, repeaters, and receivers, among many others, to enable communications.
- the local interface 212 may include address, control, and/or data connections to enable appropriate communications among the aforementioned components.
- the processor 202 is a hardware device for executing software instructions.
- the processor 202 can be any custom made or commercially available processor, a central processing unit (CPU), an auxiliary processor among several processors associated with the user device 22, a semiconductor-based microprocessor (in the form of a microchip or chipset), or generally any device for executing software instructions.
- the processor 202 is configured to execute software stored within the memory 210, to communicate data to and from the memory 210, and to generally control operations of the user device 22 pursuant to the software instructions.
- the processor 202 may include an optimized mobile processor such as optimized for power consumption and mobile applications.
- the radio 206 enables wireless communication to an external access device or network. Any number of suitable wireless data communication protocols, techniques, or methodologies can be supported by the radio 206.
- the data store 208 may be used to store data.
- the data store 208 may include any of volatile memory elements (e.g., random access memory (RAM, such as DRAM, SRAM, SDRAM, and the like)), nonvolatile memory elements (e.g., ROM, hard drive, tape, CDROM, and the like), and combinations thereof.
- RAM random access memory
- nonvolatile memory elements e.g., ROM, hard drive, tape, CDROM, and the like
- the data store 208 may incorporate electronic, magnetic, optical, and/or other types of storage media.
- the memory 210 may include any of volatile memory elements (e.g., random access memory (RAM, such as DRAM, SRAM, SDRAM, etc.)), nonvolatile memory elements (e.g., ROM, hard drive, etc.), and combinations thereof. Moreover, the memory 210 may incorporate electronic, magnetic, optical, and/or other types of storage media. Note that the memory 210 may have a distributed architecture, where various components are situated remotely from one another, but can be accessed by the processor 202.
- the software in memory 210 can include one or more software programs, each of which includes an ordered listing of executable instructions for implementing logical functions. In the example of FIG. 3 , the software in the memory 210 includes a suitable operating system (O/S) 214 and programs 216.
- O/S operating system
- the operating system 214 essentially controls the execution of other computer programs and provides scheduling, input-output control, file and data management, memory management, and communication control and related services.
- the programs 2416 may include various applications, add-ons, etc. configured to provide end-user functionality with the user device 22.
- example programs 216 may include a web browser to connect with the server 12 for displaying a GUI related to the monitoring system 10, a dedicated application for displaying a GUI related to the monitoring system 10, and the like.
- the network 16 can provide real-time data to the monitoring system 10 as well as have historical data (the real-time data and the historical data can be the same type).
- This data may include telemetry data, alarms, warnings, Performance Monitoring (PM) data, event information, transaction information, metrics, Key Performance Indicators (KPIs), Call Detail Records (CDR), etc.
- the real-time data reflects the current state of the network 16.
- the network 16 can include 5G (as well as other components).
- 5G as well as other components.
- Hybrid, virtual and cloud networks are becoming more difficult to operate effectively. Operations teams are being squeezed between increasing complexity-due to new technologies and massive scaling-shrinking budgets and the pressure to continually improve customer quality of experience (QoE) to minimize churn.
- QoE quality of experience
- Traditional tools for monitoring service assurance and network quality lack the required scalability and flexibility-and cost too much.
- a new paradigm is needed-one that embraces the open, dynamic, distributed nature of virtual and cloud networks, leverages machine learning (ML) and artificial intelligence (Al) to bring greater insight and speed to customer management and telecom network management-and does it all at a lower cost.
- ML machine learning
- Al artificial intelligence
- the monitoring system 10 is configured in such a manner to automatically provide the right data at the right time to detect, diagnose and resolve -or predict and prevent-customer-impacting events originating from communications network infrastructure and services.
- the monitoring system 10 uses adaptive automation to automate time-consuming manual monitoring, diagnosis and decision-making processes that monopolize operations. This frees resources to proactively improve network performance and customer experience, and to deploy new services and revenue faster.
- the monitoring system 10 dynamically collects and analyzes the right mix of system, monitoring and telemetry data to perform real-time network monitoring and inform effective action.
- the monitoring system 10 delivers a diverse set of benefits across the entire service provider organization. Its unique ability to build customized workflows among state-of-the-art tools such as active and passive monitoring, real-time anomaly detection, topology modeling and correlation as well as Al-based analytics, make it an extremely powerful and flexible platform for everyone.
- Anomaly refers to anything in the network 16 that contributes to poor service, lack of service, poor QoE, and the like.
- An anomaly can be a fault, an alarm, service degradation, incorrect settings, and the like.
- the objective of the monitoring system 10 and the various processes described herein is to detect and diagnose, such that the anomalies as quick as possible as well as proactively.
- Correlated anomalies are a plurality of anomalies that have something in common, such as cause to effect link through anomaly types, or mathematical correlated signal, meaning that remediation can address all of the plurality of anomalies.
- Clustering includes dividing groups of correlated anomalies based on their vectorial similarity. It can also be used to extract potentially useful and previously unknown knowledge from data. Cluster, category, or profile of groups of correlated anomalies is the same thing; this is the purpose of the classification.
- a group contains several anomalies bound together through cause to effect relationships and/or signal mathematical correlation, i.e., correlated anomalies.
- the group is made of correlated anomalies and all related data, and it can also contain its own data, e.g., an auto-diagnosis result, root cause of the contained correlated anomalies, etc.
- Categories or clusters are the classification of groups of correlated anomalies. Labels are the naming of the categories or clusters.
- the present disclosure utilizes the term Interpretable clustering because we chain a clustering with a supervised decision tree on the cluster label.
- a Decision tree can be used to help cluster description (this is what is typically referred to as interpretable clustering). But the decision tree that is chosen for deployment (because it has a sense to the domain expert) will be above all be used to enable automatic classification for future group.
- a network user expert is required at intermediate level to validate the cluster shapes and assert that this type of classification is useful and can be sent to supervised training to generate a model used for automatic on the fly classification.
- Clustering is the unsupervised classification of patterns, observations, data items, or feature vectors, into groups. Unsupervised learning is of particular importance in network monitoring as it reduces the requirement of domain expertise. Further, it is important as the complexity of the network 16 continues to expand. Thus, there is no labeling of historical data from the network 16. The goal is to place groups of correlated anomalies into clusters based only on their observable features, such that each cluster contains groups of correlated anomalies with similar properties and different clusters have distinct features. Interpretable clustering extends the approach to interpret the resulting clusters and characterize their distinctive features in a compact form. The present disclosure contemplates the use of various interpretable clustering techniques for evaluating network data.
- the clustering can be unsupervised and the output can be a partitioned data set that is used for training a machine learning model, i.e., the cluster identifiers can be used for labels in the training. Specifically, this includes a post-processing step to determine the cluster meaning.
- tree-based supervised learning can be used.
- the present disclosure includes a process with input network data including groups of correlated anomalies and output being categories or clusters (labels) of the groups of correlated anomalies.
- the output can then be used to train a machine learning model using supervised learning.
- the present disclosure can include the process with various phases such as:
- Phases 1 to 3 are tunning steps done to create the classification model (launched by expert).
- Phase 4 is the deployed module usage (automatic run).
- An advantage of the present disclosure is the using the clustering in phase 1, an expert (or even a non-expert user) does not really know what kind of categories will appear as clusters, but this ensures to find low number of categories with vectorial optimized distances for a minimal configuration. This is exploratory that can reveal useful categories with minimal effort.
- FIG. 4 is a schema diagram that illustrates the definitions of anomalies, groups of correlated anomalies, clusters, and labels.
- the input from the network 16 is the group of correlated anomalies and the output is the clusters, i.e., clusters of groups of correlated anomalies.
- Interpretable clustering helps to describe cluster (automatic fills label or help expert to put its own labels).
- FIG. 5 is a diagram of use of a model generated from the clusters and labels in production.
- a model is generated.
- the model is trained using groups of correlated data as a learning/training set and learns from associated clusters (categories / label).
- FIG. 5 illustrates the ultimate purpose which is to apply this type of labelling to new groups, i.e., production data (step called automatic classification).
- FIG. 6 is a flowchart of a process 300 for classifying correlated groups of anomalies through interpretable clustering.
- the process 300 can be implemented as a method having steps, a system including at least one processor and memory with instructions that, when executed, cause the at least one processor to implement the steps, and a non-transitory computer-readable medium having instructions stored thereon for programming at least one processor to perform the steps.
- the process 300 includes receiving network data describing operation of a network including a plurality of anomalies (step 302); clustering the network data to obtain clusters of groups of correlated anomalies (step 304); responsive to labeling the clusters of groups of correlated anomalies, utilizing the labels for the network data to train a model for automatic classification (step 306); and providing the model for automatic classification of additional network data (step 308).
- the labeling can be performed by a human expert that determines the label, i.e., naming clusters in a human comprehensive way.
- the labeling can be performed automatically utilizing a decision tree that provides a cluster description for the label (this is often referred to as interpretable clustering).
- the process 300 can further include determining the resulting clusters of groups of correlated anomalies are not meaningful and repeating the receiving and clustering steps 302, 304.
- the clustering includes unsupervised machine learning on the network data and the utilizing includes supervised machine learning.
- the model can be used to determine the category of new incoming groups of correlated anomalies.
- the model is created utilizing supervised learning.
- the result is used to label data.
- the interpretable clustering includes clustering and tree learning.
- the process 300 can include evaluating an accuracy of the model and selecting an appropriate level of accuracy.
- a fully autonomous approach is possible if the evaluation steps are strong enough. User intervention may be allowed to trigger transformation of a clustering result into a model reference, for a better control and profile labeling possibilities.
- the process 300 can automatically find the appropriate subset of data into groups that will lead to the most accurate classification.
- the process 300 can automatically evaluate the model accuracy, and rerun learning or deploy the model based thereon.
- the classification is data- and configuration- dependent (no prerequisites).
- the models are trained and updated to be used on real time incoming data.
- the real time classification requires a fast and robust system (parallelized massive input).
- the nature and number of metrics / dimensions linked to a group of correlated anomalies in the anomaly detection system can be large.
- the anomaly detection system produces valuable data linked to groups, such as, for example:
- the process 300 uses unsupervised learning (such as clustering) which helps to reveal categories of groups (clusters). The process 300 determines if some groups show vectorial similarities through their related data, and assigns them to the same cluster.
- the process 300 can use a multi-k-mean in order to do several passes and find the best centers for a cluster. There are no prerequisites about the optimal number of categories the user may prefer and therefore, the user may prefer to let the clustering step find the optimal number of categories. For this, the process 300 can chain several multi-k-mean with k variation from 1 to 10, then uses a method called 'elbow method' to find the optimized number k.
- a user can require an audit from a specific audit page of the UI, and choose the metrics he would like to add as input for the clustering. He may also choose dimensions, such as 'rule type' or 'diagnosis type' as cluster inputs, knowing that these dimensions will be used as binary metrics for each corresponding value. The corresponding metrics will be retrieved from saved data groups and sent into the clustering algorithm passes in order to find the best accuracy and best number of clusters using the elbow method.
- Descriptive statistics are computed on different groups and results are displayed to the user in the audit page of the UI.
- the user can label, i.e., give a human comprehensive naming, each cluster and make the choice to deploy them for real time automatic labelling (classification).
- the system can create a model through supervised learning, (such as RandomForest algorithm), using initial cluster input metrics as the learning set.
- the cluster ID can be used as a label to learn.
- This step will automatically find the most accurate decision tree over the metrics.
- the tree contains the complex relationships that link input metrics to cluster labels together and will allow predictions on further new unique sets of metrics as inputs.
- This step uses auto-sampling techniques, automatic accuracy evaluation and cross validation on the learning set, so that the user will have minimal parameters to fill in. If the accuracy is bad, the user will be informed (a bad model should not be deployed). This time, tree learning will be used to create a model ready to deploy for automatic classification (predictions), whereas tree learning described above was used to help describe cluster.
- model evaluation If the generated model evaluation is good enough, then the model will be saved in database, and deployed to be used in real time. Each new incoming group after correlation and auto-diagnosis step will provide appropriate initial cluster input metrics into the model. This model will output the predicted label linked to the predicted cluster ID. This classification information will be stored into the group information as soon as it is written in database, so that the user will see the new group appear with the predicted label.
- the user can at any time generate new clusters via the audit page, and can replace the in-place model by a new one without any loss of real time classification information.
- processors such as microprocessors; Central Processing Units (CPUs); Digital Signal Processors (DSPs): customized processors such as Network Processors (NPs) or Network Processing Units (NPUs), Graphics Processing Units (GPUs), or the like; Field-Programmable Gate Arrays (FPGAs); and the like along with unique stored program instructions (including both software and firmware) for control thereof to implement, in conjunction with certain non-processor circuits, some, most, or all of the functions of the methods and/or systems described herein.
- processors such as microprocessors; Central Processing Units (CPUs); Digital Signal Processors (DSPs): customized processors such as Network Processors (NPs) or Network Processing Units (NPUs), Graphics Processing Units (GPUs), or the like; Field-Programmable Gate Arrays (FPGAs); and the like along with unique stored program instructions (including both software and firmware) for control thereof to implement, in conjunction with certain non-processor circuits, some, most, or all
- circuitry configured to
- logic configured to
- some embodiments may include a non-transitory computer-readable medium having instructions stored thereon for programming a computer, server, appliance, device, at least one processor, circuit/circuitry, etc. to perform functions as described and claimed herein.
- Examples of such non-transitory computer-readable medium include, but are not limited to, a hard disk, an optical storage device, a magnetic storage device, a Read-Only Memory (ROM), a Programmable ROM (PROM), an Erasable PROM (EPROM), an Electrically EPROM (EEPROM), Flash memory, and the like.
- software can include instructions executable by one or more processors (e.g., any type of programmable circuitry or logic) that, in response to such execution, cause the one or more processors to perform a set of operations, steps, methods, processes, algorithms, functions, techniques, etc. as described herein for the various embodiments.
- processors e.g., any type of programmable circuitry or logic
Landscapes
- Engineering & Computer Science (AREA)
- Computer Networks & Wireless Communication (AREA)
- Signal Processing (AREA)
- Software Systems (AREA)
- Theoretical Computer Science (AREA)
- Data Mining & Analysis (AREA)
- Artificial Intelligence (AREA)
- Evolutionary Computation (AREA)
- Computer Vision & Pattern Recognition (AREA)
- Medical Informatics (AREA)
- Physics & Mathematics (AREA)
- Computing Systems (AREA)
- General Engineering & Computer Science (AREA)
- General Physics & Mathematics (AREA)
- Mathematical Physics (AREA)
- Databases & Information Systems (AREA)
- Computational Linguistics (AREA)
- Information Retrieval, Db Structures And Fs Structures Therefor (AREA)
Applications Claiming Priority (2)
| Application Number | Priority Date | Filing Date | Title |
|---|---|---|---|
| US202163289425P | 2021-12-14 | 2021-12-14 | |
| US202263330863P | 2022-04-14 | 2022-04-14 |
Publications (1)
| Publication Number | Publication Date |
|---|---|
| EP4199449A1 true EP4199449A1 (fr) | 2023-06-21 |
Family
ID=84519427
Family Applications (1)
| Application Number | Title | Priority Date | Filing Date |
|---|---|---|---|
| EP22213017.1A Pending EP4199449A1 (fr) | 2021-12-14 | 2022-12-13 | Classification automatique d'anomalies corrélées à partir d'un réseau par regroupement interprétable |
Country Status (2)
| Country | Link |
|---|---|
| US (1) | US12452151B2 (fr) |
| EP (1) | EP4199449A1 (fr) |
Cited By (2)
| Publication number | Priority date | Publication date | Assignee | Title |
|---|---|---|---|---|
| WO2025074444A1 (fr) * | 2023-10-07 | 2025-04-10 | Jio Platforms Limited | Procédé et système de surveillance d'un réseau |
| EP4614916A1 (fr) * | 2024-02-27 | 2025-09-10 | EXFO Solutions SAS | Surveillance automatisée d'anomalies pendant le fonctionnement d'un réseau à l'aide d'un marquage de groupes d'anomalies corrélées |
Families Citing this family (1)
| Publication number | Priority date | Publication date | Assignee | Title |
|---|---|---|---|---|
| CN117633665B (zh) * | 2024-01-26 | 2024-05-28 | 深圳市互盟科技股份有限公司 | 一种网络数据监控方法及系统 |
Citations (1)
| Publication number | Priority date | Publication date | Assignee | Title |
|---|---|---|---|---|
| US20200226490A1 (en) * | 2019-01-15 | 2020-07-16 | Ebay Inc. | Machine learning-based infrastructure anomaly and incident detection using multi-dimensional machine metrics |
Family Cites Families (19)
| Publication number | Priority date | Publication date | Assignee | Title |
|---|---|---|---|---|
| US9372898B2 (en) * | 2014-07-17 | 2016-06-21 | Google Inc. | Enabling event prediction as an on-device service for mobile interaction |
| WO2017011708A1 (fr) | 2015-07-14 | 2017-01-19 | Sios Technology Corporation | Appareil et procédé d'exploitation des principes de l'apprentissage automatique pour l'analyse et la suppression de causes profondes dans des environnements informatiques |
| US9699205B2 (en) * | 2015-08-31 | 2017-07-04 | Splunk Inc. | Network security system |
| US10210038B2 (en) | 2015-10-08 | 2019-02-19 | Lightbend, Inc. | Tuning context-aware rule engine for anomaly detection |
| US10270788B2 (en) | 2016-06-06 | 2019-04-23 | Netskope, Inc. | Machine learning based anomaly detection |
| US20180129970A1 (en) | 2016-11-10 | 2018-05-10 | Justin E. Gottschlich | Forward-looking machine learning for decision systems |
| WO2019060327A1 (fr) | 2017-09-20 | 2019-03-28 | University Of Utah Research Foundation | Détection en ligne d'anomalies dans un journal à l'aide d'un apprentissage automatique |
| US10887781B2 (en) | 2018-01-26 | 2021-01-05 | Cisco Technology, Inc. | Machine learning-based approach to network planning using observed patterns |
| US12045316B2 (en) * | 2018-03-09 | 2024-07-23 | Ciena Corporation | Automatic labeling of telecommunication network data to train supervised machine learning |
| US20210027182A1 (en) | 2018-03-21 | 2021-01-28 | Visa International Service Association | Automated machine learning systems and methods |
| US20200053108A1 (en) | 2018-08-07 | 2020-02-13 | Apple Inc. | Utilizing machine intelligence to identify anomalies |
| US11423249B2 (en) | 2018-12-03 | 2022-08-23 | Bank Of America Corporation | Computer architecture for identifying data clusters using unsupervised machine learning in a correlithm object processing system |
| US12008744B2 (en) | 2018-12-10 | 2024-06-11 | Climate Llc | Mapping field anomalies using digital images and machine learning models |
| US20200285997A1 (en) | 2019-03-04 | 2020-09-10 | Iocurrents, Inc. | Near real-time detection and classification of machine anomalies using machine learning and artificial intelligence |
| US11496353B2 (en) | 2019-05-30 | 2022-11-08 | Samsung Electronics Co., Ltd. | Root cause analysis and automation using machine learning |
| US11416504B2 (en) | 2020-02-12 | 2022-08-16 | EXFO Solutions SAS | Detection, characterization, and prediction of real-time events occurring approximately periodically |
| US11522766B2 (en) | 2020-02-12 | 2022-12-06 | EXFO Solutions SAS | Method and system for determining root-cause diagnosis of events occurring during the operation of a communication network |
| US11716240B2 (en) * | 2021-09-21 | 2023-08-01 | Rakuten Mobile, Inc. | Method, device and computer program product for anomaly detection |
| US12101343B2 (en) | 2022-03-25 | 2024-09-24 | Anodot Ltd. | Event-based machine learning for a time-series metric |
-
2022
- 2022-12-07 US US18/076,502 patent/US12452151B2/en active Active
- 2022-12-13 EP EP22213017.1A patent/EP4199449A1/fr active Pending
Patent Citations (1)
| Publication number | Priority date | Publication date | Assignee | Title |
|---|---|---|---|---|
| US20200226490A1 (en) * | 2019-01-15 | 2020-07-16 | Ebay Inc. | Machine learning-based infrastructure anomaly and incident detection using multi-dimensional machine metrics |
Non-Patent Citations (1)
| Title |
|---|
| MOULAY MOHAMED ET AL: "A Novel Methodology for the Automated Detection and Classification of Networking Anomalies", IEEE INFOCOM 2020 - IEEE CONFERENCE ON COMPUTER COMMUNICATIONS WORKSHOPS (INFOCOM WKSHPS), IEEE, 6 July 2020 (2020-07-06), pages 780 - 786, XP033808532, DOI: 10.1109/INFOCOMWKSHPS50562.2020.9162710 * |
Cited By (2)
| Publication number | Priority date | Publication date | Assignee | Title |
|---|---|---|---|---|
| WO2025074444A1 (fr) * | 2023-10-07 | 2025-04-10 | Jio Platforms Limited | Procédé et système de surveillance d'un réseau |
| EP4614916A1 (fr) * | 2024-02-27 | 2025-09-10 | EXFO Solutions SAS | Surveillance automatisée d'anomalies pendant le fonctionnement d'un réseau à l'aide d'un marquage de groupes d'anomalies corrélées |
Also Published As
| Publication number | Publication date |
|---|---|
| US20230188440A1 (en) | 2023-06-15 |
| US12452151B2 (en) | 2025-10-21 |
Similar Documents
| Publication | Publication Date | Title |
|---|---|---|
| US12452151B2 (en) | Automatic classification of correlated anomalies from a network through interpretable clustering | |
| US12069082B2 (en) | Interpreting and remediating network risk using machine learning | |
| US10355938B2 (en) | Wi-Fi access point performance management | |
| US11886280B2 (en) | Return and replacement protocol (RRP) | |
| US11522766B2 (en) | Method and system for determining root-cause diagnosis of events occurring during the operation of a communication network | |
| US11586972B2 (en) | Tool-specific alerting rules based on abnormal and normal patterns obtained from history logs | |
| CN104160659B (zh) | 用于通信网络的管理和操作的方法和装置 | |
| US20210117977A1 (en) | Parallel machine learning models | |
| US20220086071A1 (en) | A network device classification apparatus and process | |
| US9628340B2 (en) | Proactive operations, administration, and maintenance systems and methods in networks using data analytics | |
| US11348023B2 (en) | Identifying locations and causes of network faults | |
| CN114064196A (zh) | 用于预测性保障的系统和方法 | |
| JP2019521427A (ja) | 人工知能に基づくネットワークアドバイザー | |
| EP3222004B1 (fr) | Test de diagnostic dans des réseaux | |
| US11438226B2 (en) | Identification of network device configuration changes | |
| US20210359899A1 (en) | Managing Event Data in a Network | |
| Mdini et al. | Introducing an unsupervised automated solution for root cause diagnosis in mobile networks | |
| US20250272187A1 (en) | Automatized monitoring of anomalies during operation of a network using tagging of groups of correlated anomalies | |
| US20260005956A1 (en) | Automatic clustering-based communication network management | |
| US20260006356A1 (en) | Enhancing real-time multi-layer assurance on packet over optical networks with AI large language models and cognitive search | |
| Cordova-Garcia | Sparse control and data plane telemetry features for bgp anomaly detection | |
| US20260052060A1 (en) | Advance network health observability | |
| US20240378455A1 (en) | Debugging in federated learning systems | |
| EP3829110B1 (fr) | Gestion automatique d'un réseau pour maximiser la qualité d'expérience | |
| CN118175564A (zh) | 一种基于时序聚类模型的移动网络状态评估方法 |
Legal Events
| Date | Code | Title | Description |
|---|---|---|---|
| PUAI | Public reference made under article 153(3) epc to a published international application that has entered the european phase |
Free format text: ORIGINAL CODE: 0009012 |
|
| STAA | Information on the status of an ep patent application or granted ep patent |
Free format text: STATUS: THE APPLICATION HAS BEEN PUBLISHED |
|
| AK | Designated contracting states |
Kind code of ref document: A1 Designated state(s): AL AT BE BG CH CY CZ DE DK EE ES FI FR GB GR HR HU IE IS IT LI LT LU LV MC ME MK MT NL NO PL PT RO RS SE SI SK SM TR |
|
| STAA | Information on the status of an ep patent application or granted ep patent |
Free format text: STATUS: REQUEST FOR EXAMINATION WAS MADE |
|
| 17P | Request for examination filed |
Effective date: 20231123 |
|
| RBV | Designated contracting states (corrected) |
Designated state(s): AL AT BE BG CH CY CZ DE DK EE ES FI FR GB GR HR HU IE IS IT LI LT LU LV MC ME MK MT NL NO PL PT RO RS SE SI SK SM TR |
|
| STAA | Information on the status of an ep patent application or granted ep patent |
Free format text: STATUS: EXAMINATION IS IN PROGRESS |
|
| 17Q | First examination report despatched |
Effective date: 20241010 |