EP4286846A1 - Procédé précis de génération d'un diagramme de phase d'un polymère - Google Patents
Procédé précis de génération d'un diagramme de phase d'un polymère Download PDFInfo
- Publication number
- EP4286846A1 EP4286846A1 EP22177321.1A EP22177321A EP4286846A1 EP 4286846 A1 EP4286846 A1 EP 4286846A1 EP 22177321 A EP22177321 A EP 22177321A EP 4286846 A1 EP4286846 A1 EP 4286846A1
- Authority
- EP
- European Patent Office
- Prior art keywords
- polymer
- con
- phase
- tot
- condensed
- Prior art date
- Legal status (The legal status is an assumption and is not a legal conclusion. Google has not performed a legal analysis and makes no representation as to the accuracy of the status listed.)
- Withdrawn
Links
Images










Classifications
-
- G—PHYSICS
- G01—MEASURING; TESTING
- G01N—INVESTIGATING OR ANALYSING MATERIALS BY DETERMINING THEIR CHEMICAL OR PHYSICAL PROPERTIES
- G01N33/00—Investigating or analysing materials by specific methods not covered by groups G01N1/00 - G01N31/00
- G01N33/48—Biological material, e.g. blood, urine; Haemocytometers
- G01N33/50—Chemical analysis of biological material, e.g. blood, urine; Testing involving biospecific ligand binding methods; Immunological testing
- G01N33/5005—Chemical analysis of biological material, e.g. blood, urine; Testing involving biospecific ligand binding methods; Immunological testing involving human or animal cells
- G01N33/5008—Chemical analysis of biological material, e.g. blood, urine; Testing involving biospecific ligand binding methods; Immunological testing involving human or animal cells for testing or evaluating the effect of chemical or biological compounds, e.g. drugs, cosmetics
- G01N33/502—Chemical analysis of biological material, e.g. blood, urine; Testing involving biospecific ligand binding methods; Immunological testing involving human or animal cells for testing or evaluating the effect of chemical or biological compounds, e.g. drugs, cosmetics for testing non-proliferative effects
-
- G—PHYSICS
- G01—MEASURING; TESTING
- G01N—INVESTIGATING OR ANALYSING MATERIALS BY DETERMINING THEIR CHEMICAL OR PHYSICAL PROPERTIES
- G01N33/00—Investigating or analysing materials by specific methods not covered by groups G01N1/00 - G01N31/00
- G01N33/48—Biological material, e.g. blood, urine; Haemocytometers
- G01N33/50—Chemical analysis of biological material, e.g. blood, urine; Testing involving biospecific ligand binding methods; Immunological testing
- G01N33/68—Chemical analysis of biological material, e.g. blood, urine; Testing involving biospecific ligand binding methods; Immunological testing involving proteins, peptides or amino acids
- G01N33/6803—General methods of protein analysis not limited to specific proteins or families of proteins
- G01N33/6842—Proteomic analysis of subsets of protein mixtures with reduced complexity, e.g. membrane proteins, phosphoproteins, organelle proteins
-
- G—PHYSICS
- G01—MEASURING; TESTING
- G01N—INVESTIGATING OR ANALYSING MATERIALS BY DETERMINING THEIR CHEMICAL OR PHYSICAL PROPERTIES
- G01N33/00—Investigating or analysing materials by specific methods not covered by groups G01N1/00 - G01N31/00
- G01N33/48—Biological material, e.g. blood, urine; Haemocytometers
- G01N33/50—Chemical analysis of biological material, e.g. blood, urine; Testing involving biospecific ligand binding methods; Immunological testing
- G01N33/53—Immunoassay; Biospecific binding assay; Materials therefor
- G01N33/569—Immunoassay; Biospecific binding assay; Materials therefor for microorganisms, e.g. protozoa, bacteria, viruses
- G01N33/56966—Animal cells
-
- G—PHYSICS
- G01—MEASURING; TESTING
- G01N—INVESTIGATING OR ANALYSING MATERIALS BY DETERMINING THEIR CHEMICAL OR PHYSICAL PROPERTIES
- G01N33/00—Investigating or analysing materials by specific methods not covered by groups G01N1/00 - G01N31/00
- G01N33/48—Biological material, e.g. blood, urine; Haemocytometers
- G01N33/50—Chemical analysis of biological material, e.g. blood, urine; Testing involving biospecific ligand binding methods; Immunological testing
- G01N33/53—Immunoassay; Biospecific binding assay; Materials therefor
- G01N33/569—Immunoassay; Biospecific binding assay; Materials therefor for microorganisms, e.g. protozoa, bacteria, viruses
- G01N33/56983—Viruses
-
- G—PHYSICS
- G01—MEASURING; TESTING
- G01N—INVESTIGATING OR ANALYSING MATERIALS BY DETERMINING THEIR CHEMICAL OR PHYSICAL PROPERTIES
- G01N33/00—Investigating or analysing materials by specific methods not covered by groups G01N1/00 - G01N31/00
- G01N33/48—Biological material, e.g. blood, urine; Haemocytometers
- G01N33/50—Chemical analysis of biological material, e.g. blood, urine; Testing involving biospecific ligand binding methods; Immunological testing
- G01N33/58—Chemical analysis of biological material, e.g. blood, urine; Testing involving biospecific ligand binding methods; Immunological testing involving labelled substances
- G01N33/582—Chemical analysis of biological material, e.g. blood, urine; Testing involving biospecific ligand binding methods; Immunological testing involving labelled substances with fluorescent label
-
- G—PHYSICS
- G01—MEASURING; TESTING
- G01N—INVESTIGATING OR ANALYSING MATERIALS BY DETERMINING THEIR CHEMICAL OR PHYSICAL PROPERTIES
- G01N2333/00—Assays involving biological materials from specific organisms or of a specific nature
- G01N2333/005—Assays involving biological materials from specific organisms or of a specific nature from viruses
- G01N2333/01—DNA viruses
-
- G—PHYSICS
- G01—MEASURING; TESTING
- G01N—INVESTIGATING OR ANALYSING MATERIALS BY DETERMINING THEIR CHEMICAL OR PHYSICAL PROPERTIES
- G01N2333/00—Assays involving biological materials from specific organisms or of a specific nature
- G01N2333/435—Assays involving biological materials from specific organisms or of a specific nature from animals; from humans
- G01N2333/43504—Assays involving biological materials from specific organisms or of a specific nature from animals; from humans from invertebrates
- G01N2333/43526—Assays involving biological materials from specific organisms or of a specific nature from animals; from humans from invertebrates from worms
- G01N2333/4353—Assays involving biological materials from specific organisms or of a specific nature from animals; from humans from invertebrates from worms from nematodes
- G01N2333/43534—Assays involving biological materials from specific organisms or of a specific nature from animals; from humans from invertebrates from worms from nematodes from Caenorhabditis
-
- G—PHYSICS
- G01—MEASURING; TESTING
- G01N—INVESTIGATING OR ANALYSING MATERIALS BY DETERMINING THEIR CHEMICAL OR PHYSICAL PROPERTIES
- G01N2458/00—Labels used in chemical analysis of biological material
- G01N2458/15—Non-radioactive isotope labels, e.g. for detection by mass spectrometry
Definitions
- the present invention refers to a method for generating a binodal curve of a polymer in a system by determining accurate concentration values for both the dilute and condensed phases of a polymer, in particular, protein or polynucleic acid, under different conditions, such as at different temperatures, pH, salt concentrations, pressure, crowding agents, buffer compositions.
- the method can be applied to in vitro and in vivo systems alike.
- the present invention refers to an assay method for identifying bioactive compound(s), comprising the inventive method for generating a binodal curve of a polymer in a system.
- phase separation has become a widely studied phenomenon in biology with implications in cell metabolism and disease.
- An accurate study of phase separating proteins relies on the precise determination of the binodal curves.
- the binodal curves in these phase diagrams give information on the protein concentration required for condensate formation and the respective concentration inside the condensate at defined external conditions (temperature, salt, pH, pressure, buffer composition, crowding agent).
- Protein condensates are present in a wide variety of cells where they perform fundamental functions in development (e. g. P granules in C. elegans ) , ageing (e.g. stress granules) and in diverse cellular processes (e.g. transcription). They are known to form through a thermodynamic process, referred to as phase separation, that results from favourable interactions between proteins and between proteins and polynucleic acids. The strength and nature of these intermolecular interactions are governed by the protein sequence and secondary structure, and by the cellular environment. Changes in sequence and environment can therefore dictate the protein concentrations necessary to achieve phase separation and the resulting material properties of the condensates. Temperature, salt concentration and pH are important external control parameters of thermodynamic phase separation.
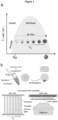
- phase diagrams maps the control parameter(s) (temperature, salt concentrations, etc.) with the dilute and the condensed phases of a system via a binodal curve.
- phase diagrams for a wide variety of proteins as a consequence of sample constrains and technical requirements.
- dilute phase protein concentrations, or saturation concentrations have been reported in numerous studies; the condensed phase concentration is more complicated to be measured and usually requires large amounts of protein ( Brady, J. P. et al. Structural and hydrodynamic properties of an intrinsically disordered region of a germ cell-specific protein on phase separation. PNAS, 2017, 114, E8194-E8203 ; McCall, P. M. et al. Quantitative phase microscopy enables precise and efficient determination of biomolecular condensate composition. 2020.10.25.352823 ; Bracha, D. et al. Mapping Local and Global Liquid Phase Behavior in Living Cells Using Photo-Oligomerizable Seeds. Cell, 2018, 175, p.1467-1480 .).
- the present invention can be applied to in vitro and in vivo systems alike.
- the present invention refers to an assay method for identify bioactive compound(s), comprising the inventive method for generating a binodal curve of a polymer in a system.
- a simple and accurate method for producing binodal curves for phase diagrams is provided by determining both dilute and condensed phase concentrations of polymer mixtures.
- the method of the present invention overcomes the above-mentioned difficulties. It builds upon an accurate determination of the condensed phase volume fraction in an environment of known volume and a titration of polymer concentration. It allows determining accurate phase diagrams in a rapid manner.
- the present invention refers to a method for determining a concentration (c con ) of a polymer in a condensed phase and a concentration (c dil ) of the polymer in a dilute phase in a system comprising:
- the polymer is a protein, or a polynucleic acid, preferably RNA, DNA, or a mixture of a protein and RNA, or a mixture of a protein and DNA.
- the inventors have derived a linear relationship between the volume fraction (V con / V tot ) of the condensed phase in a closed system and the total concentration of the polymer. Therefore, in a closed system, in a demixed state having two coexisting phases, a dilute and a condensed phase, the concentration of a polymer in both phases can be determined accurately from the volume fraction (V con / V tot ) of the polymer in the condensed phase at different total polymer concentrations c tot .
- the condensed phase concentration is usually complicated to be measured and requires large amounts of protein when being directly measured (see Brady, J. P. et al.
- the present invention refers to a method for simultaneously determining a concentration (c con ) of a polymer in a condensed phase and a concentration (c dil ) of the polymer in a dilute phase in a system comprising:
- the present invention refers to a method for determining a concentration (c con ) of a polymer in a condensed phase and a concentration (c dil ) of the polymer in a dilute phase in a system comprising:
- Determining the polymer concentration in both phases in a single experiment also allows accurate binodal curve determination and thus phase diagram construction in a rapid manner.
- Conventional methods for binodal curve generation of a polymer are based on the determination of the concentration of the polymer in a dilute phase only and allow therefore only the determination of one side of the coexistence curve (binodal) in a single experiment.
- binodal coexistence curve
- the present invention refers to a method for determining a concentration (c con ) of a polymer in a condensed phase and a concentration (c dil ) of the polymer in a dilute phase in a system for generating a binodal curve comprising:
- the present invention refers to a method for generating a binodal curve of a polymer in a system comprising:
- the at least one condition of said system is selected from a concentration of a component in the system wherein the component is selected from a salt, a crowding agent, or a buffer; the pH value; the pressure; or the temperature of the system, or a combination of the aforementioned conditions.
- the system is an in vitro system and selected from a solution, an emulsion, or cells.
- the phase separation of the polymer in said system is triggered by changing: the concentration of a component in the system selected from a salt, a crowding agent, or a buffer; the pH value; the pressure; or the temperature of the system.
- the salt is selected from potassium chloride, sodium chloride, magnesium chloride, or any other solute.
- step A) when the polymer is not labelled with a fluorophore or a fluorescent protein, in step A) the total volume (V tot ) of said system and the total concentration (c tot ) of the polymer are determined by means of bright-field, dark-field, phase-contrast, holographic, polarization, or differential interference correlation (DIC) microscopy, or light-scattering based approaches.
- V tot total volume of said system and the total concentration (c tot ) of the polymer are determined by means of bright-field, dark-field, phase-contrast, holographic, polarization, or differential interference correlation (DIC) microscopy, or light-scattering based approaches.
- DIC differential interference correlation
- the total volume (V tot ) of said system and the total concentration (c tot ) of the polymer are determined by means of fluorescence microscopy.
- step C) of the method of the present invention comprises:
- the emulsion system can be a water-in-oil emulsion system, an oil-in-water emulsion system or an oil-in-oil emulsion system.
- the emulsion system is a water-in-oil emulsion system.
- step C) comprises:
- step C1a) when the polymer is not labelled with a fluorophore or a fluorescent protein, further comprising before step C1a): C1a') adding fluorescent polymer beads and/or a fluorescent protein and/or a fluorescent dye partitioning into one of the phases of the system to label the condensed phase of the polymer.
- a volume (V em ) of the emulsion system, and a condensed volume (V con ') of the condensed phase of the polymer in said emulsion system are determined by means of fluorescence microscopy.
- the above-described method further comprises after the step C2a): C2b) adjusting the measured fluorescent image with a predetermined partition factor.
- step B) further comprising after the step B): B') centrifuging the system.
- At least one condition of said system is selected from a concentration of a component in the system wherein the component is selected from a salt, a crowding agent, or a buffer; the pH value; the pressure; or the temperature of the system, or a combination of the aforementioned conditions.
- the present invention refers to an assay method for identifying bioactive compound(s), comprising:
- the polymer is a protein, or a polynucleic acid, preferably RNA or DNA, or a mixture of a protein and RNA, or a mixture of a protein and DNA.
- the assay method of the invention further comprises after step D): D') comparing the measured condensed volume (V con ), the measured condensed concentration (c con ), the measured dilute concentration ( Cdil ), and/or the measured volume fraction (V con /V tot ) of said polymer in the system with a condensed volume (V ref ), a condensed concentration (c ref ), and/or a volume fraction (V ref /V tot ) of the polymer in the presence of a reference molecule in a control system.
- the condensed volume (V ref ), the condensed concentration (c con-ref ), the dilute concentration (c dil-ref ) and/or the volume fraction (V ref /V tot ) of the polymer in the presence of a reference molecule is(are) predetermined or measured at the same time.
- the identified bioactive compound(s) increase(s)/decrease(s) the measured condensed volume (V con ), the measured condensed concentration (c con ), the measured dilute concentration (c dil ), and/or the measured volume fraction (V con /V tot ) of the polymer obtained by the step C) and/or D) than the predetermined condensed volume (V ref ), the measured condensed concentration (c con-ref ), the measured dilute concentration (c dil-ref ) and/or the measured volume fraction (V ref /V tot ) of the polymer of said polymer in the presence of a reference molecule in the control system.
- the device is a multi-well plate and each system is contained in each of the wells in a multi-well plate.
- the present invention refers to use of the methods according to the invention for determining an optimal condition for crystallization of said polymer.
- the present invention refers to a device for determining a binodal curve of a polymer in a system comprising:
- the polymer is a protein, or a polynucleic acid, preferably RNA or DNA, or a mixture of a protein and RNA or a mixture of a protein and DNA.
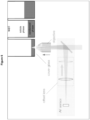
- FIG. 10 An exemplary setup of the inventive device is shown in Figure 10 .
- the device utilizes the light reflection at the interface between two media of different refractive index to calculate the height of the condensed phase inside a sample container of defined volume, typically a well in a well-plate.
- the device comprises a light source, a dichroic mirror, a pinhole or a slit, a stage, an objective, a z-drive (a motorized focus drive), and a sample container having a defined volume.
- the light source is preferably an infrared light source (LED or laser) and it is directed to a high N.A objective using the dichroic mirror located behind the pinhole or the slit.
- At least the stage or the objective needs to be mounted on the z-drive in order to focus the light at different samples depths.
- the stage and the objective are mounted on the z-drive.
- the present invention provides a method for determining a concentration (c con ) of a polymer in a condensed phase and a concentration (c dil ) of the polymer in a dilute phase in a system comprising:
- the polymer is a protein, or a polynucleic acid, preferably RNA or DNA, or a mixture of a protein and RNA or a mixture of a protein and DNA.
- the method for determining a concentration (c con ) of a first polymer and a second polymer in a condensed phase and a concentration (c dil ) of the first polymer and the second polymer in a dilute phase in a system comprises:
- the method for generating a binodal curve of a first polymer and a second polymer in a system comprises:
- the system is in vitro system and selected from a solution, an emulsion, or cells.
- emulsion preferably refers to "water-in-oil emulsion" as defined above.
- the phase separation of the polymer in said system is triggered by changing the concentration of a salt in the system, the pH value or the temperature of the system.
- step A) when the polymer is not labelled with fluorophore or a fluorescent protein, in step A) the total volume (V tot ) of said system and the total concentration (c tot ) of the polymer are determined by means of bright-field, dark-field, phase-contrast, holographic, polarization, or differential interference correlation (DIC) microscopy, or light-scattering based approaches.
- V tot total volume of said system and the total concentration (c tot ) of the polymer are determined by means of bright-field, dark-field, phase-contrast, holographic, polarization, or differential interference correlation (DIC) microscopy, or light-scattering based approaches.
- DIC differential interference correlation
- the total volume (V tot ) of said system and the total concentration (c tot ) of the polymer are determined by means of a fluorescence microscopy.
- fluorophore refers to a molecule, label or moiety that is able to absorb energy from light, to transfer this energy internally and emit said energy as light having a specific range of wavelength.
- any of the commercially available fluorophores can be used, for examples, Alexa Fluor ® 350, Alexa Fluor ® 405, Alexa Fluor ® 430, Alexa Fluor ® 488, Alexa Fluor ® 500, Alexa Fluor ® 514, Alexa Fluor ® 532, Alexa Fluor ® 546, Alexa Fluor ® 555, Alexa Fluor ® 568, Alexa Fluor ® 594, Alexa Fluor ® 610, Alexa Fluor ® 633, Alexa Fluor ® 635, Alexa Fluor ® 647, Alexa Fluor ® 660, Alexa Fluor ® 680, Alexa Fluor ® 700, Alexa Fluor ® 750, fluoresceine, rhodamine B, rhodamine Red, Texas Red ® , Cy3, Cy 3.5, Cy5, Cy5.5, Cy7, TRITC, FITC, ATTO-family, abberior-dyes, coumarine-derived dyes
- the fluorophore contains any one of the following moieties ( F-1 ) - ( F-14 ), wherein
- the fluorophore contains any one of the following moieties (F-7), (F-8), and/or (F-9): wherein
- the fluorophore contains any one of the moieties (F-7), (F-8), and/or (F-9), wherein R a and R b represent independently of each other -H; R c and R d represent independently of each other -CH 3 , -C 2 H 5 , or -C 3 H 7 .
- the fluorophore contains the following moiety:
- a fluorescent protein refers to a protein that absorbs light energy of a specific wavelength and re-emits light at a longer wavelength.
- Table 1 is a compilation of properties displayed by several of the most popular and useful fluorescent protein variants. Along with the common name and/or acronym for each fluorescent protein, the peak absorption and emission wavelengths (given in nanometers), molar extinction coefficient, and quantum yield are listed.
- GFP green fluorescent protein
- GFP is a versatile biological marker for monitoring physiological processes, visualizing protein localization, and detecting transgenic expression in vivo.
- GFP can be excited by the 488 nm laser line and is optimally detected at 510 nm
- step C) of the method of the present invention comprises:
- the emulsion system is a water-in-oil emulsion system.
- step C) of the methods described herein preferably comprises:
- a volume (V em ) of the emulsion system, and a condensed volume (V con ') of the condensed phase of the polymer in said emulsion system are determined by means of a fluorescence microscopy.
- the above-described method further comprises after the step C2a): C2b) adjusting the measured fluorescent image with a predetermined partition factor.
- step B) further comprising after the step B): B') centrifuging the system.
- the polymer may be labeled with a fluorophore or a fluorescent protein or not.
- the height of the condensed phase film is detected/determined by means of light refraction between the surface of the condensed and solute phase.
- Surface detecting devices are already available in the market such as the Nikon and Olympus perfect focus and ZDC.
- capillaries can be scanned by a laser beam to detect the surface between condensed and solute phase.
- the at least one condition of said system is selected from a concentration of a component in the system wherein the component is selected from a salt, a crowding agent, or a buffer; the pH value; the pressure; a crowding agent; or the temperature of the system, or a combination of the aforementioned conditions.
- the ability to measure the (temperature dependent) binodal curve for a given polymer furthermore enables comparison to various physical theories and simulation methods. These include models like Flory-Huggins and its extensions to Voorn-Overbeek theory, field theoretic simulations, or random phase approximation. In comparing the experimental data with the predictions of these models, an appropriate physical model to describe the thermodynamics of a given phase separating polymer can be identified. Furthermore, this allows access to determining model parameters like the interaction strength between individual polymers.
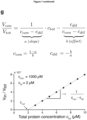
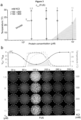
- V tot V dil + V con , Fig. 1b .
- the ratio V con / V tot changes linearly with the total protein concentration, c tot , of the system ( Figure 1g ).
- a linear regression to a concentration series allows us to determine both c dil , via the x-intercept, and c con by using the slope of the line, given by ( c con - c dil ) -1 . It therefore follows that we can determine c con and c dil at defined external conditions (temperature, salt, pH) by preparing samples at different total protein concentrations, c tot , and by measuring the volume of the condensed phase, V con , in a closed system of known volume, V tot . In principle, this allows us to measure binodal curves for ordinary binary systems.
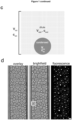
- a water-in-oil emulsion system is used, where the aqueous solution is encapsulated in stable emulsion droplets ( Fig. 1c).
- Figure 1d shows a typical experimental scheme, where a dilution series of c tot is mounted to a temperature-controlled stage.
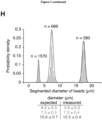
- the volume of individual emulsion droplets can be detected from bright-field images by assuming that the droplets form nearly spherical containers ( Fig. 1d and 1e ).
- the protein phase volume, V con is measured by image segmentation and analysis of microscopy images ( Fig. 1e ).
- the presence of tagged-protein is not strictly necessary but facilitates the segmentation.
- the binodal curves of the phase diagrams can be derived after segmentation and analysis of the microscopy data ( Fig. 2 b-e ).
- the inventors found that the dilute branch concentration c dil increases for higher salt concentrations as well as for higher temperatures ( Fig. 2b , c ). Comparing FUS and PGL-3 at the same salt concentration we observe that FUS requires less protein for phase separation, it reaches higher concentrations in the condensed phase and its c dil is more sensitive to temperature changes. The different sensitivities of both proteins to temperature could indicate a different mechanism for phase separation.
- phase diagrams for two proteins are presented that were derived using the inventive method on a water-in-oil emulsion system.
- the method is however not limited to the use of emulsions that could be also generated in a microfluidic system, but can be applied wherever the volume-fraction of a condensed protein can be determined.
- a well-plate format was used as a scalable system that can be extended to screening approaches. In this case the total volume of the sample per well is known and the volume of the condensate phase can be determined via fluorescence.
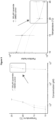
- Figure 4a such an experiment for PGL-3 is presented, as can be seen the total condensate volume increases with increasing total protein concentration.
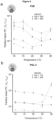
- partition factors in the order of 10 2 -10 3 strongly depend on the temperature and salt concentration ( Fig. 5a ).
- the partition factor of FUS exhibits a minimum that can be observed at lower temperatures with increasing salt concentrations. This minimum corresponds to the onset of bending of the condensed branch as presented in the phase diagrams in Fig. 2c , it is therefore a consequence of increased FUS concentration in the condensed phase.
- For PGL-3 only a small influence of temperature was observed while salt concentration can change the partition factor by an order of magnitude between 10 1 -10 2 ( Fig. 5b ). This trend is only broken for higher temperatures and salt concentrations where a sharp increase in the partition factor takes place. It is hypothesized that these changes in partitioning factor follow from a change in protein-protein interactions and protein secondary structure.
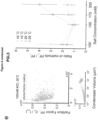
- a value for PF l for a given external condition can be calculated by only using condensates above a threshold volume that is in the plateau region.
- the PF l underestimates the protein partitioning (Fig. 5e).
- the difference between PF l and PF c is more prominent for FUS than for PGL-3, and at least 2-fold off over the entire dataset. This effect is likely caused by an erroneous estimation of the fluorescence intensity inside the condensate phase. These could be caused by limitations of the optical system as well as by a different chemical environment inside the phase that changes the fluorescence properties.
- the inventors tested the influence of the fraction of labelled protein on the partition factor PF, and PF c for PGL-3. While an increase in the partition factor is seen for increased fraction of labelled protein for both PF l and PF c , the ratio PF l / PF C is constant over all label fractions tested ( Fig. 5c ).
- phase diagrams produced by the inventive method that present the dilute and condensed phase protein concentrations have been reported for phase separating proteins. These phase diagrams contain rich information on the protein behaviour and interactions that can be used to assess current theoretical approaches (cite later). Yet, to realize the full potential of phase separation research better methods for measuring phase diagrams are still required.
- the inventive method offers a powerful approach to address this challenge. The inventors showed quantitatively that accurate phase diagrams can be generated at defined temperature and salt concentrations for FUS and PGL-3 proteins. Based on these phase diagrams dynamic temperature experiments can be performed to assess the reversibility of phase separation and quantify the effect of small molecules on phase behaviour.
- the inventive method is based on mass- and volume-conversation to measure accurate concentrations of the dilute and condensed phase of phase separating proteins.
- the underlying principles and techniques make this method accessible to the research community because it relies on commonly available equipment (fluorescent or bright field microscope), modest computational power and low amounts of protein.
- Our approach does not necessitate the use of labelled protein, which not only reduces the time required for cloning and protein purification but also removes artefacts associated with the use of fluorescent tags.
- the accurate measurement of binodal curves with the inventive method has the potential to increase reproducibility in the protein phase separation community as protein concentrations in and out of the phase can be reported with their experimental errors.
- the partition factors calculated using the inventive method overcome common issues encountered when using quantitative fluorescence microscopy. For example, given a 16-bit image of a droplet with a fluorescence count of 65 ⁇ 10 3 in an image that has a dark current signal of 100 counts and with a fluorescent intensity outside the condensate of 150 counts, the maximum partition factor that can be detected is about 1.3 ⁇ 10 3 . As it has been shown, this range is not enough to measure the partitioning factor of FUS, and probably extends to other proteins of the same family.
- the dynamic range of the camera is not the only limiting factor in quantitative fluorescence but it is well known that fluorescent properties depend on the environment. Given that the chemical environment is different inside the condensate compared to the dilute phase it is not safe to assume a linear relationship of the fluorescent intensity between the condensate and its surroundings.
- FCS fluorescence correlation spectroscopy
- inventive method is an efficient new method for measuring binodal curves, and it will contribute to developing the study of phase separating proteins. While other techniques have been developed to measure binodal curves, they often require specialised equipment (microfluidic chips) or great amounts of protein and therefore their applicability might be limited.
- the concept at the core of inventive method is readily accessible to a wide community and that the experimental workflow, performing a protein titration, can be readily adapted.
- the methods of the present invention are compared to the widely used quantitative fluorescence approaches and find that these methods underestimate the protein concentration in the condensates for FUS and PGL-3.
- the inventive methods can be used in large-scale screening approaches to generate databases of binodal curves, opening the possibility for the thermodynamic assessment of entire protein families and for pharmaceutical studies.
- the present invention refers to an assay method for identifying bioactive compound(s), comprising:
- the assay method of the invention further comprises after step D): D') comparing the measured condensed volume (V con ), the measured condensed concentration (c con ), and/or the measured volume fraction (V con /V tot ) of said polymer in the system with a condensed volume (V ref ), a condensed concentration (c ref ), and/or a volume fraction (V ref /V tot ) of the polymer in the presence of a reference molecule in a control system.
- the condensed volume (V ref ), the condensed concentration (c ref ), and/or the volume fraction (V ref /V tot ) of the polymer in the presence of a reference molecule is(are) predetermined or measured at the same time.
- the identified bioactive compound(s) increase(s) the measured condensed volume (V con ), the measured condensed concentration (c con ), the measured dilute concentration (c dil ), and/or the measured volume fraction (V con /V tot ) of the polymer obtained by the step C) and/or D) than the predetermined condensed volume (V ref ), the measured condensed concentration (c ref ), and/or the measured volume fraction (V ref /V tot ) of the polymer of said polymer in the presence of a reference molecule in the control system.
- the device is a multi-well plate and each system is contained in each of wells in a multi-well plate.
- the bioactive compound is preferably a small molecule (molecular weight ⁇ 1000 Da), and more preferably a therapeutically active small molecule, i.e. a small molecule drug.
- Example 3 shows the effect of lipoamide on the phase behavior of FUS where a reduced amount of conformational changes at higher temperatures was observed. This is indicated by the earlier bent of the condensed phase branch of the binodal for the untreated control (DMSO). This can also be seen in the partition factor c in / c out .
- the present invention refers to use of the methods according to the invention for determining an optimal condition for crystallization of said polymer.
- the binodal curve is the coexistence curve for thermodynamic stability which a transition occurs from a stable single-phase mixture towards loss of miscibility and subsequent demixing. This results in the formation of a dilute and condensed (dense) polymer liquid phase.
- Liquid-liquid demixing involves a nucleation step, and as such, requires the passage over an activation barrier.
- the spinodal curve describes the limit or loss of this metastability, i.e. barrier free phase separation and instability against all fluctuations.
- the spinodal curve is of kinetic origin. It defines the transition to a nucleus size of one polymer and has been observed, in particular for proteins.
- the liquid-liquid critical point is then the intersection of the bimodal and spinodal curves. At the critical point, there is no distinction between the two liquid phases and phase boundaries cease to exist. Liquid-liquid demixing has been observed experimentally for many proteins. For these cases, the liquid-liquid-coexistence curve is located in the metastable region under the liquid-solid coexistence curve.
- phase diagram derived from the binodal curves produced by the methods according to the invention is useful for determining an optimal condition for phase separation of said polymer, in particular, proteins.
- the method of the present invention can be used for any phase separating system. This is also true for in vivo settings of phase separating proteins.
- the natural or induced fluctuations in the total protein concentration of cells are equivalent to our protein concentration titration series.
- the inventive method can be applied to calculate c con and c dil .
- we determine the volume fraction of the phase and the total concentration of protein e.g. via GFP labelled protein). This is shown exemplary for C . elegans embryos and the protein PGL-1 that is constitutive for P granules.
- in vivo condensates are usually multicomponent systems, the c con can be understood as an average for all proteins in the phase. This opens the possibility to look at the multicomponent nature of condensates, e.g. by concertation titration of one component while keeping the other constant. Furthermore using in vivo screens could be used in translational research for drug discovery.
- the present invention is directed to an in vivo method for the diagnosis of a disease associated with and/or caused by phase separation of a polymer in a cell-containing sample comprising:
- the polymer is a protein, or a polynucleic acid, preferably RNA or DNA, or a mixture of a protein and RNA or a mixture of a protein and DNA.
- the disease associated with and/or caused by phase separation of a polymer is cancer, a neurodegenerative disease or an infectious disease. More preferably, the disease is selected from ALS, Parkinson, Alzheimer, Huntington, frontotemporal dementia, cancer, and infectious disease.
- phase-separated polymer refers to a polymer being present in condensed phase and a dilute phase within the system.
- the in vivo method for the diagnosis of a disease associated with and/or caused by phase separation of a polymer in a cell-containing sample comprising:
- the in vivo method for the diagnosis of a disease associated with and/or caused by phase separation of a polymer in a cell-containing sample comprising:
- the present invention is directed to an ex vivo method for the diagnosis of a disease associated with and/or caused by phase separation of a polymer in a cell-containing sample comprising:
- the polymer is a protein, or a polynucleic acid, preferably RNA or DNA, or a mixture of a protein and RNA or a mixture of a protein and DNA.
- the disease associated with and/or caused by phase separation of a polymer is cancer, a neurodegenerative disease or an infectious disease. More preferably, the disease is selected from ALS, Parkinson, Alzheimer, Huntington, frontotemporal dementia, cancer, and infectious disease.
- ex vivo method for the diagnosis of a disease associated with and/or caused by phase separation of a polymer in a cell-containing sample comprising:
- ex vivo method for the diagnosis of a disease associated with and/or caused by phase separation of a polymer in a cell-containing sample comprising:
- Suitable samples for the diagnostic methods described herein are for example, but not limited to, bodily fluids, including blood, urine, cerebrospinal fluid, peritoneal fluid, pleural fluid, ascitic fluid, blood plasma, liver extracts and interstitial fluid.
- bodily fluids including blood, urine, cerebrospinal fluid, peritoneal fluid, pleural fluid, ascitic fluid, blood plasma, liver extracts and interstitial fluid.
- the present invention is directed to a device for determining a binodal curve of a polymer in a system comprising:
- a volume fraction (V con / V tot ) of a condensed phase of the polymer in said system can be determined by detecting the height of the condensed phase film by means of light refraction between the surface of the condensed and solute phase.
- surface detecting devices such as the Nikon and Olympus perfect focus and ZDC can be used as means for measuring a volume fraction (V con / V tot ) of a condensed phase of the polymer in said system.
- FIG 10 An exemplary setup of the inventive device is shown in Figure 10 .
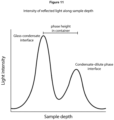
- the device utilizes the light reflection at the interface between two media of different refractive index to calculate the height of the condensed phase inside a sample container of defined volume, typically a well in a well-plate (see Figure 11 ).
- the device comprises a light source, a dichroic mirror, a pinhole or a slit, a stage, an objective, a z-drive (a motorized focus drive), and a sample container having a defined volume.
- the light source is preferably an infrared light source (LED or laser) and it is directed to a high N.A objective using the dichroic mirror located behind the pinhole or the slit.
- At least the stage or the objective needs to be mounted on the z-drive in order to focus the light at different samples depths.
- the stage and the objective are mounted on the z-drive.
- the sample container has a constant cross-section in height for facilitating the determination of the liquid level and height of the condensed phase film.
- the sample container is of cylindrical shape.
- capillaries or capillary tubings or capillary tubes can be used as sample containers.
- the capillary tubes are filled with the phase separated solution and scanned by a laser beam to detect the surface between condensed phase and solute phase.
- the capillary tubes are centrifuged prior scanning to coalesce the condensed phase into one phase.
- the device comprises a laser light source, a dichroic mirror, a pinhole or a slit, a stage, an objective, a z-drive (a motorized focus drive), and capillary tubes.
- the light source is directed to a high N.A objective using the dichroic mirror located behind the pinhole or the slit.
- the invention relates to the study of protein solutions that undergo phase separation into a dense and a dilute phase. It allows to determine the protein concentrations of both the dense and the dilute phase. It relies on measuring the volume fraction of the condensed phase in the total reaction for a titration series of total protein concentration c tot .
- V con V tot 1 c con ⁇ c dil ⁇ c tot ⁇ c dil c con ⁇ c dil linear form 1 c con ⁇ c dil and c dil c con ⁇ c dil are constants
- Protocol 1 water-in-oil emulsions
- Step 1.-3. are the same as in Protocol 1.
- PGL-3 was purified from insect cells according to Saha et al. (Cell 166, 1572-1584.e16 (2016 )) from SF9-ESF cells were infected with baculovirus containing the PGL-3-GFP-6HIS protein under the polyhedrin promoter. Cells were harvested after 3 days of infection by centrifugation at 500 ⁇ g for 10 min and then resuspended in lysis buffer (25 mM HEPES 7.25, 300 mM KCI, 10 mM imidazole, 1 mM DTT, 1 protease inhibitor). Cells were lysed by passing the cells 2 times through the LM20 microfluidizer at 15 000 psi.
- the lysate was then centrifuged at 20 000 rpm for 45 min at 15 °C.
- the lysate was loaded in a pre-equilibrated Ni-NTA column with lysis buffer at 3 mL/min.
- the Ni-NTA column was rinsed with 10 C.V of wash buffer (25 mM HEPES 7.25, 300 mM KCI, 20 mM imidazole, 1 mM DTT, 1) and the protein was eluted in 1.5 mL fractions with elution buffer (25 mM HEPES 7.25, 300 mM KCI, 250 mM imidazole, 1 mM DTT). After elution the GFP tagged was cleaved to produce untagged PGL-3.
- PGL-3 and PGL-3-GFP proteins (SEQ ID No: 2) were diluted with Dilution buffer (25 mM Tris pH 8.0, 1 mM DTT) to reach 50 mM KCI before loading the protein in an anion exchange HiTrapQ HP 5 mL column.
- Dilution buffer 25 mM Tris pH 8.0, 1 mM DTT
- the HiTrap column was previously equilibrated first with HiTrapQ elution buffer (25 mM Tris pH 8.0, 50 mM KCI, 1 mM DTT) and then with HiTrapQ binding buffer (25 mM Tris pH 8.0, 1 M KCI, 1 mM DTT).
- the column was mounted in a ⁇ kta Pure FPLC system. After the sample was loaded the column was washed with HiTrapQ binding buffer. The sample was finally eluted with a linear gradient from 0 to 55% of HiTrapQ elution buffer (25 mM Tris pH 8.0, 1 M KCI 1 mM DTT) for 25 C.V. Finally, a 100% HiTrap elution buffer step was performed for 5 C.V. The pooled fractions were then loaded in a HiLoad 16/60 Superdex 200 size exclusion chromatography column that was previously equilibrated with Superdex buffer (25 mM HEPES 7.25, 300 mM KCI, 1 mM DTT). After size exclusion, the final samples were collected.
- SF9-ESF cells were harvested after three days of infection by centrifugation at 500 ⁇ g for 10 min. The cell pellet was resuspended using 50 mL of lysis buffer (50 mM Tris pH 7.4, 500 mM KCI, 5% glycerol, 10 mM imidazole, 1mM PMSF, 1X protease inhibitor) for every 50 mL of cultured cells. The cells were lysed by passing them 2 times through the LM20 microfluidizer at 15 000 psi.
- Ni-NTA Ni-NTA was buffer (50 mM Tris pH 7.4, 500 mM KCI, 5% glycerol, 20 mM imidazole).
- Ni-NTA elution buffer 50 mM Tris pH 7.4, 500 mM KCI, 5% glycerol, 300 mM imidazole.
- the collected fractions where then loaded into a MBPTrap HP column preequilibrated with Ni-NTA elution buffer.
- the MBP column was washed for 10 C.V with MBP wash buffer (50 mM Tris pH 7.4, 500 mM KCI, 5% glycerol). After washing, the sample was eluted with MBP elution buffer (50 mM Tris pH 7.4, 500 mM KCI, 5% glycerol, 500 mM arginine, 20 mM maltose).
- MBP wash buffer 50 mM Tris pH 7.4, 500 mM KCI, 5% glycerol, 500 mM arginine, 20 mM maltose.
- MBP elution buffer 50 mM Tris pH 7.4, 500 mM KCI, 5% glycerol, 500 mM arginine, 20 mM maltose.
- the protein was diluted to a concentration of less than 15 ⁇
- the cleavage reactions were incubated overnight at 18 °C. Finally, the protein was loaded in a SepFast GF-HS-L 26 ⁇ 600 mm gel filtration to remove the cleaved MBP and SNAP tags and exchange the buffer.
- the SepFast column was previously equilibrated in storage buffer (50 mM HEPES pH 7.25, 750 mM KCI, 5% glycerol, 1 mM DTT). The sample was concentrated to a final concentration of ⁇ 15 ⁇ L using 30 kDa Amicon centrifuge filters.
- FUS-GFP SEQ ID No: 1 was purified as previously described ( Wang, J. et al. "A Molecular Grammar Governing the Driving Forces for Phase Separation of Prion-like RNA Binding Proteins", Cell, 2018, 174, 688-699.e16 ).
- Protein solutions were prepared from stocks that are frozen at -80°C.
- the protein stock solutions were cleared from potential aggregates using centrifugal filters (UFC30HV00, Merck, Germany).
- the protein concentrations were determined via extinction coefficient measurements at 280 nm (NanoDrop, Thermo Fisher Scientific, USA).
- the desired label fraction in the main experiments 5% GFP labeled protein, was prepared.
- salt concentrations of the protein stock 300mM KCI for PGL-3 and 750 mM KCI for FUS; both 25mM HEPES and 1 mM DTT at 7.4pH).
- the salt concentration was dropped to the desired value, using a no salt buffer (25 mM HEPES and 1 mM DTT at 7.4 pH), and the solution was immediately encapsulated into the water-in-oil solution. Encapsulation was performed using twice the amount of PicoSurf oil (2% (w/w) in Novec 7500, Sphere Fluidics, UK) compared to the protein solution (usually 5 ⁇ L). After adding the oil on top of the protein solution in standard 100 ⁇ l microcentrifuge tubes the solution is agitated using a 10 ⁇ l pipette until the desired size distribution of water-in-oil solutions is reached. This solution can be used directly for imaging.
- the coarsening of the phase separated condensates can be speed up by a mild centrifugation step of the water-in-oil emulsions (100-1000 g for 3 min). This will lead to predominantly one single condensate of condensed phase per emulsion droplet.
- Each lane is sealed using addition curing silicone (Picodent twinsil speed, Picodent, Germany) to ensure no evaporation and movement of the water-in-oil emulsions upon temperature changes.
- Sample imaging was performed via CellSens software (Olympus, Japan) on an Olympus IX83 microscope connected to a Yokogawa W1 SoRa spinning-disc system (Yokogawa, Japan) and a Hamamatsu Orca Flash v3 sCMOS camera (Hamamatsu, Japan) using a 40x air objective (UPLXAPO, 0.95NA, Olympus, Japan).
- UPLXAPO 0.95NA, Olympus, Japan
- the method of the present invention can be used for any phase separating system. This is also true for in vivo settings of phase separating proteins.
- the natural or induced fluctuations in the total protein concentration of cells are equivalent to our protein concentration titration series.
- the inventive method can be applied to calculate c out and c in .
- the volume fraction of the phase and the total concentration of protein is determined. This is shown exemplary for C . elegans embryos and the protein PGL-1 that is constitutive for P granules ( Figure 8 ).
- FUS-GFP containing samples were prepared as described in Example 1. Phase separation was triggered by simultaneously lowering the salt concentration of the sample and adding the Poly(A) RNA in an amount to maintain a fixed molar ratio of Poly(A):FUS-GFP.
- the volume fraction of the condensed phase was determined as described in Example 1 and c dil and c con , were determined, wherein c con represents an apparent concentration containing both Poly(A) (SEQ ID No: 3) and FUS-GFP concentration.
- the concentration of the single components of the sample can be resolved by the knowledge of the molar ratio of RNA to protein in the condensed phase.
Landscapes
- Health & Medical Sciences (AREA)
- Life Sciences & Earth Sciences (AREA)
- Engineering & Computer Science (AREA)
- Immunology (AREA)
- Molecular Biology (AREA)
- Biomedical Technology (AREA)
- Chemical & Material Sciences (AREA)
- Hematology (AREA)
- Urology & Nephrology (AREA)
- Physics & Mathematics (AREA)
- Cell Biology (AREA)
- Food Science & Technology (AREA)
- General Physics & Mathematics (AREA)
- Biotechnology (AREA)
- Pathology (AREA)
- Medicinal Chemistry (AREA)
- Microbiology (AREA)
- Analytical Chemistry (AREA)
- Biochemistry (AREA)
- General Health & Medical Sciences (AREA)
- Virology (AREA)
- Tropical Medicine & Parasitology (AREA)
- Bioinformatics & Cheminformatics (AREA)
- Bioinformatics & Computational Biology (AREA)
- Biophysics (AREA)
- Zoology (AREA)
- Proteomics, Peptides & Aminoacids (AREA)
- Toxicology (AREA)
- Investigating Or Analysing Biological Materials (AREA)
Priority Applications (4)
| Application Number | Priority Date | Filing Date | Title |
|---|---|---|---|
| EP22177321.1A EP4286846A1 (fr) | 2022-06-03 | 2022-06-03 | Procédé précis de génération d'un diagramme de phase d'un polymère |
| US18/871,218 US20250347697A1 (en) | 2022-06-03 | 2023-06-05 | Accurate Method for Generating a Phase Diagram of a Polymer |
| PCT/EP2023/064947 WO2023233040A1 (fr) | 2022-06-03 | 2023-06-05 | Procédé précis de génération d'un diagramme de phases d'un polymère |
| EP23730510.7A EP4533084A1 (fr) | 2022-06-03 | 2023-06-05 | Procédé précis de génération d'un diagramme de phases d'un polymère |
Applications Claiming Priority (1)
| Application Number | Priority Date | Filing Date | Title |
|---|---|---|---|
| EP22177321.1A EP4286846A1 (fr) | 2022-06-03 | 2022-06-03 | Procédé précis de génération d'un diagramme de phase d'un polymère |
Publications (1)
| Publication Number | Publication Date |
|---|---|
| EP4286846A1 true EP4286846A1 (fr) | 2023-12-06 |
Family
ID=82458514
Family Applications (2)
| Application Number | Title | Priority Date | Filing Date |
|---|---|---|---|
| EP22177321.1A Withdrawn EP4286846A1 (fr) | 2022-06-03 | 2022-06-03 | Procédé précis de génération d'un diagramme de phase d'un polymère |
| EP23730510.7A Pending EP4533084A1 (fr) | 2022-06-03 | 2023-06-05 | Procédé précis de génération d'un diagramme de phases d'un polymère |
Family Applications After (1)
| Application Number | Title | Priority Date | Filing Date |
|---|---|---|---|
| EP23730510.7A Pending EP4533084A1 (fr) | 2022-06-03 | 2023-06-05 | Procédé précis de génération d'un diagramme de phases d'un polymère |
Country Status (3)
| Country | Link |
|---|---|
| US (1) | US20250347697A1 (fr) |
| EP (2) | EP4286846A1 (fr) |
| WO (1) | WO2023233040A1 (fr) |
Citations (3)
| Publication number | Priority date | Publication date | Assignee | Title |
|---|---|---|---|---|
| WO2011042509A2 (fr) * | 2009-10-08 | 2011-04-14 | Universite De Strasbourg | Appareil et procédé pour générer une concentration variable de soluté dans des microgouttelettes |
| US20210350875A1 (en) * | 2018-09-20 | 2021-11-11 | The Trustees Of Princeton University | High throughput method and system for mapping intracellular phase diagrams |
| US20220003661A1 (en) * | 2018-12-14 | 2022-01-06 | The Penn State Research Foundation | Methods for determining the thermodynamics and kinetics of colloidal phase separation on a temperature gradient device |
-
2022
- 2022-06-03 EP EP22177321.1A patent/EP4286846A1/fr not_active Withdrawn
-
2023
- 2023-06-05 WO PCT/EP2023/064947 patent/WO2023233040A1/fr not_active Ceased
- 2023-06-05 US US18/871,218 patent/US20250347697A1/en active Pending
- 2023-06-05 EP EP23730510.7A patent/EP4533084A1/fr active Pending
Patent Citations (3)
| Publication number | Priority date | Publication date | Assignee | Title |
|---|---|---|---|---|
| WO2011042509A2 (fr) * | 2009-10-08 | 2011-04-14 | Universite De Strasbourg | Appareil et procédé pour générer une concentration variable de soluté dans des microgouttelettes |
| US20210350875A1 (en) * | 2018-09-20 | 2021-11-11 | The Trustees Of Princeton University | High throughput method and system for mapping intracellular phase diagrams |
| US20220003661A1 (en) * | 2018-12-14 | 2022-01-06 | The Penn State Research Foundation | Methods for determining the thermodynamics and kinetics of colloidal phase separation on a temperature gradient device |
Non-Patent Citations (8)
| Title |
|---|
| BRACHA, D. ET AL.: "Mapping Local and Global Liquid Phase Behavior in Living Cells Using Photo-Oligomerizable Seeds", CELL, vol. 175, 2018, pages 1467 - 1480 |
| BRADY, J. P. ET AL.: "Structural and hydrodynamic properties of an intrinsically disordered region of a germ cell-specific protein on phase separation", PNAS, vol. 114, 2017, pages E8194 - E8203 |
| DAN BRACHA ET AL: "Mapping local and global liquid-liquid phase behavior in living cells using light-activated multivalent seeds", BIORXIV, 16 March 2018 (2018-03-16), pages 1 - 16, XP055694847, DOI: 10.1101/283655 * |
| FRITSCH ET AL., PNAS, vol. 118, no. 37, 2021, pages e2102772118 |
| FRITSCH, A. W. ET AL.: "Local thermodynamics govern formation and dissolution of Caenorhabditis elegans P granule condensates", PNAS, vol. 118, no. 37, 2021, pages e2102772118 |
| MCCALL, P. M. ET AL., QUANTITATIVE PHASE MICROSCOPY ENABLES PRECISE AND EFFICIENT DETERMINATION OF BIOMOLECULAR CONDENSATE COMPOSITION |
| SAHA ET AL., CELL, vol. 166, 2016, pages 1572 - 1584 |
| WANG, J. ET AL.: "A Molecular Grammar Governing the Driving Forces for Phase Separation of Prion-like RNA Binding Proteins", CELL, vol. 174, 2018, pages 688 - 699 |
Also Published As
| Publication number | Publication date |
|---|---|
| US20250347697A1 (en) | 2025-11-13 |
| EP4533084A1 (fr) | 2025-04-09 |
| WO2023233040A1 (fr) | 2023-12-07 |
Similar Documents
| Publication | Publication Date | Title |
|---|---|---|
| Chan et al. | HomoFRET fluorescence anisotropy imaging as a tool to study molecular self‐assembly in live cells | |
| Sekar et al. | Fluorescence resonance energy transfer (FRET) microscopy imaging of live cell protein localizations | |
| Heberle et al. | Fluorescence methods to detect phase boundaries in lipid bilayer mixtures | |
| Ng et al. | Recapitulation of selective nuclear import and export with a perfectly repeated 12mer GLFG peptide | |
| JP2010276380A (ja) | 蛍光相関分光分析装置及び方法並びにそのためのコンピュータプログラム | |
| CN103026205A (zh) | 使用发光探针检测溶液中稀疏颗粒的方法 | |
| Ray et al. | FRAP and FRET investigation of α-synuclein fibrillization via liquid-liquid phase separation in vitro and in HeLa cells | |
| Karpova et al. | Detecting protein–protein interactions with CFP‐YFP FRET by acceptor photobleaching | |
| Kar et al. | Solutes unmask differences in clustering versus phase separation of FET proteins | |
| Barkley et al. | Fluorescent protein tags affect the condensation properties of a phase-separating viral protein | |
| Li et al. | High throughput DNA concentration determination system based on fluorescence technology | |
| Lénárt et al. | Monitoring the permeability of the nuclear envelope during the cell cycle | |
| JP2009250721A (ja) | 分子間相互作用の解析方法 | |
| US6713260B2 (en) | Methods of identifying compounds that bind to target species under isothermal denaturing conditions | |
| Vizjak et al. | ISWI catalyzes nucleosome sliding in condensed nucleosome arrays | |
| Herman et al. | Microscopic analysis of fluorescence resonance energy transfer (FRET) | |
| Fritsch et al. | inPhase—a simple, accurate and fast approach to determine phase diagrams of protein condensates | |
| Deng et al. | Bridged triphenylamine-based fluorescent probe for selective and direct detection of HSA in urine | |
| Gui et al. | Influenza virus-liposome fusion studies using fluorescence dequenching and cryo-electron tomography | |
| AU777163B2 (en) | Use of fluorescence correlation spectroscopy to identify compounds that bind to target species under isothermal denaturing conditions | |
| EP4286846A1 (fr) | Procédé précis de génération d'un diagramme de phase d'un polymère | |
| Presley | Imaging the secretory pathway: the past and future impact of live cell optical techniques | |
| Corby et al. | Quantitative microspectroscopic imaging reveals viral and cellular RNA helicase interactions in live cells | |
| Tan et al. | Hydrogel capsule-based digital quantitative polymerase chain reaction | |
| JP2010057364A (ja) | 蛍光共鳴エネルギー移動を用いたdnaとdna結合性タンパク質の相互作用の検出方法 |
Legal Events
| Date | Code | Title | Description |
|---|---|---|---|
| PUAI | Public reference made under article 153(3) epc to a published international application that has entered the european phase |
Free format text: ORIGINAL CODE: 0009012 |
|
| STAA | Information on the status of an ep patent application or granted ep patent |
Free format text: STATUS: THE APPLICATION HAS BEEN PUBLISHED |
|
| AK | Designated contracting states |
Kind code of ref document: A1 Designated state(s): AL AT BE BG CH CY CZ DE DK EE ES FI FR GB GR HR HU IE IS IT LI LT LU LV MC MK MT NL NO PL PT RO RS SE SI SK SM TR |
|
| STAA | Information on the status of an ep patent application or granted ep patent |
Free format text: STATUS: THE APPLICATION IS DEEMED TO BE WITHDRAWN |
|
| 18D | Application deemed to be withdrawn |
Effective date: 20240607 |