EP4293616A1 - Procédé de détermination de valeur seuil - Google Patents
Procédé de détermination de valeur seuil Download PDFInfo
- Publication number
- EP4293616A1 EP4293616A1 EP22752679.5A EP22752679A EP4293616A1 EP 4293616 A1 EP4293616 A1 EP 4293616A1 EP 22752679 A EP22752679 A EP 22752679A EP 4293616 A1 EP4293616 A1 EP 4293616A1
- Authority
- EP
- European Patent Office
- Prior art keywords
- threshold
- determination
- image
- staining
- cell
- Prior art date
- Legal status (The legal status is an assumption and is not a legal conclusion. Google has not performed a legal analysis and makes no representation as to the accuracy of the status listed.)
- Pending
Links
Images


Classifications
-
- G—PHYSICS
- G06—COMPUTING OR CALCULATING; COUNTING
- G06T—IMAGE DATA PROCESSING OR GENERATION, IN GENERAL
- G06T7/00—Image analysis
- G06T7/0002—Inspection of images, e.g. flaw detection
- G06T7/0012—Biomedical image inspection
-
- G—PHYSICS
- G06—COMPUTING OR CALCULATING; COUNTING
- G06T—IMAGE DATA PROCESSING OR GENERATION, IN GENERAL
- G06T7/00—Image analysis
- G06T7/10—Segmentation; Edge detection
- G06T7/11—Region-based segmentation
-
- G—PHYSICS
- G01—MEASURING; TESTING
- G01N—INVESTIGATING OR ANALYSING MATERIALS BY DETERMINING THEIR CHEMICAL OR PHYSICAL PROPERTIES
- G01N1/00—Sampling; Preparing specimens for investigation
- G01N1/28—Preparing specimens for investigation including physical details of (bio-)chemical methods covered elsewhere, e.g. G01N33/50, C12Q
- G01N1/30—Staining; Impregnating ; Fixation; Dehydration; Multistep processes for preparing samples of tissue, cell or nucleic acid material and the like for analysis
-
- G—PHYSICS
- G06—COMPUTING OR CALCULATING; COUNTING
- G06T—IMAGE DATA PROCESSING OR GENERATION, IN GENERAL
- G06T2207/00—Indexing scheme for image analysis or image enhancement
- G06T2207/10—Image acquisition modality
- G06T2207/10024—Color image
-
- G—PHYSICS
- G06—COMPUTING OR CALCULATING; COUNTING
- G06T—IMAGE DATA PROCESSING OR GENERATION, IN GENERAL
- G06T2207/00—Indexing scheme for image analysis or image enhancement
- G06T2207/10—Image acquisition modality
- G06T2207/10056—Microscopic image
-
- G—PHYSICS
- G06—COMPUTING OR CALCULATING; COUNTING
- G06T—IMAGE DATA PROCESSING OR GENERATION, IN GENERAL
- G06T2207/00—Indexing scheme for image analysis or image enhancement
- G06T2207/30—Subject of image; Context of image processing
- G06T2207/30004—Biomedical image processing
- G06T2207/30024—Cell structures in vitro; Tissue sections in vitro
Definitions
- This invention relates to a method for determining a threshold in evaluating a stained state of a stained biological specimen by an image analysis.
- biological specimens such as tissue specimens and cell specimens are analyzed in single cells for the purpose of elucidating a disease mechanism and a biological mechanism, elucidating a drug action mechanism and the like.
- biological materials such as proteins and RNAs (ribonucleic acids) are stained by various staining methods.
- quantitative or qualitative analyses are conducted. This evaluation result possibly includes artifacts such as noise during measurement and a staining variation due to a staining technique.
- an analysis method not affected by such artifacts is necessary.
- a tissue specimen is an object to be directly evaluated, there are a wide variety of factors of artifacts unlike flow cytometry using specimens divided into cells in advance. Thus, for threshold optimization, judgment by the skilled person's subjectivity and adjustment are necessary in many cases. However, a huge number of cells are included in a tissue specimen, and an optimal threshold is not necessarily unique, but variable depending on a state of the specimen and imaging. Further, in a situation in which a plurality of types of immunohistostaining (immunohistochemistry) are sequentially applied to the same specimen to analyze a multitude of biological substances (called multiple immunostaining), a possibility of result mismatch, which could not occur in single staining, needs to be grasped.
- immunohistostaining immunohistostaining
- one aspect of this invention is directed to a threshold determination method for evaluating a stained biological specimen, the threshold determination method including a region specification step of specifying cell regions corresponding to individual cells in an image to be processed obtained by imaging the biological specimen, a determination step of setting temporarily a threshold for a density of the image to be processed, comparing the density and the threshold for each of the cell regions and determining whether a stained state is positive or negative for the staining, a receiving step of displaying a determination result of the stained state of each of the cell regions and receiving an operation input of a user to change the determination result for each cell region, and a resetting step of resetting the threshold in accordance with the determination result after the change.
- the stained state of each of the cell regions extracted from the image to be processed is automatically determined based on the threshold set in advance.
- the threshold at this time is not necessarily an optimal value, the threshold is optimized by reflecting the judgment of a skilled person.
- the determination result of the stained state of each cell region based on the temporarily set threshold is displayed, and the operation input to change this is received from the user.
- the user can teach a correct determination for the cell region having an improper determination result represented therefor.
- the threshold can be corrected to approach the optimal value.
- the user does not directly operate the threshold, but a correction input for the displayed determination result is received and the threshold is reset to correspond to that result.
- the threshold is reset to correspond to that result.
- a stained state is determined based on a temporarily set threshold for an image of a stained biological specimen, and that determination result is displayed. Then, an operation input from a user to change the determination result is received, and the threshold is reset according to the received operation input. In this way, the threshold for determining the stained state can be efficiently optimized while human judgment is made.
- FIG. 1 is a flow chart summarizing a specimen analysis method, to which a threshold determination method according to the invention is applicable.
- This specimen analysis method is a method for obtaining various pieces of quantitative information by imaging a multiple immunostained tissue specimen and analyzing that image, i.e. performing so-called image cytometry.
- a specimen image to be processed is collected. Specifically, the tissue specimen to be analyzed is stained by a predetermined staining method (Step S101), and digital image data is obtained by imaging this tissue specimen (Step S102). The tissue specimen after imaging is destained (Step S103). This operation is repeated until imaging is completed for all of a plurality of types of staining methods prepared in advance (Step S104). In this way, a plurality of specimen images corresponding to the plurality of types of staining are collected. These specimen images are images obtained by imaging the same tissue specimen having mutually different types of staining applied thereto.
- Step S105 a part of the tissue specimen is set as an analysis target region to be analyzed.
- a partial image corresponding to the analysis target region is cut out as an analysis target image from each tissue specimen. Registration is performed for those analysis target images such that positions corresponding to each other coincide (Step S106).
- cell regions corresponding to cells in the tissue are extracted from each analysis target image (Step S 107).
- Various methods are known as a method for extracting cell regions from an image.
- an appropriate one can be selected from such known methods and applied.
- the analysis target image may not be suitable for the extraction of the cell regions.
- an analysis target image of a specimen in which specific structures in cells such as cell nuclei are selectively stained does not necessarily clearly show the outer shapes of the cells.
- such an image may not be suitable for application of specifying regions occupied by individual cells in an image.
- an extraction result in an image of the specimen stained by another staining method for clearly showing the regions occupied by the cells can be utilized. That is, the respective stained images can be aligned in position by the registration processing (Step S106).
- regions corresponding to the cell regions extracted from one or more other stained images can be regarded as the cell regions in this analysis target image.
- the cell regions in each analysis target image may be specified by a method for directly extracting the cell regions from this analysis target image by an imaging processing. Further, an indirect specification method may be adopted which regards regions corresponding to individual cell regions extracted using one or more images stained by another staining method as individual cell regions in this analysis target image.
- FIG. 2 is a diagram schematically showing an example of a specimen image.
- a specimen image Is is an image including, as an object, at least a part of a tissue specimen S stained by an appropriate staining method after being obtained from a living organism or produced by culturing. Imaging can be performed, for example, by optical microscopic imaging. One specimen image Is is obtained for one type of staining.
- the analysis target image Ia includes images of a plurality of cells C constituting a tissue.
- Cell regions Rc corresponding to the cells C are extracted by an appropriate image processing for region extraction.
- the cells C are represented by circles of the same size for the sake of convenience.
- the sizes and shapes of cells differ and a plurality of types of cells are possibly included in an actual tissue.
- the purpose of this processing is to calculate quantitative information of these cells C such as the types, numbers, sizes, shapes, densities, distributions in the tissue of the cells C and quantities of specific substances.
- At least one quantitative value associated with a staining density is calculated for each extracted cell region (Step S108).
- Various values quantitatively indicating how densely the cells or biological substances in the cells are stained are used as quantitative values. For example, an average density of the entire cell region, or a maximum density or average density of a region (e.g. a central part or outer peripheral part of the cell), in which a color corresponding to the staining is particularly strongly shown, in the cell region can be used as the quantitative value. In this way, how much the staining affects the individual cell region can be quantified. This value is referred to as a "staining density" below.
- a threshold for determining stained states of the cells in the tissue for the staining is determined for each specimen image (Step S109).
- the "stained state” mentioned here is an index representing whether or not the cell is stained by the staining for one type of staining.
- the staining density is a higher than a predetermined threshold, this cell is determined to be "positive” for this staining.
- the staining density is lower than the threshold, the cell is determined to be “negative” for this staining.
- Step S109 is a processing for determining a threshold for this, and the threshold determination method of the invention is applied here. Specific processing contents are described later.
- Step S110 The stained state of each cell region is determined using the threshold determined in this way. Further, cytometry is performed to obtain various pieces of quantitative information representing properties of each cell region (Step S111). Processing contents of the cytometry and types of quantitative information obtained thereby are arbitrary. Those pieces of information are used in various pathological diagnoses and researches together with the images of the tissue specimen. As just described, this embodiment belongs to an image cytometry technique for analysis in single cells without dividing a tissue specimen into individual cells.
- the threshold determination process of this embodiment is designed to enable an operation therefor to be efficiently performed while judgment by the user is made.
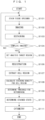
- FIG. 3 is a flow chart showing the threshold determination process of this embodiment.
- This process is a process for reducing the influence of artifacts by optimizing the threshold which is set for the staining density to determine the stained state (positive/negative) of the cells.
- this threshold determination process is performed for each of the plurality of types of staining. That is, the threshold is set for each specimen image captured using one type of staining. It is possible to simultaneously set thresholds for several types of staining in an actual process. However, a process for determining the threshold for one type of staining is first described to describe the principle below.
- This process can be realized by a processing device having an appropriate arithmetic function such as a general-purpose computer device implementing a predetermined control program.
- An arithmetic processor having the arithmetic function, a receiver for receiving an operation input from a user and a display for displaying an image are required for the processing device for this purpose.
- a processing device having a general hardware configuration such as a personal computer can be, for example, used for image processings excluding the imaging of a specimen. Thus, the device configuration for performing this process is not described in detail here.
- Step S201 a specimen image Is for each type of staining is obtained (Step S201).
- An analysis target region Ra is set in that specimen image Is (Step S202) and an analysis target image Ia is cut out.
- Cell regions Rc are extracted from the cut-out analysis target image Ia (Step S203), and a staining density is calculated for each individual cell region (Step S204).
- Step S101 to S108 in FIG. 1 and results in Steps S101 to S108 can be directly used. That is, if the process of FIG. 1 is already started and the results in Steps S101 to S108 can be used, Steps S201 to S204 can be omitted.
- Steps S 110 to S111 may be performed by omitting Steps S105 to S108 and using results of Steps S201 to S204 performed as the threshold determination process of Step S109.
- FIG. 4 is a diagram schematically showing an example of an extraction result of the cell regions.
- the analysis target image Ia is divided into cell regions Rc corresponding to the cells C and a surrounding background region.
- the analysis target image Ia is divided into cell regions Rc corresponding to the cells C and a surrounding background region.
- This mask By producing a mask for division into the cell regions Rc and the other region in this way and applying this mask to the analysis target image Ia, only image contents in the cell regions Rc can be extracted.
- the following processing for quantification is performed for each of these cell regions Rc.
- a suitable threshold is then temporarily set for the staining density (Step S205).
- the staining density which is the quantitative value associated with the previously obtained density of each cell region Rc
- the threshold the stained state of the individual cell, i.e. whether the cell is positive or negative for this staining.
- the staining density obtained for each cell region Rc and the set threshold are compared, and this cell region Rc is determined to be positive for this staining if the staining density is higher than the threshold.
- this cell region Rc is determined to be negative for this staining. If the staining density is equal to the threshold, the cell region Rc may be determined to be either positive or negative as long as determination criteria are fixed.
- the threshold at this time is a temporarily set initial value.
- the initial value may be a value determined in advance or may be a value designated by the setting of the user. Further, a calculated threshold by analyzing an image by a known image processing algorithm used in image binarization such as a discriminant analysis method or Otsu's method may be applied as the initial value.
- a determination result is displayed on an appropriate display device such as a display screen of a computer device, and presented to the user (Step S207). As illustrated next, the determination result is desirably displayed by superimposing visual information representing the determination result on the original analysis target image Ia. Further, the unprocessed original analysis target image Ia and an image representing the determination result may be displayed side by side.
- FIGS. 5A to 5D are diagrams schematically showing an example of the determination result.
- FIG. 5A is the diagram schematically showing an example of the analysis target image Ia.
- the respective cells are stained at various densities.
- the analysis target image Ia obtained by imaging this tissue specimen the respective cell regions Rc have various luminances according to the staining densities of the cells.
- Any of the cells denoted by C1 to C12 in FIG. 5A is a cell stained at a density higher than a certain level
- FIG. 5B shows the staining densities of these cells in the form of a graph.
- FIGS. 5C and 5D schematically show examples in which the analysis target image Ia shown in FIG. 5A and an image having the cells determined to be positive superimposed and added by hatching on the analysis target image Ia by an imaging processing are placed side by side.
- FIG. 5C corresponds to this state, and the respective cells listed here are hatched.
- a left figure shows an image Ia1 in which hatching representing the determination results are superimposed on the original analysis target image Ia while the density information of the cells is retained, and a right figure shows only the contours of the cells and the determination results.
- FIG. 5D corresponds to this state. Also here, a left figure shows an image Ia2 in which hatching representing the determination results is superimposed on the density information of the cells, and a right figure shows only the contours of the cells and the determination results.
- the determination results change by changing the threshold, but such a change cannot be necessarily said to be the one easily intuitively known by the user. That is, for example, if the user manually changes the set value of the threshold, the determination results change accordingly. Such changes possibly appear in various ways at various positions in the image. Thus, it is not easily for the user to confirm those changes point by point and precisely judge in a short time whether or not the threshold is changed to approach an optimal value.
- the determination result for each cell is presented to the user by screen display.
- An input to change the determination result is received and the threshold is recalculated to reflect a result of the change. That is, the threshold is corrected teaching a correct determination by the user for the cell for which it was judged that the determination result was not proper and needed to be changed. In this way, the judgment of the user having a specialized knowledge can be reflected on the threshold. Further, only the determination for which a correction is thought to be necessary by viewing the image added with the determination results may be changed without directly operating the threshold. Thus, the user can perform an operation input based on more intuitive judgment.
- Step S207 The determination results of the stained state (positive/negative) based on the current threshold are shown in the image displayed in Step S207.
- an operation input from the user is received.
- the operation input can be received from an appropriate input device such as a keyboard, a mouse or a touch panel.
- Step S208 If an operation input to the effect that no correction is necessary is received (NO in Step S208), the threshold at that time is determined as an optimal value (Step S209) and the threshold determination process is finished. On the other hand, if an input to change is made by the user, a correction is judged to be necessary (YES in Step S208). In this case, a change input is received (Step S210) until an intention to complete the input is given from the user (Step S211). If the change input by the user is completed (YES in Step S211), the threshold is reset to reflect the changed result (Step S212).
- the stained state of each cell is determined again using the reset threshold (Step S206), and that result is displayed (Step S207).
- the user can confirm the determination results based on the newly set threshold. Then, in the same way as above, the processing of changing the determination results if necessary and resetting the threshold accordingly is repeated, whereby the threshold can be approximated to the optimal value.
- a determination result display method, a specific mode of the change input by the user and a basic way of thinking of the resetting of the threshold are more specifically described. Note that an image similar to that in FIG. 5A or the like described above is used as an example of the analysis target image Ia to facilitate the understanding.
- FIGS. 6A and 6B are diagrams schematically showing an image representing determination results and an event of a change input.
- An image Ia3 shown in an upper part of FIG. 6A is an image obtained by adding determination results based on the initially set threshold Th1 to the original analysis target image Ia by hatching.
- the shade of each cell region Rc in FIG. 6A represents the staining density of the corresponding cell.
- FIG. 6B shows the staining densities of the respective cells C1 to C12 in the form of a graph, and the staining densities of those cells are the same as those shown in FIG. 5B .
- the hatched one indicates that the cell corresponding to this cell region was determined to be positive. Hatching representing positive determination is applied to the cell regions corresponding to the cells C1 to C3, C6, C8, C10 and C11 having the staining density higher than the threshold Th1. On the other hand, the cell region, which is not hatched, indicates that the cell was determined to be negative. As can be understood from FIG. 6A , the cells determined to be negative include the cells affected by the staining to a certain extent, but having a density lower than the threshold, in addition to the cells not stained at all or hardly stained.
- the image displayed in Step S206 may be an image obtained by superimposing and adding information representing the determination results on the original analysis target image Ia as illustrated here or may be an image showing only the determination results.
- the unprocessed analysis target image Ia and the image Ia3 representing the determination results are more preferably displayed side by side to facilitate the user's observation.
- the displayed image may be such an image that the unprocessed analysis target image Ia and the image Ia3 obtained by superimposing the determination results on the analysis target image Ia are placed side by side.
- the user can perform a change input of the determination result for the image having the positive/negative determination result added to each cell region in this way. Specifically, the user can designate the cell whose determination result is desired to be changed, using a pointer or marker denoted by 61 in FIG. 6A in a screen. Here, the cell region corresponding to the cell C7 is designated. By performing an operation such as the click of the mouse in this state, the user can express an intention to change the determination.
- various automatic calculation methods to divide a region into two in a distribution indicated by the staining density of each cell can be applied.
- SVM support vector machine
- machine learning method it is also possible to apply fine tuning to perform additional learning using data changed by the user from an already learned state.
- the results of the redetermination based on the new threshold are displayed (Steps S207, S208).
- visual information different from the other cell regions is preferably given to facilitate the finding. For example, it is possible to enhance the contour of this cell region, blink this cell region or temporally alternately display the previous determination result and the new determination result. In this way, the cell whose determination was changed can be easily found by the user.
- An image representing the previous determination results and an image representing the new determination results may be displayed side by side.
- an image to be displayed preferably has a high magnification.
- an image having a lower magnification is preferable.
- a high-magnification image and a low-magnification image, in each of which the determination results are superimposed may be selectively or simultaneously displayed.
- the visual field of the low-magnification image includes the entire visual field of the high-magnification image, in other words, the high-magnification image is an image obtained by enlarging a part of the low-magnification image.
- an image Ia5 shown in FIG. 7A cells stained at various densities by the staining A are distributed mainly in a left-upper side of FIG. 7A .
- an image Ia6 shown in FIG. 7B cells stained by the staining B are distributed mainly in a right-lower side of FIG. 7B .
- an image obtained by superimposing and displaying results of determination of the stained states performed with an appropriate threshold temporarily set for each of the staining A and the staining B is an image Ia7 shown in an upper part of FIG. 7C .
- the threshold for this staining is recalculated and a new threshold is set.
- a specific method for that is as described above.
- the current threshold can be determined as an optimal value for this staining.
- the determinations can be changed for either one of the staining A and the staining B here, it may be designed to make the determinations changeable only for one type of staining. For example, with the threshold already optimized for the staining A, it is not preferable to change the determination results of the staining A to determine the threshold for the staining B. In this case, changes can be prohibited for the staining A.
- FIGS. 8A and 8B are diagrams showing examples of an interface screen when a plurality of determination results are combined and a change input is received. If the cell, for which the user desires to check the determination result, is designated by the pointer 61 by a mouse operation or the like as shown in FIG. 8A , the determination result in this cell is pop-up displayed. In this example, the cell C33 is designated, and check boxes of both the staining A and the staining B are checked on a pop-up window P. This means that the determination result was positive in each of the staining A and the staining B.
- the analysis target region can be, for example, divided as follows.
- Various region division methods can be used as a method for automatic division by an image processing.
- an image in the analysis target region can be smoothened by low-pass filtering and the image can be divided into a plurality of regions based on density differences.
- a method for extracting a region, in which stained cells are present at a high density, from an image of a specimen having a protein expressed in cells known to be present in a specific region stained and dividing the specimen image into the extracted region and the other region is thought as a specific method.
- the analysis target region Ra may be automatically determined from the specimen image Is.
- the specimen image Is may be automatically divided into several blocks of the same size, a priority order may be provided for those block images, and the block images may be successively presented as the analysis target region Ra. In this case, it is effective in reducing the influence of artifacts to preferentially set the block possibly including many artifacts as the analysis target region.
- Steps S201 to S203 correspond to a "region specification step” of the invention and Steps S205 to S206 correspond to a “determination step” of the invention.
- Steps S207 to S211 correspond to a "receiving step” of the invention and Step S212 corresponds to a "resetting step” of the invention.
- Step S207 performed after the execution of Step S212 corresponds to a "re-display step” of the invention.
- the staining A serves as a basis
- a method can be adopted which optimizes the threshold for the staining A, taking into account results of the staining B, staining C and the like and optimizes a threshold for another type of staining on the basis of the optimized threshold. Note that there may be a plurality of types of staining serving as a basis.
- the user interface shown in the above embodiment is an example.
- the method for presenting the determination results to the user and the method for receiving an operation input from the user are not limited to the above ones and arbitrary methods can be used.
- the determination step, the receiving step and the resetting step may be performed for each of the plurality of types of immunohistostaining.
- the threshold is preferably reset such that a divergence between the determination result obtained by performing the determination step based on the reset threshold and the determination result after the change based on the operation input is smaller than a divergence between the determination result in the previous determination step performed based on the temporarily set threshold and the determination result after the change based on the operation input. According to such a configuration, the determination result close to the subjective judgment of the user can be obtained by resetting the threshold.
- the image to be processed may be divided into a plurality of regions and thresholds may be individually set for the plurality of regions. Even the same cell may possibly have different stained states in some cases, such as depending on a state of the surrounding tissue, specific structures formed and the like. By setting the threshold for each of the plurality of divided regions of the image to be processed, a proper determination can be made regardless of such differences in the stained state.
- a result display step may be provided in which the determination step is performed based on the reset threshold and a new determination result is displayed.
- the user can verify an adjustment result by presenting the determination results based on the reset threshold to the user.
- the determination step, the receiving step and the resetting step may be performed again based on the reset threshold. According to such a configuration, by repeating the resetting and verification of the threshold and the readjustment of the threshold based on that, the threshold can be made closer to an optimal value.
- This invention is applicable to the determination of a stained state based on an image obtained by imaging an immunohistostained tissue specimen in the research fields of medicine and biology. Particularly, this invention is suitable for application of analyzing a multiple immunostained specimen in single cells.
Landscapes
- Engineering & Computer Science (AREA)
- Computer Vision & Pattern Recognition (AREA)
- Theoretical Computer Science (AREA)
- General Physics & Mathematics (AREA)
- Physics & Mathematics (AREA)
- Medical Informatics (AREA)
- Quality & Reliability (AREA)
- Radiology & Medical Imaging (AREA)
- Nuclear Medicine, Radiotherapy & Molecular Imaging (AREA)
- Health & Medical Sciences (AREA)
- General Health & Medical Sciences (AREA)
- Investigating Or Analysing Biological Materials (AREA)
- Investigating Or Analysing Materials By Optical Means (AREA)
- Image Analysis (AREA)
Applications Claiming Priority (2)
| Application Number | Priority Date | Filing Date | Title |
|---|---|---|---|
| JP2021020829A JP7653267B2 (ja) | 2021-02-12 | 2021-02-12 | 閾値決定方法 |
| PCT/JP2022/004247 WO2022172852A1 (fr) | 2021-02-12 | 2022-02-03 | Procédé de détermination de valeur seuil |
Publications (2)
| Publication Number | Publication Date |
|---|---|
| EP4293616A1 true EP4293616A1 (fr) | 2023-12-20 |
| EP4293616A4 EP4293616A4 (fr) | 2025-01-01 |
Family
ID=82837839
Family Applications (1)
| Application Number | Title | Priority Date | Filing Date |
|---|---|---|---|
| EP22752679.5A Pending EP4293616A4 (fr) | 2021-02-12 | 2022-02-03 | Procédé de détermination de valeur seuil |
Country Status (4)
| Country | Link |
|---|---|
| US (1) | US12505542B2 (fr) |
| EP (1) | EP4293616A4 (fr) |
| JP (1) | JP7653267B2 (fr) |
| WO (1) | WO2022172852A1 (fr) |
Families Citing this family (4)
| Publication number | Priority date | Publication date | Assignee | Title |
|---|---|---|---|---|
| JP2024016378A (ja) * | 2022-07-26 | 2024-02-07 | 株式会社Screenホールディングス | 解析支援方法、プログラムおよび解析支援装置 |
| JP2024118806A (ja) * | 2023-02-21 | 2024-09-02 | 株式会社Screenホールディングス | 画像表示方法、画像表示装置およびプログラム |
| JP2024135131A (ja) * | 2023-03-22 | 2024-10-04 | 株式会社Screenホールディングス | 領域選定支援方法、領域選定支援装置およびプログラム |
| JP2025044522A (ja) | 2023-09-20 | 2025-04-02 | 株式会社Screenホールディングス | 染色強度取得方法、プログラムおよび染色強度取得装置 |
Family Cites Families (8)
| Publication number | Priority date | Publication date | Assignee | Title |
|---|---|---|---|---|
| GB0410499D0 (en) | 2004-05-11 | 2004-06-16 | Fairfield Imaging Ltd | Method and apparatus for use in the image analysis of biological specimens |
| KR20090074155A (ko) | 2006-08-04 | 2009-07-06 | 아이코니시스 인코포레이티드 | 현미경 시스템의 이미지 처리 방법 |
| JP2010252648A (ja) | 2009-04-22 | 2010-11-11 | Olympus Corp | 細胞解析方法 |
| US20100303809A1 (en) * | 2009-06-01 | 2010-12-02 | Targeted Molecular Diagnostics, Llc | Methods for the detection and quantitation of pten |
| EP2845139A2 (fr) | 2012-04-30 | 2015-03-11 | General Electric Company | Systèmes et méthodes pour effectuer une analyse de corrélation sur un résultat clinique et des caractéristiques d'un tissu biologique |
| JP6355476B2 (ja) | 2014-08-18 | 2018-07-11 | 株式会社Screenホールディングス | 閾値決定方法、画像処理方法および画像処理装置 |
| CA3012360C (fr) * | 2016-03-01 | 2021-12-14 | Ventana Medical Systems, Inc. | Algorithmes d'analyse d'image ameliores au moyen de lames de controle |
| US12039796B2 (en) * | 2019-02-01 | 2024-07-16 | Sartorius Bioanalytical Instruments, Inc. | Method for classifying cells |
-
2021
- 2021-02-12 JP JP2021020829A patent/JP7653267B2/ja active Active
-
2022
- 2022-02-03 WO PCT/JP2022/004247 patent/WO2022172852A1/fr not_active Ceased
- 2022-02-03 EP EP22752679.5A patent/EP4293616A4/fr active Pending
- 2022-02-03 US US18/276,535 patent/US12505542B2/en active Active
Also Published As
| Publication number | Publication date |
|---|---|
| EP4293616A4 (fr) | 2025-01-01 |
| JP2022123488A (ja) | 2022-08-24 |
| JP7653267B2 (ja) | 2025-03-28 |
| WO2022172852A1 (fr) | 2022-08-18 |
| US20230419483A1 (en) | 2023-12-28 |
| US12505542B2 (en) | 2025-12-23 |
Similar Documents
| Publication | Publication Date | Title |
|---|---|---|
| EP4293616A1 (fr) | Procédé de détermination de valeur seuil | |
| US11288795B2 (en) | Assessing risk of breast cancer recurrence | |
| US10733726B2 (en) | Pathology case review, analysis and prediction | |
| US8831327B2 (en) | Systems and methods for tissue classification using attributes of a biomarker enhanced tissue network (BETN) | |
| Bray et al. | Using CellProfiler for automatic identification and measurement of biological objects in images | |
| JP6163152B2 (ja) | 細胞におけるバイオマーカーの発現の積率による解析 | |
| JP2022527145A (ja) | 予測的組織パターン特定のためのマルチプルインスタンスラーナ | |
| JP7749461B2 (ja) | 距離に基づく組織状態の決定 | |
| AU2013255961B2 (en) | Systems and methods for performing quality review scoring of biomarkers and image analysis methods for biological tissue | |
| US20130286038A1 (en) | Systems and methods for selection and display of multiplexed images of biological tissue | |
| JP2018504674A (ja) | 早期癌予知のための計算病理学システム及び方法 | |
| JP2018512072A (ja) | 自動化スライド全域解析の品質管理 | |
| Ozcan et al. | Automated detection of soma location and morphology in neuronal network cultures | |
| Ferrer‐Font et al. | Ensuring full spectrum flow cytometry data quality for high‐dimensional data analysis | |
| Rexhepaj et al. | A texture based pattern recognition approach to distinguish melanoma from non-melanoma cells in histopathological tissue microarray sections | |
| Irvine et al. | Automation of flow cytometry data analysis with elastic image registration | |
| Baird et al. | Multiplex: From Acquisition to Analysis | |
| Cao et al. | Pattern recognition in high-content cytomics screens for target discovery-case studies in endocytosis | |
| Buckup et al. | MARQO pipeline resolves multiparametric cellular and spatial organization in cancer tissue lesions | |
| Dai | Integrated multiparametric deep spatial phenotyping of mouse models of lung adenocarcinoma | |
| CN120766280A (zh) | Myc断裂阳性多发性骨髓瘤单细胞图像的分析方法和设备 | |
| Diagnostics | DIGITAL PATHOLOGY IN MEDICAL IMAGING | |
| Wall | Integration of Genetic Biomarkers in Prognostic Models for Breast Cancer Survival |
Legal Events
| Date | Code | Title | Description |
|---|---|---|---|
| STAA | Information on the status of an ep patent application or granted ep patent |
Free format text: STATUS: THE INTERNATIONAL PUBLICATION HAS BEEN MADE |
|
| PUAI | Public reference made under article 153(3) epc to a published international application that has entered the european phase |
Free format text: ORIGINAL CODE: 0009012 |
|
| STAA | Information on the status of an ep patent application or granted ep patent |
Free format text: STATUS: REQUEST FOR EXAMINATION WAS MADE |
|
| 17P | Request for examination filed |
Effective date: 20230808 |
|
| AK | Designated contracting states |
Kind code of ref document: A1 Designated state(s): AL AT BE BG CH CY CZ DE DK EE ES FI FR GB GR HR HU IE IS IT LI LT LU LV MC MK MT NL NO PL PT RO RS SE SI SK SM TR |
|
| P01 | Opt-out of the competence of the unified patent court (upc) registered |
Effective date: 20231222 |
|
| DAV | Request for validation of the european patent (deleted) | ||
| DAX | Request for extension of the european patent (deleted) | ||
| A4 | Supplementary search report drawn up and despatched |
Effective date: 20241203 |
|
| RIC1 | Information provided on ipc code assigned before grant |
Ipc: G01N 1/30 20060101ALI20241127BHEP Ipc: G01N 21/27 20060101ALI20241127BHEP Ipc: G01N 33/53 20060101ALI20241127BHEP Ipc: G01N 33/483 20060101ALI20241127BHEP Ipc: G01N 33/48 20060101ALI20241127BHEP Ipc: G06T 7/00 20170101AFI20241127BHEP |