EP4312184A1 - Bewertung des risikos einer stenoseprogression - Google Patents
Bewertung des risikos einer stenoseprogression Download PDFInfo
- Publication number
- EP4312184A1 EP4312184A1 EP22187680.8A EP22187680A EP4312184A1 EP 4312184 A1 EP4312184 A1 EP 4312184A1 EP 22187680 A EP22187680 A EP 22187680A EP 4312184 A1 EP4312184 A1 EP 4312184A1
- Authority
- EP
- European Patent Office
- Prior art keywords
- vessel
- stent
- progression risk
- image data
- values
- Prior art date
- Legal status (The legal status is an assumption and is not a legal conclusion. Google has not performed a legal analysis and makes no representation as to the accuracy of the status listed.)
- Withdrawn
Links
Images



Classifications
-
- G—PHYSICS
- G06—COMPUTING OR CALCULATING; COUNTING
- G06T—IMAGE DATA PROCESSING OR GENERATION, IN GENERAL
- G06T7/00—Image analysis
- G06T7/0002—Inspection of images, e.g. flaw detection
- G06T7/0012—Biomedical image inspection
-
- G—PHYSICS
- G06—COMPUTING OR CALCULATING; COUNTING
- G06T—IMAGE DATA PROCESSING OR GENERATION, IN GENERAL
- G06T2200/00—Indexing scheme for image data processing or generation, in general
- G06T2200/24—Indexing scheme for image data processing or generation, in general involving graphical user interfaces [GUIs]
-
- G—PHYSICS
- G06—COMPUTING OR CALCULATING; COUNTING
- G06T—IMAGE DATA PROCESSING OR GENERATION, IN GENERAL
- G06T2207/00—Indexing scheme for image analysis or image enhancement
- G06T2207/10—Image acquisition modality
- G06T2207/10072—Tomographic images
-
- G—PHYSICS
- G06—COMPUTING OR CALCULATING; COUNTING
- G06T—IMAGE DATA PROCESSING OR GENERATION, IN GENERAL
- G06T2207/00—Indexing scheme for image analysis or image enhancement
- G06T2207/10—Image acquisition modality
- G06T2207/10116—X-ray image
-
- G—PHYSICS
- G06—COMPUTING OR CALCULATING; COUNTING
- G06T—IMAGE DATA PROCESSING OR GENERATION, IN GENERAL
- G06T2207/00—Indexing scheme for image analysis or image enhancement
- G06T2207/30—Subject of image; Context of image processing
- G06T2207/30004—Biomedical image processing
- G06T2207/30101—Blood vessel; Artery; Vein; Vascular
- G06T2207/30104—Vascular flow; Blood flow; Perfusion
Definitions
- the present disclosure relates to evaluating stenosis progression risk for a vessel.
- a system, a computer-implemented method, and a computer program product, are disclosed.
- Vascular stenosis is a term used to describe the narrowing of a blood vessel lumen.
- Vascular stenoses can occur in arteries as well as in veins, and have the effect of limiting blood flow in the vessel.
- Vascular stenoses can occur in various parts of the body, and have various associated causes.
- atherosclerosis is a condition in which plaque builds up in the arteries, reducing the diameter of the arterial lumen. This reduces the supply of blood to tissues in the body.
- Atherosclerosis has various names, depending on the arteries that are affected.
- CAD obstructive coronary artery disease
- PED peripheral artery disease
- a stenosis in the coronary arteries due to CAD can result in coronary ischemia, i.e. a starvation of the blood supply to tissue, in this case to the heart muscle, ultimately resulting in the death of muscle cells.
- coronary ischemia i.e. a starvation of the blood supply to tissue, in this case to the heart muscle, ultimately resulting in the death of muscle cells.
- This is commonly known as a heart attack, or myocardial infarction. Consequently, there is interest in determining the risk of a vessel becoming stenosed, or narrowing, over time, i.e. the stenosis progression risk for a vessel in the vasculature.
- Balloon angioplasty is performed by threading a catheter with a balloon at its distal end through the vasculature to the position of the stenosis. At this position, the balloon is expanded in order to open-up the vessel, and thereby restore blood flow. Balloon angioplasty can be performed with, or without, the use of a stent. If the procedure is performed without the use of a stent, the balloon is then contracted and withdrawn from the body, leaving the vessel to maintain its expanded state of its own accord.
- PCI percutaneous coronary intervention
- the stent is positioned so as to overlap with the stenosis and the balloon is expanded within the stent. Upon expansion, the stent opens-up the vessel, restoring blood flow. After the stent has been expanded, the balloon is contracted and removed from the vessel, whereupon the vessel is maintained in its expanded state by the stent.
- the blood vessel lumen may subsequently contract over time.
- a subsequent contraction of the blood vessel lumen is known as "restenosis", or “in-stent restenosis” if it occurs in a vessel that has a stent.
- both restenosis and in-stent restenosis can again cause medical complications such as coronary ischemia, resulting in the need to repeat the treatment procedure, i.e. the need to perform a so-called "secondary PCI" procedure. This is inefficient, and incurs additional risks to the patient.
- secondary PCI so-called
- NIH neo-intimal hyperplasia
- IEL internal elastic lamina
- ECM extracellular matrix
- a system for evaluating stenosis progression risk for a vessel includes one or more processors configured to:
- stenosis progression risk values are calculated at positions along the vessel based on the vessel wall shear stress values, and a stenosis progression risk map for the vessel is outputted that includes the stenosis progression risk values, the system provides spatial information on the risk of a vessel becoming stenosed over time. A physician may then use this spatial information to assess the need to treat the vessel.
- the vessel is a coronary artery.
- the vessel may in general be any artery or vein that is disposed anywhere in the vasculature.
- the system may be used to evaluate stenosis progression risk for a vessel in the brain, or in the arm, or the leg, and so forth.
- the computer-implemented methods disclosed herein may be provided as a non-transitory computer-readable storage medium including computer-readable instructions stored thereon, which, when executed by at least one processor, cause the at least one processor to perform the method.
- the computer-implemented methods may be implemented in a computer program product.
- the computer program product can be provided by dedicated hardware, or hardware capable of running the software in association with appropriate software.
- the functions of the method features can be provided by a single dedicated processor, or by a single shared processor, or by a plurality of individual processors, some of which can be shared.
- the functions of one or more of the method features may for instance be provided by processors that are shared within a networked processing architecture such as a client/server architecture, a peer-to-peer architecture, the Internet, or the Cloud.
- processor or “controller” should not be interpreted as exclusively referring to hardware capable of running software, and can implicitly include, but is not limited to, digital signal processor "DSP” hardware, read only memory “ROM” for storing software, random access memory “RAM”, a non-volatile storage device, and the like.
- DSP digital signal processor
- ROM read only memory
- RAM random access memory
- examples of the present disclosure can take the form of a computer program product accessible from a computer-usable storage medium, or a computer-readable storage medium, the computer program product providing program code for use by or in connection with a computer or any instruction execution system.
- a computer-usable storage medium or a computer readable storage medium can be any apparatus that can comprise, store, communicate, propagate, or transport a program for use by or in connection with an instruction execution system, apparatus, or device.
- the medium can be an electronic, magnetic, optical, electromagnetic, infrared, or a semiconductor system or device or propagation medium.
- Examples of computer-readable media include semiconductor or solid state memories, magnetic tape, removable computer disks, random access memory "RAM”, read-only memory "ROM”, rigid magnetic disks and optical disks. Current examples of optical disks include compact disk-read only memory "CD-ROM”, compact disk-read/write "CD-R/W”, Blu-Ray TM and DVD
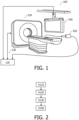
- Fig. 1 is a schematic diagram illustrating an example of a system 100 for evaluating stenosis progression risk for a vessel, in accordance with some aspects of the present disclosure.
- Fig. 2 is a flowchart illustrating an example of a method of evaluating stenosis progression risk for a vessel, in accordance with some aspects of the present disclosure. It is noted that operations described as being performed by the one or more processors of the system 100 illustrated in Fig. 1 , may also be performed in method illustrated in Fig. 2 , and vice versa.
- the system 100 for evaluating stenosis progression risk for a vessel 110 comprises one or more processors 120 configured to:
- stenosis progression risk values are calculated at positions along the vessel based on the vessel wall shear stress values, and a stenosis progression risk map for the vessel is outputted that includes the stenosis progression risk values, the system provides spatial information on the risk of a vessel becoming stenosed over time. A physician may then use this spatial information to assess the need to treat the vessel.
- the one or more processors 120 are configured to receive angiographic image data 130 representing a vessel 110.
- the angiographic image data 130 that is received in the operation S110 may in general be projection data, i.e. data representing a 2D image of the vessel, or alternatively it may be volumetric data, i.e. data representing a 3D image of the vessel 110. In the latter case the data may be raw data, i.e. data that has not been reconstructed into a 3D image, or alternatively the data may be reconstructed image data.
- projection data i.e. data representing a 2D image of the vessel
- volumetric data i.e. data representing a 3D image of the vessel 110.
- the data may be raw data, i.e. data that has not been reconstructed into a 3D image, or alternatively the data may be reconstructed image data.
- volumetric data provides additional detail on the vessel geometry, and which when extracted from the volumetric data in the operation S120 provides a more accurate model of the vessel 110.
- the angiographic image data 130 may be generated by a projection X-ray imaging system, or a computed tomography "CT" imaging system, or a magnetic resonance imaging system.
- the angiographic image data 130 may therefore be projection X-ray attenuation data, volumetric X-ray attenuation data, or magnetic resonance data, respectively.
- the angiographic image data 130 is generated by a projection X-ray imaging system, or a CT imaging system
- various types of imaging systems may be used, including a spectral X-ray or CT imaging system, a cone beam (spectral) CT imaging system, a photon counting (spectral) CT imaging system, a dark-field (spectral) CT imaging systems, and a phase contrast (spectral) CT imaging system.
- the angiographic image data 130 is generated by a CT imaging system 230.
- the angiographic image data 130 that is received in the operation S110 represents the vessel 110.
- the angiographic image data 130 may be generated subsequent to the injection of a contrast agent into the vasculature.
- the contrast agent may be injected using an injector, such as the injector 220 illustrated in Fig. 1 , for example.
- the contrast agent may include a substance such as iodine, or a Lanthanide such as gadolinium, or another substance that provides visibility of a vessel through which the contrast agent passes.
- the one or more processors 120 are configured to calculate S120 vessel wall shear stress values 140 at a plurality of positions along the vessel 110 based on a simulation of blood flow 150 in a model 160 of the vessel extracted from the angiographic image data 130.
- the model 160 is a geometric representation of the vessel 110.
- An example of a model 160 of a vessel 110 that has been extracted from angiographic image data is illustrated in Fig. 3 , which is a schematic diagram illustrating an example of a) a simulation of blood flow velocity 150 in a model 160 of a vessel 110, b) calculated vessel wall shear stress values 140 in the model 160 of the vessel 110, and c) a stenosis progression risk map 180 for the vessel 110 including calculated stenosis progression risk values 170, in accordance with some aspects of the present disclosure.
- the model 160 may be extracted from the angiographic image data 130 using various techniques.
- an image segmentation technique is used to extract the model 160 of the vessel 110 from the angiographic image data 130. Segmentation techniques such as model-based segmentation, watershed-based segmentation, region growing or level sets or graphcuts, may be used for this purpose.
- the angiographic image data 130 includes projection data
- the model 160 of the vessel 110 may be provided by segmenting the projection data.
- the model includes volumetric data
- a volumetric image may be reconstructed from the data, following which, the reconstructed volumetric image may be segmented in order to provide a model of the vessel.
- Various known image reconstruction techniques may be used to reconstruct the volumetric image.
- the angiographic image data 130 is pre-processed prior to segmentation in order to improve the visibility of the vessel.
- a digital subtraction angiography "DSA" technique may be used wherein a background image representing the vessel that is generated prior to the injection of a contrast agent is subtracted from an image representing the vessel that is acquired after the injection of the contrast agent. The result is to provide a subtraction image in which image data for the background structures has been removed, and in which the visibility of the vessel is improved.
- the angiographic image data 130 is generated by a spectral X-ray or CT imaging system
- various material decomposition techniques may be used to extract data for the contrast agent from the angiographic image data 130, and to thereby improve the visibility of the vessel 110.
- a simulation of blood flow 150 in the model 160 is then performed.
- the simulation may be performed by describing the blood flow in the vessel using the Navier-Stokes equations, and solving these equations using a computational fluid dynamics "CFD" approach.
- Methodology of blood flow modelling in the vasculature are described in a document by Gijsen, F. et al. This document gives also overview of techniques for solving the Navier Stokes equation, and for ultimately providing a velocity profile of the blood flow in the model of the vessel.
- the result of the simulation of the blood flow is to provide a distribution of the blood flow velocity along the model of the vessel 110.
- An example of the simulated blood flow 150 for the vessel 110 is illustrated in Fig. 3a .
- the simulation is performed using boundary conditions for blood flow parameters such as the blood velocity and the blood pressures. Values for the boundary conditions may be estimated based on the geometry of the vessel in the angiographic image data, or based on typical values expected for the subject based on characteristics such as age, gender, and so forth. Alternatively, values for the boundary conditions may be measured in the subject to which the vessel pertains using intravascular devices such as a pressure wire, or a flow wire.
- vessel wall shear stress values 140 are calculated from at a plurality of positions along the vessel 110 based on the simulation of the blood flow 150.
- the vessel wall shear stress is defined as the tangential component of force that is exerted on the vessel wall by blood flowing in the vessel.
- wall shear stress has a major impact on endothelial function and plays a key role in atherosclerotic disease development and in long-term evolution and healing of vessels treated by intravascular devices.
- Wall shear stress is orders of magnitude smaller than other mechanical stresses affecting the coronary arteries, such as tensile stress or compressive stress and exerts its powerful vascular effects not by a mechanical impact on vascular structure per se, but uniquely by triggering biologic signalling.
- vessel wall shear stress values 140 are calculated from the local blood velocity distribution in a patient-specific vessel geometry.
- An example of the vessel wall shear stress values 140 that are calculated from the blood flow velocity illustrated in Fig. 3a is illustrated in Fig. 3b .
- the blood flow velocity is calculated for a static vessel 110.
- the blood flow velocity, and the wall shear stress have a single value at each position along the vessel 110, as illustrated in Fig. 3a and Fig. 3b .
- the angiographic image data includes a temporal sequence of images representing the vessel over time, and the temporal sequence of images is used to generate temporal values for the vessel wall shear stress values.
- the received angiographic image data comprises a temporal sequence of images representing a motion of the vessel over at least a portion of a cardiac cycle
- the calculated vessel wall shear stress values comprise temporal values calculated based on a shape of the lumen of the vessel at the positions along the vessel in the images in the temporal sequence.
- the one or more processors are configured to calculate the stenosis progression risk values, using the temporal values of the vessel wall shear stress. Changes in the shape of the vessel's lumen during the cardiac cycle affect the blood flow velocity, and also its profile, and this gives rise to changes in the wall shear stress.
- the shape of the vessel's lumen may be determined by segmenting volumetric angiographic image data 130.
- the temporal values of the vessel wall shear stress are determined by extracting a geometric model of the vessel from each of multiple images in the temporal sequence. The model may be extracted using the techniques described above. A simulation of the blood flow is performed in each of the models in order to calculate the temporal values for the wall shear stress. In this example, in the operation S130, the temporal values of the vessel wall shear stress are then used to calculate S130 stenosis progression risk values 170.
- This may be performed by calculating the average vessel wall shear stress from the temporal values or using the temporal sequence of values of the vessel wall shear stress, resulting in a single stenosis progression risk value or a temporal sequence of stenosis progression risk value, respectively.
- the one or more processors 120 are configured to calculate stenosis progression risk values 170 at the positions along the vessel 110 based on the vessel wall shear stress values 140.
- the stenosis progression risk is defined as the probability of a vessel's lumen narrowing to a predetermined proportion of its current diameter within a given period of time.
- the stenosis progression risk may be defined for a period of time, such as a number of minutes, hours, days, weeks, and so forth.
- the stenosis progression risk may be defined as the risk of a vessel lumen diameter reducing to 50 % of its current diameter.
- the stenosis progression risk may for example be defined as the risk of a vessel lumen diameter reducing to 50 % of its current diameter within one year.
- the stenosis progression risk values 170 may be calculated based on the vessel wall shear stress values 140 using a predetermined relationship 190 between the value of the stenosis progression risk 170 and the value of the vessel wall shear stress 140.
- the predetermined relationship may be stored in the form of a lookup table, or a database.
- the lookup table or database may be interrogated the one or more processors 120 in order to determine the values of the stenosis progression risk.
- the predetermined relationship may be represented by a mathematical function and evaluated by the one or more processors 120 for a desired value of the vessel wall shear stress.
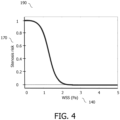
- Fig. 4 is a graph illustrating an example of a relationship 190 between the value of the stenosis progression risk 170 and the value of the vessel wall shear stress 140, in accordance with some aspects of the present disclosure.
- the graph illustrated in Fig. 4 associates a relatively lower value of the wall shear stress, WSS, with a relatively higher value of the stenosis progression risk, and vice versa.
- low wall shear stress i.e.
- WSS values less than approximately 1 Pa is associated with a risk for (re)stenosis and inflammatory response; high risk being associated with wall shear stress values that are less than approximately 0.5 Pa, and medium-to-high risk being associated with wall shear stress values that are less than approximately 1 Pa.
- High values of wall shear stress i.e. WSS values greater than approximately 2 Pa
- Very high values of wall shear stress i.e. WSS values greater than approximately 7 Pa
- Highly fluctuating disturbed blood flow with frequencies that are greater than approximately 2 Hz are considered to risk causing an inflammatory response.
- the predetermined relationship 190 represents the value of the stenosis progression risk 170 as a continuous function of the value of the vessel wall shear stress 140.
- An example of such a continuous function is illustrated in Fig. 3 .
- the predetermined relationship 190 is based on subject age and/or subject gender.
- the graph illustrated in Fig. 4 may be shifted along the horizontal axis, or it may have a different gradient in the transition region between low risk values and high risk values, for subjects having different ages, and different genders.
- the one or more processors may therefore access a predetermined relationship 190 based on the age and/or gender of a subject to which the vessel pertains, in order to evaluate the values for the stenosis progression risk.
- the one or more processors 120 are configured to output S140 a stenosis progression risk map 180 for the vessel 110.
- the stenosis progression risk map comprises a graphical representation of the vessel including the stenosis progression risk values 170.
- the stenosis progression risk map may include a two-dimensional, or a three-dimensional graphical representation of the vessel.
- the graphical representation of the vessel is generated from the angiographic image data 130.
- the graphical representation of the vessel may be provided by the model 160, or it may be provided by reconstructing, or displaying, the angiographic image data 130 in another manner.
- a projection image may be generated from the angiographic image data 130, or another reconstruction technique may be used to generate a different reconstructed image from the angiographic image data.
- the graphical representation of the vessel may be provided by another type of image data for the vessel, such as e.g. intravascular ultrasound "IVUS" image data, or by a schematic representation of the vessel 110.
- the stenosis progression risk values 170 may be overlaid on the graphical representation of the vessel in order to provide the stenosis progression risk map, for example.
- FIG. 3c An example of a stenosis progression risk map 180 is illustrated in Fig. 3c .
- the graphical representation of the vessel is provided by the model 160, and the model is overlaid with colour-coded values for the stenosis progression risk, as indicated by the "Risk factor" scale in the bottom portion of Fig. 3c .
- the stenosis progression risk has been evaluated as relatively low for the left-hand, and the right-hand portions of the vessel 110. However, a relatively high risk has been identified in the central portion of the vessel. A physician may subsequently use the stenosis progression risk map 180 to determine which portions of the vessel require treatment.
- the wall shear stress values are used to predict an amount of tissue growth, or an amount of remodelling of the vessel 110.
- wall shear stress is in general considered to play a continuous role in the growth, remodelling, and also maintenance of the vascular system.
- tissue growth in the vessel refers to additional tissue being created in or on the existing vessel wall in the form of ECM and cell proliferation
- remodelling refers to structural and functional changes of the vessel wall tissue through reorganization and/or transformation.
- the wall shear stress is used to provide a stenosis progression risk map for a future point in time.
- the one or more processors 120 are further configured to:
- FIG. 5 is a schematic diagram illustrating an example of a) a simulation of blood flow velocity 150' in an updated model 160' of a vessel 110 at a future point in time ti, b) calculated vessel wall shear stress values 140' in the updated model 160' of the vessel 110 at the future point in time ti, and c) a stenosis progression risk map 180' for the vessel 110 including calculated stenosis progression risk values 170' at the future point in time ti, in accordance with some aspects of the present disclosure.
- the amount of tissue growth and remodelling in the vessel 110 may be estimated from the vessel wall shear stress values 140, e.g. by reducing the local lumen diameter in the vessel until critical WSS values typical for erosion are reached (typically in the range of 2-7 Pa).
- the amount of tissue growth and remodelling take into account the interaction between various cellular processes, that are driven by the inflammatory response as a function of vessel wall shear stress, age, gender, and co-morbidities.
- the model 160 of the vessel that was generated from the angiographic image data 130 is then updated using the predicted amount of tissue growth and/or the predicted amount of remodelling. This provides a patient-specific prediction of the stenosis progression risk for the vessel 110.
- the updating of the model may be performed by e.g.
- adjusting the geometric representation of the vessel 110 such that it reflects the predicted amount of tissue growth and/or the predicted amount of remodelling, at the future point in time, ti.
- An example of an updated model 160' that has been updated using this approach is illustrated in Fig. 5a .
- the predicted remodelling has resulted in a reduction of the cross sectional area of the vessel lumen, i.e. a stenosis, in the central portion.
- Fig. 5a the simulated blood flow velocity 150' is illustrated, and in this example the blood flow has increased in the central portion A - A' as a consequence of the stenosis.
- the wall shear stress values 140' in the updated model 160' of the vessel 110 that result from the simulated blood flow velocity 150' illustrated in Fig. 5a are illustrated in Fig. 5b .
- the resulting stenosis progression risk map 180' for the vessel 110 is illustrated in Fig. 5c , this being obtained from the wall shear stress values 140' using the relationship 190 illustrated in Fig. 4 .
- the stenosis progression risk map 180' for the vessel 110 illustrated in Fig. 5c may be used by a physician to determine how the growth and remodelling of the vessel affects the stenosis progression risk for the vessel over time, and consequently to determine for which portion of the vessel 110, and at what future point in time ti, a potential treatment procedure should be performed.
- the predicting, the updating, the repeating, and the outputting may be performed iteratively to provide a stenosis progression risk map for the vessel 110 for each of a plurality of future points in time.
- the accumulated tissue growth and/or the accumulated amount of tissue remodelling may be accounted-for, thereby providing a more accurate stenosis progression risk map for the vessel 110 at each of the future points in time.
- the stenosis progression risk map for a future point in time ti may subsequently be used to output a value of a time at which the value of the stenosis progression risk 170' reaches a predetermined value at a position A - A' in the vessel 110.
- the time at which the stenosis progression risk reaches 75 % may be outputted for a desired position. This may reflect e.g. a 75 % probability that a dimension of the lumen of the vessel 110 will reduce to e.g. 50 % of its current cross sectional area.
- the stenosis progression risk map for a future point in time ti may be used to output a value of a time at which the value of a dimension of the lumen of the vessel 110 reaches a predetermined value at a position A - A' in the vessel 110.
- the time may be outputted for which a cross sectional area of the lumen of the vessel 110 is expected to reach 50 % of its current value.
- a physician may subsequently use this information to determine when a potential treatment procedure may be required for the vessel 110.
- the one or more processors may be configured to perform the operations of calculating S120 vessel wall shear stress values 140, calculating S130 stenosis progression risk values 170, 170', and outputting a stenosis progression risk map 180, 180', for a vessel that does not include a stent.
- Fig. 6 is an example of a stenosis progression risk map 180 for a vessel 110 that does not include a stent, in accordance with some aspects of the present disclosure.
- FIG. 6 includes a graphical representation of the vessel 110 in the form of an angiographic image rather than a model of the vessel.
- the stenosis progression risk values 170 are overlaid on the graphical representation of the vessel in order to provide the stenosis progression risk map 180.
- the received angiographic image data 130 represents a vessel that includes a stent 200.
- the stenosis progression risk values 170 represent a risk of in-stent restenosis, "ISR".
- the risk of in-stent restenosis is defined as the probability of a vessel lumen narrowing to a predetermined proportion (typically defined as 50%) of its current diameter within a stented coronary segment or within 5 mm of a stent edge.
- This tissue may thicken secondary to the release of growth factors, chemotactic factors, and inflammatory mediators from platelets and other inflammatory cells that result in increased migration and proliferation of smooth muscle cells, and increased production of extracellular matrix molecules, narrowing the vessel lumen and resulting in restenosis.
- the system described above is used to predict a stenosis progression risk map for a stent in a proposed location, i.e. a "virtual" stent.
- This risk map may be used by a physician to investigate the impact of inserting a stent in the proposed location, and to thereby predict its efficacy.
- the one or more processors 120 are also configured to:
- FIG. 7 is a schematic diagram illustrating an example of a) an adapted model 160" of a vessel 110 that includes a stent 200 at a proposed location B - B', b) a simulation of blood flow velocity 150" in the adapted model 160" of the vessel 110, c) calculated vessel wall shear stress values 140" in the adapted model 160" of the vessel 110, and d) a stenosis progression risk map 180" for the vessel 110 including calculated stenosis progression risk values 170", in accordance with some aspects of the present disclosure.
- the input defining a proposed location B - B' for a stent 200 in the vessel 110 may be received from a user input device operating in combination with a displayed image representing the vessel 110.
- the image may be displayed on a display device, such as the monitor 240 illustrated in Fig. 1 , for example.
- the image representing the vessel 110 may be generated from the angiographic image data 130, as described above. For instance, a reconstructed image may be generated from the angiographic image data 130.
- the image representing the vessel 110 may be provided by the model 160 of the vessel 110.
- a user may define the proposed location B - B' for a stent 200 using the user input device.
- the input defining a proposed location B - B' for a stent 200 in the vessel 110 may alternatively be received from a feature detector, or from a neural network that is trained to automatically identify a proposed location for the stent B - B'.
- the feature detector, or the trained neural network may automatically identify the proposed location based on the position of a narrowing of the vessel's lumen, for example.
- second vessel wall shear stress values 140" are calculated at the plurality of positions along the vessel based on a simulation of blood flow 150" in an adapted model 160" of the vessel.
- the adapted model 160" comprises the model 160 of the vessel 110 extracted from the angiographic image data 130, and wherein the model 160 is adapted to include the stent 200 at the proposed location B - B'.
- An example of an adapted model 160" is illustrated in Fig. 7a , and wherein the stent 200 is visible in the proposed location B - B'.
- the adapted model 160" of the vessel 110 may be generated by e.g. adjusting the geometric representation of the vessel 110 such that it includes the stent in the proposed location.
- the stent may apply pressure to the vessel wall, thereby deforming the vessel.
- the geometric representation of the vessel 110 may therefore be adjusted such that it represents the expected shape of the vessel.
- the shape of the vessel may be determined using a biomechanical model representing the vessel, and which describes the expansion of the vessel based on the vessel's elasticity, and the spring constant of the stent.
- An example of such a model is described in the document Auricchio, F. et al. (2011) 'Carotid artery stenting simulation: From patient-specific images to finite element analysis', Medical Engineering & Physics, 33(3), pp. 281-289. Available at: https://doi.org/10.1016/j.medengphy.2010.10.011 .
- the second vessel wall shear stress values 140" are calculated using the adapted model 160" of the vessel 110 in the same manner as the vessel wall shear stress values 140 that were described above.
- the model of the vessel may also be updated based on a prediction of an amount of tissue growth in the vessel 110 and/or an amount of remodelling of the vessel 110, at a future point in time ti.
- the amount of tissue growth and/or remodelling of the vessel 110 may be impacted by the pressure that is applied to the vessel wall by the stent.
- the second vessel wall shear stress values 140" may account for changes in a shape of the vessel that arise from the pressure applied to the vessel wall by the stent.
- Second stenosis progression risk values 170" are then calculated at the positions along the vessel 110 based on the second vessel wall shear stress values 140". This may be performed using the relationship 190 illustrated in Fig. 4 .
- the resulting stenosis progression risk map 180" for the vessel 110 that includes the second stenosis progression risk values 170" is illustrated in Fig. 7d .
- the prediction indicates that despite the placement of the stent 200 in the proposed location B - B', the stenosis progression risk values 170" within the stent, i.e. the risk of ISR, is relatively high.
- the system 100 can be used to inform a physician of the expected outcome of pursuing a potential stenting strategy. A physician may subsequently investigate the expected outcome with the stent in another proposed location, or with a stent that has different dimensions, or different mechanical properties, and use this information to decide which course of treatment to pursue.
- the stenosis progression risk map 180 may include a graphical representation of the vessel in the form of an angiographic image.
- Fig. 8 illustrates an example of a stenosis progression risk map 180" for a vessel 110 that includes a stent at a proposed location B - B', in accordance with some aspects of the present disclosure.
- the second stenosis progression risk values 170" are indicated via a pointer on the scale "ISR Risk" for the stent in the proposed location B - B'.
- a graphical representation that includes an adapted model of the vessel 110 with a stent 200 in a proposed location B - B' is outputted.
- the one or more processors 120 are configured to:
- the adapted model may be generated in similar manner to that described above, e.g. by adjusting the geometric representation of the vessel 110 such that it includes the stent in the proposed location.
- a physician may use the graphical representation to determine whether the deployed stent would be in an acceptable position if the stent were subsequently positioned in the proposed location.
- biomechanical model may be used to generate values for the vessel wall stress and strain incurred during an expansion of a balloon angioplasty device in the vessel and/or values for the vessel wall stress and strain arising from an inserted stent in the vessel. These values may then be outputted to assist the physician in assessing the suitability of the proposed location B - B' for the stent.
- the one or more processors 120 are configured to receive IVUS image data for the vessel.
- IVUS image data provides data for the vessel 110 from a different perspective to that of the angiographic image data 130.
- IVUS image data also represents anatomical features of the vessel with a differing level of specificity. For instance, plaque within the vessel may be accurately depicted in IVUS image data. The IVUS image data may therefore be used to augment the information on the vessel 110 that is provided by the angiographic image data 130.
- the one or more processors 120 are further configured to:
- the IVUS image data representing the vessel 110 may be generated during a pullback operation wherein an IVUS imaging transducer is withdrawn through the vasculature, including the vessel 110.
- the IVUS image data is then registered to the angiographic image data 130 in order to provide spatial correspondence between the two data sets.
- the registration may be performed based on a tracking of the spatial position of the IVUS imaging transducer during pullback.
- the tracking may be performed using e.g. electromagnetic "EM" tracking, and the registration may be performed by registering the coordinate system of the EM tracking system to the coordinate system of the angiographic imaging system 230.
- the tracking may be performed by imaging the IVUS imaging transducer during pullback.
- the spatial position of the IVUS imaging transducer is inherently registered to the coordinate system of the angiographic imaging system 230.
- the IVUS image data provides accurate geometric data for the vessel 110, including, inter alia, accurate measurements for a diameter and a cross sectional area of the vessel lumen at positions along the length of the vessel.
- the geometric data including e.g. values for the lumen dimensions described above, are used to adapt the model 160 of the vessel that was extracted from the angiographic image data 130, and to thereby improve its accuracy.
- the model 160 may be adapted by e.g. adjusting the geometric representation of the vessel 110 to match the geometric data obtained from the IVUS image data.
- the operations of calculating S120 vessel wall shear stress values 140, and calculating S130 stenosis progression risk values 170 are repeated using the updated model of the vessel 110. These operations are performed in the same manner as the simulations described above.
- Fig. 9 is an example of a stenosis progression risk map 180 for a vessel 110 that includes a stent 200 and which is calculated using IVUS image data 210, in accordance with some aspects of the present disclosure.
- the detailed shape of the vessel 110 in the vicinity of the stent 200 is visible towards the left-hand side of Fig. 9 .
- a more accurate prediction of the stenosis progression risk values 170 may be provided.
- the received angiographic image data 130 represents a vessel that includes a stent 200
- the one or more processors 120 are configured to adapt the model 160 of the vessel 110 extracted from the angiographic image data 130 by:
- the operation of extracting geometric data for the vessel and the stent from the IVUS image data may be performed by reconstructing the IVUS image data to provide a 3D IVUS image representing the vessel, and segmenting, using known segmentation techniques, the reconstructed IVUS image to identify features such as the vessel wall, and the stent.
- the stent is clearly visible in IVUS images via the characteristic pattern of trans-axial lines extending away from the vessel wall.
- Features such as these may by identified by segmenting the reconstructed IVUS image, or they may be detected in the reconstructed IVUS image using a feature detector, or a neural network, and consequently used to identify the location of the stent 200.
- Additional features such as plaque, and other deposits along the vessel wall may also be identified from the IVUS image data via image segmentation, or by using a feature detector, or a trained neural network. These features may also be used to predict an amount of growth, or an amount of vessel remodelling, using the techniques described above.
- Fig. 9 differs from the graphical representations in Fig. 3 and Fig. 6 and in which the vessel 110 is represented by a model 160, or by an angiographic image.
- the stenosis progression risk map 180 illustrated in Fig. 9 represents the vessel 110 with relatively higher spatial resolution, and may therefore provide a more detailed map of the calculated stenosis progression risk values 170.
- the representation illustrated in Fig. 9 may facilitate a physician to provide an improved assessment of the vessel 110.
- IVUS image data representing a vessel that includes a stent is used to calculate a measure of malapposition of the stent.
- stent malapposition As described in a document by Karalis, I, et al., "Late acquired stent malapposition: why, when and how to handle?”, Heart 2012; 98:1529-1536 , stent malapposition, also referred to as incomplete stent apposition, is defined by the separation of at least one stent strut from the intimal surface of the arterial wall with evidence of blood behind the strut, in a segment not overlying side branches.
- Stent malapposition can be quantified by various techniques, including measuring the number of malapposed struts, the arc subtended by the malapposed struts, the distance between the malapposed struts and the vessel wall, and the area, length and volume of the gap between the stent and the vessel wall.
- the received angiographic image data 130 represents a vessel that includes a stent 200
- the one or more processors 120 are further configured to:
- the calculated stenosis progression risk values 170 may be updated based on the actual positioning of the stent by recalculating the simulation using the actual stent positioning. for example.
- a value for the measure of malapposition of the stent may be outputted in various ways.
- a value for the measure of malapposition may be outputted graphically or as a numerical value.
- a value for the measure of malapposition may be outputted to a display device, or to a computer readable storage medium, or to a printer. For instance, a value for the measure of malapposition may be outputted to the monitor 240 illustrated in Fig 1 .
- the one or more processors 120 are configured to output the measure of malapposition of the stent 200 by:
- the graphical representation of the measure of malapposition of the stent 200 may for instance include an icon representing one or more of: the number of malapposed struts, the arc subtended by the malapposed struts, the distance between the malapposed struts and the vessel wall, the area, the length, or the volume of the gap between the stent and the vessel wall, for example.
- the system described with reference to Fig. 1 is used to calculate a value of a blood flow parameter from the angiographic image data 130 that is received in the operation S110.
- the one or more processors 120 are configured to:
- Values of blood flow parameters that may be calculated and outputted in accordance with this example include the Fractional Flow Reserve “FFR”, the instantaneous wave-free ratio “iFR”, the Coronary Flow Reserve “CFR”, the Thrombolysis in Myocardial Infarction “TIMI” flow grade, the Index of Microvascular Resistance “IMR”, and the Hyperaemic Microvascular Resistance index “HMR”, for example.
- the value of the blood flow parameter may be calculated based on the simulation of the blood flow 150 in a model 160, 160', 160", that was described above.
- the value of blood flow parameters may be calculated for the vessel in its current state, as represented in the angiographic image data 130, or for an adapted vessel in which a predicted amount of growth or remodelling has occurred, or for an adapted vessel that includes a virtual stent.
- the blood flow parameter is an FFR value for the vessel.
- a value for the Fractional Flow Reserve "FFR" is often determined in order to assess the impact of a stenosis on delivery of oxygen to the heart muscle in investigations for CAD.
- the FFR is defined by the ratio P d / P a , wherein P d represents a distal pressure at a distal position with respect to the stenosis, and P a represents a proximal pressure a proximal position with respect to the stenosis.
- the ostium of the relevant artery is often used as the proximal position.
- the FFR is typically calculated with values for P d and P a that are averaged over the cardiac cycle measured under maximal hyperemia mediated by adenosine. FFR values above 0.8 are typically regarded as clinically insignificant, and values below 0.8 are typically considered to represent increased clinical significance.
- pressure changes are, among other effects, linked to changes in fluid velocity.
- values for the pressure at the distal position and at the proximal position may be determined from the blood flow velocity 150, 150', 150" that are calculated in the simulations described above, and subsequently used to determine a value for the FFR.
- the one or more processors 120 may also output other graphical representations, For instance, the one or more processors 120 may also be configured to output graphical representations of one or more of the following:
- the maps generated in accordance with this example may be used by a physician to determine the current vessel wall shear stress, or blood flow, and to determine the expected improvement that may be achieved by from various virtually-placed stents. These maps may be providing a graphical representation of the vessel, e.g. as an angiographic image including the vessel, or as a model of the vessel, and overlaying the vessel wall shear stress values, or the simulation of blood flow, onto the graphical representation of the vessel.
- the system described with reference to Fig. 2 is used to evaluate the stenosis progression risk for a vessel 110 that does not includes a stent, and a measure of malapposition of a stent in a proposed location is predicted and outputted.
- the operations of calculating S120 vessel wall shear stress values 140, calculating S130 stenosis progression risk values 170, 170', and outputting a stenosis progression risk map 180, 180' are performed for a vessel that does not include a stent, and the one or more processors 120 are configured to:
- a physician may use the outputted graphical representation to determine whether the measure of malapposition is acceptable prior to deploying the stent in the proposed location.
- the system 100 may also include one or more of: an angiographic imaging system for providing the angiographic image data 130, such as for example the CT imaging system 230 illustrated in Fig. 1 ; an injector 220 for injecting a contrast agent into the vasculature; a monitor 240 for displaying the outputted stenosis progression risk map(s) 180, 180', 180", a value representing a measure of malapposition of a stent, calculated values or a blood flow parameter, and so forth; a patient bed; and a user input device configured to receive user input, such as a keyboard, a mouse, a touchscreen, and so forth.
- an angiographic imaging system for providing the angiographic image data 130, such as for example the CT imaging system 230 illustrated in Fig. 1 ; an injector 220 for injecting a contrast agent into the vasculature; a monitor 240 for displaying the outputted stenosis progression risk map(s) 180, 180', 180", a value representing
- a computer-implemented method of evaluating stenosis progression risk for a vessel 110 includes:
- a computer program product comprises instructions which when executed by one or more processors 120, cause the one or more processors to carry out a method of evaluating stenosis progression risk for a vessel 110, comprising
Landscapes
- Engineering & Computer Science (AREA)
- Health & Medical Sciences (AREA)
- General Health & Medical Sciences (AREA)
- Medical Informatics (AREA)
- Nuclear Medicine, Radiotherapy & Molecular Imaging (AREA)
- Radiology & Medical Imaging (AREA)
- Quality & Reliability (AREA)
- Computer Vision & Pattern Recognition (AREA)
- Physics & Mathematics (AREA)
- General Physics & Mathematics (AREA)
- Theoretical Computer Science (AREA)
- Apparatus For Radiation Diagnosis (AREA)
Priority Applications (2)
| Application Number | Priority Date | Filing Date | Title |
|---|---|---|---|
| EP22187680.8A EP4312184A1 (de) | 2022-07-29 | 2022-07-29 | Bewertung des risikos einer stenoseprogression |
| PCT/EP2023/070508 WO2024023048A1 (en) | 2022-07-29 | 2023-07-25 | Evaluating stenosis progression risk |
Applications Claiming Priority (1)
| Application Number | Priority Date | Filing Date | Title |
|---|---|---|---|
| EP22187680.8A EP4312184A1 (de) | 2022-07-29 | 2022-07-29 | Bewertung des risikos einer stenoseprogression |
Publications (1)
| Publication Number | Publication Date |
|---|---|
| EP4312184A1 true EP4312184A1 (de) | 2024-01-31 |
Family
ID=82780790
Family Applications (1)
| Application Number | Title | Priority Date | Filing Date |
|---|---|---|---|
| EP22187680.8A Withdrawn EP4312184A1 (de) | 2022-07-29 | 2022-07-29 | Bewertung des risikos einer stenoseprogression |
Country Status (2)
| Country | Link |
|---|---|
| EP (1) | EP4312184A1 (de) |
| WO (1) | WO2024023048A1 (de) |
Cited By (7)
| Publication number | Priority date | Publication date | Assignee | Title |
|---|---|---|---|---|
| US12138027B2 (en) | 2016-05-16 | 2024-11-12 | Cath Works Ltd. | System for vascular assessment |
| US12315076B1 (en) | 2021-09-22 | 2025-05-27 | Cathworks Ltd. | Four-dimensional motion analysis of a patient's coronary arteries and myocardial wall |
| US12354755B2 (en) | 2012-10-24 | 2025-07-08 | Cathworks Ltd | Creating a vascular tree model |
| US12387325B2 (en) | 2022-02-10 | 2025-08-12 | Cath Works Ltd. | System and method for machine-learning based sensor analysis and vascular tree segmentation |
| US12446965B2 (en) | 2023-08-09 | 2025-10-21 | Cathworks Ltd. | Enhanced user interface and crosstalk analysis for vascular index measurement |
| US12499646B1 (en) | 2024-06-12 | 2025-12-16 | Cathworks Ltd. | Three-dimensional sizing tool for cardiac assessment |
| US12531159B2 (en) | 2023-08-09 | 2026-01-20 | Cathworks Ltd. | Post-PCI coronary analysis |
Families Citing this family (1)
| Publication number | Priority date | Publication date | Assignee | Title |
|---|---|---|---|---|
| WO2026064596A1 (en) * | 2024-09-20 | 2026-03-26 | Angioinsight, Inc. | Graphical user interface for display of flow rate extracted from angiographic information |
Citations (1)
| Publication number | Priority date | Publication date | Assignee | Title |
|---|---|---|---|---|
| KR101837753B1 (ko) * | 2016-10-20 | 2018-03-12 | (주)실리콘사피엔스 | 가상 협착 시뮬레이션을 이용한 관상 동맥의 협착 위험 위치 예측 방법 및 장치 |
-
2022
- 2022-07-29 EP EP22187680.8A patent/EP4312184A1/de not_active Withdrawn
-
2023
- 2023-07-25 WO PCT/EP2023/070508 patent/WO2024023048A1/en not_active Ceased
Patent Citations (1)
| Publication number | Priority date | Publication date | Assignee | Title |
|---|---|---|---|---|
| KR101837753B1 (ko) * | 2016-10-20 | 2018-03-12 | (주)실리콘사피엔스 | 가상 협착 시뮬레이션을 이용한 관상 동맥의 협착 위험 위치 예측 방법 및 장치 |
Non-Patent Citations (7)
| Title |
|---|
| AURICCHIO, F. ET AL.: "Carotid artery stenting simulation: From patient-specific images to finite element analysis", MEDICAL ENGINEERING & PHYSICS, vol. 33, no. 3, 2011, pages 281 - 289, XP028172327, DOI: 10.1016/j.medengphy.2010.10.011 |
| GIJSEN F. ET AL.: "Expert recommendations on the assessment of wall shear stress in human coronary arteries: Existing methodologies, technical considerations, and clinical applications", EUR. HEART J., vol. 40, no. 41, 2019, pages 3421 - 3433 |
| GIJSEN FRANK ET AL: "Expert recommendations on the assessment of wall shear stress in human coronary arteries: existing methodologies, technical considerations, and clinical applications", EUROPEAN HEART JOURNAL, vol. 40, no. 41, 30 September 2019 (2019-09-30), GB, pages 3421 - 3433, XP093010493, ISSN: 0195-668X, Retrieved from the Internet <URL:https://academic.oup.com/eurheartj/article-pdf/40/41/3421/46647255/eurheartj_40_41_3421.pdf> DOI: 10.1093/eurheartj/ehz551 * |
| KARALIS, I ET AL.: "Late acquired stent malapposition: why, when and how to handle?", HEART, vol. 98, 2012, pages 1529 - 1536 |
| MICHAIL I PAPAFAKLIS ET AL: "Coronary dilatation 10 weeks after paclitaxel-eluting stent implantation. No role of shear stress in lumen enlargement?", HEART AND VESSELS, SPRINGER-VERLAG, TO, vol. 22, no. 4, 20 July 2007 (2007-07-20), pages 268 - 273, XP019541099, ISSN: 1615-2573, DOI: 10.1007/S00380-006-0970-9 * |
| SAMADY HABIB ET AL: "Coronary Artery Wall Shear Stress Is Associated With Progression and Transformation of Atherosclerotic Plaque and Arterial Remodeling in Patients With Coronary Artery Disease", CIRCULATION, vol. 124, no. 7, 16 August 2011 (2011-08-16), US, pages 779 - 788, XP093010284, ISSN: 0009-7322, Retrieved from the Internet <URL:http://dx.doi.org/10.1161/CIRCULATIONAHA.111.021824> DOI: 10.1161/CIRCULATIONAHA.111.021824 * |
| SCHOEN, F. J. ET AL.: "Endovascular Stents, Vascular Grafts, and Stent Grafts", BIOMATERIALS SCIENCE, 2013 |
Cited By (10)
| Publication number | Priority date | Publication date | Assignee | Title |
|---|---|---|---|---|
| US12354755B2 (en) | 2012-10-24 | 2025-07-08 | Cathworks Ltd | Creating a vascular tree model |
| US12138027B2 (en) | 2016-05-16 | 2024-11-12 | Cath Works Ltd. | System for vascular assessment |
| US12315076B1 (en) | 2021-09-22 | 2025-05-27 | Cathworks Ltd. | Four-dimensional motion analysis of a patient's coronary arteries and myocardial wall |
| US12387325B2 (en) | 2022-02-10 | 2025-08-12 | Cath Works Ltd. | System and method for machine-learning based sensor analysis and vascular tree segmentation |
| US12423813B2 (en) | 2022-02-10 | 2025-09-23 | Cathworks Ltd. | System and method for machine-learning based sensor analysis and vascular tree segmentation |
| US12446965B2 (en) | 2023-08-09 | 2025-10-21 | Cathworks Ltd. | Enhanced user interface and crosstalk analysis for vascular index measurement |
| US12531159B2 (en) | 2023-08-09 | 2026-01-20 | Cathworks Ltd. | Post-PCI coronary analysis |
| US12499646B1 (en) | 2024-06-12 | 2025-12-16 | Cathworks Ltd. | Three-dimensional sizing tool for cardiac assessment |
| US12512196B2 (en) | 2024-06-12 | 2025-12-30 | Cathworks Ltd. | Systems and methods for secure sharing of cardiac assessments using QR codes |
| US12567489B2 (en) | 2024-06-12 | 2026-03-03 | Cathworks Ltd. | Systems and methods for displaying distal fractional flow reserve values in vascular analysis |
Also Published As
| Publication number | Publication date |
|---|---|
| WO2024023048A1 (en) | 2024-02-01 |
Similar Documents
| Publication | Publication Date | Title |
|---|---|---|
| EP4312184A1 (de) | Bewertung des risikos einer stenoseprogression | |
| EP3404667B1 (de) | Lernbasierte verfahren zur personalisierten beurteilung, langzeitvorhersage und verwaltung von atherosklerose | |
| US10483006B2 (en) | Learning based methods for personalized assessment, long-term prediction and management of atherosclerosis | |
| US9888968B2 (en) | Method and system for automated therapy planning for arterial stenosis | |
| JP6923599B2 (ja) | 造影剤分布予測及び測定を使用してプラーク及び/または狭窄性病変の重症度を評価するシステム及び方法 | |
| EP2963574B1 (de) | Verfahren und system zur vorhersage von hämodynamischen metriken nach dem stenting zur behandlungsplanung von arterieller stenose | |
| JP6378777B2 (ja) | 患者固有の血管幾何形状及び境界条件の変化をモデリングするためのシステム及びその作動方法 | |
| JP7286763B2 (ja) | 血管圧力差の取得装置の作動方法及び血管圧力差の取得装置 | |
| Morlacchi et al. | Modeling stented coronary arteries: where we are, where to go | |
| Gindre et al. | Finite element simulation of the insertion of guidewires during an EVAR procedure: example of a complex patient case, a first step toward patient‐specific parameterized models | |
| Figueroa et al. | Preliminary 3D computational analysis of the relationship between aortic displacement force and direction of endograft movement | |
| Speelman et al. | Initial stress in biomechanical models of atherosclerotic plaques | |
| Migliavacca et al. | Virtual bench testing to study coronary bifurcation stenting | |
| KR20190125596A (ko) | 환자 맞춤형 최적 스텐트 선정 방법 | |
| Chiastra et al. | Hemodynamic perturbations due to the presence of stents | |
| Wu et al. | Angiography-based 4-dimensional superficial wall strain and stress: a new diagnostic tool in the catheterization laboratory | |
| des Plantes et al. | Intravascular imaging-derived physiology—basic principles and clinical application | |
| KR20190125799A (ko) | 환자 맞춤형 최적 스텐트 선정 방법 | |
| WO2023186610A1 (en) | Intravascular procedure step prediction | |
| Tzirakis et al. | Spatial distribution of abdominal aortic aneurysm surface expansion and correlation with maximum diameter and volume growth | |
| Hamilton et al. | Regional material property alterations in porcine femoral arteries with atheroma development | |
| Cebral et al. | Patient-specific simulation of carotid artery stenting using computational fluid dynamics | |
| Figueroa et al. | Computational analysis of displacement forces acting on endografts used to treat aortic aneurysms | |
| Beyene et al. | Comparison of endothelial shear stress between ultrathin strut bioresorbable polymer drug-eluting stent vs durable-polymer drug-eluting stent post-stent implantation: An optical coherence tomography substudy from BIOFLOW II | |
| Zhang et al. | Validation of classification system for isolated superior mesenteric artery dissections using image-based computational flow analysis |
Legal Events
| Date | Code | Title | Description |
|---|---|---|---|
| PUAI | Public reference made under article 153(3) epc to a published international application that has entered the european phase |
Free format text: ORIGINAL CODE: 0009012 |
|
| STAA | Information on the status of an ep patent application or granted ep patent |
Free format text: STATUS: THE APPLICATION HAS BEEN PUBLISHED |
|
| AK | Designated contracting states |
Kind code of ref document: A1 Designated state(s): AL AT BE BG CH CY CZ DE DK EE ES FI FR GB GR HR HU IE IS IT LI LT LU LV MC MK MT NL NO PL PT RO RS SE SI SK SM TR |
|
| STAA | Information on the status of an ep patent application or granted ep patent |
Free format text: STATUS: THE APPLICATION IS DEEMED TO BE WITHDRAWN |
|
| 18D | Application deemed to be withdrawn |
Effective date: 20240801 |