EP4332636A1 - Procédé de mesure des doses de zones radioactives au sol d'une terrasse - Google Patents
Procédé de mesure des doses de zones radioactives au sol d'une terrasse Download PDFInfo
- Publication number
- EP4332636A1 EP4332636A1 EP23194189.9A EP23194189A EP4332636A1 EP 4332636 A1 EP4332636 A1 EP 4332636A1 EP 23194189 A EP23194189 A EP 23194189A EP 4332636 A1 EP4332636 A1 EP 4332636A1
- Authority
- EP
- European Patent Office
- Prior art keywords
- terrain
- radiation
- model
- values
- carrier platform
- Prior art date
- Legal status (The legal status is an assumption and is not a legal conclusion. Google has not performed a legal analysis and makes no representation as to the accuracy of the status listed.)
- Pending
Links
Images


Classifications
-
- G—PHYSICS
- G01—MEASURING; TESTING
- G01T—MEASUREMENT OF NUCLEAR OR X-RADIATION
- G01T7/00—Details of radiation-measuring instruments
-
- G—PHYSICS
- G01—MEASURING; TESTING
- G01T—MEASUREMENT OF NUCLEAR OR X-RADIATION
- G01T1/00—Measuring X-radiation, gamma radiation, corpuscular radiation, or cosmic radiation
- G01T1/16—Measuring radiation intensity
- G01T1/169—Exploration, location of contaminated surface areas
Definitions
- the invention relates to a method for measuring dose rates of radioactive surfaces on the ground of a terrain in real time, with a carrier platform on which a gamma probe is arranged, the carrier platform being suitable for driving over or flying over the terrain.
- radioactive radiation can be measured from a helicopter flying over the terrain, after which the collected data must be evaluated after the flight in order to draw conclusions from them.
- the WO2021235777 A1 , the WO2020198877 A1 and the FR3088306 A1 each reveal a drone carrying a radiation detector. No special processing of the measured values is specified.
- EP3036565 A1 relates to a method and a device for calculating a spatial architecture in a possibly radioactively contaminated building section using a hand-held radiation measuring device that travels on a detectable 3D trajectory and determining the radiation model for the building section.
- the method and the device are not suitable for measuring open terrain.
- EP0194933 A1 describes a method and a device for measuring radioactive radiation in an area using an aircraft and graphically displaying the measurement data in a rudimentary manner. The method is inaccurate in measuring the dose rate on the ground and in the position of sources.
- the aim of the invention is to create a method through which the dose rate of areas in unknown open terrain can be discovered and quantified more safely and quickly.
- the exploration should be more accurate in terms of characteristics such as position and/or quantitative radiation measurement, as well as safe and easy to operate by an operator.
- the process should be versatile and adaptable. Finally, it should also be inexpensive to produce and low-maintenance.
- the carrier platform is given a movement pattern for departure or departure, preferably a meandering movement pattern with a predetermined grid spacing. This means that any existing information about the event and terrain to be examined can be used and the overall measurement time can be shortened.
- the carrier platform follows or flies off the movement pattern semi-autonomously. This makes operation easier and reduces personnel costs.
- the radioactivity measurements include at least measurements in CPS. This means that measured values in the raw state and as a measurement result as a whole can be compared with measured values elsewhere.
- a standardized gamma probe can be used.
- the gamma probe provides radioactivity measurements every second during the detection journey. This increases the overall accuracy of the measurement result.
- a device for recording terrain properties is arranged on the support platform and with the aid of this device the terrain model is provided incrementally and in real time, thereby allowing the existing terrain model to be improved, which leads to better and/or current measurement results.
- the device for detecting terrain characteristics is a LiDAR sensor or a system consisting of a stereo camera. These are the means where measurement accuracy and cost are balanced.
- a classification of objects is presented into at least the three classes "soil”, “buildings” and “vegetation”, into which sections of the terrain can be divided depending on the terrain model, the classes being at least different from one another Different degrees of quantitative shadowing of gamma radiation differ from one another. These classes can be automatically added to parts of the terrain model and improve the significance of the measurement results.
- steps (d) to (f) take place in a computer unit on the carrier platform. This reduces the amount of data to be transmitted, conducive to the need for real-time computation and the reliability of measurements in adverse environmental conditions.
- the measurement data from the gamma probe and the localization device are combined into a data set and sent to an external station using a radio remote connection. This again reduces the amount of data to be transferred.
- the carrier platform has a localization device, preferably a GPS module. This allows the positions of sources to be calculated more precisely.
- the carrier platform is a ULFZ. This means that measurements can be taken safely from the air and no additional operating personnel are required.
- a calibration flight is carried out in a known area before flying over the terrain, the background radiation being determined as a function of the flight altitude during the calibration flight.
- intrinsic radiation, cosmic radiation and terrestrial radiation are also introduced into the calculation model. This increases the measurement accuracy.
- the radioactivity measurements also include a radiation spectrum in which several nuclide types can be distinguished from one another, and the specification of the nuclide type that could be in the terrain is based on the measured radiation spectrum. This means that an operator can detect possible additional nuclides present in the terrain during the detection drive.
- Fig. 1 the schematic system architecture
- Fig. 2 a model of the radiation influences
- Fig. 3 a map and an altitude measurement for a calibration flight
- Fig. 4 two modeling of the radiation background
- Fig. 5 a schematic radiation model
- Fig. 6 a step diagram of laser data preparation
- Fig. 7 a step diagram of gamma data preparation
- Fig. 8 an application of the background model to a map
- Fig. 9 Classifications of soil types on a map
- Fig. 10 a representation of intermediate steps of a hotspot calculation in a map
- Fig. 11 a flight path over a map with measurement points
- Fig. 12 three intensity measurements with error minimization
- Fig. 13 two examples of spectra
- Fig. 14 a radiation image in a map
- Fig. 15 a representation of the accuracy of source localization.
- the radiological air detection system developed is intended to increase the safety of emergency services by identifying radioactive sources in an area, or terrain 4, and radiological radiation images in real time.
- the intended use is designed to detect small and medium-sized radiation caused by an undetermined number of sources.
- an unmanned platform such as the one in Fig. 2
- the carrier platform shown is sent into terrain 4 and uses a system of sensors to determine the values of interest.
- the system consists of a sensor module consisting of an optional high-precision laser scanner, a powerful gamma probe and a radio module, as well as newly developed process parts for calculating and modeling the radiation images.
- the sensor package is designed to be modular, which means it can be used on different carrier platforms with minimal adjustments.
- the tests and evaluations carried out as part of the invention were carried out using an unmanned aircraft (ULFZ 1, or "unmanned airborne vehicle", UAV) as a carrier platform.
- the radiological air detection system includes components that are described in detail below:
- the sensor module with laser scanner, gamma probe and radio module for live data transmission for ranges of up to 500 m are described below.
- An example of an integration is that on a ULFZ of the “RiCOPTER-M” version.
- a current and precise terrain profile of the terrain 4 is created in real time, including the classification of surface objects (soil, vegetation, buildings).
- a calibration flight can be carried out as a preparatory measure for the correct calculation of radiation. How these calibration data are used to make additional radiation sources visible (to the radiation background) will now also be described.
- the radiation image is used to model the specific dose rate quantitatively for each point on the terrain.
- Radiation lines adapted to the terrain indicate the boundaries of areas of increased radiation.
- the invention also includes user-friendly visualization and the evaluation of (ground) detection techniques for use as an air detection method with a UAV. Finally, regulatory requirements are also taken into account and the accuracy to be achieved is determined.
- the dose rate is the equivalent dose (radiation energy) that is absorbed by an organism per unit of time.
- the usual unit of measurement for this is sieverts per hour [Sv/h].
- a gamma probe is a commercially available measuring instrument.
- the central component is a crystal that detects electromagnetic radiation in the usual spectral range in an undirected manner or with a relatively large opening angle.
- the invention aims to provide a significant improvement in the detection of radioactive sources 2.
- the system developed in increases the safety of emergency services through the real-time generation of quantitative radiation maps at ground level. Specifically, three goals are achieved:
- the local dose rate on the ground 7 can be calculated at one meter above ground.
- the sensor package consisting of a laser scanner and gamma probe, whereby the data transmission is designed in such a way that platform independence is ensured. Additional modules are used by operations management outside the carrier platform; these are used to receive data from, for example, ULFZ 1, carry out the calculations and finally the user-optimized visualization of the results and live data.
- the aim is to carry out an analysis of the applicability of ground detection methods with regard to air detection methods and to derive suitable detection methods for UAVs.
- Some of the most important ground detection methods are: sensing along radiation lines, sensing for the highest dose rate.
- real time means an output of new or updated processed measurement data within a few seconds or less. This period of time is significantly shorter than the duration of a measurement flight or test drive, which is in the range of at least a few minutes even in the shortest cases.
- aircraft detection can provide a quick overview of the situation.
- the application condenses the measurement data obtained through measurement networks such as the Austrian radiation early warning system. It should be noted that the aircraft should only be used after the deposition has been completed. In addition, take-off and landing sites should be located outside the contaminated area and thus the terrain 4 to be examined.
- the system is intended to offer an efficient method for the localization of several point sources 2 (point sources), which can also be shielded and/or have different radionuclides.
- the system estimates the local dose rate at ground level as accurately as possible based on the radioactivity measurements in the air in order to provide a basis for decision-making during operations.
- the conversion (of the air measurement at ground level) is carried out using the so-called Spectrum Dose Index (SDI) method, whereby a location-related calibration of the measuring system must be provided to correct the effects of background radiation.
- SDI Spectrum Dose Index
- the altitude correction is important, with which the local absorption coefficient of the air is taken into account. This depends on the prevailing environmental parameters such as altitude, air pressure and humidity.
- the result must be verified using basic truths.
- the conversion should also be examined for different radionuclides, since different conversion factors for the dose rate must be taken into account depending on the energy of the radionuclide.
- the visualization serves to provide a picture of the current situation, with important measurements being displayed and the results of the evaluations being visualized. Consequently, the visualization must be able to accept new content in real time and prepare it graphically. However, the term real time must be seen in connection with the flight duration, which is why a short time window from the time of measurement to the display of a few minutes is still accepted.
- the purpose of visualization is to visualize the data that is required for testing the detection techniques. This also includes the results of the rough exploration as well as the measured values.
- the methods according to the invention ensure electrical and mechanical platform independence.
- the performance limits For the targeted use of the system, it is of fundamental importance to define the performance limits. For this purpose, it should be described according to which set of rules a situation-related assessment of the performance limits is to be made.
- the system must know which operational parameters (e.g. min/max flight altitude h if UAV, speeds, scenarios, etc.) must be adhered to in order to obtain reliable results and to what extent leaving this defined parameter space affects the functionalities and control options provided can.
- the definitions of these limits have been supported by appropriate field tests.
- the operating limits of the carrier platform used must be considered independently of the measurement system.
- the relevant operating books must be consulted for safe operation and material preservation.
- the ground level radiation map is displayed by the method in the live display. It is important that this radiation map is also available in the form of a 2D projection at ground level so that it can be fed into the ABC information system (ABC-IS).
- ABC-IS ABC information system
- the interface to ABC-IS is implemented as a file in the form of shape files (isolines).
- the air detection system should primarily, but not only, cover small areas in urban areas. A precise definition is given by delimiting the scenarios into three categories.
- the primary area of application is a locally limited area in which radioactive radiation is suspected.
- the extent of the area to be examined is approximately on the order of 100 to 1000 m radius. Large-scale radiation is not directly addressed but at least kept in view.
- radioactive sources that emit gamma radiation come into question.
- Alpha and beta emitters are not taken into account.
- point sources 2 are assumed.
- One Area radiation is not within the scope of the invention because area radiation cannot be generated/simulated, for example in Austria. It is assumed that the source 2 is located on the ground 7 or solid ground. Ie the source 2 could also be on a building 9 or under vegetation 8. No restrictions are assumed regarding the nuclides, which means that sources 2 with different nuclides can also occur.
- the scenario can be in open terrain, but also in an urban area. All types of vegetation can occur. Bodies of water may exist, but it should be noted that the laser scanner is not suitable for measuring them. In particular, this means that the source can also be shaded by vegetation 8 or buildings 9, but is fundamentally visible. Sources that are completely shaded are not explicitly taken into account.
- Fig. 1 the architecture of the air detection system is outlined.
- the basic architecture reflects the division into two subsystems, the sensor package and the analysis package. Only the ULFZ 1, equipped with the sensor package, is brought autonomously or semi-autonomously into the danger zone for automatic exploration.
- an autonomous flight or an autonomous journey means that the carrier platform follows a predetermined path without remote control, possibly also independently changed or adapted during the movement.
- the operator an ABC expert then only monitors the output of the calculated measured values.
- a semi-autonomous flight or a semi-autonomous journey means that either the carrier platform is unmanned but is permanently remotely controlled by a person; or that the operator intervenes in a predetermined and followed path at any time as soon as he deems it appropriate - mainly in response to signs from sources 2 - in order, for example, to speed up exploration.
- the sensor package consists of the two sensors LiDAR sensor and gamma probe, a communication system to carry out data exchange, and a data management system to save measured values in full resolution on-board.
- the analysis package consists of a communication system for exchanging data with the sensors and exporting results to information systems, a data management system for securing the measurement data and results, as well as several software modules for evaluating the measurement data, creating situation reports and calculating flight maneuvers.
- All components of the sensor package are coordinated with one another.
- the sensor package can therefore also be used on other carrier platforms.
- the mechanical integration should always be tailored to the carrier platform (helicopter, car, etc.).
- the mounting plate of the sensor package is suitable for this and offers the operator a number of mounting options.
- the damping of the sensor package must be taken into account in order not to introduce unnecessary vibrations into the system.
- a carrier platform therefore consists of an autonomously or semi-autonomously movable, motorized vehicle, on which a gamma probe and optionally a LiDAR system are attached at a predetermined height from the center of gravity and/or distance from the ground 7 on which the carrier platform stands .
- one or more computer-like computing units are arranged on the carrier platform, which can be a land vehicle such as a caterpillar, a two-, three- or multi-axle wheeled vehicle, a helicopter or a drone, which process measurement data from the sensors/probes and transmit them via a transmitter transmitted to a ground station.
- the ground station can be any electronic and communication-capable small or stationary device that remains stationary at an operator's location during the detection drive or flight and makes the evaluated measurement data accessible to the operator via a screen or a data output point.
- the elements mentioned on the carrier platform have a modular structure and are attached to it. If the carrier platform is a ULFZ 1, then it is advisable if the modules are attached below the center of gravity and the support devices such as landing legs, feet, rails or wheels are reinforced and/or extended to take the weight and the shift in center of gravity into account.
- an adapter plate and rings were chosen, which enclose the sensor and connect it to the adapter plate or the LiDAR sensor system.
- the LiDAR sensor system already has a corresponding device for coupling to the RiCOPTER-M.
- a stereo camera e.g. a double camera system or a system of several cameras
- can be used in the alignment oblique can be carried in order to provide image and video recordings for control purposes (also in real time, but also recordable).
- the entire payload is subjected to pressure through the use of special Alpha-Gel dampers. This results in data recording that is almost vibration-free.
- the four mounting bolts ensure the stability and suspension of the approx. 10 kg payload.
- the process for creating, among other things, a radiation map takes into account aspects of the data, the background radiation and the radiation model itself.
- the gamma probe records radioactivity measurements in CPS (counts per second), the dose rate in ⁇ Sv/h, and the spectrum. Please note: The radioactivity measurements do not have to be stated in equivalent dose rates. A statement in CPS is sufficient.
- the conversion into dose rate in ⁇ S/h takes place within the calculation model, taking into account the nuclide/spectrum and a calibration factor provided by the manufacturer.
- This data is transmitted via the UAV to the base station every second. However, the interval is adjustable and can therefore be lengthened or shortened.
- the second interval is used to achieve the goal of releasing final results in real time. Within a second, a measured value can be recorded, sent, combined with additional data and processed in a model together with previous measured values and (if necessary. graphically). A human operator perceives a data analysis update every second as taking place in real time.
- real-time location of the measured values is achieved by connecting the UAV GPS module to the gamma probe. This also adds the world coordinates and a timestamp to each gamma data packet, defining the exact location and time of the measurement.
- the CPS which also applies to the spectrum, is measured by integration over time. Consequently, a measurement that is anchored at a specific time and place always refers to the entire area and the time span to the previous measurement point. This means that during the movement of the UAV, depending on the speed, there is a certain uncertainty in the assignment of the exact location of the measured values, which is, however, counteracted by the high measurement frequency.
- the laser scanner records 3D points of the scanned area with the coordinates, the exact time stamp and other properties. These points can be used to create a 3D terrain model.
- these measurements together with the navigation data of the UAV, allow the exact flight altitude h to be determined during a measurement, which, for example, allows the exact distance to the ground 7 of the gamma measurements to be determined.
- the radioactive radiation N registered by the measuring device measured in counts per second is as in Fig. 2 represented by the sum of the count rate from one or several (to be measured) sources N s and all other entries of the radiation background N H.
- the latter is an essentially always-present radiation exposure (zero effect).
- N N s + N H
- the background radiation is composed of terrestrial, cosmic and the aforementioned intrinsic radiation.
- the cosmic background radiation is only relevant for very high altitudes or differences in altitude. Due to the low flight altitude h of the ULFZ 1 during the test flights ( ⁇ 150m), the cosmic background radiation can be neglected within the scope of the invention or can be viewed as a constant component of the background radiation. The largest factor is therefore the altitude-dependent terrestrial background radiation.
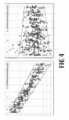
- a calibration flight (before the actual measurement flight) such as in Fig. 3 shown is useful for detecting the radiation background.
- This flight must be carried out without Source 2 or outside the influence of a Source 2.
- a climb and descent flight is flown to at least 100 m above ground or to approximately typical operational altitude.
- Fig. 3 (left part) is a top view of the map of a terrain known to be uncontaminated.
- the ULFZ 1 repeatedly describes a rectangle at different heights, with the height levels in Fig. 3 (right part) are shown. It can be seen that the radiation decreases between flight altitudes of around 640 m to 780 m, since the influence of cosmic radiation is not yet relevant here, but the decrease in the effects of ground radiation predominates.
- a measurement flight always takes place at different heights above the ground (even at a constant flight altitude h above sea level, AMSL - "above mean sea level"), depending on the terrain.
- the purpose of creating the background model is to determine the correct proportion of background radiation in the measured radiation for the respective height and consequently to compensate for this proportion in order to be able to determine the proportion of artificial radiation (or the sources 2 to be measured).
- the gamma data of the calibration flight are considered depending on the height above ground ( Fig. 4 ).
- the background radiation model is generated by logarithmic regression over the measured gamma values (solid line in Fig. 4 , left part). This means that the background radiation decreases approximately exponentially for the flight altitudes considered. This model shows a high level of agreement with the actually measured values across all calibration flights.
- the height above ground or the distance to source 2 can be determined using the target position (measuring point) in world coordinates and the terrain model or additional source positions.
- the source strength is reduced via attenuation and the squared distance law.
- the remaining radiation intensity is converted into a stochastic quantity using the Poisson distribution.
- the average background radiation is calculated for the determined height and a specific value following the Poisson distribution is calculated from this. Both values are added to the total value.
- a major challenge in the development of the method is to evaluate the sensor data with such a short delay that results about radiation are available and can be visualized after a very short time. While the copter is still flying and new areas are being detected using sensors with the sensor package, the data recorded should be continuously evaluated and visualized, i.e. in real time. Due to the complexity of the calculations, a comprehensive evaluation in real time can only be achieved with considerable effort.
- the invention achieves this by designing two processing paths.
- the first processing path is designed to analyze the measurement data and output the radioactivity values in real time as surface radiation on the terrain model. This is a qualitative analysis of the radioactivity levels. This is used to estimate the source position(s) and the approximate extent of radiation.
- the calculations for precise source localization are carried out and the radiation map is then quantitatively determined.
- the radioactivity values are converted into dose rates in Sv/h on the ground 7.
- a rough survey is carried out using the real-time evaluation to qualitatively determine the radioactivity values on the ground 7. This was made possible by the fact that the time from data acquisition to visualization of the results could be reduced to less than 1 minute to react immediately to increased radiation measurements, to adapt the flight pattern if necessary and also to implement composite air detection procedures depending on the situation.
- the second processing method is used to carry out detailed investigation; this allows the location of the source(s) 6 and the estimation of the radiation intensity(s) as well as the representation of radiation lines, which is important for personal safety, for example: the 10 ⁇ Sv/h dose rate limit in the terrain.
- the data preparation is as follows.
- Fig. 6 is the data stream from the LiDAR sensor (laser scanner) to the list-shaped or visual/graphical output of the results; The processing steps lie in between. It has been determined that a graphical output of processed measured values in the form of contour lines on an image of the map can be recorded and evaluated very quickly and accurately by an operator (see e.g Fig. 14 ).
- the data transmission from the LiDAR to the ground receiving station is a decoupled monitoring data stream with reduced point density compared to the original measurement data stream. This avoids overloading the radio link, so that the laser measurement data can be transmitted with a controlled and consistent point density without delay.
- the data throughput can be adjusted via various parameters, including the settings of the LiDAR itself, such as the firing frequency, as well as parameters of the monitor data stream extraction, e.g. transmission of every xth line, every xth point.
- the aim of thinning is to make maximum use of the data bandwidth in order to achieve the highest possible point density for further processing, but without exceeding the capacity limit.
- the laser data was thinned out and transmitted to the ground station with a bandwidth of approx. 500 KB/s, which corresponds to around 25 kPkt/s, which means that a ground point density of approx. 20-40 points/m 2 is achieved.
- the laser data is transmitted in UDP data frame size packets as a UDP data stream. Since UDP is connectionless and unsecured network protocol, possible connection interruptions lead to data loss. However, these can be tolerated because several corrective mechanisms take effect. On the one hand, the large opening angle of the sensor means that terrain sections are usually recorded several times, and on the other hand, any gaps are interpolated during terrain modeling, which means that the goal of laser data processing of creating a consistent terrain model is achieved.
- Data received from the receiving station is first decoded (see UDP data format in specification). Error correction allows incompletely received or incorrect data packets to be recognized and the affected data to be sorted out accordingly.
- the coordinates are then transformed into a metric system (EPGS:32633 - WGS 84 / UTM zone 33N; see https://epsg.io/32633), the point cloud is filtered to remove remaining outliers and finally the classification Points.
- Points in the “noise” and “unclassified” classes are filtered out because they can interfere with the result.
- Terrain models are created from the points of the remaining classes.
- a method is used as a soil filter - Simple Morphological Filter (SMRF, see Pingel, Thomas J., Keith C. Clarke, William A. McBride, "An Improved Simple Morphological Filter for the Terrain Classification of Airborne LIDAR Data", in: ISPRS Journal of Photogrammetry and Remote Sensing 77 (2013), pp. 21- 30 .) - based on morphological image processing algorithms.
- SMRF Simple Morphological Filter
- the implementation uses ever-increasing regions along with parameters to limit the gradients and image reconstruction methods.
- the vegetation filter makes use of the property that vegetation points scatter more in their spatial distribution than points on the ground 7 or other objects.
- the scatter is calculated from the covariance matrix of the n-nearest neighbors of a point. Points with increased scatter are classified as vegetation points.
- building points are characterized by special properties in spatial distribution.
- such points have a high coplanarity and, in the case of building walls, for example, also a high vertical preferred direction. These properties are used to classify building points.
- the TCP/IP network protocol was chosen for data transmission, which enables a point-to-point connection between two end points and allows loss-free transmission. This ensures that short-term connection interruptions do not result in data loss. If the connection is lost, the data accrued up to that point will be automatically transmitted when the connection is resumed.
- the background model is used in the preparation of the gamma data in two steps to eliminate the zero effect (radiation measured in the air that comes exclusively from the radiation background) of the measured radiation (residual of the radiation) in order to determine the radiation size of additional sources and an associated measure which can be used to calculate the hotspots and source localization.
- the average background is subtracted from the measured radiation value by simple subtraction in order to determine the radiation foreground.
- the value determined for the respective flight altitude h is always used, which, as shown previously, decreases with increasing altitude. In this way, increased measured values at low altitudes, such as those that occur when the copter takes off and lands, are reduced accordingly.
- Step 2 Calculate the "Source Measure”:
- This number essentially measures how many times the measured value exceeds the fluctuation range of the background radiation. Since the fluctuation range of the background radiation is related to a probability, this figure can be interpreted as a probability of the presence of an additional source, although the range of values includes all positive numbers including 0.
- the spread discussed in the background model is taken into account by determining the extent of the proportion that exceeds the 99 percentile using the following formula.
- s i R i bg H i 0.99 ⁇ bg H i 0.5 ⁇ 1 with s i the foreground key figure of the i-th measured value, R i the residual, i.e. the smoothed measured value without background and bg 0.99 , bg 0.5 are the percentiles of the background model at the corresponding level, where the 0.5 percentile is the Expected value (mean value).
- Fig. 8 shows an application of the background model.
- the original measurement data along the flight trajectory (top left) naturally exhibit scattering like the background radiation;
- the residual, smoothed, is shown at the top right.
- the probability of an additional source 2 is given in the lower part of the figure.
- the actual source position is then marked with x.
- Ground 7 (“Ground”)
- Buildings 9 and Vegetation 9 are not included.
- the ground model is interpolated to close gaps. It is used to calculate the flight altitude h above ground or when creating the radiation model.
- the model is interpolated over short distances to close small gaps.
- Fig. 9 shows the map for ground 7 (top left), the vegetation including ground points (top right) and buildings (bottom left) and color representation of the classification (bottom right).
- the primary goal of determining the hotspots on the ground 7 is to detect sources 2 in space or along lines of movement.
- the method for calculating the hotspots is designed with particular attention to performance so that results can be delivered in real time.
- the hotspot detection continuously calculates an interpolation of the radiation image measured in the air to ground level based on the current data - terrain map and gamma.
- Each increased radiation measurement value, in particular radiation peaks, is projected onto the ground in the same way and then interpolated over the entire terrain, taking into account the previously mentioned factors of height, terrain model and background radiation. This shows that from a methodological point of view there are no restrictions on the number, intensity or origin of the measured radiation sources.
- the residuals of the measured intensity values are scaled in the same ratio as the average background radiation at ground level, taking into account the flight altitude h.
- These map points 6 form base points for the subsequent interpolation.
- gaps arise in the area between the measuring points of the trajectory and outside the trajectory for which no measured values are available.
- a two-stage interpolation procedure is used Fig. 10 applied.
- Stage 2 Interpolation: After interpolation at the grid points, these are bilinearly interpolated to the size of the terrain using image processing methods in order to be able to determine an intensity value for each map point 6 ( Fig. 10 bottom right).
- Fig. 10 shows the base points from the measured values (top left), interpolation points over the terrain (top right), interpolations of the measured values for hotspot detection (bottom left), and scaling of the interpolation to the entire terrain (bottom right).
- a pseudo-Mercator is, for example, a WGS84/Pseudo-Mercator projection of the coordinates into Cartesian coordinates.
- This hotspot radiation image therefore represents a qualitative interpretation of the foreground radiation.
- the operator should note that this in no way indicates the actual radiation at ground level.
- the quantitative radiation image is only determined in the course of source localization and radiation calculation.
- local intensity maxima already indicate the positions of sources 2, which makes a method without LiDAR data sensible. Sources 2 that are particularly exposed towards the top and are partially shaded can be localized very efficiently using this method.
- the aim of the source search is to determine the sources more precisely.
- the position and strength should be determined individually for each source 2. This method differs from the previously described hotspot detection in that the origin of the measured radiation is considered to come from one or more point sources.
- the explicit knowledge about the position and strength of the sources 2 can be used for visualization on the one hand, but is also used to calculate the radiation pattern on the other.
- the starting point for the calculation is the connection between the measured values and radiation sources over the distance and intensity of the sources 2.
- each radiation source leads to a (statistical) increase in the measured radioactivity at a certain position.
- a measured value is composed (as stated in the background model) of background radiation and, depending on the arrangement, entries from all sources.
- the task of searching for sources is to find a solution for the parameters of this context. A two-step process is used for this purpose.
- Step 1 Model creation to calculate radioactivity: A model is created which, based on the terrain data and the background radiation according to the radiation propagation laws for a hypothetical source (characterized by position and strength in CPS), is able to calculate the expected radioactivity for each to calculate any point, especially for that of the trajectory.
- the radioactivity model therefore determines expected radioactivity values at any (local) location based on the terrain map and hypothetical source as input parameters.
- Step 2 Optimization of the model: By varying the model parameters (source position(s), source strength(s)) a solution is found for which the deviation of the expected radioactivity from the measured radioactivity is minimal across all measured values. In order to minimize errors, those model parameters that result in the smallest deviation are determined. These model parameters are, as mentioned above, the source position(s) and strength(s). So the radioactivity model is used to do this through variation of the model parameters to achieve an optimal comparison of the expected radioactivity with the actual measured values.
- step 1 When modeling the radioactivity values (step 1), in addition to the height-dependent background radiation already discussed, the squared distance law and attenuation are taken into account.
- a search procedure with error minimization is followed. Mathematically, this is represented as a minimization of a cost function.
- x is the expected intensity value according to the radioactivity model (step 1) with the source S and the background activity bg and the measured value M i .
- mask i indicates whether source 2 can have any influence at the position of the measurement. This was chosen so that if the expected value is above the 99% percentile of the background, an influence is assumed. It thus describes the zone of influence of source 2, which is used here in the error term to create a so-called locality. This is intended to ensure that distant measuring points - outside the effective range of the source - have no influence on the result.
- the optimization now carries out the step of minimizing the cost function.
- a brute force approach is partly followed in that the calculation is carried out for a grid (comparable to that used in hotspot detection) of possible source positions.
- the result is a map that shows the size of the error for each position on the terrain, as well as the optimal strength of a source 2 at that position.
- the sources are selected so that they lie at the locations of the local minima of the cost function.
- Fig. 11 The flight trajectory is shown along the ABCDE movement line with two loops in the form of sensing for the highest dose rate over the intensity maxima of the measured values.
- the measured values are in the three plots Fig. 12 shown along time (black lines).
- the intensity maxima of the first three flights over the first source are clearly visible, as well as the slightly smaller maxima (due to the greater distance to the ground) when flying over the second source.
- the aim is to reproduce these values with the result of the optimization using the radioactivity model.
- the optimization resulted in two sources 2 of certain strength.
- the radioactivity model resulted in the first source (plot Fig.
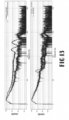
- the spectrum shows the frequency with which radiation pulses of different energies occur. From this, conclusions can be drawn about the underlying nuclide, since nuclides of different types emit very specific radiation pulses. Due to the complexity of the spectrum analysis, the assessment of which nuclide is involved is determined and specified by the expert. Alternatively, the system can be based on one nuclide type, or in an iterative process step a spectrum is first measured in the terrain, the predominant nuclide type is determined from this and then specified, and only then is the actual detection flight or drive carried out. Fig. 13 shows examples of Spectra. They were recorded during two climbs directly above a source 2. The spectra of the examples nuclide Co-60 (above) and Cs-137 (below) clearly differ in their signature, as can be seen.
- the spectrum is always an image of measurements over a longer period of time. Due to the stochastic process of radiation release, a snapshot is usually not very informative. The period over which the spectrum is accumulated should be at least several seconds. As a rule, depending on the activity, it only becomes meaningful after 1-2 minutes.
- the dose rate is a measure of the effect of radioactive or ionizing radiation on a mass and is measured in energy per unit of time. It is therefore of enormous importance for assessing the harmful effects of radioactive radiation on the human body.
- the CPS measured by the gamma probe say little about the potential effect, apart from a fundamentally linear relationship.
- the dose rate can only be determined in conjunction with the associated energy of the counting rates.
- the aim of the radiation map above ground is to determine dose rate values for the area covered from the available information. By convention, this always means a position at a height of 1 m above ground.
- dose is the dose rate in ⁇ S / h , am the number of channels in the spectrum, c i the count value of the i-th channel, degree the length of the calibration vector, A i and centers calibration data and t the integration time of the spectrum in seconds.
- the constant parameters can be precalculated, reducing the formula to a single summation.
- the total dose rate is ultimately made up of the sum of all existing sources and that of the background.
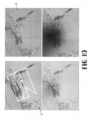
- Fig. 14 An example of a radiation image is shown below Fig. 14 shown. The comparison with the associated ground truth takes place below.
- Radiation picture in Fig. 14 contains information on dose rates and radiation lines for 10, 1 and 0.1 ⁇ S/h. The actual positions of the sources are marked with gray plus signs.
- the detection methods mentioned above can be used at any time, which are suitable for obtaining information about the radiation in a short time to gain radiation.
- Search waypoints can be adjusted live based on the radiation images evaluated in real time.
- the position of a source 2 can be determined in a short time if the flight pattern is adjusted so that the hotspot is either circled or flown over directly by sensing the highest dose rate. Setting the flight patterns is possible via the visualization.
- test flights were evaluated and the distances from the determined to the actual source position were determined, regardless of the purpose of the test flights. Some test flights aimed to determine the system limits and were therefore deliberately chosen to exceed the performance capability.
- Fig. 15 For hotspot detection, according to Fig. 15 the position was determined with an average deviation of 19.0 m. The localization method was able to determine the position of the sources with an average accuracy of 15.2 m.
- the dose rate was measured at various locations using a calibrated hand-held measuring device.
- the local differences (0.5 vs. 0.25 ⁇ Sv/h, 1.0 vs. 0.8 ⁇ Sv/h, 10 vs. 1.5 or 0.65 ⁇ Sv/h) can be partly explained by two factors: a ) the radiation source is not a perfect spherical radiator as assumed, b) in the close range of the source, even small changes in distance lead to significant changes in intensity (quadratic distance law). An even more detailed examination is possible, but not required within the scope of the invention.
- Fig. 14 shows the determined dose rate above ground (left) with contour lines for 0.5, 1.0 and 10 ⁇ S/h. Reference measurements with a handheld measuring device can be seen on the right.
Landscapes
- Physics & Mathematics (AREA)
- Health & Medical Sciences (AREA)
- Life Sciences & Earth Sciences (AREA)
- General Physics & Mathematics (AREA)
- High Energy & Nuclear Physics (AREA)
- Molecular Biology (AREA)
- Spectroscopy & Molecular Physics (AREA)
- Measurement Of Radiation (AREA)
Applications Claiming Priority (1)
| Application Number | Priority Date | Filing Date | Title |
|---|---|---|---|
| DE102022121951.8A DE102022121951B3 (de) | 2022-08-31 | 2022-08-31 | Verfahren zur Messung von Dosisleistungen radioaktiver Flächen am Boden eines Terrains |
Publications (1)
| Publication Number | Publication Date |
|---|---|
| EP4332636A1 true EP4332636A1 (fr) | 2024-03-06 |
Family
ID=87863395
Family Applications (1)
| Application Number | Title | Priority Date | Filing Date |
|---|---|---|---|
| EP23194189.9A Pending EP4332636A1 (fr) | 2022-08-31 | 2023-08-30 | Procédé de mesure des doses de zones radioactives au sol d'une terrasse |
Country Status (2)
| Country | Link |
|---|---|
| EP (1) | EP4332636A1 (fr) |
| DE (1) | DE102022121951B3 (fr) |
Families Citing this family (1)
| Publication number | Priority date | Publication date | Assignee | Title |
|---|---|---|---|---|
| CN119716951B (zh) * | 2024-12-13 | 2026-03-24 | 北京超分科技有限公司 | 放射源定位方法和电子设备 |
Citations (6)
| Publication number | Priority date | Publication date | Assignee | Title |
|---|---|---|---|---|
| EP0194933A1 (fr) | 1985-03-08 | 1986-09-17 | Commissariat A L'energie Atomique | Procédé d'obtention de cartes représentatives de l'activité gamma d'une zone survolée, et dispositif pour la mise en oeuvre du procédé |
| EP3036565A1 (fr) | 2013-08-23 | 2016-06-29 | STMI Société des Techniques en Milieu Ionisant | Modelisation 3d topographique et radiologique d'un environnement |
| FR3088306A1 (fr) | 2018-11-13 | 2020-05-15 | Orano Mining | Drone aerien pour la cartographie aeroportee d'une zone d'interet par mesure du rayonnement gamma |
| JP2020134316A (ja) * | 2019-02-20 | 2020-08-31 | 国立研究開発法人日本原子力研究開発機構 | 飛行体を用いた空間線量算出方法 |
| WO2020198877A1 (fr) | 2019-04-04 | 2020-10-08 | Atomic Energy Of Canada Limited / Énergie Atomique Du Canada Limitée | Dispositif de détection de rayonnement avec détecteur de rayonnement directionnel |
| WO2021235777A1 (fr) | 2020-05-18 | 2021-11-25 | 학교법인 김천대학교 | Détecteur de rayonnement à distance sans pilote |
Family Cites Families (1)
| Publication number | Priority date | Publication date | Assignee | Title |
|---|---|---|---|---|
| US5412569A (en) | 1994-03-29 | 1995-05-02 | General Electric Company | Augmented reality maintenance system with archive and comparison device |
-
2022
- 2022-08-31 DE DE102022121951.8A patent/DE102022121951B3/de active Active
-
2023
- 2023-08-30 EP EP23194189.9A patent/EP4332636A1/fr active Pending
Patent Citations (6)
| Publication number | Priority date | Publication date | Assignee | Title |
|---|---|---|---|---|
| EP0194933A1 (fr) | 1985-03-08 | 1986-09-17 | Commissariat A L'energie Atomique | Procédé d'obtention de cartes représentatives de l'activité gamma d'une zone survolée, et dispositif pour la mise en oeuvre du procédé |
| EP3036565A1 (fr) | 2013-08-23 | 2016-06-29 | STMI Société des Techniques en Milieu Ionisant | Modelisation 3d topographique et radiologique d'un environnement |
| FR3088306A1 (fr) | 2018-11-13 | 2020-05-15 | Orano Mining | Drone aerien pour la cartographie aeroportee d'une zone d'interet par mesure du rayonnement gamma |
| JP2020134316A (ja) * | 2019-02-20 | 2020-08-31 | 国立研究開発法人日本原子力研究開発機構 | 飛行体を用いた空間線量算出方法 |
| WO2020198877A1 (fr) | 2019-04-04 | 2020-10-08 | Atomic Energy Of Canada Limited / Énergie Atomique Du Canada Limitée | Dispositif de détection de rayonnement avec détecteur de rayonnement directionnel |
| WO2021235777A1 (fr) | 2020-05-18 | 2021-11-25 | 학교법인 김천대학교 | Détecteur de rayonnement à distance sans pilote |
Non-Patent Citations (8)
| Title |
|---|
| AMESTOY JULIEN ET AL.: "JOURNAL", vol. 237, 28 July 2021, ELSEVIER APPLIED SCIENCE PUBLISHERS, article "Effects of environmental factors on the monitoring of environmental radioactivity by airborne gamma-ray spectrometry" |
| DANIE G. KRIGE: "A statistical approach to some basic mine valuation problems on the Witwatersrand", J. OF THE CHEM., METAL. AND MINING SOC. OF SOUTH AFRICA, vol. 52, no. 6, 1951, pages 119 - 139 |
| G. F. KNOLL: "Radiation detection and measurement", 2010, JOHN WILEY & SONS |
| PETR GABRLIK ET AL: "Using an Automated Heterogeneous Robotic System for Radiation Surveys", ARXIV.ORG, CORNELL UNIVERSITY LIBRARY, 201 OLIN LIBRARY CORNELL UNIVERSITY ITHACA, NY 14853, 29 June 2020 (2020-06-29), XP081882535, DOI: 10.1002/ROB.22010 * |
| PINGEL, THOMAS J.KEITH C. CLARKEWILLIAM A. MCBRIDE: "An Improved Simple Morphological Filter for the Terrain Classification of Airborne LIDAR Data", ISPRS JOURNAL OF PHOTOGRAMMETRY AND REMOTE SENSING, vol. 77, 2013, pages 21 - 30 |
| TOWLER, J.KRAWIEC, B.KOCHERSBERGER, K.: "Radiation Mapping in Post-Disaster Environments Using an Autonomous Helicopter", REMOTE SENSING, vol. 4, no. 7, 2012, pages 1995 - 2015 |
| YUKIHISA SANADA ET AL.: "JOURNAL OF", vol. 139, 1 January 2015, ELSEVIER APPLIED SCIENCE PUBLISHERS, BARKING, article "Aerial radiation monitoring around the Fukushima Dai-ichi nuclear power plant using an unmanned helicopter", pages: 294 - 299 |
| YUKIHISA SANADA ET AL: "Aerial radiation monitoring around the Fukushima Dai-ichi nuclear power plant using an unmanned helicopter", JOURNAL OF ENVIRONMENTAL RADIOACTIVITY., vol. 139, 1 January 2015 (2015-01-01), GB, pages 294 - 299, XP055619148, ISSN: 0265-931X, DOI: 10.1016/j.jenvrad.2014.06.027 * |
Also Published As
| Publication number | Publication date |
|---|---|
| DE102022121951B3 (de) | 2024-02-22 |
Similar Documents
| Publication | Publication Date | Title |
|---|---|---|
| Connor et al. | Radiological mapping of post-disaster nuclear environments using fixed-wing unmanned aerial systems: A study from chornobyl | |
| DE69012278T2 (de) | Navigationssysteme. | |
| DE60306559T2 (de) | Verfahren und Vorrichtung zur Bestimmung von Luftturbulenz mittels bistatischen Messungen | |
| Sanada et al. | Temporal variation of dose rate distribution around the Fukushima Daiichi nuclear power station using unmanned helicopter | |
| EP4332635A1 (fr) | Procédé de localisation en temps réel de sources radioactives à l'aide d'uav | |
| Pavlovsky et al. | 3-D radiation mapping in real-time with the localization and mapping platform LAMP from unmanned aerial systems and man-portable configurations | |
| Chen et al. | In-flight performance of the Advanced Radiation Detector for UAV Operations (ARDUO) | |
| WO2015000089A1 (fr) | Procédé permettant de déterminer la trajectoire d'objets physiques mobiles dans un espace, sur la base des données de détection de plusieurs capteurs | |
| Gabrlik et al. | An automated heterogeneous robotic system for radiation surveys: Design and field testing | |
| DE102022121951B3 (de) | Verfahren zur Messung von Dosisleistungen radioaktiver Flächen am Boden eines Terrains | |
| Woodbridge et al. | Airborne gamma-ray mapping using fixed-wing vertical take-off and landing (VTOL) uncrewed aerial vehicles | |
| DE102005010155A1 (de) | Verfahren und Anordnung zum Gewinnen von Fernerkundungsdaten | |
| EP1643263B1 (fr) | Disposition et procédé de détermination d'un état d'atmosphère | |
| EP0671637B1 (fr) | Dispositif pour déterminer les irradiations dans des avions | |
| Dess et al. | Automated detection of radioisotopes from an aircraft platform by pattern recognition analysis of gamma-ray spectra | |
| Geelen et al. | Drone-borne dosimetry in a radiological or nuclear scenario | |
| Munsie et al. | Unmanned air/ground vehicle survey following a radiological dispersal event | |
| RU2673505C1 (ru) | Способ аэрогаммаспектрометрической съемки геологического назначения | |
| Martin et al. | Validation of a novel radiation mapping platform for the reduction of operator-induced shielding effects | |
| EP4102179A1 (fr) | Procédé et dispositif pour localiser une image d'un objet prise à distance | |
| Chen | Demonstration of a new gamma spectrometer designed for radiometric surveying with an unmanned aircraft system | |
| Türk et al. | Investigation of the effect of GCP number and distribution on photogrammetric product accuracy in UAV photogrammetry | |
| Mukhopadhyay et al. | Newer aerial platform for emergency response by the United States Department of Energy | |
| Di Pietro et al. | UAV Technology for Source Recovery and Emergency Response. | |
| Cardarelli et al. | Real-time radionuclide identification and mapping capabilities of the US environmental protection agency’s airborne spectral photometric environmental collection technology |
Legal Events
| Date | Code | Title | Description |
|---|---|---|---|
| PUAI | Public reference made under article 153(3) epc to a published international application that has entered the european phase |
Free format text: ORIGINAL CODE: 0009012 |
|
| STAA | Information on the status of an ep patent application or granted ep patent |
Free format text: STATUS: THE APPLICATION HAS BEEN PUBLISHED |
|
| AK | Designated contracting states |
Kind code of ref document: A1 Designated state(s): AL AT BE BG CH CY CZ DE DK EE ES FI FR GB GR HR HU IE IS IT LI LT LU LV MC ME MK MT NL NO PL PT RO RS SE SI SK SM TR |
|
| STAA | Information on the status of an ep patent application or granted ep patent |
Free format text: STATUS: REQUEST FOR EXAMINATION WAS MADE |
|
| 17P | Request for examination filed |
Effective date: 20240902 |
|
| RBV | Designated contracting states (corrected) |
Designated state(s): AL AT BE BG CH CY CZ DE DK EE ES FI FR GB GR HR HU IE IS IT LI LT LU LV MC ME MK MT NL NO PL PT RO RS SE SI SK SM TR |
|
| GRAP | Despatch of communication of intention to grant a patent |
Free format text: ORIGINAL CODE: EPIDOSNIGR1 |
|
| STAA | Information on the status of an ep patent application or granted ep patent |
Free format text: STATUS: GRANT OF PATENT IS INTENDED |
|
| INTG | Intention to grant announced |
Effective date: 20260219 |