EP4339655A1 - Erzeugungsverfahren für lernmodell, computerprogramm, schätzverfahren und schätzvorrichtung - Google Patents
Erzeugungsverfahren für lernmodell, computerprogramm, schätzverfahren und schätzvorrichtung Download PDFInfo
- Publication number
- EP4339655A1 EP4339655A1 EP22807123.9A EP22807123A EP4339655A1 EP 4339655 A1 EP4339655 A1 EP 4339655A1 EP 22807123 A EP22807123 A EP 22807123A EP 4339655 A1 EP4339655 A1 EP 4339655A1
- Authority
- EP
- European Patent Office
- Prior art keywords
- altitude
- data
- measurement data
- water vapor
- learning model
- Prior art date
- Legal status (The legal status is an assumption and is not a legal conclusion. Google has not performed a legal analysis and makes no representation as to the accuracy of the status listed.)
- Granted
Links
Images






Classifications
-
- G—PHYSICS
- G01—MEASURING; TESTING
- G01W—METEOROLOGY
- G01W1/00—Meteorology
- G01W1/10—Devices for predicting weather conditions
-
- G—PHYSICS
- G01—MEASURING; TESTING
- G01N—INVESTIGATING OR ANALYSING MATERIALS BY DETERMINING THEIR CHEMICAL OR PHYSICAL PROPERTIES
- G01N33/00—Investigating or analysing materials by specific methods not covered by groups G01N1/00 - G01N31/00
- G01N33/18—Water
-
- G—PHYSICS
- G01—MEASURING; TESTING
- G01N—INVESTIGATING OR ANALYSING MATERIALS BY DETERMINING THEIR CHEMICAL OR PHYSICAL PROPERTIES
- G01N22/00—Investigating or analysing materials by the use of microwaves or radio waves, i.e. electromagnetic waves with a wavelength of one millimetre or more
-
- G—PHYSICS
- G01—MEASURING; TESTING
- G01W—METEOROLOGY
- G01W1/00—Meteorology
- G01W1/08—Adaptations of balloons, missiles, or aircraft for meteorological purposes; Radiosondes
-
- G—PHYSICS
- G01—MEASURING; TESTING
- G01W—METEOROLOGY
- G01W1/00—Meteorology
- G01W1/14—Rainfall or precipitation gauges
-
- G—PHYSICS
- G06—COMPUTING OR CALCULATING; COUNTING
- G06N—COMPUTING ARRANGEMENTS BASED ON SPECIFIC COMPUTATIONAL MODELS
- G06N20/00—Machine learning
-
- G—PHYSICS
- G06—COMPUTING OR CALCULATING; COUNTING
- G06N—COMPUTING ARRANGEMENTS BASED ON SPECIFIC COMPUTATIONAL MODELS
- G06N3/00—Computing arrangements based on biological models
- G06N3/02—Neural networks
- G06N3/08—Learning methods
-
- Y—GENERAL TAGGING OF NEW TECHNOLOGICAL DEVELOPMENTS; GENERAL TAGGING OF CROSS-SECTIONAL TECHNOLOGIES SPANNING OVER SEVERAL SECTIONS OF THE IPC; TECHNICAL SUBJECTS COVERED BY FORMER USPC CROSS-REFERENCE ART COLLECTIONS [XRACs] AND DIGESTS
- Y02—TECHNOLOGIES OR APPLICATIONS FOR MITIGATION OR ADAPTATION AGAINST CLIMATE CHANGE
- Y02A—TECHNOLOGIES FOR ADAPTATION TO CLIMATE CHANGE
- Y02A90/00—Technologies having an indirect contribution to adaptation to climate change
- Y02A90/10—Information and communication technologies [ICT] supporting adaptation to climate change, e.g. for weather forecasting or climate simulation
Definitions
- the disclosure relates to a generation method for a learning model, a computer program, an estimation method, and an estimation device.
- a GNSS receiver, a microwave radiometer, and the like are used for observation of a precipitable water amount, that is, water vapor observation.
- Water vapor observation using a global navigation satellite system (GNSS) receiver uses radio waves of a plurality of frequencies radiated from satellites. When radio waves of two or more different frequencies radiated from four or more satellites can be received, it is possible to ascertain a delay of radio waves.
- the delay of radio waves corresponds to an amount of water vapor and enables observation of the amount of water vapor (for example, Patent Literature 1).
- a rainfall prediction system described in Patent Literature 1 calculates a precipitable water amount based on a zenith atmosphere delay calculated from received GPS (GNSS) data and orbit information of satellites.
- Patent Literature 1 since the rainfall prediction system described in Patent Literature 1 calculates the precipitable water amount based on the GNSS data and requires orbit information of satellites, it is difficult to improve a temporal resolution for calculating the precipitable water amount. Altitude-by-altitude water vapor densities cannot be calculated from GNSS data.
- the disclosure was made in consideration of the aforementioned circumstances and provides a generation method for a learning model or the like that can efficiently estimate altitude-by-altitude water vapor densities or a precipitable water amount.
- a generation method for a learning model including: acquiring training data including altitude-by-altitude water vapor densities or a precipitable water amount obtained from first measurement data measured by a microwave radiometer and second measurement data measured by a radiosonde; and generating the learning model that, when the first measurement data is input, outputs the altitude-by-altitude water vapor densities or the precipitable water amount based on the training data that is acquired.
- a program causing a computer to preform: acquiring first measurement data measured by a microwave radiometer; and inputting the first measurement data that is acquired to a learning model that, when the first measurement data is input, outputs altitude-by-altitude water vapor densities or a precipitable water amount, and outputting the altitude-by-altitude water vapor densities or the precipitable water amount.
- an estimation method that is performed by a computer.
- the estimation method includes: in the computer, acquiring first measurement data measured by a microwave radiometer; and inputting the first measurement data that is acquired to a learning model that, when the first measurement data is input, outputs altitude-by-altitude water vapor densities or a precipitable water amount, and estimating the altitude-by-altitude water vapor densities or the precipitable water amount.
- an estimation device including: an acquisition unit configured to acquire first measurement data measured by a microwave radiometer; and an estimation unit configured to input the first measurement data that is acquired to a learning model that, when the first measurement data is input, outputs altitude-by-altitude water vapor densities or a precipitable water amount, and estimate the altitude-by-altitude water vapor densities or the precipitable water amount.
- FIG. 1 is a block diagram showing an example of a configuration of a microwave radiometer 1 according to a first embodiment.
- the microwave radiometer 1 is communicatively connected to an external server G (a sonde data server) in which altitudinal temperature, humidity, and air pressure (sonde data) measured by a radiosonde are stored via an external network such as the Internet.
- G a sonde data server
- altitudinal temperature, humidity, and air pressure (sonde data) measured by a radiosonde are stored via an external network such as the Internet.
- the microwave radiometer 1 generates training data based on sonde data such as altitude-by-altitude temperatures acquired from the external server G and radio field intensities of microwaves measured at an observation spot at which a radiosonde for observing the sonde data is released.
- the sonde data such as altitude-by-altitude temperatures acquired from the external server G corresponds to second measurement data, and the radio field intensities of microwaves measured by the microwave radiometer 1 at the observation spot at which the radiosonde is released corresponds to first measurement data.
- the microwave radiometer 1 serves as a learning model generation device that trains, for example, parameters of a neural network using the generated training data and generating a precipitable water amount model 121, an altitudinal water vapor distribution model 122, or both models.
- the microwave radiometer 1 serves as a precipitable water amount estimation device (a water vapor observation device) that estimates a precipitable water amount in the sky in the vertical direction at a spot at which the microwave radiometer 1 is installed by inputting radio field intensities of microwaves measured at the spot to the precipitable water amount model 121.
- the microwave radiometer 1 serves as an altitudinal water vapor distribution estimation device (a water vapor observation device) that estimates altitude-by-altitude water vapor densities (an altitudinal water vapor distribution) in the sky in the vertical direction at the spot at which the microwave radiometer 1 is installed by inputting the radio field intensities of microwaves measured at the spot to the generated altitudinal water vapor distribution model 122.
- an altitudinal water vapor distribution estimation device a water vapor observation device
- the microwave radiometer 1 generates training data for generating a learning model (the precipitable water amount model 121 or the altitudinal water vapor distribution model 122) based on the measured radio field intensities of microwaves, but is not limited thereto.
- the microwave radiometer 1 may generate the learning model using training data which is generated based on temperature, humidity, air pressure, and rainfall at the spot at which the microwaves have been measured in addition to the radio field intensities of microwaves.
- the microwave radiometer 1 generates input data for generating a learning model (the precipitable water amount model 121 or the altitudinal water vapor distribution model 122) based on the measured radio field intensities of microwaves, but is not limited thereto.
- the microwave radiometer 1 may acquire a precipitable water amount or an altitudinal water vapor distribution by inputting the input data which is generated based on temperature, humidity, air pressure, and rainfall at the spot at which the microwaves have been measured to the learning model (the precipitable water amount model 121 or the altitudinal water vapor distribution model 122) in addition to the radio field intensities of microwaves.
- the external server G is constituted by, for example, a cloud server connected to the Internet or the like and is managed by a public institution (the Japan Meteorological Agency) that operates radiosondes.
- sonde data such as altitudinal temperature, humidity (relative humidity), and air pressure measured (observed) by the radiosondes released at observation spots is stored in correlation with the observation spots and the observation date and time.
- the sonde data can be acquired by accessing the external server G.
- the microwave radiometer 1 includes a microwave measuring unit 15 configured to measure microwaves radiated from the atmosphere and a temperature sensor 141, a humidity sensor 142, an air pressure sensor 143, and a rain sensor 144 for acquiring climatological data at the spot at which the microwave radiometer 1 is installed.
- the microwave radiometer 1 further includes a control unit 11, a storage unit 12, a communication unit 13, and an input/output I/F 14 for processing or handling various types of measurement data acquired by the sensor group.
- the microwave measuring unit 15 includes, for example, a radio wave window, a black body, a receiving horn, and an AD conversion circuit, receives microwaves input through the radio wave window using the receiving horn, and converts the received microwaves to radio field intensities (dB) for frequencies using the AD conversion circuit.
- microwaves of about 40 channels (frequencies) in the range of from 16 GHz to 26 GHz are measured, and a radio field intensity (dB) of each of the 40 channels is measured.
- the peak of the radio field intensities of radio waves radiated from water vapor and cloud water in the sky appears at 22 GHz, and it is possible to improve identification accuracy of a water vapor component and a cloud water component by acquiring (measuring) the radio field intensities of the about 40 channels (frequencies) in the range of from 16 GHz to 26 GHz.
- the microwave radiometer 1 alternately acquires microwaves radiated from a black body and microwaves radiated from the sky by periodically causing the black body to pass through the reception range of the receiving horn using a motor or the like and periodically positioning the black body to cover the receiving horn with respect to the sky.
- the black body is constituted, for example, by vantablack and corresponds to a reference radio wave absorber.
- the microwave radiometer 1 repeatedly performs a process of measuring microwaves from the reference radio wave absorber (the black body), for example, for 10 seconds and then measuring microwaves from the sky, for example, for 10 seconds.
- the microwave radiometer 1 acquires a difference value (sky-bb [dB]) obtained by subtracting the radio field intensity (bb [dB]) of the microwaves from the black body from the radio field intensity (sky [dB]) of the microwaves from the sky as the radio field intensity of the measured microwaves for each of the 40 channels (frequencies).
- the microwave radiometer 1 may automatically calibrate linearity of analog instruments or the like (detector calibration).
- the microwave radiometer 1 may switch an attenuator connected to the receiving horn, ascertain whether a digital value obtained by conversion in the AD conversion circuit is linear with respect to a pre-conversion analog value (both are in a proportional relationship based on an ideal straight line), and perform linearity calibration of an analog system when the digital value obtained by AD conversion exceeds an allowable error range.
- the temperature sensor 141 is constituted, for example, by a thermistor and detects air temperature at the spot at which the microwave radiometer 1 is installed.
- the humidity sensor 142 is, for example, a capacitance-change or resistance-change electric sensor, detects an amount of water vapor in the ambient air of the spot at which the microwave radiometer 1 is installed, and converts the detected amount to an electrical signal.
- the air pressure sensor 143 is constituted, for example, by a pressure receiving device and detects air pressure (atmospheric pressure) at the spot at which the microwave radiometer 1 is installed.
- the rain sensor 144 is, for example, a sensor that linearly changes a voltage value which is output based on an amount of rainfall, detects an amount of rainfall at the spot at which the microwave radiometer 1 is installed, and converts the detected amount to an electrical signal.
- the microwave measuring unit 15, the temperature sensor 141, the humidity sensor 142, the air pressure sensor 143, and the rain sensor 144 are communicatively connected to the control unit 11 and the storage unit 12, for example, via the input/output I/F 14 or an internal bus. Measurement data measured by the microwave measuring unit 15, the temperature sensor 141, and the like is correlated with time information indicating a time point at which it is measured and is stored, for example, as time-series data in a table form (see FIG. 3 ) in the storage unit 12.
- the control unit 11 includes an arithmetic processing unit having a timer function such as one or more central processing units (CPUs), micro-processing units (MPUs), or graphics processing units (GPUs) and performs various information processes, a control process on the microwave measuring unit 15, and the like by reading and executing a program P stored in the storage unit 12.
- CPUs central processing units
- MPUs micro-processing units
- GPUs graphics processing units
- the storage unit 12 includes a volatile storage area such as a static random access memory (SRAM), a dynamic random access memory (DRAM), or a flash memory and a non-volatile storage area such as an EEPROM or a hard disk.
- the program P and data which is referred to at the time of processing are stored in the storage unit 12 in advance.
- the program P stored in the storage unit 12 may be a program P (a program product) which is read from a recording medium 120 readable by the control unit 11 and which is stored therein.
- a program P (a program product) may be downloaded from an external computer (not illustrated) connected to a communication network which is not illustrated and stored in the storage unit 12.
- Actual files constituting learning models (the precipitable water amount model 121 and the altitudinal water vapor distribution model 122) are stored in the storage unit 12. These actual files may constitute a part of the program P.
- the communication unit 13 is a communication module or a communication interface for communicating with an external server G (a sonde data server) in a wired or wireless manner and includes, for example, a local-area radio communication module such as Wi-Fi (registered trademark) or Bluetooth (registered trademark) or a wide-area radio communication module such as 4G or 5G.
- the control unit 11 communicates with the external server G via an external network such as the Internet using the communication unit 13.
- the input/output I/F 14 includes, for example, a communication interface based on a communication protocol such as USB or a connector for connection to the internal bus.
- the microwave measuring unit 15, the temperature sensor 141, the humidity sensor 142, the air pressure sensor 143, and the rain sensor 144 may be connected to the input/output I/F 14.
- a display device 16 such as a liquid crystal display may be additionally connected to the input/output I/F 14.
- the microwave radiometer 1 includes the microwave measuring unit 15, various sensors, and the control unit 11 for performing data processing, but is not limited thereto.
- the control unit 11 or the like for performing data processing may be provided in a computer separate from the microwave radiometer 1, the microwave radiometer 1 and the computer may be communicatively connected, and the computer may perform generation of learning models and estimation using the learning models by processing various types of data measured by the microwave radiometer 1.
- the computer may acquire (receive) observation data (radio field intensities and climatological data) from microwave radiometers 1 installed at a plurality of observation spots which are observed by radiosondes and generate training data based on the observation data and the sonde data for each observation spot.
- the learning models (a precipitable water amount model and an altitudinal water vapor distribution model) having learned the observation data and the sonde data at the plurality of observation spots in this way may be applied to the individual microwave radiometers 1, and the individual microwave radiometers 1 may perform an estimation process using the learning models.
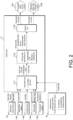
- FIG. 2 is a functional block diagram illustrating functional units (at the time of learning) included in the control unit 11 of the microwave radiometer 1.
- the control unit 11 of the microwave radiometer 1 serves as an acquisition unit 111, a training data generating unit 112, and a training unit 113 by executing a program P stored in the storage unit 12.
- the acquisition unit 111 acquires, for example, radio field intensities (first measurement data) in each of about 40 channels (frequencies) in the range of from 16 GHz to 26 GHz from the microwave measuring unit 15.
- the acquisition unit 111 acquires measured values (climatological data) such as temperature output from the temperature sensor 141, the humidity sensor 142, the air pressure sensor 143, and the rain sensor 144.
- the acquisition unit 111 acquires the radio field intensities (first measurement data) and the measured values (climatological data) such as temperature, the microwave radiometer 1 is installed in a spot (area) in which observation by a radiosonde is performed.
- a time period in which the acquisition unit 111 acquires the radio field intensities (first measurement data) and the measured values (climatological data) is the same as a time period in which observation by the radiosonde is performed. That is, the radio field intensities (first measurement data) and the measured values (climatological data) such as temperature acquired by the acquisition unit 111 geographically and temporally correspond to sonde data observed (measured) by the radiosonde.
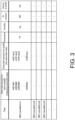
- FIG. 3 is an explanatory diagram illustrating an example of observation data from the microwave radiometer 1.
- the acquisition unit 111 correlates the acquired radio field intensities (first measurement data) and the measured values (climatological data) such as temperature with a time point (a measurement time point) at which the data has been acquired and stores the correlated data, for example, in a table format (an observation data table) in the storage unit 12.
- the observation data table includes time, a radio field intensity from a black body, a radio field intensity from the sky, temperature, humidity, air pressure, and rainfall as management items (fields).
- the management item (field) of time date and time information indicating a date and time indicating of an observation time point (an acquisition time point) of observation data (radio field intensities and climatological data) is stored.
- radio field intensities of about 40 channels (frequencies) in the range of from 16 GHz to 26 GHz radiated from the black body are stored as calibrating observation data.
- radio field intensities of about 40 channels (frequencies) in the range of from 16 GHz to 26 GHz radiated from the sky are stored as sky observation data.
- the radio field intensities from the black body and the sky are stored in a table format, but is not limited thereto.
- a difference value (sky-bb) obtained by subtracting the radio field intensity (bb) of the black body from the radio field intensity (sky) of the sky may be stored.
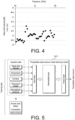
- FIG. 4 is an explanatory diagram illustrating an example of the radio field intensity of microwaves (sky-bb) included in the observation data.
- the vertical axis represents the radio field intensity of the difference value (sky-bb) and the horizontal axis represents a channel (frequency).
- the difference value (sky-bb) obtained by subtracting the radio field intensity (bb) of the black body from the radio field intensity (sky) of the sky has, for example, a negative value of from 0 dB to about -5 dB.
- the air temperature at the spot at which the microwave radiometer 1 is installed is stored.
- the management item (field) of humidity absolute humidity or relative humidity at the spot at which the microwave radiometer 1 is installed is stored.
- the management item (field) of air pressure the air pressure (atmospheric pressure) at the spot at which the microwave radiometer 1 is installed is stored.
- a voltage value indicating an amount of rainfall at the spot at which the microwave radiometer 1 is installed is stored.
- the acquisition unit 111 acquires altitude-by-altitude temperatures, humidity, and air pressure (sonde data) measured by the radiosonde from the external server G.
- the sonde data and the observation data geographically and temporally correspond to each other.
- the training data generating unit 112 generates training data for generating (training) the precipitable water amount model 121 and the altitudinal water vapor distribution model 122 based on the observation data (the radio field intensities and the climatological data) measured by the microwave radiometer 1 and the sonde data acquired from the external server G.
- the training data includes question data generated based on the observation data (the radio field intensities and the climatological data) and answer data generated based on the sonde data.
- the radio field intensity is expressed as the difference value (sky-bb) obtained by subtracting the radio field intensity (bb) of the black body from the radio field intensity (sky) of the sky.
- the training data generating unit 112 may generate question data based on a plurality of pieces of observation data (the radio field intensities and the climatological data) measured at a plurality of time points included in a time period in which the sonde data is observed (measured).
- the training data generating unit 112 may generate question data based on averaged, standardized, or normalized observation data (radio field intensities and climatological data) by performing an averaging process, a standardization process, or a normalization process on the observation data (the radio field intensities and the climatological data) at the plurality of time points. That is, the training data generating unit 112 may include a standardization unit for standardizing observation data or the like.
- the training data generating unit 112 may perform a dimension reducing process on first measurement data including, for example, the radio field intensities of about 40 channels (frequencies) in the range of from 16 GHz to 26 GHz and generate question data based on the first measurement data subjected to the dimension reducing process. That is, the training data generating unit 112 may include a dimension reducing unit that performs the dimension reducing process on the observation data.
- the dimension reducing process may perform the dimension reduction, for example, using principal component analysis (PCA) on the radio field intensities at a plurality of frequencies and use a particular number of principal components subsequent to the first rank as the first measurement data for generating (training) a learning model.
- PCA principal component analysis
- the dimension reducing process may set the particular number of principal components to be, for example, 3 and select a first principal component, a second principal component, and a third principal component.
- the principal component analysis is not limited to PCA, and may use an algorithm such as factor analysis, multiple factor analysis, autoencoder, independent component analysis, or non-negative matrix factor analysis.
- the training data generating unit 112 generates question data based on the radio field intensities and the climatological data (temperature, humidity, air pressure, and rainfall) measured by the microwave radiometer 1, but is not limited thereto.
- the training data generating unit 112 may generate question data based on only the radio field intensity measured by the microwave radiometer 1.
- the training data generating unit 112 may generate question data based on temperature, humidity, and air pressure in addition to the radio field intensity. That is, the training data generating unit 112 may generate question data based on some data included in the climatological data in addition to the radio field intensity.
- the altitude-by-altitude water vapor densities corresponds to answer data for generating (training) the altitudinal water vapor distribution model 122.
- the precipitable water amount corresponds to answer data for generating (training) the precipitable water amount model 121.
- the question data generated based on the observation data is common data (question data) in generating (training) the precipitable water amount model 121 and the altitudinal water vapor distribution model 122.
- the training data generating unit 112 generates training data for the altitudinal water vapor distribution model 122 for generating (training) the altitudinal water vapor distribution model 122 using the question data and the answer data including the altitude-by-altitude water vapor densities (altitudinal water vapor distribution) generated based on the sonde data.
- the training data generating unit 112 generates training data for the precipitable water amount model 121 for generating (training) the precipitable water amount model 121 using the question data and the answer data including the precipitable water amount generated based on the sonde data.
- FIG. 5 is a diagram schematically illustrating an example of a method of generating the precipitable water amount model 121 using machine learning.
- the training unit 113 trains a neural network using the training data for the precipitable water amount model 121 and generates the precipitable water amount model 121 with the observation data (the radio field intensities and the climatological data) as an input and with the precipitable water amount as an output.
- the neural network (the precipitable water amount model 121) trained using the training data is assumed to be used as a program P module which is a part of artificial intelligence software.
- the precipitable water amount model 121 is used by the microwave radiometer 1 including the control unit 11 (such as the CUP) and the storage unit 12 as described above and is performed in the microwave radiometer 1 having such arithmetic processing capability to constitute a neural network system.
- the precipitable water amount model 121 is constituted, for example, by a deep neural network (DNN) and includes an input layer for receiving an input of observation data, an intermediate layer for extracting feature quantities of the observation data, and an output layer for outputting a precipitable water amount.
- the input layer includes a plurality of neurons for receiving an input of values such as radio field intensities or temperature included in the observation data and delivers the input values to the intermediate layer.
- the intermediate layer is defined using an activation function such as an ReLu function or a sigmoid function, includes a plurality of neurons for extracting feature quantities of the input values, and delivers the extracted feature quantities to the output layer. Parameters such as weighting factors and bias values in the activation function are optimized using an error back-propagation method.
- the output layer is constituted, for example, by a fully coupled layer and outputs a precipitable water amount based on the feature quantities output from the intermediate layer.
- the precipitable water amount model 121 is a DNN, but is not limited thereto and it may be a learning model constructed using another learning algorithm of a neural network other than the DNN, such as a recurrent neural network (RNN), a long-short term model (LSTM), a CNN, a support vector machine (SVM), a Bayesian network, linear regression, a regression tree, multiple regression, random forest, or ensemble.
- RNN recurrent neural network
- LSTM long-short term model
- SVM support vector machine
- Bayesian network a Bayesian network
- linear regression a regression tree
- multiple regression random forest, or ensemble.
- the transformation is defined by an inner product of vectors between the same number of unknown coefficients (S1 to Sn) as the number of dimensions (n) of observation data (the radio field intensities and the climatological data) subjected to principal component analysis and the observation data subjected to principal component analysis, and these coefficients (S1 to Sn) are calculated, for example, by fitting using a least square method.
- FIG. 6 is a diagram schematically illustrating an example of a method of generating the altitudinal water vapor distribution model 122 through machine learning.
- the training unit 113 trains a neural network using the training data for an altitudinal water vapor distribution model 122 and generates an altitudinal water vapor distribution model 122 with the observation data (the radio field intensities and the climatological data) as an input and with the altitudinal water vapor densities (the altitudinal water vapor distribution) as an output.
- the altitudinal water vapor distribution model 122 is constituted, for example, by a DNN and includes an input layer for receiving an input of observation data, an intermediate layer for extracting feature quantities of the observation data, and an output layer for outputting an altitudinal water vapor distribution.
- the altitudinal water vapor distribution model 122 may be expressed by a transformation using polynomial regression using multiple regression including a plurality of types of variables. In this way, the altitudinal water vapor distribution model 122 has the same configuration as the precipitable water amount model 121, and the training unit 113 generates a altitudinal water vapor distribution model 122 in the same way as the precipitable water amount model 121.
- FIG. 7 is a flowchart illustrating an example of a routine (at the time of learning) that is performed by the control unit 11 of the microwave radiometer 1.
- the control unit 11 of the microwave radiometer 1 receives an operation from an operator via a keyboard connected to the input/output I/F 14 and performs the following processes based on the received operation.
- the control unit 11 of the microwave radiometer 1 acquires first measurement data measured by the microwave radiometer 1 (the microwave measuring unit 15) (S1). For example, the control unit 11 of the microwave radiometer 1 acquires radio field intensities (first measurement data) in about 40 channels (frequencies) in the range of from 16 GHz to 26 GHz.
- the control unit 11 of the microwave radiometer 1 may use a difference value (sky-bb) obtained by subtracting a radio field intensity (bb) of a black body from a radio field intensity (sky) of the sky in each of the channels (frequencies) as the first measurement data.
- the control unit 11 of the microwave radiometer 1 acquires climatological data of a spot at which the microwave radiometer 1 is installed (S2).
- the control unit 11 of the microwave radiometer 1 acquires measured values (climatological data) such as temperature or the like output from the temperature sensor 141, the humidity sensor 142, the air pressure sensor 143, and the rain sensor 144.
- the radio field intensities (first measurement data) and the measured values (climatological data) such as temperature geographically and temporally correspond to sonde data measured by a radiosonde.
- the acquisition of climatological data is not limited to acquisition from the sensors such as the temperature sensor 141 provided in the microwave radiometer 1, and the control unit 11 of the microwave radiometer 1 may acquire climatological data of the spot at which the microwave radiometer 1 is installed, for example, from a climatological data server connected to the Internet or the like via the communication unit 13.
- the control unit 11 of the microwave radiometer 1 acquires second measurement data measured by the radiosonde (S3).
- the control unit 11 of the microwave radiometer 1 accesses the external server G (the sonde data server) via the communication unit 13 and acquires sonde data (second measurement data) including altitude-by-altitude temperatures, humidity, and air pressure measured by the radiosonde.
- the control unit 11 of the microwave radiometer 1 generates training data for training the altitudinal water vapor distribution model 122 (a learning model) that outputs altitude-by-altitude water vapor densities based on the first measurement data, the climatological data, and the second measurement data (S4).
- the control unit 11 of the microwave radiometer 1 generates training data for the altitudinal water vapor distribution model 122 based on the observation data (the radio field intensities and the climatological data) measured by the microwave radiometer 1 and the sonde data acquired from the external server G.
- the control unit 11 of the microwave radiometer 1 may perform a standardization process or a dimension reducing process on the observation data (the radio field intensities and the climatological data) at a plurality of time points.
- the control unit 11 of the microwave radiometer 1 generates the altitudinal water vapor distribution model 122 (a learning model) by performing training using the training data (S5).
- the control unit 11 of the microwave radiometer 1 generates the altitudinal water vapor distribution model 122 (a learning model), for example, by training a neural network using the training data for the altitudinal water vapor distribution model 122.
- the control unit 11 of the microwave radiometer 1 generates training data for training the precipitable water amount model 121 (a learning model) that outputs a precipitable water amount based on the first measurement data, the climatological data, and the second measurement data (S6).
- the control unit 11 of the microwave radiometer 1 generates training data for the precipitable water amount model 121 based on the observation data (the radio field intensities and the climatological data) measured by the microwave radiometer 1 and the sonde data acquired from the external server G.
- the control unit 11 of the microwave radiometer 1 may perform a standardization process or a dimension reducing process on the observation data (the radio field intensities and the climatological data) at a plurality of time points.
- the control unit 11 of the microwave radiometer 1 generates the precipitable water amount model 121 (a learning model) by performing training using the training data (S7).
- the control unit 11 of the microwave radiometer 1 generates the precipitable water amount model 121 (a learning model), for example, by training a neural network using the training data for the precipitable water amount model 121.
- the control unit 11 of the microwave radiometer 1 acquires the radio field intensities (first measurement data) and the climatological data as the observation data, but is not limited thereto.
- the control unit 11 of the microwave radiometer 1 may generate training data based on only the radio field intensities (the first measurement) or some of the climatological data such as temperature, humidity, and air pressure in addition to the radio field intensities (the first measurement data) and generate the precipitable water amount model 121 and the altitudinal water vapor distribution model 122.
- the control unit 11 of the microwave radiometer 1 may re-acquire training data including the first measurement data and the second measurement data and re-train the learning models generated already based on the re-acquired training data.
- Re-training of the learning models is not limited to fine tuning or transfer learning of a learning model generated already, and the learning models may be re-generated by training non-trained neural network using training data in which the re-acquired training data is added to the previously used training data.
- the control unit 11 of the microwave radiometer 1 may re-training the generated learning model in operating the generated learning model.
- control unit 11 of the microwave radiometer 1 may derive a difference between a precipitable water amount estimated using the learning model and a precipitable water amount calculated based on the sonde data and re-train the learning model when the difference is greater than a particular value.
- FIG. 8 is a functional block diagram illustrating functional units (at the time of operating) included in the control unit 11 of the microwave radiometer 1.
- the control unit 11 of the microwave radiometer 1 serves as an acquisition unit 111, an input data generating unit 114, and an output unit 115 by executing a program P stored in the storage unit 12.
- the acquisition unit 111 acquires, for example, a radio field intensity (first measurement data) in each of about 40 channels (frequencies) in the range of from 16 GHz to 26 GHz from the microwave measuring unit 15.
- the acquisition unit 111 acquires measured values (climatological data) such as temperature or the like output from the temperature sensor 141, the humidity sensor 142, the air pressure sensor 143, and the rain sensor 144.
- the observation data including the radio field intensities and the climatological data acquired by the acquisition unit 111 is correlated with time points (measurement time points) at which the data has been acquired and stored, for example, in a table format (an observation data table) in the storage unit 12.
- the input data generating unit 114 generates input data to be input to the precipitable water amount model 121 and the altitudinal water vapor distribution model 122 based on the observation data acquired by the acquisition unit 111.
- the radio field intensity included in the input data may be expressed as a difference value (sky-bb) obtained by subtracting the radio field intensity (bb) of the black body from the radio field intensity (sky) of the sky.
- the input data generating unit 114 may generate input data based on a plurality of pieces of observation data measured at a plurality of time points in a particular time period. Similarly to the training data generating unit 112, the input data generating unit 114 may generate input data by performing a standardization process or a dimension reducing process on the observation data at the plurality of time points.
- the input data generating unit 114 inputs the generated input data to the precipitable water amount model 121 and the altitudinal water vapor distribution model 122. In this way, the input data input to the precipitable water amount model 121 and the altitudinal water vapor distribution model 122 may be common.
- the precipitable water amount model 121 estimates a precipitable water amount based on the input data input thereto.
- the altitudinal water vapor distribution model 122 estimates altitude-by-altitude water vapor densities (altitudinal water vapor distribution) based on the input data input thereto.
- the output unit 115 converts the precipitable water amount estimated by the precipitable water amount model 121 and the altitude-by-altitude water vapor densities (altitudinal water vapor distribution) estimated by the altitudinal water vapor distribution model 122 to, for example, image data in the form of a graph and outputs the image data to the display device 16.
- the output unit 115 may convert the precipitable water amounts and the altitude-by-altitude water vapor densities (altitudinal water vapor distributions) at a plurality of successive observation time points to image data in the form of a graph indicating temporal change.
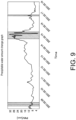
- FIG. 9 is an explanatory diagram (a precipitable water amount change graph) illustrating an example of change information of graphed precipitable water amounts.
- the precipitable water amount change graph is an example of a graph indicating temporal change of the precipitable water amount at a plurality of successive observation time points.
- the horizontal axis of the precipitable water amount change graph represents the observation time point using the microwave radiometer 1.
- the vertical axis represents a precipitable water amount (PWV) in the sky (the atmosphere in the vertical direction) at the observation spot using the microwave radiometer 1.
- PWV precipitable water amount
- FIG. 10 is an explanatory diagram (a altitudinal water vapor distribution graph) illustrating an example of a graphed altitudinal water vapor distribution.
- the altitudinal water vapor distribution graph is an example of a graph indicating temporal change of the altitude-by-altitude water vapor densities (altitudinal water vapor distribution) at a plurality of successive observation time points.
- the horizontal axis of the altitudinal water vapor distribution graph represents the observation time point using the microwave radiometer 1.
- the vertical axis represents the altitude of the sky (the atmosphere in the vertical direction) at the observation spot using the microwave radiometer 1.
- the water vapor density is indicated by a contour diagram in which gradations of color tones vary according to the density.
- FIG. 11 is a flowchart illustrating an example of a routine (at the time of operating) that is performed by the control unit 11 of the microwave radiometer 1.
- the control unit 11 of the microwave radiometer 1 receives an operation from an operator via a keyboard connected to the input/output I/F 14 and performs the following processes based on the received operation.
- the control unit 11 of the microwave radiometer 1 acquires first measurement data measured by the microwave radiometer 1 (the microwave measuring unit 15) (S101). For example, the control unit 11 of the microwave radiometer 1 acquires climatological data at a spot at which the microwave radiometer 1 is installed (S102). Similarly to the processes of S1 and S2, the control unit 11 of the microwave radiometer 1 performs the processes of S101 and S 102.
- the control unit 11 of the microwave radiometer 1 generates input data based on the first measurement data and the climatological data (S103).
- the radio field intensity included in the input data may be expressed as a difference value (sky-bb) obtained by subtracting the radio field intensity (bb) of the black body from the radio field intensity (sky) of the sky.
- the control unit 11 of the microwave radiometer 1 may generate the input data based on a plurality of pieces of measurement data measured at a plurality of time points in a particular time period.
- the control unit 11 of the microwave radiometer 1 may generate the input data by performing a standardization process or a dimension reducing process on the observation data at the plurality of time points.
- the control unit 11 of the microwave radiometer 1 inputs the input data to the altitudinal water vapor distribution model 122 and acquires altitude-by-altitude water vapor densities (altitudinal water vapor distribution) (S104).
- the control unit 11 of the microwave radiometer 1 inputs the input data to the altitudinal water vapor distribution model 122 and acquires the altitude-by-altitude water vapor densities (altitudinal water vapor distribution) estimated by the precipitable water amount model 121.
- the control unit 11 of the microwave radiometer 1 outputs the altitude-by-altitude water vapor densities (altitudinal water vapor distribution) (S105). For example, the control unit 11 of the microwave radiometer 1 graphs information on the altitude-by-altitude water vapor densities (altitudinal water vapor distribution) and outputs the graphed information to the display device 16.
- the control unit 11 of the microwave radiometer 1 inputs the input data to the precipitable water amount model 121 and acquires a precipitable water amount (S106).
- the control unit 11 of the microwave radiometer 1 inputs the input data to the precipitable water amount model 121 and acquires the precipitable water amount estimated by the precipitable water amount model 121.
- the control unit 11 of the microwave radiometer 1 outputs the precipitable water amount (S107). For example, the control unit 11 of the microwave radiometer 1 graphs information on the precipitable water amount and outputs the graphed information to the display device 16.
- the control unit 11 of the microwave radiometer 1 performs a loop process to perform the routine from S101 again after the process of S107 has been performed. By repeating the processes from S101 to S107 in this way, it is possible to add or update and continue to output information on the precipitable water amount and the altitudinal water vapor distribution changing in a time series based on the successive observation results from the microwave radiometer 1.
- the control unit 11 of the microwave radiometer 1 may periodically update the graph displayed on the display device 16 by continuing to graph information on the precipitable water amount and the altitudinal water vapor distribution changing in a time series and to output the graphed information to the display device 16.
- the control unit 11 of the microwave radiometer 1 can acquire the (a plurality of time-series) precipitable water amounts and the (a plurality of time-series) altitudinal water vapor distributions at a plurality of time points.
- the control unit 11 of the microwave radiometer 1 acquires the radio field intensities (first measurement data) and the climatological data in generating the input data, but is not limited thereto.
- the control unit 11 of the microwave radiometer 1 may generate input data based on only the radio field intensities (first measurement data) or some of the climatological data such as temperature, humidity, and air pressure in addition to the radio field intensities (first measurement data) and acquire a precipitable water amount and an altitudinal water vapor distribution by inputting the input data to the precipitable water amount model 121 and the altitudinal water vapor distribution model 122.
- training data for training the learning models uses the first measurement data measured by the microwave radiometer 1 as question data and the altitude-by-altitude water vapor densities or the precipitable water amount acquired from the second measurement data measured by the radiosonde as answer data. Accordingly, it is possible to efficiently generate a learning model trained using the second measurement data measured by the radiosonde and to efficiently output the altitude-by-altitude water vapor densities or the precipitable water amount based on the first measurement data measured by the microwave radiometer 1 using the learning model.
- a plurality of frequencies included in the first measurement data is, for example, about 40 channels (frequencies) in the range of from 16 GHz to 26 GHz, and the radio field intensities (dB) of the 40 channels are stored in the storage unit 12.
- the control unit 11 can reduce the number of dimensions of the fist measurement data (question data) included in the training data by performing the dimension reducing process on the acquired and stored radio field intensities of the 40 channels, and thus it is possible to achieve a decrease in calculation cost.
- the question data included in the training data includes climatological data at the spot at which the microwave radiometer 1 is installed in addition to the first measurement data measured by the microwave radiometer 1.
- the climatological data may include at least one of temperature, humidity (absolute humidity or relative humidity), air pressure, and rainfall and may include all the physical quantities.
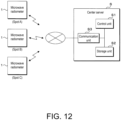
- FIG. 12 is a block diagram illustrating an example of a system configuration of a microwave radiometer 1 according to a second embodiment (at a plurality of spots).
- a water vapor observation system is constituted by a plurality of microwave radiometers 1 installed at different spots and a center server S communicatively connected to the plurality of microwave radiometers 1.
- the microwave radiometer 1 outputs measured observation data (radio field intensities and climatological data) to the center server S.
- the center server S is, for example, an information processing device such as a cloud server connected to the Internet and serves as an observation data collection server including a control unit S1, a storage unit S2, and a communication unit S3 and collecting observation data measured (observed) by the plurality of microwave radiometers 1 installed at different spots.
- the same precipitable water amount model 121 and the same altitudinal water vapor distribution model 122 as in the first embodiment are stored.
- the control unit S1 of the center server S generates input data for each spot based on the observation data output (transmitted) from the plurality of microwave radiometer 1 installed at different spots.
- the control unit S1 of the center server S outputs a precipitable water amount and an altitudinal water vapor distribution for each spot by inputting the generated input data for each spot to the precipitable water amount model 121 and the altitudinal water vapor distribution model 122.
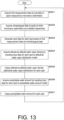
- FIG. 13 is a flowchart illustrating an example of a routine that is performed by the control unit S1 of the center server S.
- the center server S performs the following processes normally, for example, when the server starts.
- the control unit S1 of the center server S acquires first measurement data at a plurality of spots measured by the microwave radiometers 1 (S201).
- the control unit S1 of the center server S acquires radio field intensities (first measurement data) at a plurality of spots measured by the microwave radiometers 1 from the microwave radiometers 1 installed at the plurality of spots.
- Each radio field intensity may be a difference value (sky-bb [dB]) obtained by subtracting the radio field intensity (bb [dB]) of the black body from the radio field intensity (sky [dB]) of the sky.
- the control unit S1 of the center server S acquires climatological data at the plurality of spots at which the microwave radiometers 1 are installed (S202).
- the control unit S1 of the center server S acquires climatological data including temperature, humidity, air pressure, and rainfall at the plurality of spots at which the microwave radiometers 1 are installed from the microwave radiometers 1 installed at the plurality of spots.
- the control unit S1 of the center server S generates input data for each spot based on the first measurement data and the climatological data (S203).
- the control unit S1 of the center server S generates the input data for each spot based on the first measurement data and the climatological data for each spot (for each microwave radiometer 1) similarly to S103.
- the control unit S1 of the center server S inputs the input data for each spot to the altitudinal water vapor distribution model 122 and acquires altitude-by-altitude water vapor densities (S204).
- the control unit S1 of the center server S outputs the altitude-by-altitude water vapor densities (altitudinal water vapor distribution) for each spot (S205).
- the control unit S1 of the center server S inputs the input data for each spot to the precipitable water amount model 121 and acquires a precipitable water amount (S206).
- the control unit S1 of the center server S outputs the precipitable water amount for each spot (S207).
- the control unit S1 of the center server S performs the processes of S204 to S207 on the input data for each spot (for each microwave radiometer 1) similarly to the processes of S 104 to S 107. Similarly to the first embodiment, the control unit S 1 of the center server S performs a loop process to perform the routine from S201 again after the process of S207 has been performed.
- FIG. 14 is an explanatory diagram illustrating an example of an observation state (superimposed in map information) at a plurality of spots.
- the explanatory diagram (a multiple-spot multiple-view screen) is an example of screen data output from the center server S.
- the center server S acquires map information for identifying a plurality of spots at which a plurality of microwave radiometer 1 is installed, causes the altitude-by-altitude water vapor densities or the precipitable water amount at each of the plurality of spots on the acquired map information, and outputs the resultant information to the display device 16, a mobile terminal, or the like.
- the multiple-spot multiple-view screen includes a map area in which the map information for identifying the spots at which the plurality of microwave radiometers 1 is installed and a list display area in which observation data measured (observed) by the microwave radiometers 1 is displayed in the form of a list.
- the map area the spots at which the microwave radiometers 1 are installed are displayed by a diagram, and the altitude-by-altitude water vapor densities and the precipitable water amount measured at each spot are superimposed and displayed.
- the list display area a list of radio field intensities and altitude-by-altitude water vapor densities measured at the spots is displayed.
- a button, an icon, or the like for which a hyperlink is set may be disposed, and a child screen for displaying a precipitable water amount change graph or an altitudinal water vapor distribution graph at a selected spot may be displayed in a pop-up manner by clicking the button or the like.
- a child screen for displaying a graph (a radio field intensity change graph) indicating temporal change of the radio field intensity (sky-bb) at the selected spot may be displayed in a pop-up manner.
- control unit S 1 of the center server S acquires observation data (first measurement data and climatological data) for each spot measured at each of a plurality of spots at which the microwave radiometers 1 are installed by radio communication, inputs the observation data for each spot to the learning models (the altitudinal water vapor distribution model 122 and the precipitable water amount model 121), and outputs altitude-by-altitude water vapor densities (altitudinal water vapor distribution) or a precipitable water amount for each of the plurality of spots.
- observation data first measurement data and climatological data
- the learning models the altitudinal water vapor distribution model 122 and the precipitable water amount model 121
- control unit S1 of the center server S provides the altitude-by-altitude water vapor densities (altitudinal water vapor distribution) or the precipitable water amount for each spot in the form of a table, a graph, or the like for the purpose of enabling comparison and outputs the information to, for example, a mobile terminal via the communication unit S3, it is possible to efficiently provide the information to a weather relevant person or the like.
Landscapes
- Engineering & Computer Science (AREA)
- Life Sciences & Earth Sciences (AREA)
- Physics & Mathematics (AREA)
- Environmental & Geological Engineering (AREA)
- Health & Medical Sciences (AREA)
- Chemical & Material Sciences (AREA)
- General Physics & Mathematics (AREA)
- General Health & Medical Sciences (AREA)
- Analytical Chemistry (AREA)
- Biochemistry (AREA)
- Immunology (AREA)
- Pathology (AREA)
- Environmental Sciences (AREA)
- Ecology (AREA)
- Biodiversity & Conservation Biology (AREA)
- Atmospheric Sciences (AREA)
- Theoretical Computer Science (AREA)
- Software Systems (AREA)
- Food Science & Technology (AREA)
- Electromagnetism (AREA)
- Medicinal Chemistry (AREA)
- Computing Systems (AREA)
- General Engineering & Computer Science (AREA)
- Data Mining & Analysis (AREA)
- Evolutionary Computation (AREA)
- Mathematical Physics (AREA)
- Artificial Intelligence (AREA)
- Medical Informatics (AREA)
- Hydrology & Water Resources (AREA)
- Computer Vision & Pattern Recognition (AREA)
- Aviation & Aerospace Engineering (AREA)
- Biomedical Technology (AREA)
- Biophysics (AREA)
- Computational Linguistics (AREA)
- Molecular Biology (AREA)
- Radiation Pyrometers (AREA)
Applications Claiming Priority (2)
| Application Number | Priority Date | Filing Date | Title |
|---|---|---|---|
| JP2021080522 | 2021-05-11 | ||
| PCT/JP2022/009542 WO2022239416A1 (ja) | 2021-05-11 | 2022-03-04 | 学習モデルの生成方法、コンピュータプログラム、推定方法及び推定装置 |
Publications (3)
| Publication Number | Publication Date |
|---|---|
| EP4339655A1 true EP4339655A1 (de) | 2024-03-20 |
| EP4339655A4 EP4339655A4 (de) | 2025-06-25 |
| EP4339655B1 EP4339655B1 (de) | 2026-02-04 |
Family
ID=84029136
Family Applications (1)
| Application Number | Title | Priority Date | Filing Date |
|---|---|---|---|
| EP22807123.9A Active EP4339655B1 (de) | 2021-05-11 | 2022-03-04 | Erzeugungsverfahren für lernmodell, computerprogramm, schätzverfahren und schätzvorrichtung |
Country Status (4)
| Country | Link |
|---|---|
| US (1) | US20240027649A1 (de) |
| EP (1) | EP4339655B1 (de) |
| JP (1) | JPWO2022239416A1 (de) |
| WO (1) | WO2022239416A1 (de) |
Families Citing this family (3)
| Publication number | Priority date | Publication date | Assignee | Title |
|---|---|---|---|---|
| WO2026009560A1 (ja) * | 2024-07-02 | 2026-01-08 | 古野電気株式会社 | 気象観測装置、気象観測システム、推定方法、およびコンピュータプログラム |
| CN119224883B (zh) * | 2024-11-27 | 2025-02-18 | 武汉大学 | 联合gnss-pwv和气象卫星遥感的降雨预报方法及装置 |
| CN121477236B (zh) * | 2026-01-09 | 2026-03-20 | 杭州电子科技大学 | 基于lstm和射线有序子集约束策略的北斗对流层水汽层析法 |
Family Cites Families (14)
| Publication number | Priority date | Publication date | Assignee | Title |
|---|---|---|---|---|
| JP3034167B2 (ja) * | 1994-07-14 | 2000-04-17 | 東京電力株式会社 | 気象災害予測方法 |
| JP5203104B2 (ja) | 2008-09-04 | 2013-06-05 | 一般財団法人日本気象協会 | 降水予測システム、方法及びプログラム |
| US20110218734A1 (en) * | 2010-03-08 | 2011-09-08 | Radiometrics Corporation | Methods and apparatus for passive tropospheric measurments utilizing a single band of frequencies adjacent to a selected millimeter wave water vapor line |
| US11614367B2 (en) * | 2015-03-16 | 2023-03-28 | Fredrick S. Solheim | Characterizing tropospheric boundary layer thermodynamic and refractivity profiles utilizing selected waveband infrared observations |
| US20170131435A1 (en) * | 2015-11-05 | 2017-05-11 | Heriot-Watt University | Localized weather prediction |
| JP7438655B2 (ja) * | 2018-06-05 | 2024-02-27 | 株式会社東芝 | 気象解析装置、気象解析方法、およびプログラム |
| CN113811795A (zh) * | 2019-05-13 | 2021-12-17 | 古野电气株式会社 | 水蒸气观测系统及水蒸气观测方法 |
| CN111060992B (zh) * | 2019-12-27 | 2021-09-10 | 国家卫星气象中心(国家空间天气监测预警中心) | 星载微波双氧探测通道等权重共轭的降水检测方法及系统 |
| CN111220986A (zh) * | 2020-02-28 | 2020-06-02 | 中国民航大学 | 回波功率筛选与dlcd辅助的低空风切变风速估计方法 |
| CN111458769B (zh) * | 2020-05-26 | 2021-05-28 | 南京大学 | 用于输电线路环境气象数据预测的方法及系统 |
| CN111638565A (zh) * | 2020-06-09 | 2020-09-08 | 云南电网有限责任公司电力科学研究院 | 一种山区暴雨监测方法 |
| WO2022014229A1 (ja) * | 2020-07-14 | 2022-01-20 | 古野電気株式会社 | 可降水量推定モデルの学習システム、可降水量推定システム、方法及びプログラム |
| CN112232554A (zh) * | 2020-09-28 | 2021-01-15 | 中国科学院空天信息创新研究院 | 一种基于bp神经网络的局域短临降水预报模型的构建方法 |
| CN112462369B (zh) * | 2020-10-30 | 2024-09-20 | 国家卫星气象中心(国家空间天气监测预警中心) | 一种用于微波成像仪反演海上大气可降水的方法及装置 |
-
2022
- 2022-03-04 EP EP22807123.9A patent/EP4339655B1/de active Active
- 2022-03-04 WO PCT/JP2022/009542 patent/WO2022239416A1/ja not_active Ceased
- 2022-03-04 JP JP2023520840A patent/JPWO2022239416A1/ja active Pending
-
2023
- 2023-10-03 US US18/480,491 patent/US20240027649A1/en active Pending
Also Published As
| Publication number | Publication date |
|---|---|
| JPWO2022239416A1 (de) | 2022-11-17 |
| US20240027649A1 (en) | 2024-01-25 |
| WO2022239416A1 (ja) | 2022-11-17 |
| EP4339655B1 (de) | 2026-02-04 |
| EP4339655A4 (de) | 2025-06-25 |
Similar Documents
| Publication | Publication Date | Title |
|---|---|---|
| EP4339655A1 (de) | Erzeugungsverfahren für lernmodell, computerprogramm, schätzverfahren und schätzvorrichtung | |
| Aires et al. | A new neural network approach including first guess for retrieval of atmospheric water vapor, cloud liquid water path, surface temperature, and emissivities over land from satellite microwave observations | |
| Goldberg et al. | AIRS near-real-time products and algorithms in support of operational numerical weather prediction | |
| WO2022239417A1 (ja) | 学習モデルの生成方法、コンピュータプログラム、マイクロ波放射計及び推定方法 | |
| Aires et al. | Statistical approaches to assimilate ASCAT soil moisture information—I. Methodologies and first assessment | |
| Daescu et al. | Error covariance sensitivity and impact estimation with adjoint 4D‐Var: theoretical aspects and first applications to NAVDAS‐AR | |
| Bhuiyan et al. | A nonparametric statistical technique for modeling overland TMI (2A12) rainfall retrieval error | |
| Francis et al. | The effective use of anchor observations in variational bias correction in the presence of model bias | |
| Bai et al. | A fast piecewise-defined neural network method to retrieve temperature and humidity profile for the vertical atmospheric sounding system of FengYun-3E satellite | |
| Subramani et al. | A new ensemble-based data assimilation algorithm to improve track prediction of tropical cyclones | |
| Woolliams et al. | A metrological framework for addressing uncertainty in satellite and in situ earth environmental observations | |
| Maddy et al. | Toward the next generation of microwave sounders: Benefits of a low-Earth orbit hyperspectral microwave instrument in all-weather conditions using AI | |
| CN116165728A (zh) | 大气可降水量的估算方法、装置、计算机设备和存储介质 | |
| EP4184222A1 (de) | Lernsystem für ein modell zur schätzung von niederschlagswasser, lernsystem für niederschlagswasser, verfahren und programm | |
| Mattioli et al. | Atmospheric gas absorption knowledge in the submillimeter: Modeling, field measurements, and uncertainty quantification | |
| Ajil et al. | A new technique for temperature and humidity profile retrieval from infrared-sounder observations using the adaptive neuro-fuzzy inference system | |
| Tao et al. | Error variance estimation for individual geophysical parameter retrievals | |
| Li et al. | A study on retrieving atmospheric profiles from EOS/AIRS observations | |
| CN118364207B (zh) | 一种背景场的确定方法、装置、设备及介质 | |
| Biryukov et al. | The use of linear regression relations derived from model and experimental data for retrieval of the water content of clouds from ground-based microwave measurements | |
| Grašič et al. | Validation of numerically forecast vertical temperature profile with measurements for dispersion modelling | |
| CN120850192B (zh) | 一种基于改进rf的多源降雨融合方法、设备及存储介质 | |
| Ma et al. | PWVFnet: A Short-Time Troposphere PWV Forecast Model Combined Empirical Models and Spatiotemporal ConvLSTM Network | |
| Cao et al. | Enhancing short-term PWV prediction through GNSS and ERA5 data fusion | |
| Cantrall | New approaches for quantifying and understanding thermosphere temperature variability from far ultraviolet dayglow |
Legal Events
| Date | Code | Title | Description |
|---|---|---|---|
| STAA | Information on the status of an ep patent application or granted ep patent |
Free format text: STATUS: THE INTERNATIONAL PUBLICATION HAS BEEN MADE |
|
| PUAI | Public reference made under article 153(3) epc to a published international application that has entered the european phase |
Free format text: ORIGINAL CODE: 0009012 |
|
| STAA | Information on the status of an ep patent application or granted ep patent |
Free format text: STATUS: REQUEST FOR EXAMINATION WAS MADE |
|
| 17P | Request for examination filed |
Effective date: 20231013 |
|
| AK | Designated contracting states |
Kind code of ref document: A1 Designated state(s): AL AT BE BG CH CY CZ DE DK EE ES FI FR GB GR HR HU IE IS IT LI LT LU LV MC MK MT NL NO PL PT RO RS SE SI SK SM TR |
|
| DAV | Request for validation of the european patent (deleted) | ||
| DAX | Request for extension of the european patent (deleted) | ||
| A4 | Supplementary search report drawn up and despatched |
Effective date: 20250522 |
|
| RIC1 | Information provided on ipc code assigned before grant |
Ipc: G01N 33/18 20060101ALI20250516BHEP Ipc: G01N 22/00 20060101ALI20250516BHEP Ipc: G06N 20/00 20190101ALI20250516BHEP Ipc: G06N 3/08 20230101ALI20250516BHEP Ipc: G01W 1/14 20060101ALI20250516BHEP Ipc: G01W 1/10 20060101ALI20250516BHEP Ipc: G01W 1/08 20060101AFI20250516BHEP |
|
| REG | Reference to a national code |
Ref country code: DE Ref legal event code: R079 Free format text: PREVIOUS MAIN CLASS: G01W0001080000 Ref country code: DE Ref legal event code: R079 Ref document number: 602022029751 Country of ref document: DE Free format text: PREVIOUS MAIN CLASS: G01W0001080000 Ipc: G01W0001100000 |
|
| GRAP | Despatch of communication of intention to grant a patent |
Free format text: ORIGINAL CODE: EPIDOSNIGR1 |
|
| STAA | Information on the status of an ep patent application or granted ep patent |
Free format text: STATUS: GRANT OF PATENT IS INTENDED |
|
| RIC1 | Information provided on ipc code assigned before grant |
Ipc: G01W 1/10 20060101AFI20250815BHEP Ipc: G01W 1/14 20060101ALI20250815BHEP Ipc: G01W 1/08 20060101ALI20250815BHEP Ipc: G06N 3/08 20230101ALI20250815BHEP Ipc: G06N 20/00 20190101ALI20250815BHEP Ipc: G01N 22/00 20060101ALI20250815BHEP Ipc: G01N 33/18 20060101ALI20250815BHEP |
|
| INTG | Intention to grant announced |
Effective date: 20250915 |
|
| GRAS | Grant fee paid |
Free format text: ORIGINAL CODE: EPIDOSNIGR3 |
|
| GRAA | (expected) grant |
Free format text: ORIGINAL CODE: 0009210 |
|
| STAA | Information on the status of an ep patent application or granted ep patent |
Free format text: STATUS: THE PATENT HAS BEEN GRANTED |
|
| AK | Designated contracting states |
Kind code of ref document: B1 Designated state(s): AL AT BE BG CH CY CZ DE DK EE ES FI FR GB GR HR HU IE IS IT LI LT LU LV MC MK MT NL NO PL PT RO RS SE SI SK SM TR |
|
| REG | Reference to a national code |
Ref country code: CH Ref legal event code: F10 Free format text: ST27 STATUS EVENT CODE: U-0-0-F10-F00 (AS PROVIDED BY THE NATIONAL OFFICE) Effective date: 20260204 Ref country code: GB Ref legal event code: FG4D |
|
| REG | Reference to a national code |
Ref country code: DE Ref legal event code: R096 Ref document number: 602022029751 Country of ref document: DE |
|
| REG | Reference to a national code |
Ref country code: IE Ref legal event code: FG4D |
|
| PGFP | Annual fee paid to national office [announced via postgrant information from national office to epo] |
Ref country code: DE Payment date: 20260316 Year of fee payment: 5 |
|
| PGFP | Annual fee paid to national office [announced via postgrant information from national office to epo] |
Ref country code: AT Payment date: 20260301 Year of fee payment: 5 |