EP4386584A1 - System zur anomaliedetektion und leistungsanalyse in hochdimensionalen streaming-daten - Google Patents
System zur anomaliedetektion und leistungsanalyse in hochdimensionalen streaming-daten Download PDFInfo
- Publication number
- EP4386584A1 EP4386584A1 EP23215450.0A EP23215450A EP4386584A1 EP 4386584 A1 EP4386584 A1 EP 4386584A1 EP 23215450 A EP23215450 A EP 23215450A EP 4386584 A1 EP4386584 A1 EP 4386584A1
- Authority
- EP
- European Patent Office
- Prior art keywords
- data
- model
- time
- anomalies
- manufacturing
- Prior art date
- Legal status (The legal status is an assumption and is not a legal conclusion. Google has not performed a legal analysis and makes no representation as to the accuracy of the status listed.)
- Withdrawn
Links
Images


Classifications
-
- G—PHYSICS
- G06—COMPUTING OR CALCULATING; COUNTING
- G06F—ELECTRIC DIGITAL DATA PROCESSING
- G06F17/00—Digital computing or data processing equipment or methods, specially adapted for specific functions
- G06F17/10—Complex mathematical operations
- G06F17/18—Complex mathematical operations for evaluating statistical data, e.g. average values, frequency distributions, probability functions, regression analysis
-
- G—PHYSICS
- G06—COMPUTING OR CALCULATING; COUNTING
- G06N—COMPUTING ARRANGEMENTS BASED ON SPECIFIC COMPUTATIONAL MODELS
- G06N20/00—Machine learning
Definitions
- Manufacturing analytics is often plagued by the magnitude of streaming data as well as the complexity of having millions of parts, thousands of assembly lines, and customization for particular products.
- thousands of tags are transmitting from various parts of a manufacturing line at sub-second intervals.
- the complexity and magnitude of the streaming data makes it challenging to diagnose partial equipment failure or degradation prior to catastrophic failures, which result in the complete shutdown of the line and a tedious and slow root cause analysis for repair planning. Exacerbating this problem is the lack of labeled data which limits the application of any supervised learning algorithm.
- Embodiments include a method for detecting anomalous data in a manufacturing line or live sensing application.
- the method includes computing a projection of new incoming data on a trained model and identifying potential anomalies by comparing a window for the incoming data to normal representation criteria based upon user-specified thresholds.
- Creating the trained model includes applying hoteling T2 statistics and Q-residual to clean up outliers from an historic time interval of data and creating the model by calculating principal components of the data and choosing a subset of components which represent a variability in the data.
- a model deployment pipeline is generated from the trained model and which is capable of deploying machine learning or statistical models to an edge and cloud infrastructure associated with the manufacturing line or live sensing application.
- Embodiments include a data and insights platform for anomaly detection on high-dimensional streaming manufacturing data. It leverages statistical analysis of the data in a windowed fashion and monitors the processes for any deviations from a model that has been built based on the normal dataset. It comprises normalized system modeling, time aggregation and windowing, anomaly detection, identifying times with highest anomaly scores, and a dashboard for creating an anomaly report for manufacturing operator diagnostics.
- Embodiments also include a set of algorithms for utilizing online inferential sensing in a manufacturing setting.
- the algorithms described herein can be deployed through an online system to use real-time or near-real-time data aggregation from live equipment lines to enable technicians and engineers to optimize these manufacturing processes in real-time.
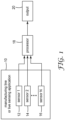
- FIG. 1 is a block diagram illustrating receiving sensor data from a manufacturing line or live sensing application.
- a manufacturing line or live sensing application 10 includes a plurality of sensors 12, 14, and 16 that provide sensor data to a processor 18, which analyzes the data in real-time and provides a corresponding output 20, as described below. Only three sensors are shown for illustrative purposes; the manufacturing line or live sensing application would typically include many sensors
- FIG. 2 is a block diagram of modules from processing data from a manufacturing line or live sensing application.
- An Iot edge device 24 includes a data ingest module 26, a windowing module 28, and a machine learning module 30, all of which interact with a cloud blob 32.
- a cloud 34 includes a machine learning module 36, a windowing module 38, a data ingest module 40, and a cloud blob 42 that provides information to a visualization module 44.
- a database 22 provides information to data ingest module 26 and cloud blob 42.
- the overall end-to-end system is divided into three components:
- this module will check the following:
- MACHINE LEARNING (ML) PIPELINE The algorithm created for the data science process is operationalized using an MLOPS tool from a cloud provider.
- the ML Pipeline encapsulates the core logic of the algorithm and creates the necessary infrastructure to convert the algorithm into a consumable service (RESTful service).
- the ML Pipeline ensures that any new code update to the algorithm automatically triggers the pipeline and creates the final binaries for the model.
- DEVOPS PIPELINE The Data and ML Pipelines both use Azure edge modules. Essentially, these edge modules are Docker containers that are managed by the Azure IoT runtime. In order to deploy these modules onto the edge, Azure DevOps pipelines are used to build the module images, push these images into a container registry, and then deploy them from the container registry onto the edge device.
- the Edge PCA module is deployed via one Azure DevOps pipeline (the ML Deployment Pipeline) and the other modules are deployed via another Azure DevOps pipeline (the Data Deployment Pipeline).
- Azure LogicApps orchestrate both pipelines so that they run whenever changes are pushed to the DevOps repos, or in the case of the ML Pipeline, whenever a new "edgepca" model is registered in the Azure ML Workspace.
- the DevOps pipelines picks up the algorithms created by the ML Pipeline step and deploys this algorithm to the Edge for inference purposes.
- Online in this case refers to data that is coming into the algorithm in real-time, from sensors on the manufacturing lines (or other live sensing applications), whereas offline refers to settings and sensor data which is stored on a server (cloud or edge) for later access.
- PCA Principal Component Analysis
- SPE-statistic or Q-statistic or Mahalonobis Distance
- Mahalonobis Distance For machine learning approaches, algorithms such as Isolation Forest, Univariate Time Series algorithms such as GSHESD and STL, and related approaches were investigated and could be deployed.
- Autoencoders and DAGMM could be used for even more advanced approaches to analytics.
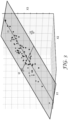
- the plot in FIG. 3 shows data plotted on three variables (X1,X2,X3).
- the data exists in three dimensions but is close to planar data. It is projected onto the lower dimensional space (t1,t2).
- the dark points are intended to show normal variation.
- the four white points outside the box of dark points are points that do not project well onto the (t1,t2) plane.
- the three white dots near t2 and in the box of dark points are outside of the normal variation but on the plane.
- both sets of white points could be identified as anomalies.
- the physical space would typically have many more variables and the latent space could have more variables too.
- This graph provides a visual representation but does not accurately represent the dimensionality of a real data set.
- FIG. 4 demonstrates the concept. If a person only looked at X1 or X2, the white points within the dashed lines containing the dark points seem normal. By understanding the relationship between X1 and X2, it is easier to see those white points as anomalies -- they do not fall on the linear relationship. The white points outside of or on the dashed lines containing dark points are then also anomalies insofar as they fall at the far ends of the linear relationship.
- Automated cleaning is a desirable first step to enabling prediction in such cases where extensive labeled data is not available.
- One such automated data cleaning technique was developed and deployed for a manufacturing project.
- One risk of automated cleaning is that of eliminating some good data from the training set and retaining data that does not conform to desired plant operation. This risk was present in the deployed version, and this risk can be evaluated to see the impact it has on anomaly detection. If such automated cleaning is effective, it would accelerate the scaling of this technology by eliminating a time-consuming manual process.
- the objective of automated cleaning is not to make a "better" cleaning method than a labor-intensive manual cleaning. It is to create a system that scales and is useful in a manufacturing environment. A significant time savings can be achieved by using an automated and effective cleaning method even if it is imperfect. The resultant anomaly detection system could rapidly deliver value. The alternatives, requiring either full labeling (a very time-consuming process) or no automated anomaly detection, result in paths to solution that are slower and more resource intensive.
- the method which was deployed was a multivariate cleaning method which utilized the same statistical methodology used to identify outliers in the test set to first remove outliers from the training data set, at a stricter threshold than for the training outlier detection.
- This python class was selected for implementation because it includes an option for filling missing data with an expectation maximization (EM) algorithm.
- EM expectation maximization
- Another python class and algorithm would require a way to handle missing data, which is a common phenomenon in manufacturing datasets.
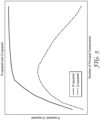
- An objective is to fit the variation in the data well such that the model predicts future data from the same distribution. Selecting a reasonable number of latent variables such that the multivariate data is well-described by the new coordinate system is important in models based on PCA.
- R 2 is the correlation to the training set.
- Q 2 is the correlation to the test set.
- R 2 will always increase with increasing latent variables (#LVs ⁇ # measured variables), and for any number of latent variables R 2 will be larger than Q 2 .
- PCA is a dimensionality reduction technique. It will work best when there are substantial levels of multicollinearity in the data but can be considered whenever a person is dealing with multivariate data and the variables are not all independent. In ideal use, it should result in a sizable reduction in the number of variables used to describe a data set. Just as in polynomial regression, Occam's razor applies, and simpler models are often preferred. Whether the application is anomaly detection or clearly summarizing and displaying relationships in the data, the first few principal components are often the most heavily used. It is not always critical to use the optimal number of latent variables for a model to be useful, but implementations should strive to be as precise as possible in selecting the number of latent variables.
- new data can be evaluated against that model to determine whether the new data (1) is well described by the lower-dimensional space defined by the PCA model and (2) projects onto the lower dimensional space near the training data. New data are evaluated against both of these criteria. If the new data does not project onto the lower dimensional space as well as the training data or if it does project onto that space but is far from the region of this subspace occupied by the training data, the data point is labeled as an anomaly and diagnostic guidance is generated. For both criteria, thresholds determine whether data are labeled as normal or anomalous. The user can adjust those thresholds to maximize utility. In some applications, users might be most interested in sensitivity. In others, accuracy might matter more. It is important to balance the user's need to detect most anomalies vs. the user's tolerance for false alarms.
- Model retraining is utilized to address the model drift and mitigate its effect on the predictive performance.
- the model retraining could be performed on a regular basis through the same process that generated the original model.
Landscapes
- Engineering & Computer Science (AREA)
- Theoretical Computer Science (AREA)
- Physics & Mathematics (AREA)
- Software Systems (AREA)
- Data Mining & Analysis (AREA)
- General Physics & Mathematics (AREA)
- Mathematical Physics (AREA)
- General Engineering & Computer Science (AREA)
- Evolutionary Computation (AREA)
- Medical Informatics (AREA)
- Computer Vision & Pattern Recognition (AREA)
- Computing Systems (AREA)
- Artificial Intelligence (AREA)
- Mathematical Optimization (AREA)
- Mathematical Analysis (AREA)
- Pure & Applied Mathematics (AREA)
- Computational Mathematics (AREA)
- Operations Research (AREA)
- Evolutionary Biology (AREA)
- Life Sciences & Earth Sciences (AREA)
- Bioinformatics & Cheminformatics (AREA)
- Probability & Statistics with Applications (AREA)
- Bioinformatics & Computational Biology (AREA)
- Algebra (AREA)
- Databases & Information Systems (AREA)
- Management, Administration, Business Operations System, And Electronic Commerce (AREA)
- Testing And Monitoring For Control Systems (AREA)
Applications Claiming Priority (1)
| Application Number | Priority Date | Filing Date | Title |
|---|---|---|---|
| US202263431794P | 2022-12-12 | 2022-12-12 |
Publications (1)
| Publication Number | Publication Date |
|---|---|
| EP4386584A1 true EP4386584A1 (de) | 2024-06-19 |
Family
ID=89168298
Family Applications (1)
| Application Number | Title | Priority Date | Filing Date |
|---|---|---|---|
| EP23215450.0A Withdrawn EP4386584A1 (de) | 2022-12-12 | 2023-12-11 | System zur anomaliedetektion und leistungsanalyse in hochdimensionalen streaming-daten |
Country Status (2)
| Country | Link |
|---|---|
| US (1) | US20240193483A1 (de) |
| EP (1) | EP4386584A1 (de) |
Families Citing this family (1)
| Publication number | Priority date | Publication date | Assignee | Title |
|---|---|---|---|---|
| CN120931107B (zh) * | 2025-10-15 | 2025-12-23 | 山东海润数聚科技有限公司 | 一种基于物联网技术的建筑施工安全监控系统 |
Citations (3)
| Publication number | Priority date | Publication date | Assignee | Title |
|---|---|---|---|---|
| WO2001069329A2 (en) * | 2000-03-10 | 2001-09-20 | Cyrano Sciences, Inc. | Control for an industrial process using one or more multidimensional variables |
| US20200233397A1 (en) * | 2019-01-23 | 2020-07-23 | New York University | System, method and computer-accessible medium for machine condition monitoring |
| US11269752B1 (en) * | 2021-07-07 | 2022-03-08 | Eugenie Technologies Private Limited | System and method for unsupervised anomaly prediction |
-
2023
- 2023-12-11 EP EP23215450.0A patent/EP4386584A1/de not_active Withdrawn
- 2023-12-11 US US18/536,017 patent/US20240193483A1/en active Pending
Patent Citations (3)
| Publication number | Priority date | Publication date | Assignee | Title |
|---|---|---|---|---|
| WO2001069329A2 (en) * | 2000-03-10 | 2001-09-20 | Cyrano Sciences, Inc. | Control for an industrial process using one or more multidimensional variables |
| US20200233397A1 (en) * | 2019-01-23 | 2020-07-23 | New York University | System, method and computer-accessible medium for machine condition monitoring |
| US11269752B1 (en) * | 2021-07-07 | 2022-03-08 | Eugenie Technologies Private Limited | System and method for unsupervised anomaly prediction |
Also Published As
| Publication number | Publication date |
|---|---|
| US20240193483A1 (en) | 2024-06-13 |
Similar Documents
| Publication | Publication Date | Title |
|---|---|---|
| US10635094B2 (en) | Failure models for embedded analytics and diagnostic/prognostic reasoning | |
| Abele et al. | Combining knowledge modeling and machine learning for alarm root cause analysis | |
| EP3404593A1 (de) | Verfahren und system zur datenbasierten optimierung von leistungsindikatoren in prozess- und fertigungsindustrien | |
| US20050043922A1 (en) | Analysing events | |
| US9208209B1 (en) | Techniques for monitoring transformation techniques using control charts | |
| US10635096B2 (en) | Methods for analytics-driven alarm rationalization, assessment of operator response, and incident diagnosis and related systems | |
| JP7631365B2 (ja) | 産業用機械学習のためのデータ処理 | |
| EP4423582B1 (de) | System, vorrichtung und verfahren zur überwachung des zustands eines bestandteils in einer technischen anlage | |
| US20250180408A1 (en) | Thermal anomaly management | |
| Serradilla et al. | Methodology for data-driven predictive maintenance models design, development and implementation on manufacturing guided by domain knowledge | |
| US10733533B2 (en) | Apparatus and method for screening data for kernel regression model building | |
| Cózar et al. | An application of dynamic Bayesian networks to condition monitoring and fault prediction in a sensored system: A case study | |
| Thibault et al. | Experimental methods in chemical engineering: Data processing and data usage in decision‐making | |
| EP4386584A1 (de) | System zur anomaliedetektion und leistungsanalyse in hochdimensionalen streaming-daten | |
| Sayed et al. | Distributed Bayesian diagnosis for modular assembly systems—A case study | |
| Krishna Menon et al. | Asset Management decision-making through data-driven Predictive Maintenance–an overview, techniques, benefits and challenges | |
| US20240185117A1 (en) | Knowledge Graph Based Modeling System for a Production Environment | |
| CN116681351A (zh) | 用于注塑工序的质量预测和根本原因分析系统和方法 | |
| Merkt | Predictive models for maintenance optimization: an analytical literature survey of industrial maintenance strategies | |
| Sharp | Observations on developing reliability information utilization in a manufacturing environment with case study: robotic arm manipulators | |
| EP3571660A1 (de) | Expertenerweitertes maschinenlernen zur zustandsüberwachung | |
| KR20220090681A (ko) | 인공지능 기반의 피쉬본 다이어그램 관리 시스템 및 그 방법 | |
| Zhao | A probabilistic approach for prognostics of complex rotary machinery systems | |
| Cupek et al. | Data mining techniques for energy efficiency analysis of discrete production lines | |
| Mercurio | Towards predictive maintenance using long short-term memory autoencoder and streaming explainability |
Legal Events
| Date | Code | Title | Description |
|---|---|---|---|
| PUAI | Public reference made under article 153(3) epc to a published international application that has entered the european phase |
Free format text: ORIGINAL CODE: 0009012 |
|
| STAA | Information on the status of an ep patent application or granted ep patent |
Free format text: STATUS: THE APPLICATION HAS BEEN PUBLISHED |
|
| AK | Designated contracting states |
Kind code of ref document: A1 Designated state(s): AL AT BE BG CH CY CZ DE DK EE ES FI FR GB GR HR HU IE IS IT LI LT LU LV MC ME MK MT NL NO PL PT RO RS SE SI SK SM TR |
|
| STAA | Information on the status of an ep patent application or granted ep patent |
Free format text: STATUS: THE APPLICATION IS DEEMED TO BE WITHDRAWN |
|
| 18D | Application deemed to be withdrawn |
Effective date: 20241220 |