EP4394778A2 - Systeme und verfahren zur charakterisierung und erfolgsanalyse von pixel-basierter sequenzierung - Google Patents
Systeme und verfahren zur charakterisierung und erfolgsanalyse von pixel-basierter sequenzierung Download PDFInfo
- Publication number
- EP4394778A2 EP4394778A2 EP24170634.0A EP24170634A EP4394778A2 EP 4394778 A2 EP4394778 A2 EP 4394778A2 EP 24170634 A EP24170634 A EP 24170634A EP 4394778 A2 EP4394778 A2 EP 4394778A2
- Authority
- EP
- European Patent Office
- Prior art keywords
- pixel
- phasing
- intensity
- computer
- signal
- Prior art date
- Legal status (The legal status is an assumption and is not a legal conclusion. Google has not performed a legal analysis and makes no representation as to the accuracy of the status listed.)
- Pending
Links
Images







Classifications
-
- G—PHYSICS
- G01—MEASURING; TESTING
- G01N—INVESTIGATING OR ANALYSING MATERIALS BY DETERMINING THEIR CHEMICAL OR PHYSICAL PROPERTIES
- G01N21/00—Investigating or analysing materials by the use of optical means, i.e. using sub-millimetre waves, infrared, visible or ultraviolet light
- G01N21/62—Systems in which the material investigated is excited whereby it emits light or causes a change in wavelength of the incident light
- G01N21/63—Systems in which the material investigated is excited whereby it emits light or causes a change in wavelength of the incident light optically excited
- G01N21/64—Fluorescence; Phosphorescence
- G01N21/6428—Measuring fluorescence of fluorescent products of reactions or of fluorochrome labelled reactive substances, e.g. measuring quenching effects, using measuring "optrodes"
-
- G—PHYSICS
- G01—MEASURING; TESTING
- G01N—INVESTIGATING OR ANALYSING MATERIALS BY DETERMINING THEIR CHEMICAL OR PHYSICAL PROPERTIES
- G01N21/00—Investigating or analysing materials by the use of optical means, i.e. using sub-millimetre waves, infrared, visible or ultraviolet light
- G01N21/62—Systems in which the material investigated is excited whereby it emits light or causes a change in wavelength of the incident light
- G01N21/63—Systems in which the material investigated is excited whereby it emits light or causes a change in wavelength of the incident light optically excited
- G01N21/64—Fluorescence; Phosphorescence
- G01N21/645—Specially adapted constructive features of fluorimeters
- G01N21/6452—Individual samples arranged in a regular 2D-array, e.g. multiwell plates
- G01N21/6454—Individual samples arranged in a regular 2D-array, e.g. multiwell plates using an integrated detector array
-
- G—PHYSICS
- G06—COMPUTING OR CALCULATING; COUNTING
- G06F—ELECTRIC DIGITAL DATA PROCESSING
- G06F18/00—Pattern recognition
- G06F18/20—Analysing
- G06F18/24—Classification techniques
- G06F18/241—Classification techniques relating to the classification model, e.g. parametric or non-parametric approaches
- G06F18/2413—Classification techniques relating to the classification model, e.g. parametric or non-parametric approaches based on distances to training or reference patterns
- G06F18/24133—Distances to prototypes
-
- G—PHYSICS
- G06—COMPUTING OR CALCULATING; COUNTING
- G06N—COMPUTING ARRANGEMENTS BASED ON SPECIFIC COMPUTATIONAL MODELS
- G06N3/00—Computing arrangements based on biological models
- G06N3/02—Neural networks
- G06N3/04—Architecture, e.g. interconnection topology
- G06N3/045—Combinations of networks
-
- G—PHYSICS
- G06—COMPUTING OR CALCULATING; COUNTING
- G06N—COMPUTING ARRANGEMENTS BASED ON SPECIFIC COMPUTATIONAL MODELS
- G06N3/00—Computing arrangements based on biological models
- G06N3/02—Neural networks
- G06N3/04—Architecture, e.g. interconnection topology
- G06N3/0464—Convolutional networks [CNN, ConvNet]
-
- G—PHYSICS
- G06—COMPUTING OR CALCULATING; COUNTING
- G06N—COMPUTING ARRANGEMENTS BASED ON SPECIFIC COMPUTATIONAL MODELS
- G06N3/00—Computing arrangements based on biological models
- G06N3/02—Neural networks
- G06N3/04—Architecture, e.g. interconnection topology
- G06N3/048—Activation functions
-
- G—PHYSICS
- G06—COMPUTING OR CALCULATING; COUNTING
- G06N—COMPUTING ARRANGEMENTS BASED ON SPECIFIC COMPUTATIONAL MODELS
- G06N3/00—Computing arrangements based on biological models
- G06N3/02—Neural networks
- G06N3/08—Learning methods
- G06N3/084—Backpropagation, e.g. using gradient descent
-
- G—PHYSICS
- G06—COMPUTING OR CALCULATING; COUNTING
- G06N—COMPUTING ARRANGEMENTS BASED ON SPECIFIC COMPUTATIONAL MODELS
- G06N3/00—Computing arrangements based on biological models
- G06N3/02—Neural networks
- G06N3/08—Learning methods
- G06N3/09—Supervised learning
-
- G—PHYSICS
- G06—COMPUTING OR CALCULATING; COUNTING
- G06V—IMAGE OR VIDEO RECOGNITION OR UNDERSTANDING
- G06V10/00—Arrangements for image or video recognition or understanding
- G06V10/70—Arrangements for image or video recognition or understanding using pattern recognition or machine learning
- G06V10/82—Arrangements for image or video recognition or understanding using pattern recognition or machine learning using neural networks
-
- G—PHYSICS
- G16—INFORMATION AND COMMUNICATION TECHNOLOGY [ICT] SPECIALLY ADAPTED FOR SPECIFIC APPLICATION FIELDS
- G16B—BIOINFORMATICS, i.e. INFORMATION AND COMMUNICATION TECHNOLOGY [ICT] SPECIALLY ADAPTED FOR GENETIC OR PROTEIN-RELATED DATA PROCESSING IN COMPUTATIONAL MOLECULAR BIOLOGY
- G16B40/00—ICT specially adapted for biostatistics; ICT specially adapted for bioinformatics-related machine learning or data mining, e.g. knowledge discovery or pattern finding
- G16B40/10—Signal processing, e.g. from mass spectrometry [MS] or from PCR
-
- C—CHEMISTRY; METALLURGY
- C12—BIOCHEMISTRY; BEER; SPIRITS; WINE; VINEGAR; MICROBIOLOGY; ENZYMOLOGY; MUTATION OR GENETIC ENGINEERING
- C12Q—MEASURING OR TESTING PROCESSES INVOLVING ENZYMES, NUCLEIC ACIDS OR MICROORGANISMS; COMPOSITIONS OR TEST PAPERS THEREFOR; PROCESSES OF PREPARING SUCH COMPOSITIONS; CONDITION-RESPONSIVE CONTROL IN MICROBIOLOGICAL OR ENZYMOLOGICAL PROCESSES
- C12Q1/00—Measuring or testing processes involving enzymes, nucleic acids or microorganisms; Compositions therefor; Processes of preparing such compositions
- C12Q1/68—Measuring or testing processes involving enzymes, nucleic acids or microorganisms; Compositions therefor; Processes of preparing such compositions involving nucleic acids
- C12Q1/6869—Methods for sequencing
-
- G—PHYSICS
- G06—COMPUTING OR CALCULATING; COUNTING
- G06N—COMPUTING ARRANGEMENTS BASED ON SPECIFIC COMPUTATIONAL MODELS
- G06N3/00—Computing arrangements based on biological models
- G06N3/02—Neural networks
- G06N3/08—Learning methods
- G06N3/082—Learning methods modifying the architecture, e.g. adding, deleting or silencing nodes or connections
-
- G—PHYSICS
- G06—COMPUTING OR CALCULATING; COUNTING
- G06N—COMPUTING ARRANGEMENTS BASED ON SPECIFIC COMPUTATIONAL MODELS
- G06N3/00—Computing arrangements based on biological models
- G06N3/02—Neural networks
- G06N3/08—Learning methods
- G06N3/088—Non-supervised learning, e.g. competitive learning
-
- G—PHYSICS
- G06—COMPUTING OR CALCULATING; COUNTING
- G06N—COMPUTING ARRANGEMENTS BASED ON SPECIFIC COMPUTATIONAL MODELS
- G06N5/00—Computing arrangements using knowledge-based models
- G06N5/02—Knowledge representation; Symbolic representation
- G06N5/022—Knowledge engineering; Knowledge acquisition
-
- G—PHYSICS
- G06—COMPUTING OR CALCULATING; COUNTING
- G06N—COMPUTING ARRANGEMENTS BASED ON SPECIFIC COMPUTATIONAL MODELS
- G06N5/00—Computing arrangements using knowledge-based models
- G06N5/04—Inference or reasoning models
- G06N5/048—Fuzzy inferencing
-
- G—PHYSICS
- G16—INFORMATION AND COMMUNICATION TECHNOLOGY [ICT] SPECIALLY ADAPTED FOR SPECIFIC APPLICATION FIELDS
- G16B—BIOINFORMATICS, i.e. INFORMATION AND COMMUNICATION TECHNOLOGY [ICT] SPECIALLY ADAPTED FOR GENETIC OR PROTEIN-RELATED DATA PROCESSING IN COMPUTATIONAL MOLECULAR BIOLOGY
- G16B30/00—ICT specially adapted for sequence analysis involving nucleotides or amino acids
Definitions
- the technology disclosed relates to artificial intelligence type computers and digital data processing systems and corresponding data processing methods and products for emulation of intelligence (i.e., knowledge based systems, reasoning systems, and knowledge acquisition systems); and including systems for reasoning with uncertainty (e.g., fuzzy logic systems), adaptive systems, machine learning systems, and artificial neural networks.
- intelligence i.e., knowledge based systems, reasoning systems, and knowledge acquisition systems
- systems for reasoning with uncertainty e.g., fuzzy logic systems
- adaptive systems e.g., machine learning systems
- artificial neural networks e.g., neural network for analyzing data.
- Embodiments described herein may be used in various biological or chemical processes and systems for academic or commercial analysis. More specifically, embodiments described herein may be used in various processes and systems where it is desired to detect an event, property, quality, or characteristic that is indicative of a desired reaction.
- embodiments described herein include cartridges, biosensors, and their components as well as bioassay systems that operate with cartridges and biosensors.
- the cartridges and biosensors include a flow cell and one or more sensors, pixels, light detectors, or photodiodes that are coupled together in a substantially unitary structure.
- the functional blocks are not necessarily indicative of the division between hardware circuitry.
- one or more of the functional blocks e.g., processors or memories
- the programs may be standalone programs, may be incorporated as subroutines in an operating system, may be functions in an installed software package, and the like. It should be understood that the various embodiments are not limited to the arrangements and instrumentality shown in the drawings.
- a “desired reaction” includes a change in at least one of a chemical, electrical, physical, or optical property (or quality) of an analyte-of-interest.
- the desired reaction is a positive binding event (e.g., incorporation of a fluorescently labeled biomolecule with the analyte-of-interest).
- the desired reaction may be a chemical transformation, chemical change, or chemical interaction.
- the desired reaction may also be a change in electrical properties.
- the desired reaction may be a change in ion concentration within a solution.
- the desired reaction can also be an addition or elimination of a proton, for example, detectable as a change in pH of a surrounding solution or environment.
- An additional desired reaction can be detecting the flow of ions across a membrane (e.g., natural or synthetic bilayer membrane), for example as ions flow through a membrane the current is disrupted and the disruption can be detected.
- a membrane e.g., natural or synthetic bilayer membrane
- reaction site is a localized region where a desired reaction may occur.
- a reaction site may include support surfaces of a substrate where a substance may be immobilized thereon.
- a reaction site may include a substantially planar surface in a channel of a flow cell that has a colony of nucleic acids thereon.
- the nucleic acids in the colony have the same sequence, being for example, clonal copies of a single stranded or double stranded template.
- a reaction site may contain only a single nucleic acid molecule, for example, in a single stranded or double stranded form.
- a plurality of reaction sites may be unevenly distributed along the support surface or arranged in a predetermined manner (e.g., side-by-side in a matrix, such as in microarrays).
- a reaction site can also include a reaction chamber (or well) that at least partially defines a spatial region or volume configured to compartmentalize the desired reaction.
- reaction chamber and "well” interchangeably.
- reaction chamber or “well” includes a spatial region that is in fluid communication with a flow channel.
- the reaction chamber may be at least partially separated from the surrounding environment or other spatial regions.
- a plurality of reaction chambers may be separated from each other by shared walls.
- the reaction chamber may include a cavity defined by interior surfaces of a well and have an opening or aperture so that the cavity may be in fluid communication with a flow channel.
- Biosensors including such reaction chambers are described in greater detail in international application no. PCT/US2011/057111, filed on October 20,2011 , which is incorporated herein by reference in its entirety.
- the reaction chambers are sized and shaped relative to solids (including semi-solids) so that the solids may be inserted, fully or partially, therein.
- the reaction chamber may be sized and shaped to accommodate only one capture bead.
- the capture bead may have clonally amplified DNA or other substances thereon.
- the reaction chamber may be sized and shaped to receive an approximate number of beads or solid substrates.
- the reaction chambers may also be filled with a porous gel or substance that is configured to control diffusion or filter fluids that may flow into the reaction chamber.
- sensors are associated with corresponding pixel areas of a sample surface of a biosensor.
- a pixel area is a geometrical construct that represents an area on the biosensor's sample surface for one sensor (or pixel).
- a sensor that is associated with a pixel area detects light emissions gathered from the associated pixel area when a desired reaction has occurred at a reaction site or a reaction chamber overlying the associated pixel area.
- the pixel areas can overlap.
- a plurality of sensors may be associated with a single reaction site or a single reaction chamber.
- a single sensor may be associated with a group of reaction sites or a group of reaction chambers.
- a biosensor includes a structure having a plurality of reaction sites and/or reaction chambers (or wells).
- a biosensor may include a solid-state imaging device (e.g., CCD or CMOS imager) and, optionally, a flow cell mounted thereto.
- the flow cell may include at least one flow channel that is in fluid communication with the reaction sites and/or the reaction chambers.
- the biosensor is configured to fluidically and electrically couple to a bioassay system.
- the bioassay system may deliver reactants to the reaction sites and/or the reaction chambers according to a predetermined protocol (e.g., sequencing-by-synthesis) and perform a plurality of imaging events.
- a “cluster” is a colony of similar or identical molecules or nucleotide sequences or DNA strands.
- a cluster can be an amplified oligonucleotide or any other group of a polynucleotide or polypeptide with a same or similar sequence.
- a cluster can be any element or group of elements that occupy a physical area on a sample surface.
- clusters are immobilized to a reaction site and/or a reaction chamber during a base calling cycle.
- the term "immobilized,” when used with respect to a biomolecule or biological or chemical substance, includes substantially attaching the biomolecule or biological or chemical substance at a molecular level to a surface.
- a biomolecule or biological or chemical substance may be immobilized to a surface of the substrate material using adsorption techniques including non-covalent interactions (e.g., electrostatic forces, van der Waals, and dehydration of hydrophobic interfaces) and covalent binding techniques where functional groups or linkers facilitate attaching the biomolecules to the surface.
- Immobilizing biomolecules or biological or chemical substances to a surface of a substrate material may be based upon the properties of the substrate surface, the liquid medium carrying the biomolecule or biological or chemical substance, and the properties of the biomolecules or biological or chemical substances themselves.
- a substrate surface may be functionalized (e.g., chemically or physically modified) to facilitate immobilizing the biomolecules (or biological or chemical substances) to the substrate surface.
- the substrate surface may be first modified to have functional groups bound to the surface. The functional groups may then bind to biomolecules or biological or chemical substances to immobilize them thereon.
- a substance can be immobilized to a surface via a gel, for example, as described in US Patent Publ. No. US 2011/0059865 A1 , which is incorporated herein by reference.
- nucleic acids can be attached to a surface and amplified using bridge amplification.
- Useful bridge amplification methods are described, for example, in U.S. Patent No. 5,641,658 , WO 2007/010251 , U.S. Pat. No. 6,090,592 ; U.S. Patent Publ. No. 2002/0055100 A1 ; U.S. Patent No. 7,115,400 ; U.S. Patent Publ. No. 2004/0096853 A1 ; U.S. Patent Publ. No. 2004/0002090 A1 ; U.S. Patent Publ. No. 2007/0128624 A1 ; and U.S. Patent Publ. No.
- nucleic acids can be attached to a surface and amplified using one or more primer pairs.
- one of the primers can be in solution and the other primer can be immobilized on the surface (e.g., 5'-attached).
- a nucleic acid molecule can hybridize to one of the primers on the surface followed by extension of the immobilized primer to produce a first copy of the nucleic acid.
- the assay protocols executed by the systems and methods described herein include the use of natural nucleotides and also enzymes that are configured to interact with the natural nucleotides.
- Natural nucleotides include, for example, ribonucleotides (RNA) or deoxyribonucleotides (DNA).
- Natural nucleotides can be in the mono-, di-, or triphosphate form and can have a base selected from adenine (A), thymine (T), uracil (U), guanine (G) or cytosine (C). It will be understood however that non-natural nucleotides, modified nucleotides or analogs of the aforementioned nucleotides can be used.
- Some examples of useful non-natural nucleotides are set forth below in regard to reversible terminator-based sequencing by synthesis methods.
- items or solid substances may be disposed within the reaction chambers.
- the item or solid may be physically held or immobilized within the reaction chamber through an interference fit, adhesion, or entrapment.
- Exemplary items or solids that may be disposed within the reaction chambers include polymer beads, pellets, agarose gel, powders, quantum dots, or other solids that may be compressed and/or held within the reaction chamber.
- a nucleic acid superstructure such as a DNA ball, can be disposed in or at a reaction chamber, for example, by attachment to an interior surface of the reaction chamber or by residence in a liquid within the reaction chamber.
- a DNA ball or other nucleic acid superstructure can be preformed and then disposed in or at the reaction chamber.
- a DNA ball can be synthesized in situ at the reaction chamber.
- a DNA ball can be synthesized by rolling circle amplification to produce a concatamer of a particular nucleic acid sequence and the concatamer can be treated with conditions that form a relatively compact ball.
- DNA balls and methods for their synthesis are described, for example in, U.S. Patent Publication Nos. 2008/0242560 A1 or 2008/0234136 A1 , each of which is incorporated herein in its entirety.
- a substance that is held or disposed in a reaction chamber can be in a solid, liquid, or gaseous state.
- base calling identifies a nucleotide base in a nucleic acid sequence.
- Base calling refers to the process of determining a base call (A, C, G, T) for every cluster at a specific cycle.
- base calling can be performed utilizing four-channel, two-channel or one-channel methods and systems described in the incorporated materials of U.S. Patent Application Publication No. 2013/0079232 .
- a base calling cycle is referred to as a "sampling event.”
- a sampling event comprises two illumination stages in time sequence, such that a pixel signal is generated at each stage. The first illumination stage induces illumination from a given cluster indicating nucleotide bases A and T in a AT pixel signal, and the second illumination stage induces illumination from a given cluster indicating nucleotide bases C and T in a CT pixel signal.
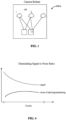
- FIG. 1 shows a traditional design, in which multiple camera pixels capture a magnified image of a cluster on a substrate.
- a nano well is built on top of a CMOS sensor substrate. See Application No. 16/241,905 .
- a sensor is positioned directly over the nano well.
- a sampling device includes a sample surface having an array of pixel areas and a solid-state array of sensors. Each sensor generates pixel signals in base calling cycles. The pixel signals represent light gathered from a corresponding pixel area of the sample surface.
- a sensor collects light from two wells.
- off axis illumination can distinguish signals from two clusters growing in one well. This is much different from prior camera-reliant, far field imaging approaches.
- Fluidic channels carry reagents over and through the nano wells during sequencing.
- light energy such as laser illumination
- Light from the tags is collected by the sensors.
- one, two or four illuminations produce an equal number of intensity maps. These are near field intensity maps, as distinct from photographic images, more like sensing a pen stroke than taking a picture.
- the sidewalls 238, 240 are sized and shaped so that a flow channel 244 exists between the flow cover 236 and the sampling device 204.
- the flow channel 244 may include a height Hi that is determined by the sidewalls 238, 240.
- the height Hi may be between about 50-400 ⁇ m (micrometer) or, more particularly, about 80-200 ⁇ m. In the illustrated embodiment, the height Hi is about 100 ⁇ m.
- the flow cover 236 may include a material that is transparent to excitation light 201 propagating from an exterior of the biosensor 200 into the flow channel 244. As shown in FIG. 2 , the excitation light 201 approaches the flow cover 236 at a non-orthogonal angle. However, this is only for illustrative purposes as the excitation light 201 may approach the flow cover 236 from different angles.
- the FET's may detect at least one of a presence and concentration change of various analytes.
- the array of FET's may monitor changes in hydrogen ion concentration.
- Such sampling devices are described in greater detail is U.S. Patent Application Publication No. 2009/0127589 , which is incorporated by reference in the entirety for the use of understanding such FET arrays.
- the wells 256, 258, 260, 262, and 264 may be distributed in a pattern along the sample surface 234.
- the wells 256, 258, 260, 262, and 264 may be located in rows and columns along the sample surface 234 in a manner that is similar to a microarray.
- various patterns of wells 256, 258, 260, 262, and 264 may be used.
- each of the wells 256, 258, 260, 262, and 264 includes more than one cluster of biomolecules (e.g., oligonucleotides) that are immobilized on the sample surface 234.
- well 256 holds cluster pair 206AB
- well 258 holds cluster pair 208AB
- well 260 holds cluster pair 210AB
- well 262 holds cluster pair 212AB
- well 264 holds cluster pair 214AB.
- a sensor (or pixel) on the sample surface 234 is configured to receive light emissions from at least two clusters. In some embodiments, the sensor simultaneously receives the light emissions from the at least two clusters.
- the two wells have different offsets relative to a center of the pixel area 306'.
- dominant well 304 is more proximate to the pixel area center 306A than the subordinate well 302 (i.e., dominant well 304 has a smaller offset relative to the pixel area center 306A than the subordinate well 302).
- the sensor 306 receives different amounts of illumination from the two wells during illumination stages of the base calling cycle (or sampling event). Since each of the wells 302 and 304 holds a corresponding cluster 302A and 304A, the different amounts of illumination allow for identification of one of the clusters as bright (or major) and the other as dim (or minor). In the illustrated embodiment, cluster 302A within the dominant well 302 is identified as the bright cluster and cluster 304A within the subordinate well 304 is identified as the dim cluster. In embodiments, sensor 306 receives an amount of illumination from the bright cluster 302A that is greater than an amount of illumination received from the dim cluster 304A in the subordinate well 304.
- the technology disclosed increases throughput of the biosensor 300 by base calling two clusters 302A and 302B held by two corresponding wells 302 and 304 using one shared sensor 306.
- the technology disclosed increases throughput of the biosensor 300 by using N sensors to base call N + M clusters on corresponding N + M wells of the sample surface 234, where M is a positive integer. In some embodiments, M is equal to N or almost equal to N. In other embodiments, M might not be equal to N or even be less than N.
- Heat map 517 provides a visualization of how the multi-nomial distribution broadens as sequencing cycles progress.
- the distribution shape resembles a cone.
- FIG. 6 is a high-level block diagram of deriving actual signals from captured intensity maps, of distinguishing signal from noise.
- a sequencing device such as the iSeq 100 (673) uses a flow cell (653), takes intensity readings, and calls bases for clusters on the flow cell. For characterization and performance analysis, the base calling can be against a previously analyzed sample.
- the ground truth for the sequence of the well-known sample can be in the sequencer base calling and/or prior sequencing of the sample. This ground truth is used when characterizing the sequencer's performance.
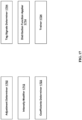
- intensity data for a particular sensor (621) and neighboring sensors (643) can be corrected to take into account phasing (623), intensity decay (625), crosstalk (645) and background readings (675).
- the combination of these corrections (647) extracts the underlying signal (649) from captured intensity. In a signal present condition, the extracted signal can be less than half of the captured intensity.
- Fitting coefficients for each particular pixel can be based on the individual pixel work and take into account crosstalk from neighboring pixels that may have different background levels.
- a method is described below for calculating pixel-specific background coefficients that take into account crosstalk from the neighboring pixels. With so few coefficients to fit, gradient descent can calculate the coefficients efficiently. In practice, training benefited from varying the learning rate. Dropout was not required to avoid over fitting.
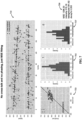
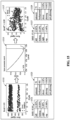
- FIGs. 7-12 depict predictions and intensity readings for a sequence of 150 cycles, when various corrections were applied.
- FIG. 13 illustrates heat maps generated to visualize spatial distribution of contributions by various factors to the measured intensity at individual pixels.
- Panel 733 is a scatter plot of predicted versus actual or observed values for the clusters of no signal and signal present cycles.
- Panels 735 and 737 are normalized histograms of residual error between predicted and observed values.
- panel 735 is for the signal present condition and panel 737 for the no signal condition.
- Values derived from this characterization (739) include a mean squared error of 1298.20, a background intensity of 391.82, a signal intensity of 215.18 and a per cycle decay of 0.263%.
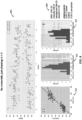
- FIG. 8 illustrates analysis of 150 cycles and one run with correction for phasing, in addition to decay and background.
- Phasing distribution is represented by a three-term polynomial with a single cycle phasing probability of 0.17%, a correct behavior probability of 99.70%, and the pre-phasing probability of 0.12%. After fitting, the residual means where error was reduced to 1047.22.
- predictions and actual values are depicted in solid and hollow dots. The predicted lines are no longer straight. Improvement of the predicted values in following variation of the actual values is sometimes visible. For instance, the predicted no signal condition before and after cycle 100 goes up and down with actual observations. The signal present condition around cycle 80 also has predictions that more closely track observations.
- Panel 833 shows a distribution cloud, instead of a constant predicted value of the no signal condition.
- the distributions in panels 835 and 837 are somewhat tighter than they were without taking into account phasing.
- Values derived from this characterization include a mean squared error of 1047.22, a reduced background intensity of 369.35, an increased signal intensity of 238.47, with the decreased per cycle decay of 0.105%,
- FIG. 9 illustrates analysis of 150 cycles in one run with correction for crosstalk, instead of phasing. Correction for crosstalk did not reduce residual square error as much as correction for phasing. Mean squared residual error was 1077.49.
- the top panel 810 illustrates that taking into account crosstalk decreased the calculated background to 300.27 with a significant contribution to intensity coming from neighboring pixels.
- Panel 933 shows clouds that are rotating to become more aligned to the solid diagonal line.
- the distributions in panels 935 and 937 have outliers that are not well predicted by correcting for crosstalk.
- Values derived for this correction include a mean squared error of 1077.49, a reduced background intensity of 300.27, the signal intensity of 212.61 and a per cycle decay of 0.242%.
- the calculated crosstalk is substantially higher from the top neighboring pixel then from the writer left.
- Crosstalk coefficients, after fitting, were 11.84% from the top, 4.75% from the bottom, 0.65% from the left and 0.96% from the right.
- FIG. 10 illustrates combining correction for phasing in crosstalk in addition to estimation of background, intensity and decay. Correction for both phasing and crosstalk significantly reduced the residual mean square error to 845.59, applying the same three-term polynomial phasing kernel as in figure 8 . In the top panel 810, predictions go up and down with actual observations especially after cycle 40 with very little overshoot in the predictions.
- Panel 1033 shows clouds that are nicely scattered around the solid diagonal line. Residual error history in panels 1035 and 1037 are increasingly tight distributions with some SKU in the no signal prediction due to an outlier.
- the outliers of lower predicted then observed values can be seen just after cycle 20, just before cycle 100 and just before cycle 130. Values drive for this correction (1039) include a mean squared error of 845.59, a lower background of 279.30, the signal intensity of 235.24 and a reduced decay per cycle of 0.0943%.
- the crosstalk coefficients show a decrease in crosstalk from the top and slight increases from other neighboring pixels. Crosstalk coefficients were 10.64% from the top, 5.44% from the bottom, 0.81% from the left and 1.28% from the right.
- FIGs. 11 and 12 analyze using expanded phasing kernels, expanded to five-and ten-term polynomials.
- FIG. 11 illustrates expanding the phasing kernel from 3 to 5 cycles, covering pre-phasing by up to three skips. Expansion of the phasing kernel increases the number of pre-phasing forward skips accounted for in a particular cycle; in contrast, phasing can only result in falling behind by one position per cycle, so the number of phasing coefficients remains one. Increased correction for pre-phasing from one to three skips only reduced the mean squared error from 845.59 to 844.04, which produces very little change in any of the visualization panels between FIGs. 10 and 11 . Small improvements in background, intensity and per cycle decay resulted. Calculated crosstalk from top and right pixels increased marginally while crosstalk from bottom and left pixels was unchanged.
- FIGs. 13A-F are a series of heat maps created by applying false color to a photograph of a flow cell, based on analysis of contributions of various factors to measured intensities in an intensity map for one channel.
- the factors analyzed and visualized are contributions of background illumination ( FIG. 13A ), background sensor variation ( FIG. 13B ), cross talk from neighboring pixels ( FIG. 13C ), phasing and pre-phasing ( FIGs. 13D-E ), and signal decay ( FIG. 13F ). Over 150 cycles, parameters were separately calculated for each pixel.
- the phasing, pre-phasing and signal decay maps indicate uniform distributions of variation.
- the visualization of signal decay does not show any apparent pattern, except at the exit from the flow cell in the bottom right corner. This exit area shows variation in all of the heat maps.
- Heat maps for phasing and pre-phasing ( FIGs. 13D-E ) also have uniform distributions, excepting a red colorized splotch just to the left of the dark, uncolorized splotch, five rows from the bottom. A difference in color between the phasing and pre-phasing in the heat maps indicates that phasing is slightly more likely than pre-phasing.
- the uniform distributions in heat maps indicate random variations of several factors during sequencing, as expected.
- FIG. 13A-B separate background illumination effects from sensor-specific background reading biases.
- the background illumination heat map ( FIG. 13A ) indicates brighter illumination on the left side of the flow cell than on the right side. Apart from illumination effects, the sensor-specific biases on background readings is mapped in FIG. 13B . This apparent manufacturing or design artifact was larger than expected, as discussed below in the context of FIGs. 14A-B .
- FIG. 13C maps relative crosstalk contributions of top, bottom, left and right adjoining pixels.
- the largest contributor by far is the top pixel, located north of the center pixel that is generating a signal.
- the bottom pixel contributes more crosstalk than either left or right neighboring pixels. (However, analysis below suggests that this estimation may be biased.)
- these heat maps characterize performance of this particular flow cell in a way that suggests design and manufacturing improvements. Illumination is not quite uniform, could be improved. Systematically greater crosstalk from the top and bottom pixels suggests potential design or manufacturing improvement, or could simply be a consequence of asymmetry in placement of dominant and secondary wells in a dual well design (300B).
- the red colorized splotch at the outlet of the flow cell, in the bottom right corner may indicate an opportunity for design improvement. Thus, characterization of flow cell performance leads to manufacturing and design improvements.
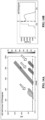
- FIGs. 14A-B reflect sensor-specific variation in background readings that is not randomly distributed.
- the 2d histogram in FIG. 14A revealed that there are background reading levels for the no signal condition in three ranges, around 250, 750 and 900, as indicated by arrows.
- the std histogram in FIG. 14B confirmed three distinct background levels, in steps to the left of the vertical dashed line. As an improvement to the model, individual pixel background levels were set, instead of having a uniform sensor background reading.
- FIG. 15 presents a background level hyper-parameter approach to setting a particular pixel's background level taking into account background levels of its neighbors.
- a subject of analysis in FIG. 15 is whether to adjust a pixel level by its minimum background level in the no signal condition or by slightly less than the minimum background level.
- One approach to shifting the signal level of a particular pixel would be to subtract the minimum signal level for that pixel (in that intensity channel) over the cycles measured.
- a minimum signal level corresponds to the no signal condition, as opposed to the signal present condition. It is intuitively appealing to subtract the full minimum value, but analysis showed that subtracting somewhat less produced better corrections.
- Graph 1513 shows measured intensity values for both no signal and signal present conditions for a particular pixel, in red, and values of four neighboring pixels, in blue. The particular pixel was selected because neighboring pixels included clusters. For each of the five pixels, there are distinct lines for no signal and signal present conditions. However, these distinct lines are relatively close together in graph 1531 and not visually distinguishable for the neighboring pixels.
- Graph 1515 depicts the effect on mean squared error of adjusting intensity values by 90 to 100% of the minimum intensity value for the particular pixel.
- adjusting individual pixels by subtracting increasing portions of their minimum background level improves the mean squared error.
- the improvement stops at 99% of the minimum intensity value and turns back upward when 100% of the minimum intensity value is used as an adjustment factor.
- Graph 1517 shows distributions of pixel intensity readings, reduced by 0.99 * min(signals) for the five pixels, plotted on a rescaled graph. Instead of a plot over the intensity level range from 0 to 1000, this graph, after adjustment, plots intensity levels over a range from 0 to 225. Upper sequences of dots, for the signal present condition, are visually separated from lower sequences of dots, for the no signal condition.
- estimated mean squared error reportedly was substantially reduced and bias removed from crosstalk estimations. The mean squared error was reduced from 82.85 to 57.54. The big reduction in mean squared error resulted from pixel-by-pixel adjustment to remove a large portion of background from the intensity readings.
- tables 1521 and 1527 indicate that crosstalk from the top pixel was not dominant. Removal of bias produced an estimate that crosstalk from neighbors was nearly equal. This is less suggestive of a manufacturing or illumination angle issue than appeared from the crosstalk coefficients of FIGs. 7-13 .
- tables 1523 and 1529 parameters for the center or red pixel, before and after adjustment, are given.
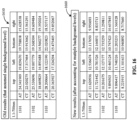
- FIG. 16 includes tables that illustrate reduced estimates of crosstalk after accounting for multiple background levels intrinsic to individual sensors.
- the tables include data for median values of crosstalk coefficients among pixels whose neighbors include DNA clusters. Two intensity channels, for red and green laser illumination, are indicated for three different flow cells. Crosstalk coefficients for top, bottom, left and right neighbors are given. After adjustment, estimated crosstalk coefficients were half or less of the originally estimated coefficients. For the pixels analyzed, adjustment based on intrinsic background levels of sensors eliminated the appearance that crosstalk from the top neighbor dominated crosstalk from other neighbors, which appeared in FIGs. 7-13 .
- FIG. 18 illustrates one example of the phasing and prephasing effect.
- FIG. 19 illustrates one example of spatial crosstalk.
- FIG. 21 illustrates one example of fading.
- FIG. 22 is a computer system that can be used to implement the technology disclosed.
- Phasing is caused by incomplete removal of the 3' terminators and fluorophores as well as sequences in the analyte missing an incorporation cycle.
- Prephasing is caused by the incorporation of nucleotides without effective 3'-blocking.
- Phasing and prephasing effect is a nonstationary distortion and thus the proportion of sequences in each analyte that are affected by phasing and prephasing increases with cycle number; hampering correct base identification and limiting the length of useful sequence reads.
- Incomplete extension due to phasing results in lagging strands (e.g., t -1 from the current cycle).
- Addition of multiple nucleotides or probes in a population of identical strands due to prephasing results in leading strands (e.g., t +1 from the current cycle).
- Other terms used to refer to phasing and phasing include falling behind, moved ahead, lagging, leading, dephasing, post-phasing, out-of-phase, out-of-sync, out-of-step nucleotide synthesis, asynchronicity, carry-forward (CF), incomplete or premature extension (IE), and droop (DR).
- FIG. 18 illustrates one example of the phasing and prephasing effect 1800.
- FIG. 18a shows that some strands of an analyte lead (red) while others lag behind (blue), leading to a mixed signal readout of the analyte.
- FIG. 18b depicts the intensity output of analyte fragments with "C" impulses every 15 cycles in a heterogeneous background. Notice the anticipatory signals (gray arrow) and memory signals (black arrows) due to the phasing and prephasing effect 1800.
- Spatial crosstalk refers to a signal or light emission from one or more non-associated analytes (or pixel areas) that is detected by a corresponding light detector of an associated analyte (or pixel area). Spatial crosstalk is caused by unwanted emissions from adjacent analytes.
- the intensities of each analyte should correspond to just one analyte sequence. However, the observed intensities often contain signals from neighboring analyte sequences, other than the interrogated/target one, and, hence, are not pure.
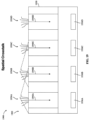
- FIG. 19 illustrates one example of spatial crosstalk.
- FIG. 19 illustrates a detection device 1900 having a plurality of pixel areas 1956A-1956D on a detector surface 602.
- the detection device 1900 includes light sensors 1919A-1919D.
- the light sensors 1919A-1919D are associated with and correspond to the pixel areas 1956A-1956D, respectively.
- Corresponding detection paths 1940A-1940D extend between the light sensors 1919A-1919D and corresponding pixel areas 1956A-1956D.
- the arrows that indicate the detection paths 1940A-1940D are merely to illustrate a general direction that the light propagates through the respective detection path.
- the detection device 1900 is configured to detect light using the light sensors 1919A-1919D.
- light emissions or emission signals
- the light emissions may be indicative of, for example, a positive binding event between the analytes located at the corresponding pixel area and another biomolecule.
- the pixel areas 1956A-1956D are illuminated by an excitation light (e.g., 532 nm).
- the pixel areas 1956A and 1956B are bound to respective biomolecules having light labels (e.g., fluorescent moieties).
- the pixel areas 1956A and 1956B provide light emissions as demonstrated in FIG. 19 .
- the pixel areas 1956 and the light sensors 1919 may be located relatively close to one another such that light emissions from a non-associated pixel area may be detected by a light sensor. Such light emissions may be referred to as crosstalk emissions or spatial crosstalk.
- the light emissions propagating from the pixel area 1956A include a crosstalk signal and a pixel signal.
- the pixel signal of the light emissions from the pixel area 1956A is that signal of the light emissions that is configured to be detected by the light sensor 1919A.
- the pixel signal includes the light emissions that propagate at an angle that is generally toward the light sensor 1919A such that filter walls 1930 defining the detection path 1940A are capable of directing the light emissions toward the light sensor 1919A.
- the crosstalk signal is that signal of the light emissions that clears the filter walls 1930 defining the detection path 1940A and propagates into, for example, the detection path 1940B.
- the crosstalk signal may be directed to the light sensor 1919B, which is not associated with the pixel area 1956A.
- the light sensor 1919B may be referred to as a non-associated light sensor with respect to the pixel area 1956A.
- the light sensor 1919A may detect the pixel emissions from the pixel area 1956A and the crosstalk emissions from the pixel area 1956B.
- the light sensor 1919B may detect the pixel emissions from the pixel area 1956B and the crosstalk emissions from the pixel area 1956A.
- the light sensor 1919C may detect the crosstalk emissions from the pixel area 1956B.
- the pixel area 1956C is not providing light emissions in FIG. 19 .
- an amount of light detected by the light sensor 1919C is less than the corresponding amounts of light detected by the light sensors 1919A and 1919B.
- the light sensor 1919C only detects crosstalk emissions from the pixel area 1956B, and the light sensor 1919D does not detect crosstalk emissions or pixel emissions.
- Fading is an exponential decay in fluorescent signal intensity as a function of cycle number. As the sequencing run progress, the analyte strands are washed excessively, exposed to laser emissions that create reactive species, and subject to harsh environmental conditions. All of these lead to a gradual loss of fragments in each analyte, decreasing its fluorescent signal intensity. Fading is also called dimming or signal decay.
- FIG. 20 illustrates one example of fading 2000. In FIG. 20 , the intensity values of analyte fragments with AC microsatellites show exponential decay.
- the model 623 is communicably linked to the storage subsystem 2110 and the user interface input devices 2138.
- User interface output devices 2176 can include a display subsystem, a printer, a fax machine, or non-visual displays such as audio output devices.
- the display subsystem can include an LED display, a cathode ray tube (CRT), a flat-panel device such as a liquid crystal display (LCD), a projection device, or some other mechanism for creating a visible image.
- the display subsystem can also provide a non-visual display such as audio output devices.
- output device is intended to include all possible types of devices and ways to output information from computer system 2100 to the user or to another machine or computer system.
- Storage subsystem 2110 stores programming and data constructs that provide the functionality of some or all of the modules and methods described herein. These software modules are generally executed by deep learning processors 2178.
- Deep learning processors 2178 can be graphics processing units (GPUs), field-programmable gate arrays (FPGAs), application-specific integrated circuits (ASICs), and/or coarse-grained reconfigurable architectures (CGRAs). Deep learning processors 2178 can be hosted by a deep learning cloud platform such as Google Cloud Platform TM , Xilinx TM , and Cirrascale TM .
- GPUs graphics processing units
- FPGAs field-programmable gate arrays
- ASICs application-specific integrated circuits
- CGRAs coarse-grained reconfigurable architectures
- Deep learning processors 2178 can be hosted by a deep learning cloud platform such as Google Cloud Platform TM , Xilinx TM , and Cirrascale TM .
- Examples of deep learning processors 2178 include Google's Tensor Processing Unit (TPU) TM , rackmount solutions like GX4 Rackmount Series TM , GX21 Rackmount Series TM , NVIDIA DGX-1 TM , Microsoft' Stratix V FPGA TM , Graphcore's Intelligent Processor Unit (IPU) TM , Qualconun's Zeroth Platform TM with Qualcomm processors TM , NVIDIA's Volta TM , NVIDIA's DRIVE PX TM , NVIDIA's JETSON TX1/TX2 MODULE TM , Intel's Nirvana TM , Movidius VPU TM , Fujitsu DPI TM , ARM's DynamicIQ TM , IBM TrueNorth TM , and others.
- TPU Tensor Processing Unit
- rackmount solutions like GX4 Rackmount Series TM , GX21 Rackmount Series TM , NVIDIA DGX-1 TM , Microsoft
- Memory subsystem 2122 used in the storage subsystem 2110 can include a number of memories including a main random access memory (RAM) 2132 for storage of instructions and data during program execution and a read only memory (ROM) 2121 in which fixed instructions are stored.
- a file storage subsystem 2121 can provide persistent storage for program and data files, and can include a hard disk drive, a floppy disk drive along with associated removable media, a CD-ROM drive, an optical drive, or removable media cartridges.
- the modules implementing the functionality of certain implementations can be stored by file storage subsystem 2121 in the storage subsystem 2110, or in other machines accessible by the processor.
Landscapes
- Engineering & Computer Science (AREA)
- Physics & Mathematics (AREA)
- Health & Medical Sciences (AREA)
- Theoretical Computer Science (AREA)
- Life Sciences & Earth Sciences (AREA)
- General Health & Medical Sciences (AREA)
- General Physics & Mathematics (AREA)
- Evolutionary Computation (AREA)
- Data Mining & Analysis (AREA)
- Artificial Intelligence (AREA)
- Software Systems (AREA)
- Biophysics (AREA)
- General Engineering & Computer Science (AREA)
- Molecular Biology (AREA)
- Computing Systems (AREA)
- Chemical & Material Sciences (AREA)
- Mathematical Physics (AREA)
- Immunology (AREA)
- Biomedical Technology (AREA)
- Medical Informatics (AREA)
- Computational Linguistics (AREA)
- Computer Vision & Pattern Recognition (AREA)
- Bioinformatics & Cheminformatics (AREA)
- Analytical Chemistry (AREA)
- Bioinformatics & Computational Biology (AREA)
- Spectroscopy & Molecular Physics (AREA)
- Evolutionary Biology (AREA)
- Nuclear Medicine, Radiotherapy & Molecular Imaging (AREA)
- Biochemistry (AREA)
- Pathology (AREA)
- Biotechnology (AREA)
- Databases & Information Systems (AREA)
- Optics & Photonics (AREA)
- Signal Processing (AREA)
- Bioethics (AREA)
- Epidemiology (AREA)
- Public Health (AREA)
- Chemical Kinetics & Catalysis (AREA)
- Multimedia (AREA)
- Proteomics, Peptides & Aminoacids (AREA)
Applications Claiming Priority (7)
| Application Number | Priority Date | Filing Date | Title |
|---|---|---|---|
| US201962849091P | 2019-05-16 | 2019-05-16 | |
| US201962849132P | 2019-05-16 | 2019-05-16 | |
| US201962849133P | 2019-05-16 | 2019-05-16 | |
| US16/874,633 US11593649B2 (en) | 2019-05-16 | 2020-05-14 | Base calling using convolutions |
| US16/874,599 US11423306B2 (en) | 2019-05-16 | 2020-05-14 | Systems and devices for characterization and performance analysis of pixel-based sequencing |
| PCT/US2020/033280 WO2020232409A1 (en) | 2019-05-16 | 2020-05-15 | Systems and devices for characterization and performance analysis of pixel-based sequencing |
| EP20733084.6A EP3969884B1 (de) | 2019-05-16 | 2020-05-15 | Systeme und verfahren zur charakterisierung und erfolgsanalyse von pixel-basierter sequenzierung |
Related Parent Applications (1)
| Application Number | Title | Priority Date | Filing Date |
|---|---|---|---|
| EP20733084.6A Division EP3969884B1 (de) | 2019-05-16 | 2020-05-15 | Systeme und verfahren zur charakterisierung und erfolgsanalyse von pixel-basierter sequenzierung |
Publications (2)
| Publication Number | Publication Date |
|---|---|
| EP4394778A2 true EP4394778A2 (de) | 2024-07-03 |
| EP4394778A3 EP4394778A3 (de) | 2024-08-28 |
Family
ID=74041703
Family Applications (3)
| Application Number | Title | Priority Date | Filing Date |
|---|---|---|---|
| EP20733084.6A Active EP3969884B1 (de) | 2019-05-16 | 2020-05-15 | Systeme und verfahren zur charakterisierung und erfolgsanalyse von pixel-basierter sequenzierung |
| EP20730877.6A Withdrawn EP3970151A1 (de) | 2019-05-16 | 2020-05-15 | Base-calling unter verwendung von faltungen |
| EP24170634.0A Pending EP4394778A3 (de) | 2019-05-16 | 2020-05-15 | Systeme und verfahren zur charakterisierung und erfolgsanalyse von pixel-basierter sequenzierung |
Family Applications Before (2)
| Application Number | Title | Priority Date | Filing Date |
|---|---|---|---|
| EP20733084.6A Active EP3969884B1 (de) | 2019-05-16 | 2020-05-15 | Systeme und verfahren zur charakterisierung und erfolgsanalyse von pixel-basierter sequenzierung |
| EP20730877.6A Withdrawn EP3970151A1 (de) | 2019-05-16 | 2020-05-15 | Base-calling unter verwendung von faltungen |
Country Status (4)
| Country | Link |
|---|---|
| EP (3) | EP3969884B1 (de) |
| CN (3) | CN112313750B (de) |
| AU (2) | AU2020273459A1 (de) |
| CA (2) | CA3104851A1 (de) |
Families Citing this family (21)
| Publication number | Priority date | Publication date | Assignee | Title |
|---|---|---|---|---|
| US11347965B2 (en) | 2019-03-21 | 2022-05-31 | Illumina, Inc. | Training data generation for artificial intelligence-based sequencing |
| US11210554B2 (en) | 2019-03-21 | 2021-12-28 | Illumina, Inc. | Artificial intelligence-based generation of sequencing metadata |
| US11593649B2 (en) | 2019-05-16 | 2023-02-28 | Illumina, Inc. | Base calling using convolutions |
| US11423306B2 (en) | 2019-05-16 | 2022-08-23 | Illumina, Inc. | Systems and devices for characterization and performance analysis of pixel-based sequencing |
| JP7747643B2 (ja) | 2020-02-20 | 2025-10-01 | イルミナ インコーポレイテッド | 人工知能ベースの多対多ベースコール |
| US12592298B2 (en) | 2020-02-20 | 2026-03-31 | Illumina, Inc. | Hardware execution and acceleration of artificial intelligence-based base caller |
| US12591780B2 (en) | 2020-02-20 | 2026-03-31 | Illumina, Inc. | Data compression for artificial intelligence-based base calling |
| US12354008B2 (en) | 2020-02-20 | 2025-07-08 | Illumina, Inc. | Knowledge distillation and gradient pruning-based compression of artificial intelligence-based base caller |
| WO2022197752A1 (en) * | 2021-03-16 | 2022-09-22 | Illumina, Inc. | Tile location and/or cycle based weight set selection for base calling |
| US20220301657A1 (en) | 2021-03-16 | 2022-09-22 | Illumina, Inc. | Tile location and/or cycle based weight set selection for base calling |
| EP4309080A1 (de) * | 2021-03-16 | 2024-01-24 | Illumina Software, Inc. | Quantisierung der parameter eines neuronalen netzes für base-calling |
| US12444482B2 (en) | 2021-04-15 | 2025-10-14 | Illumina, Inc. | Multi-channel protein voxelization to predict variant pathogenicity using deep convolutional neural networks |
| US12217829B2 (en) | 2021-04-15 | 2025-02-04 | Illumina, Inc. | Artificial intelligence-based analysis of protein three-dimensional (3D) structures |
| US12530882B2 (en) | 2021-07-01 | 2026-01-20 | Illumina, Inc. | Efficient artificial intelligence-based base calling of index sequences |
| CN117063240A (zh) * | 2021-12-24 | 2023-11-14 | 上海芯像生物科技有限公司 | 基于深度学习的核酸测序方法和系统 |
| CN115376613A (zh) * | 2022-09-13 | 2022-11-22 | 郑州思昆生物工程有限公司 | 一种碱基类别检测方法、装置、电子设备及存储介质 |
| US12694522B2 (en) * | 2022-09-27 | 2026-07-28 | The University Of Hong Kong | Systems and methods of correcting batch effect in biological images |
| CN116364186A (zh) * | 2023-04-03 | 2023-06-30 | 赛纳生物科技(北京)有限公司 | 一种测序信号强度提取方法 |
| CN117726621B (zh) * | 2024-02-05 | 2024-06-25 | 深圳赛陆医疗科技有限公司 | 基于深度学习的基因测序碱基质量评估方法、产品、设备及介质 |
| CN121214431A (zh) * | 2024-06-26 | 2025-12-26 | 深圳市真迈生物科技有限公司 | 测定核酸模板碱基序列的方法、装置、设备和介质 |
| CN120015134B (zh) * | 2025-04-18 | 2025-09-26 | 深圳市睿法生物科技有限公司 | 基于人工智能的dna片段化基因检测数据处理方法 |
Citations (26)
| Publication number | Priority date | Publication date | Assignee | Title |
|---|---|---|---|---|
| US5641658A (en) | 1994-08-03 | 1997-06-24 | Mosaic Technologies, Inc. | Method for performing amplification of nucleic acid with two primers bound to a single solid support |
| US6090592A (en) | 1994-08-03 | 2000-07-18 | Mosaic Technologies, Inc. | Method for performing amplification of nucleic acid on supports |
| US20020055100A1 (en) | 1997-04-01 | 2002-05-09 | Kawashima Eric H. | Method of nucleic acid sequencing |
| US20040002090A1 (en) | 2002-03-05 | 2004-01-01 | Pascal Mayer | Methods for detecting genome-wide sequence variations associated with a phenotype |
| US20040096853A1 (en) | 2000-12-08 | 2004-05-20 | Pascal Mayer | Isothermal amplification of nucleic acids on a solid support |
| US7115400B1 (en) | 1998-09-30 | 2006-10-03 | Solexa Ltd. | Methods of nucleic acid amplification and sequencing |
| WO2007010251A2 (en) | 2005-07-20 | 2007-01-25 | Solexa Limited | Preparation of templates for nucleic acid sequencing |
| US20070128624A1 (en) | 2005-11-01 | 2007-06-07 | Gormley Niall A | Method of preparing libraries of template polynucleotides |
| US20080009420A1 (en) | 2006-03-17 | 2008-01-10 | Schroth Gary P | Isothermal methods for creating clonal single molecule arrays |
| US20080234136A1 (en) | 2005-06-15 | 2008-09-25 | Complete Genomics, Inc. | Single molecule arrays for genetic and chemical analysis |
| US20080242560A1 (en) | 2006-11-21 | 2008-10-02 | Gunderson Kevin L | Methods for generating amplified nucleic acid arrays |
| US20090127589A1 (en) | 2006-12-14 | 2009-05-21 | Ion Torrent Systems Incorporated | Methods and apparatus for measuring analytes using large scale FET arrays |
| US7595882B1 (en) | 2008-04-14 | 2009-09-29 | Geneal Electric Company | Hollow-core waveguide-based raman systems and methods |
| US20110059865A1 (en) | 2004-01-07 | 2011-03-10 | Mark Edward Brennan Smith | Modified Molecular Arrays |
| US20130079232A1 (en) | 2011-09-23 | 2013-03-28 | Illumina, Inc. | Methods and compositions for nucleic acid sequencing |
| US9096899B2 (en) | 2010-10-27 | 2015-08-04 | Illumina, Inc. | Microdevices and biosensor cartridges for biological or chemical analysis and systems and methods for the same |
| US9193998B2 (en) | 2013-03-15 | 2015-11-24 | Illumina, Inc. | Super resolution imaging |
| EP2173467B1 (de) | 2007-07-13 | 2016-05-04 | The Board Of Trustees Of The Leland Stanford Junior University | Verfahren und vorrichtung unter verwendung eines elektrischen felds für verbesserte biologische assays |
| US20160281150A1 (en) | 2015-03-24 | 2016-09-29 | Illumina, Inc. | Methods, carrier assemblies, and systems for imaging samples for biological or chemical analysis |
| US20170016060A1 (en) | 2014-03-11 | 2017-01-19 | Illumina, Inc. | Disposable, integrated microfluidic cartridge and methods of making and using same |
| WO2017034868A1 (en) | 2015-08-24 | 2017-03-02 | Illumina, Inc. | In-line pressure accumulator and flow-control system for biological or chemical assays |
| US20170189904A1 (en) | 2014-05-27 | 2017-07-06 | Ilumina, Inc. | Systems and methods for biochemical analysis including a base instrument and a removable cartridge |
| WO2017184997A1 (en) | 2016-04-22 | 2017-10-26 | Illumina, Inc. | Photonic stucture-based devices and compositions for use in luminescent imaging of multiple sites within a pixel, and methods of using the same |
| WO2017223041A1 (en) | 2016-06-21 | 2017-12-28 | Illumina, Inc. | Super-resolution microscopy |
| US9937497B2 (en) | 2010-10-27 | 2018-04-10 | Illumina, Inc. | Microdevices and biosensor cartridges for biological or chemical analysis and systems and methods for the same |
| US10167505B2 (en) | 2011-11-07 | 2019-01-01 | Illumina, Inc. | Integrated sequencing apparatuses and methods of use |
Family Cites Families (8)
| Publication number | Priority date | Publication date | Assignee | Title |
|---|---|---|---|---|
| US7576371B1 (en) * | 2006-03-03 | 2009-08-18 | Array Optronix, Inc. | Structures and methods to improve the crosstalk between adjacent pixels of back-illuminated photodiode arrays |
| US8965076B2 (en) * | 2010-01-13 | 2015-02-24 | Illumina, Inc. | Data processing system and methods |
| EP2933629B1 (de) * | 2010-02-19 | 2019-04-10 | Pacific Biosciences Of California, Inc. | System zur Messung von analytischen Reaktionen umfassend eine Buchse für einen Optode-Arraychip |
| US9736388B2 (en) * | 2013-12-13 | 2017-08-15 | Bio-Rad Laboratories, Inc. | Non-destructive read operations with dynamically growing images |
| CN105980578B (zh) * | 2013-12-16 | 2020-02-14 | 深圳华大智造科技有限公司 | 用于使用机器学习进行dna测序的碱基判定器 |
| CN106434873B (zh) * | 2015-08-13 | 2021-08-27 | 生捷科技控股公司 | 使核酸分子同步化的方法 |
| CN116612818A (zh) * | 2017-01-06 | 2023-08-18 | 伊鲁米那股份有限公司 | 移相校正 |
| CN109614981B (zh) * | 2018-10-17 | 2023-06-30 | 东北大学 | 基于斯皮尔曼等级相关的卷积神经网络的电力系统智能故障检测方法及系统 |
-
2020
- 2020-05-15 CA CA3104851A patent/CA3104851A1/en active Pending
- 2020-05-15 CN CN202080003513.1A patent/CN112313750B/zh active Active
- 2020-05-15 AU AU2020273459A patent/AU2020273459A1/en not_active Abandoned
- 2020-05-15 AU AU2020276115A patent/AU2020276115A1/en not_active Abandoned
- 2020-05-15 EP EP20733084.6A patent/EP3969884B1/de active Active
- 2020-05-15 EP EP20730877.6A patent/EP3970151A1/de not_active Withdrawn
- 2020-05-15 CA CA3104854A patent/CA3104854A1/en active Pending
- 2020-05-15 EP EP24170634.0A patent/EP4394778A3/de active Pending
- 2020-05-15 CN CN202080003540.9A patent/CN112368567B/zh active Active
- 2020-05-15 CN CN202311510081.5A patent/CN117935916A/zh active Pending
Patent Citations (26)
| Publication number | Priority date | Publication date | Assignee | Title |
|---|---|---|---|---|
| US5641658A (en) | 1994-08-03 | 1997-06-24 | Mosaic Technologies, Inc. | Method for performing amplification of nucleic acid with two primers bound to a single solid support |
| US6090592A (en) | 1994-08-03 | 2000-07-18 | Mosaic Technologies, Inc. | Method for performing amplification of nucleic acid on supports |
| US20020055100A1 (en) | 1997-04-01 | 2002-05-09 | Kawashima Eric H. | Method of nucleic acid sequencing |
| US7115400B1 (en) | 1998-09-30 | 2006-10-03 | Solexa Ltd. | Methods of nucleic acid amplification and sequencing |
| US20040096853A1 (en) | 2000-12-08 | 2004-05-20 | Pascal Mayer | Isothermal amplification of nucleic acids on a solid support |
| US20040002090A1 (en) | 2002-03-05 | 2004-01-01 | Pascal Mayer | Methods for detecting genome-wide sequence variations associated with a phenotype |
| US20110059865A1 (en) | 2004-01-07 | 2011-03-10 | Mark Edward Brennan Smith | Modified Molecular Arrays |
| US20080234136A1 (en) | 2005-06-15 | 2008-09-25 | Complete Genomics, Inc. | Single molecule arrays for genetic and chemical analysis |
| WO2007010251A2 (en) | 2005-07-20 | 2007-01-25 | Solexa Limited | Preparation of templates for nucleic acid sequencing |
| US20070128624A1 (en) | 2005-11-01 | 2007-06-07 | Gormley Niall A | Method of preparing libraries of template polynucleotides |
| US20080009420A1 (en) | 2006-03-17 | 2008-01-10 | Schroth Gary P | Isothermal methods for creating clonal single molecule arrays |
| US20080242560A1 (en) | 2006-11-21 | 2008-10-02 | Gunderson Kevin L | Methods for generating amplified nucleic acid arrays |
| US20090127589A1 (en) | 2006-12-14 | 2009-05-21 | Ion Torrent Systems Incorporated | Methods and apparatus for measuring analytes using large scale FET arrays |
| EP2173467B1 (de) | 2007-07-13 | 2016-05-04 | The Board Of Trustees Of The Leland Stanford Junior University | Verfahren und vorrichtung unter verwendung eines elektrischen felds für verbesserte biologische assays |
| US7595882B1 (en) | 2008-04-14 | 2009-09-29 | Geneal Electric Company | Hollow-core waveguide-based raman systems and methods |
| US9096899B2 (en) | 2010-10-27 | 2015-08-04 | Illumina, Inc. | Microdevices and biosensor cartridges for biological or chemical analysis and systems and methods for the same |
| US9937497B2 (en) | 2010-10-27 | 2018-04-10 | Illumina, Inc. | Microdevices and biosensor cartridges for biological or chemical analysis and systems and methods for the same |
| US20130079232A1 (en) | 2011-09-23 | 2013-03-28 | Illumina, Inc. | Methods and compositions for nucleic acid sequencing |
| US10167505B2 (en) | 2011-11-07 | 2019-01-01 | Illumina, Inc. | Integrated sequencing apparatuses and methods of use |
| US9193998B2 (en) | 2013-03-15 | 2015-11-24 | Illumina, Inc. | Super resolution imaging |
| US20170016060A1 (en) | 2014-03-11 | 2017-01-19 | Illumina, Inc. | Disposable, integrated microfluidic cartridge and methods of making and using same |
| US20170189904A1 (en) | 2014-05-27 | 2017-07-06 | Ilumina, Inc. | Systems and methods for biochemical analysis including a base instrument and a removable cartridge |
| US20160281150A1 (en) | 2015-03-24 | 2016-09-29 | Illumina, Inc. | Methods, carrier assemblies, and systems for imaging samples for biological or chemical analysis |
| WO2017034868A1 (en) | 2015-08-24 | 2017-03-02 | Illumina, Inc. | In-line pressure accumulator and flow-control system for biological or chemical assays |
| WO2017184997A1 (en) | 2016-04-22 | 2017-10-26 | Illumina, Inc. | Photonic stucture-based devices and compositions for use in luminescent imaging of multiple sites within a pixel, and methods of using the same |
| WO2017223041A1 (en) | 2016-06-21 | 2017-12-28 | Illumina, Inc. | Super-resolution microscopy |
Also Published As
| Publication number | Publication date |
|---|---|
| EP3969884B1 (de) | 2024-04-17 |
| EP4394778A3 (de) | 2024-08-28 |
| CA3104851A1 (en) | 2020-11-19 |
| AU2020273459A1 (en) | 2021-01-07 |
| CN112368567A (zh) | 2021-02-12 |
| EP3969884A1 (de) | 2022-03-23 |
| CN112313750B (zh) | 2023-11-17 |
| AU2020276115A1 (en) | 2021-01-07 |
| EP3970151A1 (de) | 2022-03-23 |
| EP3969884C0 (de) | 2024-04-17 |
| CN112368567B (zh) | 2024-04-16 |
| CN117935916A (zh) | 2024-04-26 |
| CN112313750A (zh) | 2021-02-02 |
| CA3104854A1 (en) | 2020-11-19 |
Similar Documents
| Publication | Publication Date | Title |
|---|---|---|
| EP3969884B1 (de) | Systeme und verfahren zur charakterisierung und erfolgsanalyse von pixel-basierter sequenzierung | |
| US12106828B2 (en) | Systems and devices for signal corrections in pixel-based sequencing | |
| US20240242779A1 (en) | Base calling using convolution | |
| JP7767672B2 (ja) | ベースコールのための等化器ベースの強度補正 | |
| US11989265B2 (en) | Intensity extraction from oligonucleotide clusters for base calling | |
| US20220301657A1 (en) | Tile location and/or cycle based weight set selection for base calling | |
| US20230041989A1 (en) | Base calling using multiple base caller models | |
| US20230026084A1 (en) | Self-learned base caller, trained using organism sequences | |
| US20240212791A1 (en) | Context-dependent base calling | |
| HK40113557A (en) | Systems and methods for characterization and performance analysis of pixel-based sequencing | |
| EP4364155B1 (de) | Selbstlernender basenrufer, trainiert anhand von oligosequenzen | |
| HK40061266B (en) | Systems and methods for characterization and performance analysis of pixel-based sequencing | |
| HK40061266A (en) | Systems and methods for characterization and performance analysis of pixel-based sequencing | |
| US20220415445A1 (en) | Self-learned base caller, trained using oligo sequences | |
| US12367263B2 (en) | Intensity extraction for feature values in base calling | |
| CA3183581A1 (en) | Tile location and/or cycle based weight set selection for base calling | |
| WO2022197752A1 (en) | Tile location and/or cycle based weight set selection for base calling |
Legal Events
| Date | Code | Title | Description |
|---|---|---|---|
| PUAI | Public reference made under article 153(3) epc to a published international application that has entered the european phase |
Free format text: ORIGINAL CODE: 0009012 |
|
| STAA | Information on the status of an ep patent application or granted ep patent |
Free format text: STATUS: THE APPLICATION HAS BEEN PUBLISHED |
|
| AC | Divisional application: reference to earlier application |
Ref document number: 3969884 Country of ref document: EP Kind code of ref document: P |
|
| AK | Designated contracting states |
Kind code of ref document: A2 Designated state(s): AL AT BE BG CH CY CZ DE DK EE ES FI FR GB GR HR HU IE IS IT LI LT LU LV MC MK MT NL NO PL PT RO RS SE SI SK SM TR |
|
| REG | Reference to a national code |
Ref country code: DE Ref legal event code: R079 Free format text: PREVIOUS MAIN CLASS: G16B0040100000 Ipc: G01N0021640000 |
|
| PUAL | Search report despatched |
Free format text: ORIGINAL CODE: 0009013 |
|
| AK | Designated contracting states |
Kind code of ref document: A3 Designated state(s): AL AT BE BG CH CY CZ DE DK EE ES FI FR GB GR HR HU IE IS IT LI LT LU LV MC MK MT NL NO PL PT RO RS SE SI SK SM TR |
|
| RIC1 | Information provided on ipc code assigned before grant |
Ipc: G06N 5/048 20230101ALN20240724BHEP Ipc: G06N 5/022 20230101ALN20240724BHEP Ipc: G06N 3/088 20230101ALN20240724BHEP Ipc: G06N 3/084 20230101ALN20240724BHEP Ipc: G06N 3/082 20230101ALN20240724BHEP Ipc: G06N 3/048 20230101ALN20240724BHEP Ipc: G06N 3/045 20230101ALN20240724BHEP Ipc: C12Q 1/6869 20180101ALN20240724BHEP Ipc: G16B 40/10 20190101ALI20240724BHEP Ipc: G16B 30/00 20190101ALI20240724BHEP Ipc: G06V 10/82 20220101ALI20240724BHEP Ipc: G06F 18/2413 20230101ALI20240724BHEP Ipc: G01N 21/64 20060101AFI20240724BHEP |
|
| REG | Reference to a national code |
Ref country code: HK Ref legal event code: DE Ref document number: 40113557 Country of ref document: HK |
|
| STAA | Information on the status of an ep patent application or granted ep patent |
Free format text: STATUS: REQUEST FOR EXAMINATION WAS MADE |
|
| 17P | Request for examination filed |
Effective date: 20250228 |
|
| STAA | Information on the status of an ep patent application or granted ep patent |
Free format text: STATUS: EXAMINATION IS IN PROGRESS |
|
| 17Q | First examination report despatched |
Effective date: 20260223 |