EP4459404A1 - Dispositif de détection d'anomalie, procédé de détection d'anomalie et programme de détection d'anomalie - Google Patents
Dispositif de détection d'anomalie, procédé de détection d'anomalie et programme de détection d'anomalie Download PDFInfo
- Publication number
- EP4459404A1 EP4459404A1 EP22915971.0A EP22915971A EP4459404A1 EP 4459404 A1 EP4459404 A1 EP 4459404A1 EP 22915971 A EP22915971 A EP 22915971A EP 4459404 A1 EP4459404 A1 EP 4459404A1
- Authority
- EP
- European Patent Office
- Prior art keywords
- abnormality
- degree
- image
- data
- image data
- Prior art date
- Legal status (The legal status is an assumption and is not a legal conclusion. Google has not performed a legal analysis and makes no representation as to the accuracy of the status listed.)
- Pending
Links
Images


Classifications
-
- G—PHYSICS
- G06—COMPUTING OR CALCULATING; COUNTING
- G06N—COMPUTING ARRANGEMENTS BASED ON SPECIFIC COMPUTATIONAL MODELS
- G06N3/00—Computing arrangements based on biological models
- G06N3/02—Neural networks
-
- G—PHYSICS
- G05—CONTROLLING; REGULATING
- G05B—CONTROL OR REGULATING SYSTEMS IN GENERAL; FUNCTIONAL ELEMENTS OF SUCH SYSTEMS; MONITORING OR TESTING ARRANGEMENTS FOR SUCH SYSTEMS OR ELEMENTS
- G05B23/00—Testing or monitoring of control systems or parts thereof
- G05B23/02—Electric testing or monitoring
- G05B23/0205—Electric testing or monitoring by means of a monitoring system capable of detecting and responding to faults
- G05B23/0218—Electric testing or monitoring by means of a monitoring system capable of detecting and responding to faults characterised by the fault detection method dealing with either existing or incipient faults
- G05B23/0224—Process history based detection method, e.g. whereby history implies the availability of large amounts of data
- G05B23/024—Quantitative history assessment, e.g. mathematical relationships between available data; Functions therefor; Principal component analysis [PCA]; Partial least square [PLS]; Statistical classifiers, e.g. Bayesian networks, linear regression or correlation analysis; Neural networks
-
- G—PHYSICS
- G06—COMPUTING OR CALCULATING; COUNTING
- G06N—COMPUTING ARRANGEMENTS BASED ON SPECIFIC COMPUTATIONAL MODELS
- G06N20/00—Machine learning
-
- G—PHYSICS
- G06—COMPUTING OR CALCULATING; COUNTING
- G06N—COMPUTING ARRANGEMENTS BASED ON SPECIFIC COMPUTATIONAL MODELS
- G06N3/00—Computing arrangements based on biological models
- G06N3/02—Neural networks
- G06N3/04—Architecture, e.g. interconnection topology
- G06N3/045—Combinations of networks
-
- G—PHYSICS
- G06—COMPUTING OR CALCULATING; COUNTING
- G06N—COMPUTING ARRANGEMENTS BASED ON SPECIFIC COMPUTATIONAL MODELS
- G06N3/00—Computing arrangements based on biological models
- G06N3/02—Neural networks
- G06N3/08—Learning methods
-
- G—PHYSICS
- G06—COMPUTING OR CALCULATING; COUNTING
- G06T—IMAGE DATA PROCESSING OR GENERATION, IN GENERAL
- G06T7/00—Image analysis
- G06T7/0002—Inspection of images, e.g. flaw detection
- G06T7/0004—Industrial image inspection
-
- G—PHYSICS
- G06—COMPUTING OR CALCULATING; COUNTING
- G06T—IMAGE DATA PROCESSING OR GENERATION, IN GENERAL
- G06T2207/00—Indexing scheme for image analysis or image enhancement
- G06T2207/20—Special algorithmic details
- G06T2207/20081—Training; Learning
-
- G—PHYSICS
- G06—COMPUTING OR CALCULATING; COUNTING
- G06T—IMAGE DATA PROCESSING OR GENERATION, IN GENERAL
- G06T2207/00—Indexing scheme for image analysis or image enhancement
- G06T2207/20—Special algorithmic details
- G06T2207/20084—Artificial neural networks [ANN]
-
- G—PHYSICS
- G06—COMPUTING OR CALCULATING; COUNTING
- G06T—IMAGE DATA PROCESSING OR GENERATION, IN GENERAL
- G06T2207/00—Indexing scheme for image analysis or image enhancement
- G06T2207/30—Subject of image; Context of image processing
- G06T2207/30108—Industrial image inspection
- G06T2207/30124—Fabrics; Textile; Paper
Definitions
- the present disclosure relates to an abnormality detection device, an abnormality detection method, and an abnormality detection program.
- Patent Document 1 proposes a technology in which weighting of an occurrence probability of a first abnormal event that occurred in the past is made greater than weighting of an occurrence probability of a second abnormal event that has not occurred to estimate a cause of a sign of an abnormality.
- Patent Document 1 JP 2018-109851 A
- the present technology aims to improve performance to identify a cause of abnormal irregularity in a production facility.
- Examples of an abnormality detection device according to the present disclosure include the following.
- An abnormality detection device including,
- the abnormality detection device described above in which the production facility is a manufacturing plant of a granular product, and the imaging device is provided in a tank of the manufacturing plant.
- the abnormality detection device described above in which the model is created by using a pseudo-abnormal image created by smoothing the image data in the normal state.
- the abnormality determination unit calculates the sensor value abnormality degree in accordance with whether a direction of divergence with respect to a predetermined reference is positive or negative.
- An abnormality detection method executed by a computer including,
- An abnormality detection program causing a computer to execute
- the contents described in Solution to Problem can be combined as much as possible without departing from the problems and technical idea of the present disclosure.
- the contents of Solution to Problem can be provided as a system including a device, such as a computer, or a plurality of devices, a method performed by the computer, or a program executed by the computer.
- a recording medium for storing the program may be provided.
- abnormal irregularity cause identifying device abnormality detection device
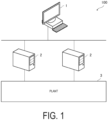
- FIG. 1 is diagram illustrating an example of a system according to the present embodiment.
- a system 100 includes an abnormal irregularity cause identifying device 1, control stations 2, and a plant 3.
- the system 100 is, for example, a Distributed Control System (DCS) and includes a plurality of the control stations 2. That is, a control system of the plant 3 is divided into a plurality of sections, and distributed control is performed by the control stations 2 for each of the control sections.
- the control station 2 is an existing facility in the DCS, receives state signals output from sensors or the like included in the plant 3, or outputs a control signal to the plant 3. Based on the control signal, actuators such as valves and other equipment included in the plant 3 are controlled.
- the abnormal irregularity cause identifying device 1 acquires a state signal (process data) of the plant 3 via the control station 2 and image data obtained from an imaging device such as Industrial Television (ITV).
- the process data includes a temperature, pressure, a flow rate, and the like of a processing target that is a raw material or a product, a set value for determining an operating condition of the equipment included in the plant 3, or the like.
- the image data corresponds to each of a plurality of frames continuously output from the imaging device, for example.
- the abnormal irregularity cause identifying device 1 may perform feature extraction processing on the image data to obtain a predetermined feature amount.
- the abnormal irregularity cause identifying device 1 creates an abnormality detection model based on a knowledge base that stores a correspondence relationship between an assumed cause and an influence appearing as an abnormality, for example.
- a model for identifying an abnormal irregularity, a sign thereof, and a cause thereof is created based on a technique, which is created based on the knowledge base, to detect a deviation from an acceptable range for change in process data.
- a feature amount obtained from the image data is used in addition to the change in the process data to perform the determination.
- the abnormal irregularity cause identifying device 1 can detect the occurrence of the abnormal irregularity or a sign thereof by using the model, the process data, and the image data.
- the abnormal irregularity cause identifying device 1 may obtain, for example, a candidate for an operating condition for suppressing the abnormal irregularity based on a table that stores causes of the abnormal irregularity and actions for handling the causes and the identified cause and may propose the candidate to the user.
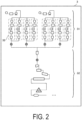
- FIG. 2 is a schematic diagram illustrating an example of a process performed by equipment included in a plant.
- a manufacturing plant for producing a resin such as cellulose acetate will be described as an example.
- the manufacturing process may include a batch stage 31 and a continuous stage 32.
- processing targets are sequentially processed on a transaction-to-transaction basis by using a predetermined transaction, and for example, processing operations such as receiving, holding, and emitting of a raw material with respect to each equipment are performed in order.
- processing operations such as receiving, holding, and emitting of a raw material with respect to each equipment are performed in order.
- the continuous stage 32 successively introduced processing targets are continuously processed, and for example, processing such as receiving, holding, and emitting of a raw material are performed in parallel.
- the process can include a plurality of sequences 33 that perform the same processing in parallel.
- FIG. 3 is a schematic diagram illustrating an example of a plant.
- the equipment for performing each processing includes, for example, a reactor, a distillation device, a heat exchanger, a compressor, a pump, a tank, and the like, and these are connected via pipes.
- sensors, valves, and the like are provided at predetermined positions of the equipment and the pipes.
- the sensor can include a thermometer, a flow meter, a pressure gauge, a level meter, a densitometer, and the like.
- the sensor monitors the operating state of each equipment and outputs a state signal.
- the sensor included in the plant 3 is attached with a "tag", which is identification information for identifying each of the sensors. That is, a type of the process data can be identified based on the tag.
- the abnormal irregularity cause identifying device 1 and the control station 2 manage input/output signals to/from each equipment, based on the tag.
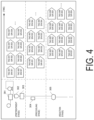
- FIG. 3 is a diagram illustrating an example of equipment included in a plant.
- the plant 3 for producing a resin includes a crusher (shredder) 301, a cyclone 302, a pretreatment device 303, a precooler 304, a reactor 305, an aging tank 306, a retention tank (RT) 307, a precipitation device (precipitator) 308, a retention box (hardening tank) 309, a solid-liquid separator 310, a washing device 311, a dehydrator 312, a dryer 313, and a product silo 314.
- the crusher 301 executes a defibering stage of disentangling the raw material into a flocculent state.
- the disentangled raw material is transferred to the pretreatment device 303 via the cyclone 302.
- the pretreatment device 303 performs a pretreatment stage.
- the precooler 304 performs a precooling stage of cooling a predetermined mixed liquid to be reacted with the raw material.
- the reactor 305 receives the raw material treated in the pretreatment stage and the mixed liquid cooled in the precooling stage.
- an acetylation stage is conducted.
- the aging tank 306 steam is introduced into a solution (dope) in which the acetylation reaction is completed to raise the temperature and perform an aging stage.
- the above-described processing corresponds to the batch stage 31 illustrated in FIG. 2 .
- processes belonging to the plurality of sequences 33 are sequentially executed by the above-described equipment.
- the subsequent processing corresponds to the continuous stage 32 in which an intermediate product is accumulated in the RT 307 and continuously processed.
- the precipitation device 308 performs a precipitation stage of extruding the dope for which aging processing is completed through a perforated plate to deposit (precipitate) the resin. In this stage, cellulose acetate is deposited, for example.
- the retention box 309 performs a hardening stage in which the precipitated resin is retained and further solidified. In the present embodiment, it is assumed that data obtained by capturing an image of the resin in the retention box 309 is acquired and used to identify the cause of an abnormal irregularity.
- the solid-liquid separator 310 performs a solid-liquid separation (acid removal) stage of separating the precipitated resin from an aqueous solution.
- the washing device 311 performs a washing stage of washing the resin containing an acid component with pure water. The acid component is removed in the washing stage.
- the dehydrator 312 performs a dehydration stage of removing the water content in the resin after the washing.
- the dehydration stage can reduce the burden on the dryer in the subsequent stage.
- the dryer 313 performs a drying stage of drying the resin after dehydration.
- the dried resin is accumulated in the product silo 314 and then shipped.
- FIG. 4 is a diagram for explaining an example of process data in the batch stage.
- the left column of FIG. 4 indicates a part of the processes of the batch stage 31 illustrated in FIG. 2 .
- the processes include the crusher 301, the cyclone 302, the pretreatment device 303, the precooler 304, and the reactor 305. Furthermore, the processes are classified into a pretreatment stage, a precooling stage, and a reaction stage.
- the right column of FIG. 4 indicates an example of process data acquired in each process.
- pieces of time-series data are acquired from sensors or imaging devices with tags 001 and 002.
- In the precooling stage pieces of time-series data are acquired from sensors with tags 003 and 004.
- a processing target associated with a product serial number (also referred to as a "S/N", “batch number”, “management number”) is intermittently processed. That is, the product serial number is identification information for identifying each of the processing targets to be collectively processed in the batch stage.
- time-series data related to a processing target having a subsequent product serial number is obtained over time.
- each of the control stations 2 manages a product serial number and a step indicating a phase of processing in each of the subdivided stages constituting the batch stage.
- the product serial number of the process data output from the control station 2 may be employed as appropriate (e.g., after a set time elapses after the step is switched in the PLC) in accordance with a communication timing between the control station 2 and the plant 3.
- the set time may be set for each production line or for each subdivided stage.
- FIG. 5 is a table showing an example of a stage line definition table set in advance.
- the stage line definition table for each sequence and each stage, a product serial number, definition of a step indicating a phase of processing in each stage, and a type of a processing target to be processed in each stage are registered.
- the stage line definition table may also be a so-called database table or may also be a file having a predetermined format such as CSV.
- the stage line definition table is also created by a user in advance and read by the abnormal irregularity cause identifying device 1.
- the stage line definition table includes attributes of a sequence, a stage, S/N, a step, and a product type.
- identification information for identifying a sequence of a process is registered.
- identification information indicating subdivided stages in the batch stage is registered.
- S/N a product serial number that is identification information for identifying each of the processing targets to be collectively processed in the batch stage is registered.
- definition of timing of each of the plurality of steps indicating a phase of processing in the stage is registered.
- the type of processing target is registered.
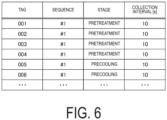
- FIG. 6 is a table showing an example of a tag definition table set in advance.
- the tag definition table defines an acquisition timing of process data or image data obtained from a sensor or an imaging device corresponding to each tag.
- the tag definition table may also be a so-called database table or may also be a file having a predetermined format such as Comma Separated Values (CSV).
- CSV Comma Separated Values
- the tag definition table is created by a user in advance and read by the abnormal irregularity cause identifying device 1.
- the tag definition table includes attributes of a tag, a sequence, a stage, and a collection interval.
- a tag that is identification information of a sensor or an imaging device is registered.
- identification information for identifying a sequence of a process is registered.
- identification information indicating subdivided stages in the batch stage is registered.
- information indicating an interval of acquiring an output value of a sensor or image data is registered.
- FIG. 7 is a diagram for explaining an example of process data in the continuous stage.
- the left column of FIG. 7 indicates a part of the processes of the continuous stage 32 illustrated in FIG. 2 .
- the process includes the RT 307 and the precipitation device 308.
- the right column of FIG. 7 indicates an example of process data acquired in each process.
- time-series data associated with the tag and not associated with the product serial number is continuously acquired from sensors or imaging devices.
- the time-series data is acquired from each of the sensors or the imaging devices with tags 102 and 103.
- the equipment continuously receives a processing target and continuously performs processing.
- FIG. 8 is a table showing an example of the traceability information.
- the traceability information includes attributes of a sampling interval and a residence time. In the field of the sampling interval, a sampling interval for stage inspection by, for example, a sample reduction method in the continuous stage is registered. In the field of the residence time, a residence time of a processing target from the completion of the batch stage until the processing target reaches a process included in the continuous stage is registered.
- FIG. 9 is a diagram for explaining correspondence between the process data or the image data in the continuous stage and a product serial number in the batch stage.
- the process data or the image data is acquired at an interval set in the traceability information, for example.
- a product by the batch stage completed in a predetermined period of time is introduced to a tank or the like as a processing target in the continuous stage.
- the process data in the continuous stage can be associated with a product serial number group whose completion time of the batch stage is included in a predetermined period of time by tracing back the residence time of the processing target from the completion of the batch stage to the measurement time by the sensor or the output of the image data by the imaging device.
- the accuracy of identifying the abnormality cause can be improved by associating the product serial number in the batch processing with the measurement timing in the continuous stage.
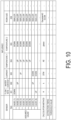
- FIG. 10 is a table showing an example of information registered in advance in a knowledge base.
- the knowledge base is assumed to be stored in advance in the storage device of the abnormal irregularity cause identifying device 1.
- the table of FIG. 10 includes a column "influence” corresponding to each of the sensors or the imaging devices (tags) and a row indicating "assumed cause” of an irregularity. That is, a direction of variation of each value is registered in columns corresponding to the sensors or the image data affected by the causes such as "cause 1" or "cause 2" indicated in each row.
- the direction of variation is displayed as “up” representing an increase (rise) or “down” representing a decrease (reduction) of an output value of a sensor. Note that, as illustrated in FIG.
- the combination of a cause and an influence is not limited to a one-to-one relationship.
- a calculation method, an extraction timing, a threshold value used for abnormality determination, and the like of the process data are defined in association with each sensor.
- information indicating a calculation performed on an output value of each sensor is registered.
- the calculation is performed using a machine learning technique such as, for example, a Hotelling method, a k-nearest neighbor algorithm, DTW Barycenter Averaging, Autoencoder, graphical lasso, and EfficientNet, an abnormality detection technique such as GaussianAD, and a texture analysis method such as Gray-Level Co-Occurrence Matrix (GLCM).
- a machine learning technique such as, for example, a Hotelling method, a k-nearest neighbor algorithm, DTW Barycenter Averaging, Autoencoder, graphical lasso, and EfficientNet
- an abnormality detection technique such as GaussianAD
- a texture analysis method such as Gray-
- a row of the extraction timing information indicating a timing of extracting a value to be used for the abnormality determination among output values of sensors is registered.
- the timing may be defined by a step indicating a phase of processing in each stage, a certain period of time, a certain time point, or the like.
- the timing may be defined by the sampling interval, or the like, as illustrated in FIG. 8 .
- a threshold value that is a reference for determining an abnormality in each abnormality determination technique is registered.
- the threshold value may include two values, that is, an upper limit and a lower limit, for example.
- the knowledge base defines a combination of causal relation between an event that becomes a cause and an influence that is an irregularity of process data resulting from the event.
- the combination of causal relation can be represented by a tree format, in which, by using an irregularity appearing as an influence as a root and an assumed cause of the irregularity as a leaf, events appearing in the course from the cause to the irregularity are connected in a hierarchical manner along time series.
- the HAZOP relates to, for example, detection means at a monitoring point by instrumentation equipment constituting a plant, a management range (upper and lower limit threshold values, which are alarm setting points), a deviation from the management range (an abnormality and an irregularity), a list of assumed causes of the deviation from the management range, a logic (detection means) to determine which of the assumed causes caused the deviation, an influence caused by the deviation, measures to be taken when the deviation has occurred, and an action for the measures, and is a technique to associate and comprehensively enumerate them.
- the knowledge base may be created based on Fault Tree Analysis (FTA), Failure Mode and Effect Analysis (FMEA), Event Tree Analysis (ETA), a technique based thereon, a technique similar thereto, contents extracted from results of hearings with operators, or contents extracted from work standards and technical standards.
- FFA Fault Tree Analysis
- FMEA Failure Mode and Effect Analysis
- ETA Event Tree Analysis
- a technique based thereon a technique similar thereto, contents extracted from results of hearings with operators, or contents extracted from work standards and technical standards.
- abnormality detection is performed based on a parameter that is assumed to have causal relation in the knowledge base.
- FIG. 11 is a diagram illustrating an example of a logic tree representing a relation between an irregularity and a cause thereof.
- the logic tree can be created based on the knowledge base shown in FIG. 10 . Furthermore, in the logic tree in FIG.
- an event that is upstream in a production stage and earlier in the time series is arranged on the left side
- an event that is downstream in the production stage and later in the time series is arranged on the right side
- the events are connected in a hierarchical manner by using an arrow from the assumed cause to the irregularity appearing as an influence.
- events are branched and connected, and events appearing in common in the course from the assumed causes to the irregularity are grouped together and displayed.
- a thick solid-line rectangle located at the upstream end of each branch corresponds to an assumed cause of the knowledge base table, to which numbers in parentheses in FIGS. 10 and 11 correspond.
- each thin solid-line rectangle corresponds to an influence of the knowledge base table and represents an event that can be observed by the process data. For each of such influences, calculation in accordance with a calculation method defined in the knowledge base table is performed. In addition, for each assumed cause, a model including a mathematical formula for performing the above-described calculation is defined, and it is possible to detect an abnormality or a sign thereof and support the cause identification by using the model.
- the above-described calculation may include, for example, the following techniques. Furthermore, the abnormal irregularity cause identifying device 1 may display these calculation results.
- an average and a standard deviation of the population are estimated from a sample average and a sample standard deviation calculated by using the process data.
- the predetermined probability density function is, for example, a normal distribution.
- the abnormality degree (sensor value abnormality degree) that can be determined from a sensor value is determined based on a distance from the average of the population to the process data to be verified. For example, the sensor value abnormality degree is determined based on the square of the Mahalanobis distance.
- an instantaneous value of the process data may be used, or the sensor value abnormality degree based on the Hotelling theory may be calculated by using a maximum value, a minimum value, an integrated value, a standard deviation, a derivative coefficient (inclination), or the like of the pieces of process data in a predetermined period of time. According to the Hotelling method, it is possible to detect an outlier from a predetermined reference.
- the pieces of time-series process data obtained, for example, from one or more sensors are vectorized or converted into a matrix to calculate a distance between data pieces.
- the distance may be a Euclidean distance or may be a Mahalanobis distance or a Manhattan distance.
- the sensor value abnormality degree is determined in accordance with the distance from the data to be verified to the k-th nearest data. In the k-nearest neighbor algorithm, the abnormality degree is determined based on the relationship with other pieces of data. Thus, for example, in a case where a normal value can be classified into a plurality of clusters, it is possible to detect an outlier far from all of the plurality of clusters.
- average time-series data can be calculated. For example, for pieces of process data having different product serial numbers in a corresponding section in batch processing operations, a distance from each of the pieces of process data to the average time-series data can be calculated.
- FIG. 12 is a graph for explaining synchronization processing of process data.
- the shortest distances between values included in different pieces of time-series data are obtained in a round-robin manner, and then alignment is performed by sliding the time-series data in a time-axis direction in such a manner that an integrated value of the shortest distances becomes smallest. That is, based on the degree of similarity of the time-series data, the plurality of pieces of time-series data are synchronized. In this way, it becomes possible to superimpose and display a plurality of pieces of process data in such a manner that steps in the stage performed in the plant 3 correspond in chronological order.
- the sensor value abnormality degree is calculated by the k-nearest neighbor algorithm or the Hotelling theory. According to the DTW Barycenter Averaging, it is possible to detect an abnormality based on the degree of similarity between pieces of the time-series data.
- the sensor value abnormality degree having a positive or negative sign may be calculated for the divergence from a reference such as an average.
- FIG. 13 is a graph for explaining an example of calculating a sensor value abnormality degree by magnitudes of distances of pieces of time-series data from a reference.
- FIG. 14 is a table for explaining an example of calculating a sensor value abnormality degree by distances of the same pieces of time-series data from a reference in consideration of positive-negative directions.
- the vertical axis represents an extent of divergence from the average.
- irregularities actually occur, but detection is difficult using only the values shown in the example in FIG. 13 .
- FIG. 14 a tendency appears in which the positive-negative directions deviate reversely, and thus, the detection of the irregularities is facilitated.
- the sensor value abnormality degree as illustrated in FIG. 14 is obtained.
- ⁇ is an average value (reference value) of training data
- x is process data to be verified.
- the sign determination equation it is possible to determine the sign representing the direction of divergence from the reference at the above time point in accordance with the magnitude relationship between the reference value of the time-series data at a predetermined time point and the process data to be verified at the corresponding time point. Furthermore, by using the value having a sign indicating the extent of divergence from the reference, the sensor value abnormality degree as illustrated in FIG. 14 can be obtained, and thus false detection can be suppressed. Further, as a characteristic point in the time-series data, in addition to the local maximum value, the local minimum value, a difference between process data at a time point and process data at another time point, or the like may be used.
- FIG. 15 is a diagram for explaining the abnormality detection by using an autoencoder.
- the abnormality determination is performed based on characteristics of the relationship of pieces of process data from a plurality of sensors.
- a neural network is used and for example, process data of continuous processing or batch processing, which is input data, is used as a teacher value to create a model which can compress (encode) and restore (decode) the input data.
- the number of nodes in an input layer and an output layer corresponds to the number of sensors, and the number of nodes in an intermediate layer is smaller than the number of sensors. Information input to the input layer is compressed in the intermediate layer and restored in the output layer.
- a plurality of intermediate layers may exist, and the connection structure between the layers is not limited to full connection.
- learning processing is performed by using the process data at the normal time as training data, and a model is created in which a parameter is adjusted to reduce a difference between a value of the input layer and a value of the output layer.
- process data to be verified is input, and the sensor value abnormality degree in accordance with the difference between the value of the input layer and the value of the output layer is calculated. That is, in a case where abnormal process data is input, information compressed in the intermediate layer cannot be appropriately restored in the output layer and the difference between values of the input layer and the output layer increases, and thus the abnormality detection can be performed based on this difference.
- an abnormality can be detected based on characteristics of the relationship between the output values of the plurality of sensors.
- dependence between variables is quantified and represented as a sparse graph serving as a reference.
- dependence between variables is obtained by using process data to be verified, and the sensor value abnormality degree in accordance with the magnitude of a difference from the above-described reference is calculated.
- the correlation between pieces of the process data can be quantified, and the sensor value abnormality degree can be detected based on a collapse of the correlation.
- the following processing may be performed by using the image data.
- EfficientNet-BO is used to perform learning, using the image data at the normal time as training data.
- FIG. 16 is a diagram for explaining EfficientNet-B0.
- EfficientNet-B0 extracts feature vectors corresponding to a plurality of levels by convolutional deep learning.
- the plurality of levels as the size of the pieces of image data gradually decreases, the dimensions called channels increase, and as illustrated in FIG. 16 , feature vectors of nine levels in which the number of dimensions ranges from 16 to 1280 are calculated.
- the feature vectors are averaged in spatial directions (width and height directions) utilizing Global Average Pooling (GAP), and the dimension is compressed only in the depth (channel) direction.
- the feature vectors of the plurality of levels may represent features of the image data ranging from a local feature to a global feature.
- the average of the feature vectors at each level is obtained and stored in the storage device as a model at normal time.
- the feature vectors are similarly obtained for image data being input, and differences M i between the feature vectors of the plurality of levels and the average of each level (model at normal time) are calculated by the Hotelling method described above.
- the sum of the differences M i from the average at each level is calculated as the abnormality degree obtained from an image (image abnormality degree or divergence degree).
- the GLCM is a value representing smoothness of texture of the image data. Based on a relationship with surrounding pixels, statistic values (GLCM features) relating to contrast, correlation, uniformity, or the like can be calculated.
- FIG. 17 is a graph showing a relationship between GLCM features and the image abnormality degree described above.
- the vertical axis represents the image abnormality degree
- the horizontal axis represents the GLCM feature.
- a region (2) indicated by a dashed line mainly data is plotted when the state of the product is abnormal and the abnormality is successfully detected.
- a region (3) indicated by a dashed line mainly data is plotted when there is no problem in the state of the product and it is determined not to be abnormal.
- a region (4) indicated by a dashed line mainly data is plotted when the state of the product is abnormal and the abnormality is not detected.
- FIG. 17 when the result of the abnormality determination based on GaussianAD is plotted based on the GLCM feature, it is possible to roughly classify on the graph whether the determination is correct or false.
- a corrected abnormality degree a new is obtained by multiplying an image abnormality degree a obtained by GaussianAD by the GLCM feature (homogeneity) b 2 .
- a new a*b 2
- pseudo-image data at abnormal time is created by using the image data of the product in the normal state, and is used as supervised data.
- the pseudo-abnormal image data is generated by smoothing the image data at normal time.
- blur of Open CV can be utilized to obtain an average of the kernel size 64, but the technique is not particularly limited, as long as the entire image can be processed by blurring processing.
- Such a pseudo-abnormal image is based on the knowledge of the operator that, when the image data is an image in the retention box 309 ( FIG.
- FIG. 18 illustrates an example of images in the retention box 309 at the normal time and the abnormal time.
- regions highlighted by a white solid line rectangle include an upper portion of the stirring blade. It can be seen that, in the normal state, the product is lifted by the upper portion of the stirring blade and is sufficiently deposited.
- the amount of the product at the upper portion of the stirring blade is relatively small. In the present technique, the size and the roughness of the deposited product can be determined, and thus, not only the resin but also a compound lifted up by the stirrer can be monitored.
- the segmentation technique a plurality of pieces of image data (frames) that are continuously output are divided into groups to be used for processing.
- the rotation period of the stirring blade is used as a basis, and one period is set as a processing unit.
- the training data is annotated by designating pixels to which the product on the stirring blade is imaged.
- an existing technique such as SEAM or Affinity Net can be utilized for selecting a region in the annotation.
- SEAM or Affinity Net can be utilized for selecting a region in the annotation.
- the maximum value of the estimated amount of the product in the above-described one period is determined, and the image abnormality degree is calculated to obtain a higher abnormality degree when the maximum value is smaller.
- the image abnormality degree is calculated based on the amount of the product, and thus, the basis of the determination is very clear, and an application of the technique to other uses can be expected.
- process data and image data actually obtained during the operation of the plant 3 may be used to search for a value by which false determination is suppressed as much as possible at the normal time and occurrence of abnormality or a sign thereof can be quickly detected at the abnormal time, and the value may be registered in the knowledge base illustrated in FIG. 10 .
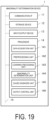
- FIG. 19 is a block diagram illustrating an example of a configuration of the abnormal irregularity cause identifying device 1.
- the abnormal irregularity cause identifying device 1 is a computer and includes a communication interface (I/F) 11, a storage device 12, an input/output device 13, and a processor 14.
- the communication I/F 11 may be, for example, a network card or a communication module and communicates with another computer based on a predetermined protocol.
- the storage device 12 may be a main storage device such as a Random Access Memory (RAM) or a Read Only Memory (ROM), and an auxiliary storage device (secondary storage device) such as a Hard-Disk Drive (HDD), a Solid State Drive (SSD), and a flash memory.
- RAM Random Access Memory
- ROM Read Only Memory
- secondary storage device such as a Hard-Disk Drive (HDD), a Solid State Drive (SSD), and a flash memory.
- HDD Hard-Disk Drive
- SSD Solid State Drive
- the main storage device temporarily stores a program to be read by the processor 14 and information transmitted to and received from other computers and secures a work area of the processor 14.
- the auxiliary storage device stores a program to be executed by the processor 14 and information and the like transmitted to and received from other computers.
- the input/output device 13 is a user interface, which is, for example, an input device such as a keyboard and a mouse, an output device such as a monitor, an input/output device such as a touch panel, or the like.
- the processor 14 is an arithmetic processing device such as a Central Processing Unit (CPU) and performs each processing according to the present embodiment by executing the program. In an example of FIG. 19 , functional blocks are illustrated in the processor 14.
- the processor 14 executes a predetermined program to function as a data acquisition unit 141, a preprocessing unit 142, a learning processing unit 143, an abnormality determination unit 144, a cause diagnosis unit 145, and an output control unit 146.
- the data acquisition unit 141 acquires process data from a sensor included in the plant 3 via, for example, the communication I/F 11 and the control station 2, acquires image data from the imaging device, and stores the process data and the image data in the storage device 12. As described above, the process data and the image data are associated with the sensor and the imaging device by a tag.
- the preprocessing unit 142 processes the process data and the image data. For example, the preprocessing unit 142 associates the process data and the image data with the product serial number. That is, based on the above-described traceability information held in the storage device 12 in advance, the process data and the image data corresponding to a predetermined tag, a system, and a product serial number in the batch processing is associated with process data and image data that corresponds to a predetermined tag and is output at a predetermined timing in the continuous processing. Furthermore, data for a predetermined period of time used in the abnormality determination is extracted based on a set value of a table such as the knowledge base, and a feature amount in accordance with each technique is calculated.
- the preprocessing unit 142 may perform data cleansing to exclude data in an unsteady operation period, data at the time of abnormality occurrence, an outlier such as noise, and the like, thereby extracting training data. Furthermore, the preprocessing unit 142 may calculate a predetermined feature amount from the image data or may perform predetermined image processing such as smoothing of the image data.
- the learning processing unit 143 creates an abnormality detection model including one or more calculation operations based on the knowledge base, for example, and causes the storage device 12 to store the abnormality detection model. At this time, the learning processing unit 143 determines a parameter based on learning about characteristics of the training data including process data or image data. Note that in a case where the learning processing is performed by using output values of a plurality of sensors, normalization may be performed as appropriate.
- the abnormality determination unit 144 may calculate the sensor value abnormality degree by using the process data and the abnormality detection model, and may calculate the image abnormality degree by using the image data and the abnormality detection model. That is, the abnormality determination unit 144 calculates the abnormality degree (that is, the sensor value abnormality degree or the image abnormality degree) by using test data for performing cross validation and the abnormality detection model in the learning processing. Furthermore, in the abnormality determination processing, the abnormality degree is calculated by using the process data or the image data acquired from the plant 3.
- the cause diagnosis unit 145 calculates the degree of satisfaction (accuracy) for each of the plurality of assumed causes by using the calculated abnormality degree.
- the degree of satisfaction is calculated by using the abnormality degree calculated by the abnormality determination unit, and is calculated based on a proportion of influence appearing in the process data or the image data and an extent thereof, among influences associated with each of the assumed causes in the knowledge base.
- an action representing a handling to be taken for a cause may be stored in association with each of the assumed causes in the storage device 12, and thus the action can be presented to a user.
- the output control unit 146 issues an alarm and outputs a degree of satisfaction for each of the assumed causes in a case where an abnormality is detected, for example, via the input/output device 13.
- the above components are connected via a bus 15 as appropriate in accordance with an operation by the user.
- the one device illustrated in FIG. 19 includes the data acquisition unit 141, the preprocessing unit 142, the learning processing unit 143, the abnormality determination unit 144, the cause diagnosis unit 145, and the output control unit 146, but at least a part of the functions may be distributed to a different device.
- FIG. 20 is a processing flow chart illustrating an example of learning processing performed by the abnormal irregularity cause identifying device 1.
- the processor 14 of the abnormal irregularity cause identifying device 1 executes a predetermined program to execute the processing as illustrated in FIG. 20 .
- the learning processing is executed at any timing by using the process data or the image data obtained from past operations of the plant 3.
- the learning processing includes mainly preprocessing (S1 in FIG. 20 ), model construction processing (S2), and verification processing (S3). That is, some of the pieces of process data or image data may be used as training data and the other pieces may be used as test data to perform cross validation. Note that the table and the like described above are created by a user and are stored in advance in the storage device 12.
- the preprocessing, the learning processing, and the verification processing are described in one processing flow illustrated in FIG. 20 , but at least a part such as the preprocessing or the verification processing may be distributed and executed in a different device.
- the data acquisition unit 141 of the abnormal irregularity cause identifying device 1 acquires the pieces of process data or image data (S11 in FIG. 20 ).
- data used in the abnormality detection model is extracted, among the pieces of process data illustrated in FIGS. 4 and 7 , for example, among the image data output by the imaging device provided in the retention box 309.
- the process data is assumed to be stored in the storage device 12 as OPC data, a so-called database table, or a file having a predetermined format such as CSV.
- the pieces of image data are continuously acquired at a frame rate of 30 fps, for example. Each piece of the image data corresponds to one of the frames and is general raster data.
- the process data may include attributes such as date and time and a tag, and, in particular, the process data in batch processing may further include attributes such as S/N and a step. It is assumed that image data is also associated with information such as date and time and a tag.
- the preprocessing unit 142 of the abnormal irregularity cause identifying device 1 associates each of the process data or image data in the continuous processing with a product serial number (S12 in FIG. 20 ).
- the process data or the image data acquired in the continuous stage is associated with a product serial number group of the process data or the image data acquired in the batch processing, and thus, the process data or the image data used in calculating the abnormality degree is associated. That is, in the knowledge base illustrated in FIG. 10 and the logic tree illustrated in FIG. 12 , in a case where a cause affects both the process data or the image data in the batch processing and the process data or the image data in the continuous processing, the abnormality degree and the degree of satisfaction are calculated based on the data associated in the present step.
- the preprocessing unit 142 extracts and processes data to be used in the abnormality determination model (S13 in FIG. 20 ).
- the preprocessing unit 142 extracts data in a predetermined period of time to be used in the abnormality determination based on a set value of a table such as the knowledge base and calculates a feature amount in accordance with each technique.
- the preprocessing unit 142 extracts the process data in a predetermined timing or time period, calculates an instantaneous value forming the process data, a maximum value, a minimum value, an integrated value, or a difference of the process data, an integrated value of a reaction rate, a derivative at a predetermined time point, and the like, and stores the calculated values in the storage device 12. Furthermore, in a case where the abnormality degree is calculated by the k-nearest neighbor algorithm, the time-series process data is vectorized or converted into a matrix.
- synchronization processing is performed on a plurality of pieces of process data to obtain average time-series data.
- synchronization processing is performed on a plurality of pieces of process data.
- predetermined image processing may be performed or a feature vector may be calculated.
- the preprocessing unit 142 may perform predetermined data cleansing for the process data.
- the data cleansing processing is processing for excluding an outlier, and various techniques can be employed. For example, latest data may be used to calculate a moving average value. Furthermore, a difference between the moving average value and a measured value is taken, and a standard deviation ⁇ representing a variation in the difference is obtained. Then, a value that does not fall within a predetermined confidence interval, such as an interval from the mean of the probability distribution - 3 ⁇ to the mean of the probability distribution + 3 ⁇ (also referred to as a 3 ⁇ interval), may be excluded. Likewise, a value that does not fall within the 3 ⁇ interval may be excluded for the difference between measured values before and after.
- a predetermined confidence interval such as an interval from the mean of the probability distribution - 3 ⁇ to the mean of the probability distribution + 3 ⁇ (also referred to as a 3 ⁇ interval)
- a value that does not fall within the 3 ⁇ interval may be excluded for the difference between measured values before and after.
- the learning processing unit 143 of the abnormal irregularity cause identifying device 1 performs abnormality detection model construction processing (S2 in FIG. 20 ).
- an abnormality detection model including calculation of an abnormality degree is created. Specifically, for each of one or more "influences" associated with a corresponding one of the "assumed causes” in FIG. 10 , the abnormality degree is calculated by the technique registered in a corresponding one of the “calculation methods” to create the abnormality detection model represented by the combination of abnormality degrees.
- the learning processing unit 143 adjusts parameters of the model by using the training data depending on the type of abnormality detection technique.
- the sensor value abnormality degree is calculated by the autoencoder
- a weight factor between layers is adjusted in such a manner that the information of the input process data can be restored after compression.
- the sensor value abnormality degree is calculated by the graphical lasso
- the dependence between variables is quantified based on the covariance matrix of the pieces of process data from a plurality of sensors.
- the image abnormality degree is calculated based only on the image data.
- the cause of the abnormal irregularity can be determined by using a combination of the calculated image abnormality degree and another abnormality degree. Then, the learning processing unit 143 stores the created abnormality detection model in the storage device 12.
- the abnormality determination unit 144 of the abnormal irregularity cause identifying device 1 calculates the abnormality degree by using the created abnormality detection model and the test data (S31 in FIG. 20 ). In the present step, the abnormality determination unit 144 calculates the abnormality degree in accordance with the techniques of calculating the abnormality degree. For example, in a case where the abnormality degree is calculated by the Hotelling method, the sample average and the sample standard deviation of the population are estimated by using the process data, and the abnormality degree is obtained based on the distance from the average of the population to the process data to be verified.
- the abnormality degree is calculated by the k-nearest neighbor algorithm
- distances between pieces of the data are calculated, and the abnormality degree in accordance with the distance between the data to be verified and the k-th nearest data from the data to be verified is calculated.
- the abnormality degree is calculated by the DTW Barycenter Averaging
- the abnormality degree is obtained by the k-nearest neighbor algorithm or the Hotelling theory based on the integrated value of distances between pieces of the time-series data synchronized in the preprocessing.
- the process data to be verified is input to the autoencoder, and the abnormality degree in accordance with the difference between a value of the input layer and a value of the output layer is obtained.
- the process data to be verified is used to obtain dependence between variables, and the abnormality degree in accordance with a magnitude of the difference between the obtained dependence and dependence serving as a reference is obtained.
- the image abnormality degree is calculated, for example, the above-described technique is used to calculate the image abnormality degree by using the feature amount of the captured image data and a model obtained by learning a tendency of the feature amount of the image data of the product in the normal state.
- the cause diagnosis unit 145 of the abnormal irregularity cause identifying device 1 obtains the degree of satisfaction of the assumed cause by using the calculated abnormality degree (S32 in FIG. 20 ).
- the degree of satisfaction is calculated based on a proportion in which irregularity associated as an influence appears. For example, three influences, that is, an increase of the flow rate of a tag 001, a decrease of a temperature 2 of a tag 005, and a resin size of a tag 009 that is smaller than a predetermined reference, are associated with a cause (1) of FIG. 10 .
- the sensor value abnormality degree is calculated as a value in accordance with the positive or negative direction.
- a model for calculating the image abnormality degree in a case where the size of the resin is larger than the reference may also be created to detect the abnormality in both the positive and negative directions.
- a proportion of influences whose abnormality degree exceeds a threshold value among the three influences may be used as the degree of satisfaction in S32 of FIG. 20 .
- the degree of satisfaction can be 66.7%.
- weighting may be further performed depending on the type of influence (tag) or based on the magnitude of the abnormality degree. For example, as the degree of satisfaction, each influence may be multiplied by a weight and then the sum of the multiplication results may be obtained.
- the output control unit 146 outputs the abnormality degree calculated in S31 and the degree of satisfaction calculated in S32 for the user to evaluate the created model (S33 in FIG. 20 ).
- the cross validation is performed using test data that is different from the training data used for construction of the model, among the pieces of process data collected from past operations of the plant 3.
- the process data at the time when an abnormality occurred in the past is also used to verify whether an abnormality is appropriately detected and an alarm or an action to handle the abnormality is output.
- the learning processing unit 143 determines whether an abnormality can be detected with sufficient accuracy (S4 in FIG. 20 ).
- the threshold value registered in the knowledge base (in other words, a normal range of the process data) is modified in such a manner that the abnormality can be detected appropriately, and the processing after S31 is repeated.
- S4: YES an operation is performed that uses the abnormality detection model created in S2 and the threshold value. Note that at least a part of determination in S4 may be made by a user.
- FIG. 21 is a table showing an example of an action table.
- the table in FIG. 21 includes attributes of a cause, an action 1, and an action 2.
- a cause corresponding to the assumed cause in the knowledge base is registered.
- information indicating a procedure to be undertaken by the operator of the plant 3 to eliminate a corresponding cause is registered.
- FIG. 22 is a processing flow chart illustrating an example of the abnormality detection processing performed by the abnormal irregularity cause identifying device 1.
- the processor 14 of the abnormal irregularity cause identifying device 1 executes a predetermined program to perform the processing illustrated in FIG. 22 .
- the abnormality detection processing is substantially performed in real time by using process data or image data obtained during operation of the plant 3.
- the abnormality detection processing mainly includes preprocessing (S10 in FIG. 22 ), model reading processing (S20), and abnormality determination processing (S30).
- S10 in FIG. 22 preprocessing
- S20 model reading processing
- S30 abnormality determination processing
- FIG. 22 the same reference signs are given to the stages corresponding to the learning processing illustrated in FIG. 20 , and a difference from the learning processing is mainly described below.
- the device for performing the abnormality detection processing may be different from the device for performing the learning processing.
- the abnormality detection model created in the learning processing, the threshold value, and the table such as the knowledge base are assumed to be stored in the storage device 12 in advance.
- the data acquisition unit 141 of the abnormal irregularity cause identifying device 1 acquires the process data or the image data (S11 in FIG. 22 ).
- the process data is assumed to be stored in the storage device 12 as OPC data, a so-called database table, or a file having a predetermined format such as CSV.
- the image data is, for example, raster data output at a frame rate of 30 fps.
- the present step is substantially similar to S11 in FIG. 20 , but pieces of data regarding the processes during operation in the plant 3 are acquired.
- the preprocessing unit 142 of the abnormal irregularity cause identifying device 1 associates each of the pieces of process data in the continuous processing with a corresponding one of product serial numbers (S12 in FIG. 22 ).
- the present step is similar to S12 in FIG. 20 .
- the preprocessing unit 142 extracts and processes data to be used in the abnormality determination model (S13 in FIG. 22 ).
- the present step is substantially similar to S13 in FIG. 20 , but there is no need to perform data cleansing.
- the abnormality determination unit 144 of the abnormal irregularity cause identifying device 1 reads the abnormality detection model created in the learning processing from the storage device 12 (S20 in FIG. 22 ). Furthermore, the abnormality determination unit 144 uses the created abnormality detection model and the process data and image data obtained from the operation of the plant 3 to calculate the abnormality degree (S31 in FIG. 22 ). The present step is similar to S31 in FIG. 20 . Furthermore, the cause diagnosis unit 145 of the abnormal irregularity cause identifying device 1 uses the calculated abnormality degree to obtain the degree of satisfaction of the assumed cause (S32 in FIG. 22 ). The present step is similar to S32 in FIG. 20 .
- the output control unit 146 outputs the abnormality degrees calculated in S31 and the degree of satisfaction calculated in S32 and issues an alarm when any of the abnormality degrees exceeds a predetermined threshold value (S303 in FIG. 22 ).
- a predetermined threshold value S303 in FIG. 22 .
- FIG. 23 is a diagram illustrating an example of a screen output to the input/output device 13.
- FIG. 23 is an example of a main management diagram, in which transition of individual process data is shown in a line graph.
- a region 131 displayed at the input/output device 13 displays a plurality of combinations of identification information of the process data acquired from the plant 3 and the latest value.
- the management diagram of a region 132 shows the transition of values for specific process data in a line graph. Note that the vertical axis represents the value of the process data, and the horizontal axis represents the time axis. Furthermore, in the example of FIG. 23 , a solid line represents a true value, and the dashed line represents an estimated value.
- the true value may be the process data for which the abnormality degree is to be calculated
- the estimated value may be a value estimated by regression analysis of the process data for which the abnormality degree is to be calculated.
- the thin dashed lines represent an upper limit and a lower limit of the normal range (in other words, threshold values in the abnormality detection). Note that, as illustrated by balloons in FIG. 23 , in a case where a user operates the input/output device 13 such as a pointing device to move a pointer onto the graph, a numerical value of the process data at the time point indicated by the pointer may be displayed.
- a cause of irregularity of the process data displayed in the region 132 or a tag that can identify the cause is displayed on the horizontal axis, and the vertical axis represents the degree of satisfaction of the cause in a bar graph. It can be seen that, if the degree of satisfaction is higher, a cause of irregularity of the process data has higher probability.
- the cause diagnosis unit 145 calculates the degree of satisfaction based on the abnormality degree calculated by the abnormality determination unit 144 for an event serving as the assumed cause of irregularity of the process data. The user can recognize a candidate of the cause of the irregularity and an accuracy thereof based on the magnitude of the degree of satisfaction and can easily identify the cause of irregularity.
- the abnormality determination unit 144 calculates the abnormality degree at a specified time or the current time, and the factor effect diagram is displayed by the output control unit 146. Then, in a case where the user operates the input/output device 13 such as a pointing device and selects any one of the bar graphs in the factor effect diagram, the cause of irregularity corresponding to the bar graph is highlighted in the logic tree.
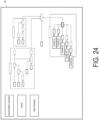
- FIG. 24 is a diagram illustrating another example of the screen output to the input/output device 13 by the output control unit 146.
- FIG. 24 is an example of a tree diagram, and a logic tree as illustrated in FIG. 11 is displayed.
- a bar graph of the tag 004 is selected in FIG. 23 .
- an influence corresponding to the process data having the tag 004 is highlighted in the logic tree.
- the highlighted display is obtained by changing the display mode, for example, changing the color, the line type, or the like.
- a corresponding rectangle is hatched.
- the thick-line rectangles connected to the upstream side of the logic tree represent assumed causes of an influence. Each cause may be displayed as illustrated by balloons in FIG.
- each cause calculated in S32 of FIG. 22 may be further displayed, and an action may be further displayed.
- the cause may be displayed when a user moves a pointer onto each rectangle.
- a process trend of each tag listed in the factor effect diagram may be displayed.
- a process trend of a tag that can identify the cause of the irregularity may be displayed.
- values per periods of time for example, per predetermined hours, per predetermined days, per predetermined months, or per season, are calculated by using the pieces of process data stored in the storage device 12 and are plotted on the graph.
- the output control unit 146 may output a log of the abnormality degree at a timing when the abnormality degree calculated by each calculation method exceeds a predetermined threshold value, for example. Furthermore, the log of the assumed cause or the degree of satisfaction may be output. Each log can facilitate analysis of abnormal irregularity by associating and outputting a date and time, the product serial number, the calculation method, the abnormality detection model, and the like.
- the above-described degree of satisfaction may be determined using only one or more image abnormality degrees.
- the accuracy of the abnormality determination can be improved by combining the image abnormality degree and the sensor value abnormality degree as in the above-described embodiment.
- an abnormal irregularity in the amount of the product in the retention box can be detected at an early stage, it is possible to present an operating condition for obtaining an optimum bulk density.
- the size of the resin can be adjusted by the flow rate of the acid being used, to suppress clogging of the apparatus and deterioration of the product quality.
- the product produced by the plant may also be a low-molecular compound.
- the abnormality degree of a granular compound can be obtained.
- the above-described embodiment has been described by using a chemical plant as an example. However, the embodiment can be applied to a manufacturing process in a general production facility. For example, instead of the product serial number of the batch stage in the embodiment, a lot number can be used as a transaction, and the processing according to the batch stage in the embodiment may be applied.
- the image abnormality degree may be applied not only to the analysis of the amount or size of a product, but also to the analysis of a cell shape or a fiber structure, the analysis of wrinkles or sagging, the detection of cracks in metal or concrete, the analysis of a crystal shape, the detection of a contaminant, and the like.
- At least some of the functions of the abnormal irregularity cause identifying device 1 may be implemented by being distributed in a plurality of devices, or the same function may be provided by a plurality of devices in parallel. Furthermore, at least some of the functions of the abnormal irregularity cause identifying device 1 may be provided on a so-called cloud.
- the present disclosure includes a method and a computer program for performing the aforementioned processing, and a computer readable recording medium storing the program.
- the recording medium on which the program is stored enables the aforementioned processing by causing a computer to execute the program.
- the computer readable recording medium refers to a recording medium that can accumulate information such as data or programs by electrical, magnetic, optical, mechanical, or chemical actions and can be read from a computer.
- examples of recording media detachable from a computer include flexible disks, magneto-optical disks, optical disks, magnetic tapes, memory cards, and the like.
- recording media fixed to a computer there are HDD, Solid State Drive (SSD), ROM, and the like.
Landscapes
- Engineering & Computer Science (AREA)
- Physics & Mathematics (AREA)
- Theoretical Computer Science (AREA)
- General Physics & Mathematics (AREA)
- Mathematical Physics (AREA)
- Software Systems (AREA)
- Artificial Intelligence (AREA)
- Evolutionary Computation (AREA)
- Computing Systems (AREA)
- Data Mining & Analysis (AREA)
- General Engineering & Computer Science (AREA)
- Biomedical Technology (AREA)
- Biophysics (AREA)
- Computational Linguistics (AREA)
- Life Sciences & Earth Sciences (AREA)
- General Health & Medical Sciences (AREA)
- Molecular Biology (AREA)
- Health & Medical Sciences (AREA)
- Automation & Control Theory (AREA)
- Computer Vision & Pattern Recognition (AREA)
- Quality & Reliability (AREA)
- Medical Informatics (AREA)
- Testing And Monitoring For Control Systems (AREA)
- Image Analysis (AREA)
Applications Claiming Priority (2)
| Application Number | Priority Date | Filing Date | Title |
|---|---|---|---|
| JP2021212492 | 2021-12-27 | ||
| PCT/JP2022/047718 WO2023127748A1 (fr) | 2021-12-27 | 2022-12-23 | Dispositif de détection d'anomalie, procédé de détection d'anomalie et programme de détection d'anomalie |
Publications (2)
| Publication Number | Publication Date |
|---|---|
| EP4459404A1 true EP4459404A1 (fr) | 2024-11-06 |
| EP4459404A4 EP4459404A4 (fr) | 2025-11-19 |
Family
ID=86999138
Family Applications (1)
| Application Number | Title | Priority Date | Filing Date |
|---|---|---|---|
| EP22915971.0A Pending EP4459404A4 (fr) | 2021-12-27 | 2022-12-23 | Dispositif de détection d'anomalie, procédé de détection d'anomalie et programme de détection d'anomalie |
Country Status (4)
| Country | Link |
|---|---|
| EP (1) | EP4459404A4 (fr) |
| JP (1) | JPWO2023127748A1 (fr) |
| CN (1) | CN118435140A (fr) |
| WO (1) | WO2023127748A1 (fr) |
Families Citing this family (7)
| Publication number | Priority date | Publication date | Assignee | Title |
|---|---|---|---|---|
| CN116954171A (zh) * | 2023-07-31 | 2023-10-27 | 格创东智(武汉)科技有限公司 | 制程异常处理方法、装置、制程控制系统及存储介质 |
| CN121941994A (zh) * | 2023-10-12 | 2026-04-28 | 日本Tmt机械株式会社 | 推定程序、信息处理装置以及推定方法 |
| CN117576100B (zh) * | 2024-01-16 | 2024-03-22 | 浙江合丰科技有限公司 | 一种fpc连接器表面缺陷分级检测评价方法 |
| TW202544948A (zh) * | 2024-03-08 | 2025-11-16 | 日商東京威力科創股份有限公司 | 電腦程式、學習模型之產生方法、資訊處理方法及資訊處理裝置 |
| CN119420767B (zh) * | 2024-12-30 | 2025-04-29 | 武汉车凌智联科技有限公司 | 一种基于互联网多场景应用的跨维度交互系统 |
| CN120598434B (zh) * | 2025-08-06 | 2025-10-17 | 宝鸡市聚鑫源新材料股份有限公司 | 基于工业视觉的钛棒生产质检方法及系统 |
| CN120635835B (zh) * | 2025-08-18 | 2025-10-17 | 陕西雅泰乳业有限公司 | 一种奶粉搅拌加工用实时监测方法及系统 |
Family Cites Families (7)
| Publication number | Priority date | Publication date | Assignee | Title |
|---|---|---|---|---|
| CN103257366B (zh) * | 2012-02-17 | 2016-03-30 | 中国石油化工股份有限公司 | 一种检测搅拌床反应器内结块的方法 |
| JP2013191185A (ja) * | 2012-03-15 | 2013-09-26 | Mitsubishi Electric Corp | 異変検知装置 |
| JP6842299B2 (ja) | 2016-12-28 | 2021-03-17 | 三菱パワー株式会社 | 診断装置、診断方法及びプログラム |
| US11204594B2 (en) * | 2018-12-13 | 2021-12-21 | Fisher-Rosemount Systems, Inc. | Systems, methods, and apparatus to augment process control with virtual assistant |
| JP7020392B2 (ja) * | 2018-12-25 | 2022-02-16 | 東芝三菱電機産業システム株式会社 | データ収集再生システム |
| JP7604486B2 (ja) * | 2020-05-29 | 2024-12-23 | 株式会社ダイセル | 異常変調原因特定装置、異常変調原因特定方法及び異常変調原因特定プログラム |
| WO2021241576A1 (fr) * | 2020-05-29 | 2021-12-02 | 株式会社ダイセル | Dispositif, procédé et programme d'identification de cause de modulation anormale |
-
2022
- 2022-12-23 WO PCT/JP2022/047718 patent/WO2023127748A1/fr not_active Ceased
- 2022-12-23 EP EP22915971.0A patent/EP4459404A4/fr active Pending
- 2022-12-23 CN CN202280085861.7A patent/CN118435140A/zh active Pending
- 2022-12-23 JP JP2023570980A patent/JPWO2023127748A1/ja active Pending
Also Published As
| Publication number | Publication date |
|---|---|
| JPWO2023127748A1 (fr) | 2023-07-06 |
| WO2023127748A1 (fr) | 2023-07-06 |
| EP4459404A4 (fr) | 2025-11-19 |
| CN118435140A (zh) | 2024-08-02 |
Similar Documents
| Publication | Publication Date | Title |
|---|---|---|
| EP4459404A1 (fr) | Dispositif de détection d'anomalie, procédé de détection d'anomalie et programme de détection d'anomalie | |
| US12591233B2 (en) | Abnormal irregularity cause identifying device, abnormal irregularity cause identifying method, and abnormal irregularity cause identifying program | |
| CN115698881B (zh) | 异常调制原因确定装置、异常调制原因确定方法以及异常调制原因确定程序 | |
| US10977568B2 (en) | Information processing apparatus, diagnosis method, and program | |
| Wang et al. | Surface defects detection using non-convex total variation regularized RPCA with kernelization | |
| CN104471542B (zh) | 用于状态监视中流动的传感器数据的分类的判别隐卡尔曼滤波器 | |
| Zhang et al. | A novel feature-extraction-based process monitoring method for multimode processes with common features and its applications to a rolling process | |
| Lai et al. | Accelerated multiple alarm flood sequence alignment for abnormality pattern mining | |
| CN113988325A (zh) | 一种电力系统故障预警方法、装置、终端设备及存储介质 | |
| CN113657454A (zh) | 基于自回归BiGRU的核电旋转机械状态监测方法 | |
| EP4160341A1 (fr) | Dispositif, procédé et programme d'identification de cause de modulation anormale | |
| CN115698879B (zh) | 异常调制原因确定装置、异常调制原因确定方法以及异常调制原因确定程序 | |
| CN114879612A (zh) | 一种基于Local-DBKSSA的高炉炼铁过程监测方法 | |
| CN118013443A (zh) | 基于生成模型算法的在线实时真空干泵异常检测方法 | |
| EP4160338A1 (fr) | Dispositif d'affichage de cause de modulation anormale, procédé d'affichage de cause de modulation anormale et programme d'affichage de cause de modulation anormale | |
| JP6405603B2 (ja) | 情報処理装置、情報処理システム及びプログラム | |
| CN116304936A (zh) | 基于分数阶差分时序数据单点异常检测方法、装置及设备 | |
| CN121434931A (zh) | 基于scf-svm的高炉炼铁过程故障诊断方法及应用 | |
| CN116894965A (zh) | 教师数据收集方法以及收集装置 | |
| JP2023084761A (ja) | 分析システム、分析方法、及びプログラム |
Legal Events
| Date | Code | Title | Description |
|---|---|---|---|
| STAA | Information on the status of an ep patent application or granted ep patent |
Free format text: STATUS: THE INTERNATIONAL PUBLICATION HAS BEEN MADE |
|
| PUAI | Public reference made under article 153(3) epc to a published international application that has entered the european phase |
Free format text: ORIGINAL CODE: 0009012 |
|
| STAA | Information on the status of an ep patent application or granted ep patent |
Free format text: STATUS: REQUEST FOR EXAMINATION WAS MADE |
|
| 17P | Request for examination filed |
Effective date: 20240703 |
|
| AK | Designated contracting states |
Kind code of ref document: A1 Designated state(s): AL AT BE BG CH CY CZ DE DK EE ES FI FR GB GR HR HU IE IS IT LI LT LU LV MC ME MK MT NL NO PL PT RO RS SE SI SK SM TR |
|
| DAV | Request for validation of the european patent (deleted) | ||
| DAX | Request for extension of the european patent (deleted) | ||
| A4 | Supplementary search report drawn up and despatched |
Effective date: 20251017 |
|
| RIC1 | Information provided on ipc code assigned before grant |
Ipc: G05B 23/02 20060101AFI20251013BHEP Ipc: G01M 99/00 20110101ALI20251013BHEP Ipc: G06N 20/00 20190101ALI20251013BHEP Ipc: G06N 3/02 20060101ALI20251013BHEP Ipc: G06T 7/00 20170101ALI20251013BHEP |