EP4464256A1 - Dispositif et procédé d'élastographie - Google Patents
Dispositif et procédé d'élastographie Download PDFInfo
- Publication number
- EP4464256A1 EP4464256A1 EP23173298.3A EP23173298A EP4464256A1 EP 4464256 A1 EP4464256 A1 EP 4464256A1 EP 23173298 A EP23173298 A EP 23173298A EP 4464256 A1 EP4464256 A1 EP 4464256A1
- Authority
- EP
- European Patent Office
- Prior art keywords
- measurements
- signal
- subject
- mechanical property
- measurement
- Prior art date
- Legal status (The legal status is an assumption and is not a legal conclusion. Google has not performed a legal analysis and makes no representation as to the accuracy of the status listed.)
- Pending
Links
Images



Classifications
-
- A—HUMAN NECESSITIES
- A61—MEDICAL OR VETERINARY SCIENCE; HYGIENE
- A61B—DIAGNOSIS; SURGERY; IDENTIFICATION
- A61B8/00—Diagnosis using ultrasonic, sonic or infrasonic waves
- A61B8/48—Diagnostic techniques
- A61B8/485—Diagnostic techniques involving measuring strain or elastic properties
-
- A—HUMAN NECESSITIES
- A61—MEDICAL OR VETERINARY SCIENCE; HYGIENE
- A61B—DIAGNOSIS; SURGERY; IDENTIFICATION
- A61B8/00—Diagnosis using ultrasonic, sonic or infrasonic waves
- A61B8/52—Devices using data or image processing specially adapted for diagnosis using ultrasonic, sonic or infrasonic waves
- A61B8/5215—Devices using data or image processing specially adapted for diagnosis using ultrasonic, sonic or infrasonic waves involving processing of medical diagnostic data
- A61B8/5223—Devices using data or image processing specially adapted for diagnosis using ultrasonic, sonic or infrasonic waves involving processing of medical diagnostic data for extracting a diagnostic or physiological parameter from medical diagnostic data
-
- A—HUMAN NECESSITIES
- A61—MEDICAL OR VETERINARY SCIENCE; HYGIENE
- A61B—DIAGNOSIS; SURGERY; IDENTIFICATION
- A61B8/00—Diagnosis using ultrasonic, sonic or infrasonic waves
- A61B8/54—Control of the diagnostic device
- A61B8/543—Control of the diagnostic device involving acquisition triggered by a physiological signal
Definitions
- the present invention relates to the field of elastography, for example liver elastography. More specifically, the invention relates to an elastography device and an elastography method to accurately determine a measurement of the liver stiffness of a subject.
- LS liver stiffness
- LSM liver stiffness measurement
- imaging devices which derive the LSM from an image of stiffness using for example Shear Wave Elastography, SWE, (as detailed for example in " Influence of Probe Pressure on Ultrasound-Based Shear Wave Elastography of the Liver Using Comb-Push 2-D Technology", Byenfeldt, Marie et al. Ultrasound in Medicine and Biology, Volume 45, Issue 2, 411 - 428 ) and devices which derive an average LSM using for example Vibration-Controlled Transient Elastography (hereinafter referred to as VCTE), such as the FibroScan ® system.
- SWE Shear Wave Elastography
- VCTE Vibration-Controlled Transient Elastography
- an operator places the tip of a probe, that has a rather small diameter (typically comprised between 5 and 10 mm), in contact with the subject's body, in front of the expected area of a subject's liver.
- the operator then presses a button to make the probe's tip deliver to the subject a transient, low frequency mechanical pulse (the spectrum of this pulse is centered on a frequency comprised typically between 10 and 500 hertz).
- This pulse generates elastic waves that travel in the subject's body.
- the mechanical pulse delivered by the probe's tip generates both a shear wave and of a compression wave.
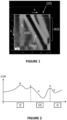
- the elastic waves mentioned above combine a shear wave and a compression wave. These two waves have very different propagation speeds and, thanks to the transient nature of the mechanical excitation, they can be easily separated in time and identified in the elastic wave propagation image.
- this figure shows an elastic wave propagation image 105.
- the compression wave is identified by the reference sign 105C
- the much slower shear wave is identified by the reference sign 105S.
- a region of interest which is bound by two dashed lines at 25 mm and 65 mm, which corresponds to the depth under the patient skin where liver is typically located.
- This elastic wave propagation image can thus be used to precisely determine the propagation speed of shear waves in the tissue to be characterized, from which the stiffness of this tissue can be derived. These stiffness results are then provided to the operator.
- the elastography device may comprise:
- the elastography device may be a VCTE device.
- the probe may further comprise a low frequency vibrator arranged to move the protruding part of the probe, and the delivery of the transient, low frequency mechanical pulse may comprise:
- transient pulse it is meant a mechanical vibration that is temporary.
- the duration of the pulse that is the active time, during which there is a substantial motion of the protruding part (induced by the vibrator in the case of a VCTE device) is followed by a downtime during which there is no or substantially no motion of the protruding part.
- substantially no motion it is meant for instance that, during this downtime, the displacement of the protruding part that may be induced by the vibrator remains smaller than 1/10 or even 1/20 of the peak displacement of protruding part.
- an actuation ratio equal to the pulse's active time, divided by the sum of this active time and the following down time, is typically below 50%, or even below 20%.
- the downtime is the duration between the end of the active time and a subsequent significant motion of the protruding part (corresponding for instance to a subsequent transient, mechanical pulse), should there be any.
- low frequency pulse it is meant that the central frequency of the pulse is below 500 Hz, or even below 250 Hz.
- the central frequency of the pulse is, for instance, the average or the median frequency of the spectrum of the displacement or of the speed of displacement corresponding to that pulse, or the peak frequency of a main peak of this spectrum, or the mean of the -3 dB or -6 dB cutoff frequencies of the spectrum.
- a peak-to-peak amplitude of a displacement of the protruding part of the probe induced by the low frequency vibrator may be between 0.2 and 10 mm, for example between 0.5 and 2 mm.
- the region of the body may be a part of a liver of the subject, and a central frequency of the mechanical pulses induced in the region of the body may be between 10 Hz and 500 Hz.
- aspects of the invention are not limited to the characterization of the liver and may be extended to other parts of the body, for example the brain.
- the cardiac signal may be an electrocardiogram (ECG) signal, a photoplethysmography (PPG) signal, a cardiac signal obtained by ultrasound Doppler or a signal related to a blood pressure of the subject.
- ECG electrocardiogram
- PPG photoplethysmography
- the blood pressure of the subject may be for example a Central Venous Pressure, an intracardiac pressure or a pulmonary pressure.
- the cardiac signal may be any signal representative of the cardiac activity of the subject, and may be obtained by any system such as an ECG system, a pulse oximeter, a Doppler system or a pressure measurement system.
- the detection of an event related to the cardiac signal may correspond to a detection that the cardiac signal reaches a predefined threshold.
- the cardiac signals present a succession of upward and/or downward peaks
- the event may correspond to a peak of the curve, detected when the signal reaches a predefined threshold.
- the detection of the event may correspond to a detection that a rising edge and/or a falling edge reaches a predefined threshold.
- the electronic unit may be further configured to determine the predefined threshold from a portion of the cardiac signal.
- the determination of the threshold may comprise:
- the electronic unit is configured to detect a plurality of peaks in a portion of the cardiac signal, to determine for example an average height of the peaks, and to define the predefined threshold based on the average height of the peaks.
- the threshold may be set to 90% of the average height of the peaks.
- the electronic unit may be further adapted to determine, from the plurality of measurements, a feature relating to the mechanical property.
- the feature may be a function of a maximum, a minimum, a mean, a standard deviation and/or a percentile of the measurements. More generally, the feature may be derived from any statistical parameter or combination of statistical parameters of the measurements.
- At most one respective measurement is determined.
- a respective measurement may be determined (in other words, there is exactly one measurement determined each time an event is detected).
- the respective measurement of the mechanical property cannot be determined, for example because one or more conditions are not satisfied (for example, the probe is not well positioned or is not pressed sufficiently against the subject's body).
- each measurement of the plurality of measurements may be determined at a respective measurement time, which depends on a time at which a corresponding event related to the cardiac signal is detected.
- the respective measurement time may correspond to a time at which the corresponding event related to the cardiac signal is detected delayed by a predefined temporal offset, the predefined temporal offset being identical for all measurements.
- each measurement is performed at a fixed time following the detection of the corresponding event. This makes it possible to determine measurements at the same moment in the cardiac cycle, over several cardiac cycles. The variability between the measurements is therefore reduced and the evaluation of a feature relating to the mechanical property is more accurate.
- the predefined temporal offset ⁇ t may be equal to zero or may be strictly positive.
- the predefined temporal offset may be set by the operator to determine the measurements at a specific moment of the cardiac cycle (for example, at a peak or in the middle of the cardiac cycle, etc.).
- the respective measurement time may correspond to a time at which a corresponding event related to the cardiac signal is detected delayed by a temporal offset which varies over time.
- a temporal offset makes it possible to recover an estimate of the signal representative of the mechanical property, without the need to make measurements at a high rate (i.e. several measurements per second).
- the measurements may be a time series of measurements E 1 , ... , E n , n being a positive integer
- the temporal offset may be an increasing function of time.
- the electronic unit may be further adapted to determine, based on a portion of the cardiac signal, an estimate of an average duration t cc of a cardiac cycle of the subject.
- the fixed predefined value ⁇ may be function of the determined estimate of the average duration t cc of the cardiac cycle of the subject, for example a portion of the average duration t cc of the cardiac cycle of the subject.
- the fixed predefined value ⁇ is less than t cc /4.
- the electronic unit may be configured to:
- the plurality of measurements may comprise at least one series of measurements, and each series of measurements may be determined upon detection of one respective event related to the cardiac signal.
- the measurements of each series of measurements may be determined between two consecutive detections of events related to the cardiac signal, and each series of measurements may comprise at least 2 measurements.
- At least two measurements are performed per cardiac cycle.
- each series of measurements may comprise at least 4 measurements, which makes it possible to observe the variations of the mechanical property over time, and more specifically during the cardiac cycle.
- a signal E(t) representative of the variations of the mechanical property over time may be obtained from the plurality of measurements, the signal being constructed from these measurements. This obtained signal E(t) takes into account the variations of the mechanical property over time, even during very short time intervals (of the order of a second). It is then possible to extract from this signal a feature (in particular a point feature) relating to the mechanical property, and this feature is generally more accurate than that obtained by conventional elastography techniques. For example, the median of the signal E(t) provides more accurate information than the median of 10 measurements taken at random and reflects more faithfully the real mechanical behavior of the part of the body considered.
- the electronic unit may be further configured to determine a repetition rate of the series of measurements from a portion of the cardiac signal, the determination comprising:
- reaction rate it is meant a number of measurements performed per second.
- the determination of the estimate of the average duration of the cardiac cycle of the subject may comprise:
- the electronic unit may for instance comprise two processors:
- This architecture accelerates notably the processing of the echo signals, in particular because the (pre)processing achieved by the first processor reduces substantially (typically by a factor of 10, or even more) the quantity of data to be transmitted to the general-purpose processor, thus reducing the corresponding transmission time. And, in practice, this transmission time is often the most time limiting step of the overall processing of the echo signals.
- the displacement of the probe's tip or head is desirably compensated before correlating the echo signals with each other, and the usual techniques to compensate for this displacement (based on strong echo detection, and Fourier-domain compensation) are very challenging.
- the ultrasound pulses emission and/or reception times may for instance be pre-compensated (upon emission and/or reception), depending on the probe's tip or head displacement.
- the electronic unit may be further configured to generate, for one or more of the ultrasound pulses emitted:
- the electronic unit may be further adapted to obtain a breath holding indicator indicating whether the subject is holding his breath or not.
- a breath holding indicator indicating whether the subject is holding his breath or not.
- the stiffness signal is very noisy.
- the variations of the signal E(t) are more visible, in particular the variations linked to the cardiac cycle.
- the signals obtained are therefore not necessarily analyzed and used in the same way depending on whether they are obtained while the subject is breathing or holding his breath.
- the breath holding indicator may be determined by the electronic unit by emitting successive ultrasound signals, receiving respective echo signals in response to the emission of the ultrasound signals, and computing a correlation coefficient between successive echo signals among the received echo signals received, and comparing the computed correlation coefficient to a predefined threshold.
- the predefined threshold may be set to any value greater than 0.5, depending on the desired precision of the indicator.
- the predefined value may be set to 0.8 or to a higher value, for example 0.9, 0.95 or 0.99.
- the ultrasound signals emitted to determine the breath holding indicator may be different ultrasound signals than those of the sequences of ultrasound pulses used to track how the low frequency elastic waves induced by the mechanical pulses propagate through the region of the body of the subject.
- the measurements may be determined only when the breath holding indicator indicates that subject is holding his breath.
- the electronic unit may be further adapted to determine, from the measurements of the mechanical property, information relating to a blood pressure of the subject. For example, information relating to a central venous pressure of the subject may be determined from the measurements.
- the obtained signal presents periodic or pseudo-periodic variations linked to the variations of the Central Venous Pressure (CVP), which can be analyzed to determine an information relating to the CVP of the subject.
- CVP Central Venous Pressure
- the mechanical property may be a liver stiffness and the information relating to the blood pressure of the subject may be a value representative of a central venous pressure of the subject.
- the value representative of the blood pressure of the subject is an "equivalent blood pressure value" determined based on a value of the mechanical property.
- the equivalent blood pressure value may be determined by a formula provided in Taniguchi et al., Am. J. Cardiol., 2014, 113(3): p. 552-8 .
- the electronic unit may be further adapted to emit, based on the determined information, an alert related to a possible cardiovascular pathology of the subject.
- Such alert may be emitted, for example, when a value representative of the blood pressure of the subject is under or below a threshold (i.e. past a threshold).
- the electronic unit may be further configured to obtain, from the plurality of measurements, a signal representative of variations of the mechanical property with time, the elastography device being configured to control a display device to jointly display a curve representative of at least a portion of the obtained signal representative of variations of the mechanical property with time and a curve representative of at least a portion of the cardiac signal.
- a synchronization between the two signals may be performed to compensate the delay between an event and a respective measurement, the delay being due to acquisition and processing time to determine the measurement for example.
- Another aspect of the invention relates to a method, implemented by an elastography device, comprising:
- liver pathologies can have repercussions on the spleen.
- liver cirrhosis leads to portal hypertension, which corresponds to a significant increase in pressure in the portal vein, and which results in an increase in the Spleen Stiffness Measurement (SSM).
- SSM Spleen Stiffness Measurement
- LSM Liver Stiffness Measurement
- the curve representing variations of the Central Venous Pressure (CVP) of a subject which is a measure of pressure in the vena cava of the subject, during a cardiac cycle is a waveform containing five components: three peaks (a, c, v) and two descents (x, y), each component corresponding to a specific moment or instant of the cardiac cycle.
- CVP waveform An example of such CVP waveform is represented in Figure 2 .
- “D” means “Diastole” and "VS” means “Ventricular Systole”.
- a peak called "a-wave” corresponds to an increase in pressure due to atrial contraction.
- a second peak called “c-wave” and representing early ventricular systole is observed, and corresponds to an increase in pressure due to tricuspid valve elevation into the right atrium.
- c-wave a significant descent in the CVP waveform
- the x-descent corresponds to a drop in atrial pressure during ventricular systole induced by atrial relaxation.
- v-wave a new peak in atrial pressure
- the inventors of the present invention have devised that it is possible to observe variations of LSM due to the cardiac cycle and in particular to observe the components of the CVP waveform directly in the LSM.
- Taniguchi et al. merely establishes that there is a correlation between “static” measurements of RAP and “static” measurements of LSM.
- static it is meant that each measurement is obtained at a respective specific time or is derived from measurements obtained at respective different times (for example, Taniguchi et al. mentions that "up to 10 successful measurements were performed” for LSM determination, and that "[p]ressure measurements were determined at the end-expiratory period, with an average of 3 to 5 cycles obtained”).
- Such static measurements therefore correspond to characteristic values (for example, isolated values or average values) of the RAP and LSM signals but does not reflect the variations of these signals over time, in particular during the cardiac cycle.
- Taniguchi et al. is completely silent on variations of RAP and LSM signals over the cardiac cycle.
- Taniguchi et al. measured pressures directly in the atrium using a catheter. The finding that LSM could vary as a function of time was not at all anticipated or suggested in the study.
- the inventors have determined the behavior of LSM during several cardiac cycles, from a plurality of measurements taken per cardiac cycle. Knowing that a cardiac cycle typically has a duration of the order of a second, the inventors therefore carried out, on the same subject, several LSM measurements per second and obtained a representation of the variation of the LSM over several heart cycles.
- Figure 3 depicts an experimental curve of variation of LSM (expressed in kPa) of a subject as a function of time t (expressed in seconds).
- LSM values of the subject were measured 10 times per second (i.e. at a repetition rate of 10 Hz, meaning 10 LSM per second) during 15 seconds.
- the subject was asked to hold his breath.
- pattern CC has a duration of approximately 1 second and has the same general shape as the CVP represented in Figure 2 . More specifically, pattern CC presents three peaks and two descents, which correspond to the a-, c- and v-waves and the x- and y-descents of the CVP.
- the subject's heart rate was monitored, while measuring the LSM values of the subject.
- Such monitoring may be performed by using, for example (the list below is not limiting):
- the inventors discovered that it was possible to recover the CVP signal (or at least certain characteristics of the CVP signal) in the LSM signal.
- the LSM signal is very noisy and precautions should be taken to observe the variations of the CVP in the LSM signal (before the subject holds his breath, the characteristic variations of the CVP signal are drowned in noise and are not found in the LSM signal).
- the device for acquiring the LSM may be adapted to be able to process the signals at the desired repetition frequency (several measurements per second).
- LSM is not constant over time even when the patient is stable and is holding his breath. Indeed, even when the patient is stable and is holding his breath, the variations in the LSM can reach up to 3 kPa.
- Three kPa is a significant variation considering that a patient is considered low-risk when LSM ⁇ 8 kPa, intermediate risk when 8 kPa ⁇ LSM ⁇ 12 kPa and high-risk when LSM ⁇ 12 kPa (see European Association for the Study of the Liver. EASL Clinical Practice Guidelines on non-invasive tests for evaluation of liver disease severity and prognosis - 2021 update. J Hepatol, vol. 75, n° 3, p. 659-689 ).
- a 3 kPa can easily and significantly distort the LSM results and diagnosis, and indicate a significant change in the patient risk stratification.
- the patient may be asked to perform additional examinations which are not in fact necessary.
- the patient could be referred for a confirmatory test such as a liver biopsy which is invasive and painful.
- a confirmatory test such as a liver biopsy which is invasive and painful.
- CVP Central Venous Pressure
- ECG Electrocardiogram
- the top curve represents an example of a CVP signal measured on a subject
- the bottom curve represents an example of an ECG signal measured on the same subject during a same time interval.
- the curves of Figure 4 typically represent typical CVP and ECG curves, for example CVP and ECG curves of a healthy subject with no cardiac pathology (for example, it is known that presence of infarction may distort the Q wave).
- an ECG curve typically comprises three main components, as represented in Figure 4 : the P wave, which represents the depolarization of the atria, the QRS complex, which comprises three waves Q, R and S, and represents the depolarization of the ventricles, and the T wave, which represents the repolarization of the ventricles.
- an upward peak of the R wave of the ECG approximatively coincides with the beginning of a c-wave of the CVP signal (i.e. with the dip between the a-wave and the c-wave).
- CVP and ECG signals are (at least approximatively) synchronized.
- an elastography device configured for receiving an ECG signal (or any signal related to cardiac activity, obtained by any other means than ECG, such as an optical system, an ultrasound system or a pressure measurement system as mentioned above) and for determining measurements of a mechanical property of a region of the body (for example, liver stiffness) of a subject based on the received ECG signal.
- An example of such a device is represented in Figure 5 .
- Figure 5 represents an example of an elastography device according to one or several embodiments of the invention.
- VCTE Vibration-Controlled-Transient-Elastography
- the present invention can apply to other elastography techniques, including elastography techniques in which shear wave can be generated by other means.
- the invention is compatible with shear wave generation using acoustic radiation force.
- Acoustic radiation force is a technique in which the shear wave is generated using long burst (several tens of microseconds) of ultrasound signals. It does not require the use of a vibrator located in the probe.
- the elastography device 1 represented in Figure 5 is configured to obtain an ECG signal of the subject, it is noted that the invention can apply to any other signal relating to the cardiac activity of the subject (obtained by any means, as mentioned above).
- the mechanical property may be, in an embodiment, a tissue stiffness and the region of the body may be a region of the liver, but the invention is not limited to this embodiment.
- an aspect of the present invention can be applied to determining the spleen stiffness or the brain stiffness.
- the brain is a large and soft tissue.
- the blood flows through the brain, in this case into the superior (and not inferior like in the case of the liver) cava vein before entering the heart. Therefore, it is very likely that the brain stiffness be a surrogate of central venous pressure and right atrium pressure.
- the elastography device 1 of Figure 5 comprises a probe 2 including a probe casing 3 (which forms the main body of the probe), to be handheld, and a protruding part, which protrudes from the casing 3.
- the protruding part can be applied against the body 8 of the subject, to deliver mechanical pulses to it, and to transmit and acquire ultrasound (U/S) shots.
- the protruding part is a tip 4, for instance a cylindrical tip (with a circular transducer 6 at its end).
- the protruding part could be an ultrasound head (located at an end of the probe) including an array, for instance a linear array of U/S transducers.
- the proposed technique can be used with a single element ultrasound transducer (like in the case of Figure 5 , which can be of various shapes: rectangular or ellipsoidal or circular for example), or with a multi-element ultrasound transducer (like an array of U/S transducers, for example a linear or convex or phased array ultrasound probe).
- a multi element ultrasound transducer can also display a B-mode image allowing an easier localization of the to-be-measured tissue.
- at least one of the beamformed ultrasound lines is used to track how the mechanical pulses propagate. To this end, using the center beamformed ultrasound line (which is aligned with the probe axis) is beneficial, for symmetry considerations.
- the probe 2 comprises also a low frequency vibrator 5, and the U/S (ultrasound) transducer 6, which is fixed at an end of a tip 4.
- the U/S transducer 6 plays both the role of an ultrasound emitter and the role of an ultrasound receiver (alternatively).
- the probe may comprise an U/S emitter and an U/S receiver distinct from each other.
- the U/S transducer 6 is arranged on the axis z of the vibrator. Still, in other embodiments, the U/S transducer could be located elsewhere on the probe, not necessarily on the vibrator's axis.
- the tip 4 is actuated by the low frequency vibrator 5.
- the vibrator 5 is arranged to move the tip 4 relative to the probe casing 3.
- the vibrator 5 is arranged to move a shaft 4', the end of which forms the tip 4 of the probe.
- the tip, or, more generally, the protruding part of the probe could be bound to the probe casing with no motion with respect to the probe casing, the vibrator being then arranged to move a mass, inside the casing, to make the whole probe moving towards the tissue and back (by virtue of a recoil effect).
- the vibrator 5 is a low frequency vibrator in that it moves the tip with a central, average frequency smaller than 500 hertz, or even smaller than 100 hertz (in contrast with ultrasound shots or echo signals, whose central frequency is typically higher than 1 megahertz, for instance between 1 and 5 megahertz).
- the vibrator is a low-frequency electro-mechanical actuator, for instance with one or several coils and magnets, like a loud-speaker actuator.
- the vibrator 5 is rotationally symmetrical around a vibrator axis, which coincide with the probe axis z.
- the vibrator 5 When the vibrator 5 vibrates, it induces displacements that are mainly longitudinal, parallel to its axis.
- the shaft 4' is centered onto the axis z, and the vibrator 5 is arranged to move this shaft along the axis z.
- the displacement of the ultrasound transducer 6, induced by the vibrator 5 has a peak-to-peak amplitude between 0.2 mm and 10 mm, and, in an embodiment, between 0.5 and 2 mm.
- the probe 2 comprises a displacement sensor 11, arranged to output a measurement signal Sd representative of the displacement of the ultrasound transducer 6.
- the measurement signal Sd is representative of the displacement of the ultrasound transducer 6 relative to the probe casing 3.
- a part of the displacement sensor 11 is fixed on the shaft mentioned above while another part of the sensor is fitted in the probe, with no motion with respect to the casing 3.
- the displacement sensor 11 may be a Hall-effect sensor, an induction displacement sensor, or any other suitable sensor.
- the device 1 may further comprise a plurality of electrodes 12a, 12b, 12c to be placed on different parts of the body of the subject to record the heart's electrical activity and obtain an electrocardiogram of the subject.
- the device 1 comprises 3 electrodes 12a, 12b, 12c for illustration purpose only, and the number of electrodes may be different from 3. For example, the number of electrodes may be equal to 2 or may be greater than 3.
- the number of electrodes 12a, 12b, 12c may be equal to 10, including 6 electrodes to be placed on the subject's thoracic cavity to obtain precordial leads and 4 electrodes to be placed on the four limbs (arms and legs) of the subject to obtain the peripheral leads.
- electrodes 12a, 12b, 12c may not be part of the device 1, but may be connected to the device 1, for example via one or several wires, so that the device 1 may receive signal(s) related to the cardiac activity of the heart.
- the device 1 may, for example, receive the electrical signals detected by the electrodes and process these signals to obtain the ECG signal of the subject, or, alternatively, directly receive the ECG signal of the subject.
- the device 1 comprises also an electronic unit 10, which may be connected to the vibrator 5, to the U/S transducer 6 and to the electrodes 12a, 12b, 12c.
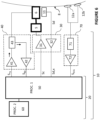
- a block diagram of an embodiment of the electronic unit 10 is represented in Figure 6 .
- the electronic unit 10 includes several electronic components and/or electronic circuitries to carry out its functions.
- the electronic unit 10 of Figure 6 comprises a control and processing module 20, an ultrasound front end 40, a motion controller 30 to control the vibrator 5 and an ECG receiver 70 to receive and process data obtained from electrodes (for the sake of simplicity, only two electrodes 12a, 12b are represented in Figure 6 , but the number of electrodes may be greater than 2).
- the electronic unit 10 may be a computer connected to the vibrator 5, to the U/S transducer 6 and to the electrodes 12a, 12b.
- the ultrasound front end 40, the motion controller 30 and the ECG receiver 70 are all connected to the control and processing module 20 (that is to say, they can receive instructions or control signals from the control and processing module 20 or send data or measurement signals to it).
- the electronic unit 10 also comprises a signal conditioning module 32, to condition and digitalize the measurement signal Sd outputted by the displacement sensor 11. This signal conditioning module 32 is part of the motion controller 30.
- the motion controller 30 comprises also an amplifier 31, to drive the vibrator 5.
- the amplifier 31 is configured to convert a control signal Sc into a form suitable to drive the vibrator, from an electrical point of view.
- the amplifier 31 may thus be a current amplifier or a power amplifier (such as the LM3886 power amplifier by Texas Instrument, for instance), for instance.
- the ultrasound front end 40 comprises an ultrasound (U/S) pulser 41, an U/S receiver module 42 and a switch 43 for alternatively transmitting and receiving ultrasonic signals.
- the U/S pulser 41 comprises an electric circuit configured to generate an electric ultrasonic signal appropriate to drive the U/S transducer 6, based on a transmission control signal S TX outputted by the control and processing module 20.
- the U/S receiver module 42 comprises an electric circuit configured to acquire an electric ultrasonic signal (an echo signal), previously received by the U/S transducer 6 (and transmitted to the U/S receiver module 42 via the switch 43), and to transmit the corresponding (digitalized) U/S reception signal S R,X to the control and processing module 20.
- the electric circuit of the ultrasonic receiver module 42 may comprise a voltage amplifier, one or more filters and an analog to digital converter (ADC), for instance an 8 to 16 bits ADC with a 10 to 100 Mega-sample per second rate.
- ADC analog to digital converter
- the ECG receiver 70 may comprise a heart rate monitoring module 71 configured to acquire and process cardiac data from the electrodes 12a, 12b.
- the heart rate monitoring module 71 may include an electric circuit configured to receive cardiac data from electrodes 12a, 12b and to extract an electric biopotential signal from the cardiac data, a biopotential amplifier for amplifying the electric biopotential signal, and a circuit for filtering the amplified electric biopotential signal (for example, to remove noise from amplified signal).
- the heart rate monitoring module 71 may be a heart rate monitor front end, such as an AD8232 type component.
- the amplified and filtered electric biopotential signal outputted by the heart rate monitoring module 71 is typically an analog signal.
- the ECG receiver 70 may also comprise an ECG receiving module 72 including an ADC to convert the electric biopotential signal outputted by the heart rate monitoring module 71 into an ECG digital signal S ECG .
- the ECG receiving module 72 may also be configured to transmit the digitalized ECG signal S ECG to the control and processing module 20.
- the ECG receiver 70 is a module of the electronic unit 10. However, in alternative embodiments, the ECG receiver 70 may be external to the device 1.
- the control and processing module 20 is a device or system comprising electric circuitry for processing data, such as a microprocessor coupled to a non-volatile non-transitory memory comprising machine executable instructions and/or a programmable microcircuit like an FPGA or another programmable circuit.
- the control and processing module 20 may also comprise one or several RAM memories or registers.
- the control and processing module 20 comprises at least one two processors 50, 60 and at least one memory.
- the memory may be coded with machine readable instructions for carrying out function(s) of the electronic unit 10.
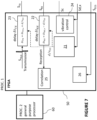
- control and processing module 20 which are adapted to implement a technique of pre-compensation of the transducer's displacement, are represented in more details in Figure 7 .
- the pre-compensation is typically performed in a programmable microcircuit, such as an FPGA, so that the pre-compensation is performed on-the-fly.
- electronic unit or circuit 10 can be housed in the probe 2 while other elements of electronic unit 10 (such as general-purpose processor 60) may be remote.
- the entire electronic unit 10 could be housed in probe 2, or, on the contrary, it could be entirely located outside the probe.
- the electronic circuit includes various electronic components to carry out its functions.
- probe 2 is operatively connected to a central unit 7, which has the structure of a computer (and that could be a laptop, a smartphone, or a dedicated electronic device arranged to control and to interface the probe, and to process the signals acquired).
- the central unit comprises at least a memory and a processor.
- the at least one memory is coded with machine readable instructions for carrying out function(s) of the central unit 7 when executed by the processor.
- the central unit 7 comprises also a user interface, such as a touch screen.
- the central unit 7 may also comprise a display for displaying one or more pieces of information, such as, for example, one or several elastograms, the curve representing variations of the ECG signal of the subject with time, one or more features related to the mechanical property, or other pieces of information.
- the central unit 7 and display can be adapted to display additional pieces of information.
- the probe may be connected to the central unit 7 by a connection cable 9, or by a wireless link.
- the electrodes 12a, 12b, 12c may be connected to the central unit 7 by a connection cable 13 or by a wireless link.
- some elements of electronic unit 10 are part of central unit 7.
- Electronic unit 10 (more specifically, its control and processing module 20, here) is configured (for instance, programmed via instruction stored in a memory) to control electronic device 1 so that it operates to perform (or "determine") a plurality of measurements of the mechanical property of the region 80 of the body.
- at least one measurement of the plurality of measurements is determined based on an event related to the ECG signal. Therefore, electronic unit 10 (more specifically, its control and processing module 20, here) is further configured to detect such an event based on the received ECG signal S ECG .
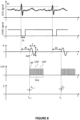
- the event may correspond to a specific feature in the ECG signal, such as an upward peak in the ECG curve (which corresponds to the top of the R wave), as represented in Figure 8 (top graph).
- the event may correspond to a downward peak in the ECG curve.
- At least one corresponding measurement of the mechanical property is determined when an event related to the ECG signal is detected, as detailed hereinafter.
- control and processing module 20 may be adapted to emit a synchronization signal as shown in Figure 8 (first two graphs).
- the synchronization signal may be a signal with downward peaks - or "windows" (as in the example shown on the "SYNC signal” graph in Figure 8 ) or upward peaks.
- the peaks can be synchronization pulses in the form of rectangular signals, of a predefined duration ⁇ t (for example of the order of a few ⁇ s or a few ms).
- One peak corresponds to one respective detection of an event (for example, when a rising edge or a falling edge of the ECG signal reaches a predetermined threshold value). For example, each time a rising edge of the ECG signal reaches the predetermined threshold value Th, a corresponding peak in the synchronization signal may be emitted.
- at least one measurement of the mechanical property is determined upon detecting a peak in the synchronization signal.
- the measurement is determined automatically upon detection of the corresponding peak in the synchronization signal (or, equivalently, upon detection of the corresponding predefined event in the ECG signal).
- automated it is meant that the determination of the measurement is not triggered by an operator (for example, it is not the operator who actuates a button to take the measurement).
- the operator can activate a measurement mode of the device 1 by a manual trigger.
- activate a measurement mode it is meant that, in response to the manual trigger of the operator, the device 1 becomes ready to take measurements of the mechanical property.
- the determination of the measurement can be performed automatically when a peak in the synchronization signal is detected. It will therefore be appreciated that the determination of the measurement based on the detection of the peak in the synchronization signal is still automatic (even if the activation of the measurement mode can be manual).
- the manual activation of the measurement mode may be achieved, for example, by actuating a push-button switch arranged on the probe casing 3, or else by actuating a foot-switch.
- the operator activates the measurement mode.
- a plurality of measurements of the mechanical property of the probed region, related to low frequency elastic wave propagation (for instance its Young modulus) can then be determined. At least one measurement among the plurality of measurement is determined based on an event related to the ECG signal - for example upon detection of a peak in the synchronization signal detailed above.
- the one or more conditions on the basis of which the operator activates the measurement mode may include, for example, a condition related to the fact that the position and direction of the probe 2 is adequate (as detailed for instance in the not-yet published US patent application US17/695,053 assigned to the applicant) and/or a condition related to the fact that tip 4 is applied against body 8 of the subject (for example, based on contact force level measured by a force sensor - like a strain gauge - or deduced from the position of shaft 4' pushed into the casing when the tip is pressed on the subject's body) and/or a condition related to the fact that the subject is holding his breath (as detailed later in the description).
- a condition related to the fact that the position and direction of the probe 2 is adequate as detailed for instance in the not-yet published US patent application US17/695,053 assigned to the applicant
- a condition related to the fact that tip 4 is applied against body 8 of the subject for example, based on contact force level measured by a force sensor
- device 1 may automatically enter the measurement mode, for example when all required conditions are satisfied.
- electronic unit 10 may be configured to determine whether the position and direction of probe 2 are adequate and/or whether tip 4 is applied against body 8 of the subject and/or whether the subject is holding his breath. If one or more of these conditions are satisfied, electronic unit 10 may enter the measurement mode (and determine one measurement when the event related to the ECG signal is detected, for example when the ECG signal reaches a predetermined threshold).
- the determination, by electronic unit 10, of whether the one or more conditions are satisfied may be performed in response to a manual triggering by the operator, carried out for instance via the touch screen of the central unit 7.
- the electronic unit 10 may be configured to control low frequency vibrator 5 to deliver to body 8 of the subject a plurality of pulses MP (referred to as "mechanical pulses"), each pulse MP being a transient, low frequency mechanical pulse.
- Each mechanical pulse MP corresponds to a transient displacement d of the shaft 4' along the axis z directed towards the subject's body (see Figure 5 ).
- At least one of the mechanical pulses MP is delivered based on an event related to the ECG signal of the subject, for example upon detection of a peak in the ECG signal (or, equivalently, in the synchronization signal obtained based on the ECG signal).
- Control module 20 may be configured (for instance, programmed via machine executable instructions stored in a memory) to control motion controller 30 in order to displace shaft 4'.
- shaft 4' displacement d may be controlled according to a predetermined command signal.
- the displacement d may be controlled by a control-loop comprising amplifier 31, displacement sensor 11, signal conditioning module 32, and a vibration control module 24 (as represented in Figure 7 ), such as a PID (proportional, integral, derivative) corrector (still, in alternative embodiments, the vibrator may be controlled by an open loop - that is with no sensor feedback).
- the displacement d of shaft 4' induced by the vibrator is a transient displacement corresponding, for example, to one period of a sinusoid having a duration T between 5 ms and 50 ms.
- the displacement d of shaft 4', induced by vibrator 5, has a peak-to-peak amplitude A between 0.2 mm and 10 mm, and in an embodiment between 0.5 and 2 mm.
- the central frequency of each mechanical pulse MP may be between 10 Hz and 500 Hz, for example between 50 Hz and 200 Hz when the elastography device is configured to characterize the liver of patients (typically 50 Hz in this case).
- the electronic unit 10 controls U/S (ultrasound) transducer 6 (with the U/S pulser 41 of the U/S front end 40, among others) so that U/S transducer 6 emits a sequence Seq of ultrasound pulses USP, and acquires echo signals received in response by U/S transducer 6, to track how the mechanical pulse MP propagates through the probed region 80 of the body 8 of the subject, located in front of tip 4 of the probe.
- each ultrasound pulse USP is comprised for instance between 0.5 and 10 megahertz.
- the ultrasound pulses of the sequence Seq may be transmitted one at a time, two successive pulses being separated by a pulse repetition period RP, this pulse repetition period being typically between 0.1 millisecond and 2 milliseconds (which corresponds to a pulse repetition frequency between 0.5 kilohertz and 10 kilohertz), and in an embodiment between 0.3 ms and 1 ms.
- the ultrasound pulses USP of the sequence Seq mentioned above may also be transmitted by groups, for instance by groups of two pulses (to compute correlations between the two corresponding echo signals).
- the two pulses of each group may be separated by duration between 50 and 200 microseconds, while the groups of pulses themselves are separated by a longer duration, for example higher than 0.2 or 0.5 ms. It will be appreciated that other transmission sequences can also be considered in various embodiments.
- the total duration of the sequence of U/S pulses Seq may be between 25 ms and 200 ms. This duration may be selected depending on the shear wave frequency and depending on the speed of propagation of the elastic wave which is the slower and depending on the depth of the region to be observed and the nature of the organ being assessed.
- the sequence may have a duration of 100 ms.
- the echo signals which are acquired to track the propagation of the mechanical pulse considered, are each formed by a signal, received over time t by the U/S transducer 6 after emission of one of the U/S pulses USP. It is more precisely the signal received within a given temporal window starting after this emission and having a given duration.
- U/S sequences may be emitted independently from the U/S sequences Seq and inserted in the chronogram for other applications and uses.
- other U/S sequences may be emitted for determining a breath holding indicator to indicate that the subject is holding his breath.
- tissue strain data representative of tissue strain within the region 80, as a function of time t and as a function of depth z within the region 80.
- the tissue strain data may be called elastogram or shear wave propagation map.
- the tissue strain data is determined from the echo signals acquired to track how the mechanical pulse MP propagates through the region 80.
- tissue strain data forms an elastogram, from which a measurement E k of the mechanical property (e.g. the tissue stiffness) may be determined (as represented in bottom graph of Figure 8 ).
- the tissue strain data is determined from the echo signals using a correlation technique or another patterning matching algorithm to determine how portions of the tissue move under the influence of the elastic wave that is passing through it (the elastic wave being generated by the periodic mechanical vibration delivered by the system). For example, for each couple of two successively received echo signals, the two echo signals are divided into smaller signal windows which correspond to different depths. The signal windows are correlated with each other, by the correlation module 25 (see Figure 7 ), which makes it possible to determine tissue displacement (namely, the tissue displacement that occurred between the two U/S pulses), as a function of depth, and at given time.
- respective tissue strain data may be obtained and a respective measurement (E k-1 , E k in the bottom graph of Figure 8 ) of the mechanical property of the region 80 may be determined.
- Each determined measurement E n may be associated with a respective time t n which represents the instant at which the measurement is performed.
- each measurement E n is associated with a respective time t n equal to the time at which the corresponding mechanical pulse MP has been emitted. This is not limiting, and other embodiments are possible.
- each measurement E n may be associated with a respective time t n equal to the time at which the last of the echo signals is acquired in response to the emission of the corresponding sequence Seq of U/S pulses USP.
- each measurement E n may be associated with a respective time t n equal to the time at which the shear wave reaches the middle of the region of measurement within which the speed of the shear wave is being determined. It is noted that the values of times t n obtained by all these embodiments differ very little from each other, and that this difference has little impact on the interpretation of the obtained measurements E n .
- the mechanical property of the tissue may be a quantity related to the tissue stiffness, such as the propagation speed of shear waves V s , the shear modulus of the tissue or the Young's modulus E of the tissue (which can be derived from the slope of the stripes identified in the elastogram, or from the variation of the time of flight of the measurement pulse as a function of depth). It may also be any parameter related to shear wave propagation in the tissue, like viscosity.
- At least one measurement of the mechanical property is determined based on an event related to a signal related to the cardiac activity of the subject (hereinafter also referred to as "cardiac signal").
- the event related to the cardiac signal may be a specific feature in the cardiac signal, for example a rising edge or a falling edge, which may be detected, for example, when the cardiac signal value reaches a predefined threshold while increasing or decreasing.
- the cardiac signal is an ECG signal, represented in the top curve.
- the second curve represents the synchronization signal.
- an event related to the ECG signal is detected each time a rising edge of the ECG signal reaches a predefined threshold Th.
- a corresponding pulse is emitted on the synchronization signal (here, a downward pulse).
- This pulse has a predefined duration ⁇ t of few milliseconds (ms) for example. In the embodiments in which it is desired to perform at least one measurement per cardiac cycle, the duration ⁇ t of this pulse is shorter than the cardiac period.
- the ECG curve crosses the threshold value Th twice (one just before the peak, and one just after). It will be appreciated that the corresponding peak in the synchronization signal is only emitted for one of these two crossings (for example, when the ECG signal is rising or when it is falling).
- a mechanical pulse is delivered after or at the end of a temporal offset ⁇ t that follows the beginning of the peak of the synchronization signal.
- the temporal offset ⁇ t is used to explore values of the mechanical property at different times during the cardiac cycle.
- the temporal offset ⁇ t may be set by the user to measure the mechanical property at a given moment of the cardiac cycle. For example, when the user wants to obtain a measurement synchronized with a peak of the cardiac cycle, the temporal offset ⁇ t can be set to 0.
- the period of the cardiac cycle is typically of about 1 second. Therefore, the temporal offset ⁇ t may vary between 0 and 1 second (the period of the cardiac cycle).
- the average period (duration) of the cardiac cycle of the subject may be estimated from the cardiac signal, as detailed below. Therefore, the temporal offset ⁇ t may vary between 0 and the estimated period of the cardiac cycle of the subject. In the example of Figure 8 , it is desirable that the measurement of the mechanical property be made before the next ECG peak.
- the measurement of the mechanical property requires acquisition and processing time which results in a measurement delay with the cardiac signal.
- the acquisition time itself typically lasts about 80 milliseconds (ms).
- the measurement delay of the mechanical property can vary depending on the mechanical property value itself.
- the actual probing time can be estimated as the arrival time at which the shear wave reaches the middle of the region of interest.
- the arrival time depends on the tissue stiffness itself. Therefore, a compensation delay may be applied to resynchronize the liver stiffness signal with the cardiac signal in order to analyze these two signals in relation to each other (for example to display in parallel the cardiac signal and liver stiffness signal).
- an even more precise compensation can be carried out by integrating the real time of probing of the mechanical property into the delay.
- the mechanical pulses may be delivered after or at the end of a temporal offset ⁇ t that follows the beginning of the peak of the synchronization signal.
- the temporal offset ⁇ t may be variable from one measurement to another. This makes it possible to explore values of the mechanical property at different times during the cardiac cycle.
- the temporal offset ⁇ t associated with measurement E n (n being a strictly positive integer) may be equal to ⁇ t 0 + ( n - 1) ⁇ .
- Electronic unit 10 acquires echo signals received in response to track how the mechanical pulse MP propagates through the probed region and to determine one measurement E k-1 , E k of the mechanical property.
- one measurement is determined each time the ECG signal exceeds the predefined threshold Th, for at least a portion of the ECG signal.
- the determination of the measurements may be conditioned to other conditions, for example a condition related to the fact that the position and direction of the probe 2 is adequate (as detailed for instance in the not-yet published US patent application US17/695,053 assigned to the applicant) and/or a condition related to the fact that tip 4 is applied against body 8 of the subject (for example, based on contact force level measured by a force sensor - like a strain gauge - or deduced from the position of shaft 4' pushed into the casing when the tip is pressed on the subject's body) and/or a condition related to the fact that the subject is holding his breath (as detailed later in the description).
- one measurement is determined each time the ECG signal exceeds the predefined threshold Th in a portion of the ECG during which all these other conditions are satisfied.
- this feature may be the median or the mean of the plurality of measurements (as is conventionally done in elastography methods), or any feature derived from one or more statistical parameter(s) calculated from the plurality of measurements, for example the maximum, the minimum, the mean, the standard deviation and/or a percentile.
- synchronizing the measurements of LSM with the ECG signal as implemented in Figure 8 makes it possible to eliminate the variations due to the LSM time-dependency associated with the cardiac cycle. This can be used to increase the precision of LSM when targeting liver fibrosis assessment, for example. Indeed, in such case the medical practitioner wants to obtain a single value of LSM to interpret it. Without synchronization, the LSM value would likely present large variation since it is obtained using the mean or the median of several measurements obtained randomly during the cardiac cycle.
- the synchronization of LSM to the ECG signal can also be used to improve the signal-to-noise ratio of LSM measured during the cardiac cycle. Several estimates of LSM obtained at same moments of successive cardiac cycles can be averaged to increase the signal-to-noise ratio.
- the predefined threshold Th can be determined before starting the determination of the measurements of the mechanical property. For example, it is possible to extract the maximum (when the event corresponds to an upward peak of the ECG signal) values of the ECG signal (each time an upward peak is reached), to compute an indicator of this value (for example, a mean, a median, a minimum, etc.) and to determine the threshold Th based on this indicator.
- the threshold Th can be a fraction of the indicator, for example 0.9 times the value of the indicator. This example is not limiting, and other fractions may be used, for example 0.8, 0.85, 0.95, etc.
- the determination of the threshold Th may be one of the conditions for the electronic unit to enter the measurement mode (i.e., while the threshold Th is not determined, the measurements cannot begin).
- the threshold Th may have been determined as described above during a previous medical examination and may have been recorded in a memory. The recorded value can then be provided as input to the electronic unit 10 to be used for determining when an event related to the ECG signal occurs.
- the temporal offset ⁇ t can be a predefined value, for example a constant equal comprised between 0 and 2000 milliseconds (ms).
- the temporal offset ⁇ t can be determined before starting the determination of the measurements of the mechanical property. For example, an average duration of the cardiac cycle can be estimated from a portion of the ECG signal (by determining the durations between successive peaks and averaging these durations) and the temporal offset ⁇ t can be set between 0 and the average duration of the cardiac cycle (or 0 and a fraction of the average duration of the cardiac cycle, for example 0.9 times the average duration of the cardiac cycle).
- the number of measurements determined is typically greater than 1, in particular between 5 and 15 (for example 10 measurements, as in conventional elastography techniques).
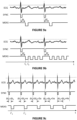
- Figures 9a, 9b and 9c represent different embodiments for determining measurements from the ECG signal.
- the embodiment of Figure 9a corresponds to that of Figure 8 , previously described.
- the top curve corresponds to the curve of the ECG signal over time
- the middle curve corresponds to the synchronization signal as introduced above
- the bottom curve represents the determination of the measurements.
- each window corresponds to one respective measurement, including the emission of a mechanical pulse and an ultrasound sequence as described above.
- the synchronization signal is set to low when an event is detected. This detection corresponds to the synchronization time which result in a measurement after or at the end of a temporal offset ⁇ t .
- the choice of using a synchronization signal set to low is arbitrary. It can be set to high when an event is detected.
- the first measurement of each series of measurements is determined after or at the end of a fixed temporal offset ⁇ t following the end of a peak (or a "window") in the synchronization curve.
- the temporal offset ⁇ t can be for example between 0 and 2000 milliseconds (ms). This temporal offset is not necessarily fixed and may vary from one series of measurements to another.
- each series of measurements may comprise at least 2 measurements per cardiac cycle, i.e. at least 2 measurements between two successive events (one event corresponding to the threshold being exceeded by the ECG curve).
- the measurements may be acquired at shorter times, i.e. at a higher repetition rate, for example at least 4 measurements per cardiac cycle (e.g. 4, 5, 6, 7, 8, 9, 10 measurements per second or more than 10 measurements per second).
- a higher repetition rate for example at least 4 measurements per cardiac cycle (e.g. 4, 5, 6, 7, 8, 9, 10 measurements per second or more than 10 measurements per second).
- the higher the repetition rate the more accurately the variations of the signal are captured, but the greater the computational resources are to be implemented.
- the measurements of the same series of measurements are regularly spaced in time (in other words, the time between two consecutive measurements is fixed and measurements are carried out at a regular interval).
- the time between two consecutive measurements of a same series of measurements may be variable in another embodiment.
- the inventors have demonstrated that the stiffness of a region of a subject's liver was not, contrary to what one might think, a constant value, but, instead, it varies over time.
- the variations of the Central Venous Pressure over time can be found in the measurement of the stiffness of the liver.
- the stiffness of the liver is a function whose values vary over time, in particular during a cardiac cycle. Therefore, obtaining the stiffness signal (and its variations during a cardiac cycle) has a relevant medical value, and makes it possible to more accurately determine certain indicators relating to stiffness (the median of the signal, for example).
- one or more indicators of the mechanical property may be extracted therefrom, for example a mean, a percentile, an extremum, a function or combination of these indicators, etc.
- Such indicators advantageously take into account the variations of the stiffness signal during the cardiac cycle, which is not the case with conventional elastography methods where an indicator is calculated from a plurality of point measurements taken at random.
- the shear wave frequency that is used to probe liver stiffness is typically equal to 50 Hz, which corresponds to a transient vibration of about 20 milliseconds (ms). Consecutive measurements of liver stiffness require that the time interval between consecutive mechanical pulses be at least a few periods for the shear waves not to superimpose.
- a feature representative of the mechanical property (for example, the liver stiffness) of the subject may also be determined based on spectral characteristic(s) of the obtained signal E(t) (or a part of it), obtained by performing a spectral analysis of the obtained signal E(t) (or a part of it).
- the spectral analysis may be performed on the part of the signal corresponding to a time interval during which the subject is holding his breath.
- a spectral analysis makes it possible to obtain spectral characteristics such as the center frequencies of the peaks in the frequency domain, the bandwidths of the peaks at -3 dB (or other thresholds such as - 6 dB, etc.), the relative heights of the peaks, etc.
- spectral characteristics may also be used for determining one or more feature related to the liver stiffness of the subject, but also one or more feature related to the Central Venous Pressure of the subject (which are classically obtained by invasive techniques such as catheterization).
- a Fourier Transform may be applied to the portion of the signal corresponding to a time interval during which the subject is holding his breath (which may be determined, as mentioned above, by using a breath holding indicator for example).
- the breath holding indicator may be determined by computing a correlation coefficient between successive ultrasound signals and comparing the computed correlation coefficient to a predefined threshold.
- the elastography device may comprise or may be connected to a breath sensor or respiration sensor and the breath holding indicator may be obtained from measurements data of the breath sensor.
- the signal spectrum obtained may comprise a diffuse peak around the period associated with the periodic or pseudo-periodic variation (the period corresponding to the duration of the cardiac cycle of the subject).
- a band-stop filter (with a stopband defined based on the width of the peak) can then be applied to eliminate the periodic or pseudo-periodic variation of the signal, and a processed signal E'(t) corresponding to the signal E(t) deprived from this periodic or pseudo-periodic variation can be obtained by an inverse Fourier Transform.
- the feature related to the liver stiffness of the subject may then be obtained from this processed signal E'(t), by example by taking the mean or the median or any function of statistical characteristics of the processed signal E'(t).
- a feature or information related to the Central Venous Pressure (CVP) of the subject may be determined from the obtained stiffness signal E(t) (instead or in addition to the feature relating to the stiffness of the subject).
- the periodic or pseudo-periodic variation observed in the signal E(t) when the subject holds his breath is linked to the value of the CVP, and extracting this periodic or pseudo-periodic variation, or a part of it, may provide information related to the variation of the CVP over time.
- the medical practitioner may be able to detect an anomaly in the curve of the CVP which may suggest a cardiac pathology of the subject.
- the stiffness signal E(t) may be used to extract a profile (or "waveform”, or “trace") of the CVP curve (for example, the patterns corresponding to the a, c and v-waves and the x and y-descents), which can be used by the medical practitioner for informational or diagnostic purposes.
- This waveform may be displayed along with the cardiac signal so that the medical practitioner can visualize the mechanical property waveform during the cardiac period, which can have high diagnostic value.
- the information related to the CVP of the subject may be a value of the CVP estimated from the LSM signal.
- RAP right atrium pressure
- LS liver stiffness LS
- acquiring at least 4 measurements during a cardiac cycle which has an average duration of approximatively 1 second for an adult subject, may be very computationally intensive, and may therefore require that the electronic unit 10 of the elastography device 1 be adapted.
- the threshold value Th may be a predefined value or may be predetermined (i.e. determined before starting the measurements) from a portion of the ECG signal as detailed in reference with Figure 8 .
- the temporal offset ⁇ t can be a predefined value, for example a constant equal comprised between 0 and 2000 milliseconds (ms).
- the temporal offset ⁇ t can be determined before starting the determination of the measurements of the mechanical property.
- an average duration of the cardiac cycle can be estimated from a portion of the ECG signal (by determining the durations between successive peaks and averaging these durations) and the temporal offset ⁇ t can be set to a fraction of the estimated average duration of the cardiac cycle, for example 0.05 times the estimated average duration of the cardiac cycle.
- Each series of measurements comprises a plurality of measurements, for example between 2 and 10 measurements.
- the repetition rate which corresponds to the number of measurements per second, may be predefined.
- the repetition rate may be a fixed value comprised between 2 and 10 measurements per second, or it may be predetermined (i.e. determined before starting the measurements) from a portion of the ECG signal, to advantageously take into account the average duration of a cardiac cycle of the subject.
- This calculation may take into account the temporal offset ⁇ t between a synchronization peak and the first measurement of the series, by subtracting the temporal offset ⁇ t from the estimated average duration. Also, to ensure that 5 measurements are actually taken for a large majority of the cardiac cycles, the obtained time may be slightly reduced. In this example, the time between two measurements may be set to 0.13 s.
- the number of series of measurements determined can be equal to 1 or be greater than 1, for example greater than 3.
- the variable temporal offset ⁇ t k may increase over time.
- the temporal offset ⁇ t k is equal to ⁇ t 0 + ( k - 1) ⁇ ⁇ , where ⁇ is a fixed strictly positive value, which can be of the order of a few milliseconds (ms) to a few hundreds of milliseconds (ms) for example, and ⁇ t 0 is a fixed value typically comprised between 0 and 1 second, for example between 0 and a few tens or hundreds of milliseconds (ms).
- the series of temporal offsets may be reset to zero or to a predetermined value (for example ⁇ t 0 in the case of Figure 9c ), so that there is always a measurement made during a cardiac cycle, i.e. between two successive peaks in the ECG curve.
- This embodiment makes it possible to determine a series of measurements taken at different moments of the cardiac cycle, which may provide important information for the medical practitioner, such as the mean or the median value of LSM during the cardiac cycle, the amplitude of variation of the LSM during the cardiac cycle, etc.
- this embodiment makes it possible to recover a profile (or "trace” or “waveform") of the LSM curve or of the CVP curve, as in the embodiment of Figure 9b , without however having to determine very close measurements, which can become computationally intensive and may require that the electronic unit be adapted, as mentioned above). For example, if one LSM measurement is obtained at each cardiac cycle, using a temporal offset that is increasing by 100 milliseconds (ms) at every new cardiac cycle, then after 10 cycles, a full profile of LSM during a cardiac cycle (whose duration is about 1 second) is obtained with 10 points separated by 100 milliseconds (ms).
- two consecutive measurements E 1 , E 2 are taken at two respective temporal offsets ⁇ t 1 and ⁇ t 2 during the same cardiac cycle
- two consecutive measurements E' 1 , E' 2 are taken at two respective temporal offsets ⁇ t' 1 and ⁇ t' 2 belonging to two consecutive cardiac cycles.
- ⁇ t' 1 can be equal to ⁇ t 1
- ⁇ t' 2 can be equal to ( ⁇ t 2 + duration of the cardiac cycle), such that the measurements (E 1 , E' 1 ) and (E 2 , E' 2 ) are taken at similar moments or instants of the cardiac cycle.
- the difference between two successive temporal offsets ⁇ t k , ⁇ t k +1 may be small enough to be able to extract, from successive measurements, information on the variation of the LSM (and therefore of the CVP) during a cardiac cycle.
- ⁇ t k +1 - ⁇ t k may be comprised between CC/20 and CC/4, where CC is the average duration of the cardiac cycle, which may be estimated as detailed above.
- the tip displacement When processing the ultrasound echo signals acquired, in order to determine tissue strain, it is desirable to compensate for the tip's displacement d. Indeed, as the ultrasound pulses sent to probe the medium displacement are emitted by the tip end, the tip displacement, which is quite significant, adds up to the to-be measured tissue displacement. To reduce the correlation computation time, and to increase the signal-to-noise ratio, it is thus desirable to compensate for this displacement.
- Known compensation techniques are based on a post-processing of the echo signals, in which strong echoes are identified and employed to realign temporally these signals. But such a technique is time-consuming, and not well suited to be implemented in a special purpose processor like processor 60 (which may be an FPGA, for instance). So, in order to compensate for this displacement d, the electronic unit 10 (more specifically, its processor 60) is configured to implement the following pre-compensation technique.
- the ultrasound pulses emitted to track the mechanical pulses MP may be configured with:
- the transducer's displacement is thus compensated from the beginning, without requiring a special post-processing.
- the elastography device is more specifically configured so that the temporal offset upon emission is equal to ⁇ t TX,0 + d/v us , ⁇ t TX,0 being a constant offset upon emission, while the temporal offset upon reception is equal to ⁇ t RX,0 - d/v us , ⁇ t RX,0 being a constant offset upon reception.
- control module 20 may generate a reference transmission control signal S TX,0 (based on a predetermined transmission sequence stored in a memory of the control module, for instance), when a mechanical pulse is to be tracked, this signal being then delayed in a controlled manner, using a controllable delay 23, to produce the transmission control signal S TX sent to U/S front end 40.
- the temporal shift upon reception ⁇ t RX may be obtained using a controllable sequencer 22 that selects the appropriate series of values in a digitalized signal outputted by amplifier and ADC 42, using a shift register or another type of digital buffer.
- a correction module 21 may determine the variable offset d/v us , from the digitalized signal outputted by signal conditioning module 32 (digitalized signal which is representative of the signal outputted by the displacement sensor 11).
- the displacement d of transducer 6 is its displacement relative to probe's casing 3.
- the first processor 50 may also include a synchronization module 26 configured to receive the ECG signal S ECG and to generate the synchronization signal SYNC based on the received ECG signal.
- Synchronization module 26 may be connected to ultrasound front end 40 and to motion controller 30 to deliver at least one mechanical pulse and one corresponding U/S sequence based on the synchronization signal.
- Figure 10 is a flow-chart describing an embodiment of the invention.
- a plurality of measurements of the mechanical property of the region 80 are determined, at least one measurement among the plurality of measurements being determined based on an event related to the ECG signal of the subject.
- the determined measurements are then used for determining a feature related to the mechanical property.
- the mechanical property corresponds to the tissue stiffness, and more specifically a liver stiffness. It will be appreciated that any other mechanical property may be measured, for instance the elasticity, the Young's modulus, the shear modulus, the shear wave speed, the viscoelasticity, the viscosity or any composite biomarker deriving from (or combining) one or more of the previous physical quantities. Also, it will be appreciated that other parts of the body may be considered, for example the brain.
- An ECG signal of the subject is received at a first step 110.
- one or more conditions for the electronic unit to enter the measurement mode may be determined.
- the "measurement mode” may correspond to a mode in which the electronic unit is ready to start the determination of the measurements. While the electronic unit is not in the measurement mode, no measurements is taken.
- the one or more conditions may include, for example:
- the condition as to whether the subject holds his breath can be verified based on a breath holding indicator, which can be obtained from the correlation of successive ultrasound echo signals.
- Successive ultrasound signals may be emitted through the region of the body explored, and respective echo signals may be received.
- a coefficient of correlation between successive echo signals may then be computed.
- a high coefficient of correlation (close to 1) indicates that the tissue located in front of the probe are stable.
- the indicator may indicate that the subject holds his breath when the coefficient of correlation is below a predefined threshold, for instance 0.9 or 0.95 or 0.99.
- the pulse repetition period between the collected ultrasound signals can be typically 50 milliseconds (ms), more generally between 5 milliseconds (ms) and 200 milliseconds (ms), typically 100 milliseconds (ms).
- setting parameters it is meant here predefined or predetermined parameters used to determine the measurements of the mechanical property, for example, depending on embodiments: the temporal offset ⁇ t , the repetition rate of measurements, the estimated average duration of the cardiac cycle, the threshold Th.
- the condition as to whether the one or more settings parameters are available is therefore satisfied if all the settings parameters used to determine the measurements of the mechanical property are available at the electronic unit (predetermined or received).
- the conditions to be satisfied may be different depending on the information to be extracted from the plurality of measurements taken and/or the way in which the measurements are taken. For example, in the embodiment of Figure 9a , if one wants to determine a parameter related to the mechanical property, it is not mandatory for the subject to hold his breath. In the embodiments of Figures 9b and 9c , if one wants to determine a parameter related to the mechanical property, it is not mandatory for the subject to hold his breath, but if one wants to determine one or more features related to the CVP or the cardiac activity of the subject, it is desirable that the subject holds his breath.
- the electronic unit 10 may determine whether all conditions determined at step 120 are met or satisfied. While at least one condition is not met or satisfied (step 120, arrow "N"), the electronic unit does not enter the measurement mode and acquisition of the measurements E k cannot begin. If all conditions are met or satisfied (step 120, arrow "Y"), the electronic unit enters in the measurement mode. Once the electronic unit is in measurement mode, it may monitor the occurrence of an event related to the ECG signal.
- an event related to the ECG signal is detected.
- the event related to the ECG signal may correspond to a peak in the ECG curve, which may be supposed to be detected when the ECG signal exceeds (or is below) a predefined threshold Th.
- the detection 140 of the event related to the ECG signal causes the determination (step 150) of at least one measurement E k of the mechanical property.
- the detection of the event related to the ECG signal may cause the determination (step 150) of one measurement (as in Figures 9a and 9c ) or of a series of measurements (as in Figure 9b ).
- the at least one measurement E k may be determined (step 150) as described above, with an elastography device as represented in Figure 5 . However, this is not limiting, and any elastography device may be used for determining the measurements Ek.
- At step 160 at least one feature representative of the mechanical property and/or information related to the CVP of the subject may be extracted from the measurements obtained at step 150.
- the feature representative of the mechanical property may be a single value determined from the obtained measurements.
- the feature may be a function of the minimum, the maximum, a given percentile, the mean, the standard variation or any statistical characteristic of the obtained measurements.
- the feature may also be a function of a combination of at least two statistical characteristics.
- such feature may provide more accurate information related to the mechanical property than conventional methods.
- several (e.g. 10) measurements of the stiffness are determined at respective instants that can correspond to very different moments of the cardiac cycles and therefore to very different values of the stiffness.
- a feature representative of stiffness is computed (e.g. the mean or the median of the measurements), without taken into account such variability. By considering measurements always taken at the same time (at least approximately) of the cardiac cycle, this variability is therefore reduced.
- measurements are instead determined at different moments or instants of the cardiac cycle, and reflect the variability of the value of the mechanical property during the cardiac cycle. Therefore, by determining the feature related to the mechanical property from these measurements, this variability is taken into account.
- the mean, the median or the half-sum of the maximum and the minimum of measurements provides "smoothed" information on the value of the mechanical property, while indicators of dispersion such as the variance or the interquartile range provide information on the amplitude of variation of the value of the mechanical property (which may, in itself, have diagnostic value).
- a signal E(t) may be obtained from the measurements E k determined at step 150, as detailed above.
- the signal E(t) may comprise all the measurements acquired or several measurements among all the measurements acquired.
- an interpolation for example a linear interpolation or a spline interpolation
- the at least one feature or one piece of information related to the stiffness and/or the CVP of the subject determined at step 170 can be displayed on a screen, to be used by the medical practitioner.
- Other information may be displayed, in alternative or in addition.
- the signal E(t) obtained in the example of Figure 9b and/or the ECG signal may be displayed.
- the ECG signal of the subject and the LSM signal E(t) can be displayed on the same screen.
- a compensation delay may be calculated to take into account the delay between the event and the corresponding measurement.
- the medical practitioner can therefore interpret the LSM signal E(t) in light of the ECG signal.
- the elastography device represented in Figures 4 to 6 is a Vibration-Controlled Transient Elastography (VCTE) device
- VCTE Vibration-Controlled Transient Elastography
- aspects of the present invention can be implemented to any type of elastography device making it possible to obtain measurements with a sufficiently high repetition rate (e.g. at least 4 per second).
- the present invention may be applied to other TE (Transient Elastography) devices, for example devices implementing ARFI (Acoustic Radiation Force Impulse) or SWE (Shear Wave Elastography) technologies.
- ARFI and SWE unlike in the VCTE technology, a longitudinally moving shear wave is not generated by an external vibrator.
- pressure radiation generated by ultrasounds is focused in a region of interest.
- the radiation pressure generates a laterally moving shear wave that is tracked outside the region of interest using ultrasound tracking pulses.
- the invention may be applied to other elastography techniques such as Magnetic Resonance Elastography using Magnetic Resonance Imaging or Optical Coherence Elastography using Optical Coherence Tomography.
- the invention is not limited to this example.
- the invention can be implemented for any type of cardiac signal, for example a cardiac signal measured using an optical system, an ultrasound system, a pressure measurement system, etc.
Landscapes
- Health & Medical Sciences (AREA)
- Life Sciences & Earth Sciences (AREA)
- Engineering & Computer Science (AREA)
- Biomedical Technology (AREA)
- Medical Informatics (AREA)
- Veterinary Medicine (AREA)
- Biophysics (AREA)
- Nuclear Medicine, Radiotherapy & Molecular Imaging (AREA)
- Pathology (AREA)
- Radiology & Medical Imaging (AREA)
- Public Health (AREA)
- Heart & Thoracic Surgery (AREA)
- Physics & Mathematics (AREA)
- Molecular Biology (AREA)
- Surgery (AREA)
- Animal Behavior & Ethology (AREA)
- General Health & Medical Sciences (AREA)
- Physiology (AREA)
- Computer Vision & Pattern Recognition (AREA)
- Ultra Sonic Daignosis Equipment (AREA)
Priority Applications (2)
| Application Number | Priority Date | Filing Date | Title |
|---|---|---|---|
| EP23173298.3A EP4464256A1 (fr) | 2023-05-15 | 2023-05-15 | Dispositif et procédé d'élastographie |
| CN202410600099.2A CN119074057A (zh) | 2023-05-15 | 2024-05-15 | 弹性成像装置和方法 |
Applications Claiming Priority (1)
| Application Number | Priority Date | Filing Date | Title |
|---|---|---|---|
| EP23173298.3A EP4464256A1 (fr) | 2023-05-15 | 2023-05-15 | Dispositif et procédé d'élastographie |
Publications (1)
| Publication Number | Publication Date |
|---|---|
| EP4464256A1 true EP4464256A1 (fr) | 2024-11-20 |
Family
ID=86382725
Family Applications (1)
| Application Number | Title | Priority Date | Filing Date |
|---|---|---|---|
| EP23173298.3A Pending EP4464256A1 (fr) | 2023-05-15 | 2023-05-15 | Dispositif et procédé d'élastographie |
Country Status (1)
| Country | Link |
|---|---|
| EP (1) | EP4464256A1 (fr) |
Citations (2)
| Publication number | Priority date | Publication date | Assignee | Title |
|---|---|---|---|---|
| JP2015188514A (ja) * | 2014-03-27 | 2015-11-02 | 日立アロカメディカル株式会社 | 超音波診断装置 |
| US20220192640A1 (en) * | 2019-04-18 | 2022-06-23 | Koninklijke Philips N.V. | System and method for acquisition triggering for cardiac elastography |
-
2023
- 2023-05-15 EP EP23173298.3A patent/EP4464256A1/fr active Pending
Patent Citations (2)
| Publication number | Priority date | Publication date | Assignee | Title |
|---|---|---|---|---|
| JP2015188514A (ja) * | 2014-03-27 | 2015-11-02 | 日立アロカメディカル株式会社 | 超音波診断装置 |
| US20220192640A1 (en) * | 2019-04-18 | 2022-06-23 | Koninklijke Philips N.V. | System and method for acquisition triggering for cardiac elastography |
Non-Patent Citations (7)
| Title |
|---|
| "European Association for the Study of the Liver. EASL Clinical Practice Guidelines on non-invasive tests for evaluation of liver disease severity and prognosis - 2021 update", J HEPATOL, vol. 75, no. 3, pages 659 - 689 |
| BYENFELDT, MARIE ET AL.: "Influence of Probe Pressure on Ultrasound-Based Shear Wave Elastography of the Liver Using Comb-Push 2-D Technology", ULTRASOUND IN MEDICINE AND BIOLOGY, vol. 45, pages 411 - 428, XP085573884, DOI: 10.1016/j.ultrasmedbio.2018.09.023 |
| HSU ET AL.: "Hemodynamics for the Heart Failure Clinician: A State-of-the-Art Review", JOURNAL OF CARDIAC FAILURE, 2021 |
| LOREE, HBASTARD, CMIETTE, VSANDRIN, L: "Vibration-Guided Transient Elastography. A Novel Fibroscan(R) Examination with Improved Guidance for Liver Stiffness Measurement", ULTRASOUND MED BIOL, vol. 46, no. 9, 2020, pages 2193 - 2206, XP086244013, DOI: 10.1016/j.ultrasmedbio.2020.04.010 |
| MELLEMA, DANIEL C.; SONG, PENGFEI; KINNICK, RANDALL R.; URBAN, MATTHEW W.; GREENLEAF, JAMES F.; MANDUCA, ARMANDO; CHEN, SHIGAO: "Probe Oscillation Shear Elastography (PROSE): A High Frame-Rate Method for Two-Dimensional Ultrasound Shear Wave Elastography", IEEE TRANSACTIONS ON MEDICAL IMAGING, vol. 35, no. 9, 2016, pages 2098 - 2106, XP011621555, DOI: 10.1109/TMI.2016.2550007 |
| TANIGUCHI ET AL., AM. J. CARDIOL, vol. 113, no. 3, 2014, pages 552 - 8 |
| TZSCHATZSCH, HEIKOKREFT, BERNHARDSCHRANK, FELIXBERGS, JUDITHBRAUN, JÜRGENSACK, INGOLF: "In vivo time-harmonic ultrasound elastography of the human brain detects acute cerebral stiffness changes induced by intracranial pressure variations", SCIENTIFIC REPORTS, vol. 8, no. 1, 2018, pages 17888 |
Similar Documents
| Publication | Publication Date | Title |
|---|---|---|
| US20230148891A1 (en) | System and method for non-invasive instantaneous and continuous measurement of heart rate, stroke volume and ejection fraction | |
| JP3875581B2 (ja) | 超音波診断システム | |
| US7022077B2 (en) | Systems and methods for making noninvasive assessments of cardiac tissue and parameters | |
| CN102469987B (zh) | 超声波诊断装置以及内中膜复合体厚度的测定方法 | |
| Seo et al. | Noninvasive arterial blood pressure waveform monitoring using two-element ultrasound system | |
| US12533110B2 (en) | Elastography device and method | |
| WO2004103185A1 (fr) | Ultrasonographe | |
| US12440187B2 (en) | Elastography device and method | |
| EP3936036B1 (fr) | Procédé et système pour estimer une mesure de la santé cardiovasculaire d'un sujet | |
| CA2490999A1 (fr) | Systemes et procedes d'evaluation non invasive d'un tissu cardiaque, et parametres s'y rapportant | |
| CN104873224A (zh) | 超声波测量装置以及超声波测量方法 | |
| Arakawa et al. | Development of an ultrasonic probe to measure both radial arterial pressure and diameter change at the same position for early diagnosis of vascular endothelial function: Preliminary study | |
| JP3842285B2 (ja) | 超音波診断装置および超音波診断装置の制御方法 | |
| Hsu et al. | Novel acoustic radiation force impulse imaging methods for visualization of rapidly moving tissue | |
| EP4400058A1 (fr) | Dispositif et procédé d'élastographie | |
| TWI880581B (zh) | 彈性成像設備和方法 | |
| HK40117474A (en) | Elastography device and method | |
| CN119074057A (zh) | 弹性成像装置和方法 | |
| HK40112262A (en) | Elastography device and method | |
| Luo et al. | P4A-2 an in-vivo study of frame rate optimization for myocardial elastography | |
| Joseph et al. | A PC based system for non-invasive measurement of carotid artery compliance | |
| Saito et al. | 1P5-2 Viscoelasticity estimation of radial artery by simultaneously measuring changes in pressure and diameter using single ultrasound probe | |
| Bradway et al. | Feasibility and safety of transthoracic cardiac acoustic radiation force impulse imaging methods | |
| WO2006126485A1 (fr) | Echographe | |
| Tavoni | Development of New Techniques for Clinical Applications of Jugular Venous Pulse with Ultrasound Devices |
Legal Events
| Date | Code | Title | Description |
|---|---|---|---|
| PUAI | Public reference made under article 153(3) epc to a published international application that has entered the european phase |
Free format text: ORIGINAL CODE: 0009012 |
|
| STAA | Information on the status of an ep patent application or granted ep patent |
Free format text: STATUS: THE APPLICATION HAS BEEN PUBLISHED |
|
| AK | Designated contracting states |
Kind code of ref document: A1 Designated state(s): AL AT BE BG CH CY CZ DE DK EE ES FI FR GB GR HR HU IE IS IT LI LT LU LV MC ME MK MT NL NO PL PT RO RS SE SI SK SM TR |
|
| STAA | Information on the status of an ep patent application or granted ep patent |
Free format text: STATUS: REQUEST FOR EXAMINATION WAS MADE |
|
| 17P | Request for examination filed |
Effective date: 20250507 |
|
| STAA | Information on the status of an ep patent application or granted ep patent |
Free format text: STATUS: EXAMINATION IS IN PROGRESS |
|
| 17Q | First examination report despatched |
Effective date: 20260331 |