EP4524890A1 - Fourniture d'une image de projection d'une région vasculaire - Google Patents
Fourniture d'une image de projection d'une région vasculaire Download PDFInfo
- Publication number
- EP4524890A1 EP4524890A1 EP23202936.3A EP23202936A EP4524890A1 EP 4524890 A1 EP4524890 A1 EP 4524890A1 EP 23202936 A EP23202936 A EP 23202936A EP 4524890 A1 EP4524890 A1 EP 4524890A1
- Authority
- EP
- European Patent Office
- Prior art keywords
- image
- volumetric
- contrast agent
- background
- data
- Prior art date
- Legal status (The legal status is an assumption and is not a legal conclusion. Google has not performed a legal analysis and makes no representation as to the accuracy of the status listed.)
- Withdrawn
Links
Images

Classifications
-
- G—PHYSICS
- G06—COMPUTING OR CALCULATING; COUNTING
- G06T—IMAGE DATA PROCESSING OR GENERATION, IN GENERAL
- G06T12/00—Tomographic reconstruction from projections
- G06T12/30—Image post-processing, e.g. metal artefact correction
-
- G—PHYSICS
- G06—COMPUTING OR CALCULATING; COUNTING
- G06T—IMAGE DATA PROCESSING OR GENERATION, IN GENERAL
- G06T2211/00—Image generation
- G06T2211/40—Computed tomography
- G06T2211/404—Angiography
Definitions
- the volumetric contrast agent image data, and the volumetric background image data are reconstructed to provide a volumetric contrast agent image, and a volumetric background image, respectively.
- a proper subset of the vessels in the volumetric contrast agent image is then projected to provide a projected contrast agent image.
- the background media in the volumetric background image is also projected to provide a projected background image.
- the projected contrast agent image and the projected background image are then combined to provide a combined projection image representing the vascular region, and which is then outputted.
- the combined projection image is similar in appearance to an angiographic projection image, i.e. the type of image that is typically acquired by an interventional cardiologist. It therefore assists an interventional cardiologist in performing a diagnosis of a vascular regions using images that have been acquired using a spectral CT imaging system.
- the combined projection image is similar in appearance to an angiographic projection image because firstly it includes the vessel(s) as well as background media. This contrasts with e.g. a simulated projected image that is generated by simply projecting a (spectral) cardiac CT image (e.g. via e.g. ray tracing), and which may represent the vessels alone. Secondly, the combined projection image includes a proper subset of the vessels in the vascular region, or in other words, not all of the vessels in the vascular region. An angiographic projection image also does not typically represent all of the vessels in the vascular region.
- a (spectral) cardiac CT image large parts of the vascular structures are typically filled with contrast agent.
- the atria, chamber, aorta and/or superior vena cava may be filled with contrast agent.
- a simulated angiographic projection image that is generated by simply projecting a (spectral) cardiac CT image typically results in the coronary arteries being obscured by these large vascular structures.
- the vascular region is the heart. It is, however, to be appreciated that in general the vascular region may in general be any vascular region in the anatomy. For instance, the vascular region may alternatively be (a portion of) the heart, brain, the lung, the leg, and so forth.
- the computer-implemented methods disclosed herein may be provided as a non-transitory computer-readable storage medium including computer-readable instructions stored thereon, which, when executed by at least one processor, cause the at least one processor to perform the method.
- the computer-implemented methods may be implemented in a computer program product.
- the computer program product can be provided by dedicated hardware, or hardware capable of running the software in association with appropriate software.
- the functions of the method features can be provided by a single dedicated processor, or by a single shared processor, or by a plurality of individual processors, some of which can be shared.
- the functions of one or more of the method features may for instance be provided by processors that are shared within a networked processing architecture such as a client/server architecture, a peer-to-peer architecture, the Internet, or the Cloud.
- processor or “controller” should not be interpreted as exclusively referring to hardware capable of running software, and can implicitly include, but is not limited to, digital signal processor "DSP” hardware, read only memory “ROM” for storing software, random access memory “RAM”, a non-volatile storage device, and the like.
- DSP digital signal processor
- ROM read only memory
- RAM random access memory
- examples of the present disclosure can take the form of a computer program product accessible from a computer-usable storage medium, or a computer-readable storage medium, the computer program product providing program code for use by or in connection with a computer or any instruction execution system.
- a computer-usable storage medium or a computer readable storage medium can be any apparatus that can comprise, store, communicate, propagate, or transport a program for use by or in connection with an instruction execution system, apparatus, or device.
- the medium can be an electronic, magnetic, optical, electromagnetic, infrared, or a semiconductor system or device or propagation medium.
- Examples of computer-readable media include semiconductor or solid-state memories, magnetic tape, removable computer disks, random access memory "RAM”, read-only memory "ROM”, rigid magnetic disks and optical disks. Current examples of optical disks include compact diskread only memory "CD-ROM”, compact disk-read/write "CD-R/W”, Blu-Ray TM and DVD.
- Suitable techniques may include machine learning techniques, as well as deep learning techniques such as neural networks.
- one or more neural networks may be trained in a supervised, or in some cases unsupervised, manner, to implement the operations performed in the computer-implemented methods disclosed herein.
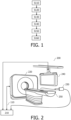
- Fig. 1 is a flowchart illustrating an example of a method of providing a projection image representing a vascular region, in accordance with some aspects of the present disclosure.
- Fig. 2 is a schematic diagram illustrating an example of a system for providing a projection image representing a vascular region, in accordance with some aspects of the present disclosure. It is noted that operations described as being performed in the method illustrated in Fig. 1 , may also be performed by the one or more processors 210 of the system 200 illustrated in Fig. 2 . Likewise, operations described in relation to the one or more processors 210 of the system 200 illustrated in Fig. 2 may also be performed in the method illustrated in Fig. 1 . With reference to Fig. 1, and Fig. 2 , the computer-implemented method of providing a projection image representing a vascular region, comprises:
- spectral CT data is analyzed in order to provide volumetric contrast agent image data representing the distribution of the contrast agent, and volumetric background image data representing the background media. Since each of these types of data is provided by analyzing spectral CT data, a reliable distinction can be made between the contrast agent and the background media. This, in-turn, this facilitates a more accurate diagnosis of the vascular region.
- the volumetric contrast agent image data, and the volumetric background image data are reconstructed to provide a volumetric contrast agent image, and a volumetric background image, respectively.
- a proper subset of the vessels in the volumetric contrast agent image is then projected to provide a projected contrast agent image.
- the background media in the volumetric background image is also projected to provide a projected background image.
- the projected contrast agent image and the projected background image are then combined to provide a combined projection image representing the vascular region, and which is then outputted.
- the combined projection image is similar in appearance to an angiographic projection image, i.e. the type of image that is typically acquired by an interventional cardiologist. It therefore assists an interventional cardiologist in performing a diagnosis of a vascular regions using images that have been acquired using a spectral CT imaging system.
- the combined projection image is similar in appearance to an angiographic projection image because firstly it includes the vessel(s) as well as background media. This contrasts with e.g. a simulated projected image that is generated by simply projecting a (spectral) cardiac CT image (e.g. via e.g. ray tracing), and which may represent the vessels alone. Secondly, the combined projection image includes a proper subset of the vessels in the vascular region, or in other words, not all of the vessels in the vascular region. An angiographic projection image also does not typically represent all of the vessels in the vascular region.
- a (spectral) cardiac CT image large parts of the vascular structures are typically filled with contrast agent.
- the atria, chamber, aorta and/or superior vena cava may be filled with contrast agent.
- a simulated angiographic projection image that is generated by simply projecting a (spectral) cardiac CT image typically results in the coronary arteries being obscured by these large vascular structures.
- the combined projection image that is provided by the above method has both an improved distinction between different materials, and an appearance that is similar to an angiographic projection image. In so doing, the method provides assistance to interventional cardiologists in diagnosing vascular regions using images that have been acquired using spectral CT imaging systems.
- spectral CT data 110 is received.
- the spectral CT data 110 that is received in the operation S 110 may be raw data, i.e. data that has not been reconstructed into volumetric image, or it may be image data, i.e. data that represents a reconstructed volumetric image.
- the spectral CT data 110 that is received in the operation S 110 may be received from various sources.
- the spectral CT data 110 may be received from a spectral CT imaging system, such as the spectral CT imaging system 220 illustrated in Fig. 2 .
- the spectral CT data may be received from another source, such as from a spectral X-ray projection imaging system, as described in more detail below, or it may be received from a computer readable storage medium, or from the Internet, or from the Cloud, and so forth.
- the spectral CT data 110 may be received via any form of data communication, including via wired, or optical, or wireless communication.
- the communication may take place via signals transmitted on an electrical or optical cable, and when wireless communication is used, the communication may take place via RF or optical signals.
- the spectral CT data 110 that is received in the operation S110 represents X-ray attenuation in a plurality of different energy intervals. There may be two or more energy intervals.
- the ability to generate X-ray attenuation data in multiple different energy intervals distinguishes a spectral CT imaging system from a conventional CT imaging system, and which generates X-ray attenuation data within only a single energy interval.
- processing the data from the multiple different energy intervals e.g. using various material decomposition algorithms, a distinction can be made between media that have similar X-ray attenuation values when measured within a single energy interval, and which would be indistinguishable from attenuation data generated by a conventional CT imaging system.
- the spectral CT data 110 that is received in the operation S110 may be generated by a spectral CT imaging system.
- a spectral CT imaging system generates spectral CT data whilst rotating, or stepping, an X-ray source-detector arrangement around an imaging region.
- Examples of spectral CT imaging systems include cone beam spectral CT imaging systems, photon counting spectral CT imaging systems, dark-field spectral CT imaging systems, and phase contrast spectral CT imaging systems.
- the spectral CT data 110 may be generated by the Spectral CT 7500 that is marketed by Philips Healthcare, Best, The Netherlands.
- a spectral CT imaging system includes an X-ray source, and an X-ray detector.
- the X-ray source may be provided by multiple monochromatic sources, or by one or more polychromatic sources
- the X-ray detector may include: a common detector for detecting X-ray radiation across multiple different X-ray energy intervals, or multiple detectors wherein each detector detects X-ray radiation within a different X-ray energy interval, or a multi-layer detector in which X-ray radiation within each of multiple different X-ray energy intervals is detected by corresponding layers, or a photon counting detector that bins detected X-ray photons into one of multiple energy intervals based on their individual energies.
- the relevant energy interval may be determined for each received X-ray photon by detecting the pulse height induced by electron-hole pairs that are generated in response to the X
- Various configurations of the aforementioned X-ray sources and X-ray detectors may be used in a spectral CT imaging system to generate spectral attenuation data representing X-ray attenuation in a plurality of different energy intervals.
- a discrimination between different X-ray energy intervals may be provided at the X-ray source by temporally switching the X-ray anode potential of a single X-ray source, i.e. by "rapid kVp switching", or by temporally switching, or filtering, the emission of X-rays from multiple X-ray sources.
- a common X-ray detector may be used to detect X-rays across multiple different energy intervals, attenuation data for each of the energy intervals being generated in a time-sequential manner.
- a discrimination between different X-ray energy intervals may be provided at the X-ray detector 340 by using a multi-layer detector, or a photon counting detector.
- Such detectors can detect X-rays from multiple X-ray energy intervals nearsimultaneously, and thus there is no need to perform temporal switching at the X-ray source.
- a multi-layer X-ray detector, or a photon counting X-ray detector may be used in combination with a polychromatic X-ray source to generate spectral attenuation data in a plurality of different energy intervals.
- X-ray sources and X-ray detectors may alternatively be used in a spectral CT imaging system to provide the desired X-ray attenuation data in a plurality of different energy intervals.
- the need to sequentially switch different X-ray sources emitting X-rays in different energy intervals may be obviated by mounting X-ray source-detector pairs to a gantry at rotationally-offset positions around the axis of rotation.
- each source-detector pair operates independently, and a separation between the X-ray attenuation data for the different energy intervals is facilitated by virtue of the rotational offsets of the source-detector pairs.
- Improved separation between the spectral attenuation data for the different energy intervals may be achieved with this configuration by applying an energy-selective filter to the X-ray detector(s) in order to reduce the effects of X-ray scatter.
- the spectral CT data 110 may be provided by intercepting the X-ray beam in a conventional X-ray imaging system with one or more spectral filters.
- a single filter may be mechanically moved into, and out of, the X-ray beam generated by a polychromatic X-ray source in order to temporally control the spectrum of X-rays detected by an X-ray detector.
- the filter may for instance transmit only a portion of the spectrum of X-rays emitted by the polychromatic X-ray source, and thereby provide spectral attenuation data for a first energy interval when the filter intercepts the beam.
- spectral attenuation data is provided for a second energy interval, e.g.
- X-ray attenuation data for the energy intervals is generated in a time-sequential manner.
- Multiple filters, each with a different X-ray transmission spectrum, may be sequentially switched into, and out of, the X-ray beam in order to increase the number of energy intervals.
- the spectral CT data 110 that is received in the operation S110 may alternatively be generated by a spectral X-ray projection imaging system.
- Spectral X-ray projection imaging systems typically include a support arm such as a so-called "C-arm", also known as a gantry, that supports an X-ray source and an X-ray detector.
- Spectral X-ray projection imaging systems may alternatively include a support arm with a different shape to this example, such as an O-arm, for example.
- Spectral X-ray projection imaging systems typically generate projection data with the support arm held in a static position with respect to an imaging region during the acquisition of projection data. The projection data may be used to generate a 2D image.
- spectral X-ray projection imaging systems may also generate spectral CT data, i.e. data that can be reconstructed into a volumetric image.
- a spectral X-ray projection imaging system may generate spectral CT data for a region of interest by rotating its support arm around an axis of rotation and acquiring spectral X-ray projection data for the region of interest from multiple rotational angles around the axis of rotation.
- the set of spectral X-ray projection data from the multiple rotational angles represents spectral CT data because this may be reconstructed to provide a volumetric image.
- Various image reconstruction techniques may be used to reconstruct the set of spectral X-ray projection data from the multiple rotational angles into a volumetric image.
- spectral CT data 110 that is received in the operation S110 may alternatively be generated by a spectral X-ray projection imaging system.
- the spectral CT data 110 that is received in the operation S110 represents a distribution of a contrast agent in a vascular region.
- the vascular region comprises a plurality of vessels 120 1..i and background media 130.
- the vessels that are included in the vascular region are blood vessels.
- the blood vessels may be arteries, veins, capillaries, and so forth.
- the background media that are included in the vascular region are media other than blood vessels.
- the background media may be media such as tissue, plaque, bone, stent(s), interventional device(s), and so forth.
- the vascular region may be any vascular region in the anatomy.
- the vascular region may be the heart, for example.
- the contrast agent is injected into the vasculature prior to the acquisition of the spectral CT data and is transported by the blood in the vasculature to the vascular region.
- the contrast agent may be injected manually, or by using an injector such as the injector 230 illustrated in Fig. 2 , for example.
- the contrast agent may include various substances such as Iodine, or a Lanthanide such as Gadolinium, or another substance that provides visibility of the blood into which the contrast agent is injected.
- Fig. 3 is a schematic diagram illustrating an example of various elements of a method of providing a projection image representing a vascular region, in accordance with some aspects of the present disclosure.
- the spectral CT data 110 is illustrated in the form of a volumetric image representing the heart.
- darker regions of the spectral CT data 110 correspond to blood, and less-dark regions correspond to background media.
- the spectral CT data 110 is analyzed to provide i) volumetric contrast agent image data representing the distribution of the contrast agent, and ii) volumetric background image data representing the background media.
- the operation of analyzing S120 the spectral CT data 110 includes applying one or more material decomposition algorithms to the spectral CT data.
- a material decomposition algorithm that may be used is disclosed in a document by Brendel, B. et al., "Empirical, projection-based basis-component decomposition method", Medical Imaging 2009, Physics of Medical Imaging, edited by Ehsan Samei and Jiang Hsieh, Proc. of SPIE Vol. 7258, 72583Y .
- Another example of a material decomposition algorithm that may be used is disclosed in a document by Roessl, E.
- the volumetric contrast agent image data, and the volumetric background image data are reconstructed to provide a volumetric contrast agent image 140, and a volumetric background image 150, respectively.
- This operation is illustrated in Fig. 3 via the label S130, and the resulting volumetric contrast agent image 140, and the volumetric background image 150, are illustrated in Fig. 3b ).
- the operation S130 may be performed by reconstructing each set of data using known image reconstruction techniques.
- a proper subset 120 1 of the vessels in the volumetric contrast agent image 140, and the background media 130 in the volumetric background image 150 are projected from a same perspective, P, with respect to the vascular region, to provide a projected contrast agent image 160 representing the proper subset 120 1 of the vessels, and a projected background image 170 representing the background media 130, respectively.
- the proper subset 120 1 of the vessels in the volumetric contrast agent image 140 is a set of the vessels in the volumetric contrast agent image 140 that includes not all of the vessels in the volumetric contrast agent image 140.
- the proper subset 120 1 is a set of vessels selected from the vessels in the volumetric contrast agent image 140 in which at least one of the vessels in the volumetric contrast agent image 140 is omitted.
- the proper subset 120 1 of the vessels may include at least one coronary artery, for example.
- the proper subset 120 1 of the vessels includes only a single vessel from the volumetric contrast agent image 140.
- the method illustrated in Fig. 1 may also include an operation of identifying the proper subset 120 1 of the vessels in the volumetric contrast agent image 140.
- the proper subset 120 1 may include vessels such as left main "LM”, left anterior descending “LAD”, left circumflex artery “LCX”, the right coronary artery “RCA”, and so forth.
- the subset of the vessels may include other vessels.
- the proper subset 120 1 of the vessels in the volumetric contrast agent image 140 may be identified automatically.
- the identification of the proper subset 120 1 of the vessels in the volumetric contrast agent image 140 may include automatically segmenting and labelling the proper subset of the vessels in the volumetric contrast agent image.
- segmentation techniques maybe used for this purpose, such as model-based segmentation, semantic segmentation, and so forth.
- the operation of identifying a proper subset 120 1 of the vessels in the volumetric contrast agent image 140 includes receiving user input identifying the proper subset of the vessels.
- the volumetric contrast agent image 140 may be displayed, and the user may provide user input identifying the proper subset 120 1 of the vessels in the displayed volumetric contrast agent image 140.
- the identification of the proper subset 120 1 of the vessels in the volumetric contrast agent image 140 may be performed using a database.
- the database stores, for each of a plurality of injection catheter positions, a subset of one or more vessel(s) in the vascular region that are supplied by contrast agent as a consequence of an injection of the contrast agent at the corresponding injection catheter position.
- the proper subset 120 1 corresponding to a user selection of a displayed list of potential injection catheter positions is extracted from the database in response to the user selection, and the proper subset is identified in the volumetric contrast agent image 140 via the segmentation techniques mentioned above.
- Fig. 3c An example of the result of the projection of a proper subset 120 1 of the vessels in the volumetric contrast agent image 140 that is performed in the operation S 140 is illustrated in Fig. 3c ).
- the proper subset 120 1 of the vessels in the volumetric contrast agent image 140 that is projected is the left anterior descending "LAD" coronary artery, and this results in the projected contrast agent image 160 illustrated on the left-hand side of Fig. 3c ).
- the projected background image 170 is illustrated on the right-hand side of Fig. 3c ).
- the projected background image 170 represents media such as tissue, and so forth.
- the images 160 and 170 are obtained by projecting the corresponding volumetric images 140 and 150 from the same perspective, as illustrated by the arrow, P, in the images 140 and 150 in Fig.
- the perspective may be any perspective.
- the perspective, P is defined by a user.
- the perspective, P may correspond to a typical perspective for viewing the vessel(s), e.g. for performing a diagnosis of the vessel(s).
- the projection is performed in a mathematical sense, and may therefore be described as a "virtual" projection.
- the projection may involve projecting the volumetric images 140 and 150 onto a virtual X-ray detector using a geometrical arrangement of a virtual X-ray source, and a virtual X-ray detector, and the vascular region, that is similar to the geometry of the X-ray source, the X-ray detector, and the vascular region used to acquire the spectral CT data 110.
- the projected contrast agent image 160 and the projected background image 170 are combined to provide a combined projection image 180 representing the vascular region.
- FIG. 3d An example of the result of the operation S150 is illustrated in Fig. 3d ).
- the operation of combining S150 the projected contrast agent image 160 and the projected background image 170 comprises overlaying the projected contrast agent image and the projected background image to provide the combined projection image 180 representing the vascular region.
- the combined projection image 180 is outputted.
- the combined projection image 180 may be outputted in various ways, including in a visual format.
- the combined projection image 180 may be outputted to a display, such as the display 240 illustrated in Fig. 2 .
- the combined projection image 180 may be outputted to another destination, such as to a printer, or to another processor, or to a computer readable storage medium, and so forth.
- the combined projection image 180 has both an improved distinction between different materials, and an appearance that is similar to an angiographic projection image. In so doing, the method provides assistance to interventional cardiologists in diagnosing vascular regions using images that have been acquired using spectral CT imaging systems.
- the computer-implemented method described above may include one or more additional operations.
- the background media 130 comprises a plurality of different types of materials.
- the operation of analyzing S120 the spectral CT data 110 comprises analyzing the spectral CT data to provide volumetric background image data for each type of material present in the background media.
- the operation of reconstructing the volumetric background image data comprises reconstructing the volumetric background image data for each type of material to provide a volumetric background image wherein the different types of materials are distinguished from each other.
- Volumetric background images may be generated for materials such as contrast agent, tissue, hard or soft plaque, bone, stent material, interventional devices, and so forth in this reconstruction operation.
- the operations of projecting S140, combining S150, and outputting S 160 are performed such that the distinction between the different types of material is maintained in the combined projection image 180.
- the volumetric background image data for each type of material present in the background media 130 may be projected separately, each from the same perspective, P, with respect to the vascular region, to provide a projected background image for each type of material present in the background media 130.
- the combining operation S150 may include overlaying the projected background images for each type of material present in the background media 130, such that the distinction between the different types of material is maintained in the combined projection image 180.
- this example further assists interventional cardiologists in diagnosing vascular regions by providing a distinction between the different materials in the background media. This enables the interventional cardiologist to benefit from the advantages of material identification that are available when using spectral CT data, and consequently to provide a more accurate diagnosis of the vascular region.
- the reconstruction operation S130 is performed at two different levels of image resolution.
- the reconstructing operation S130 comprises:
- an initial reconstruction operation is performed at a first image resolution, and then a subsequent reconstruction operation is performed within a region of interest encompassing the identified proper subset 120 1 of the vessels.
- the subset of the vessels may be identified using the techniques described above.
- the subsequent reconstruction operation is performed at a relatively higher image resolution than the first reconstruction operation.
- the result is to provide a volumetric contrast agent image, and a volumetric background image, which have a relatively higher image resolution in the region of interest encompassing the proper subset 120 1 of the vessels than outside the region of interest.
- this example facilitates a rapid reconstruction of regions details outside of the proper subset 120 1 of the vessels, and also enables a physician to provide a more accurate diagnosis of the proper subset 120 1 of the vessels.
- regions of interest may be defined similarly in each of the initial volumetric contrast agent image and the initial volumetric background image. These regions of interest may correspond materials such as plaque, for example. These regions of interest may be reconstructed at a relatively higher image resolution than both the subsequent volumetric contrast agent image and the subsequent volumetric background image, and consequently provide an even higher level of detail in regions of interest such as plaque.
- the method includes segmenting at least one anatomical structure in the volumetric background image 150, and the projecting S 140, the combining S150, and the outputting S160, are performed such that the segmentation of the at least one anatomical structure is maintained in the combined projection image 180.
- This example further assists interventional cardiologists in diagnosing vascular regions by providing the delineation of the anatomical structures in the combined projection image 180.
- anatomical structures such as chambers of the heart, plaque, and so forth may be segmented.
- Various segmentation algorithms may be used for this purpose, such as model-based segmentation, watershed-based segmentation, region growing, level sets, graphcuts, and neural networks, for example.
- the segmentation of the at least one anatomical structure can be maintained in the combined projection image 180 by providing the delineation of the anatomical structures in the volumetric background image 150.
- a separate volumetric image that includes only the delineation of these structures may be generated, and this volumetric image may be projected from the same perspective, P, as the volumetric background image 150, to provide a separate image representing the projected delineation of the anatomical structures, and this image combined, e.g. as an overlay image, with the projected contrast agent image 160 and the projected background image 170 , in the operation S150, to provide the combined projection image 180.
- the method includes generating a measurement of at least one vessel in the volumetric contrast agent image 140, and outputting an indication of the value of the at least one measurement.
- the measurement may be a measurement such as a width of a vessel, a width of a stenosis in a vessel, a length of a vessel, a measurement of a lesion size in a vessel, a measurement of an amount of plaque, for instance.
- the measurement may represent a boundary condition for use in simulating a pressure wire pullback curve, for example. Such measurements may be obtained using image processing techniques.
- the method includes:
- This example further assists interventional cardiologists in diagnosing the vascular region by providing the value of the blood flow parameter.
- the values of blood flow parameters such as the Fractional Flow Reserve "FFR”, the instantaneous wave-free ratio "IFR", and so forth, may be calculated.
- a calculation of the FFR value may be made using geometric measurements of the vessel that are obtained from the combined projection image 180.
- the simulation of the blood flow may be performed using a haemodynamic model to calculate the pressure values P d and P a using the geometric measurements of the vessel.
- the distal position When measured for a stenosis, the distal position may be distal to the stenosis.
- An example of a haemodynamic model that may be used in this example is disclosed in a document by Nickisch et al., "Learning Patient-Specific Lumped Models for Interactive Coronary Blood Flow Simulations", MICCAI, 2015 .
- a lumped model may alternatively be used to calculate an FFR value, as described in the document WO 2016/001017 A1 .
- a value for the IFR may be calculated using the same Equation as the FFR.
- the IFR differs from that FFR in that the FFR is measured during the wave-free period during diastole. This wave-free period may be determined for a vasculature based on a received electrocardiogram signal, for example.
- the method includes:
- the amount of contrast agent in the myocardial tissue is a useful parameter in diagnosing the vascular region for vascular diseases such as CAD.
- the amount of contrast agent in the myocardial tissue is also a useful as a boundary condition in simulating blood flow.
- the amount of contrast agent in the myocardial tissue may be used to calculate the value of blood flow parameters such as the FFR, and the IFR.
- the method includes:
- the fluoroscopic image data that is received in this example may be generated by a projection X-ray imaging system, or by a CT imaging system. Fluoroscopic images are often acquired during treatment procedures in order to perform tasks such as navigating interventional devices to a treatment site, and so forth. Fluoroscopic images indicate radiopaque materials such as interventional devices, and also dense portions of the anatomy such as bone. However, the vasculature, and soft tissue, are poorly represented in fluoroscopic images. Consequently, in order to visualize the vasculature during procedures such as interventional device navigation, a contrast agent is typically intermittently injected into the vasculature. The use of contrast agent is however desirably minimized in view of potential heath risks.
- this example facilitates the real-time navigation of interventional devices to the treatment site with reduced use of contrast agent.
- the registration of the combined projection image 180 with the images in the live sequence may also be used in other tasks such as in treatment planning.
- the method includes performing an analysis of the combined projection image 180 to detect the presence of vascular disease.
- the analysis that is performed in this operation may be performed using a trained neural network, for example.
- the vascular disease that is diagnosed in this example may be definite ischemia diagnosis "DID", or another type of vascular disease.
- DID definite ischemia diagnosis
- One example of a neural network that may be used to diagnose vascular disease is disclosed in a document by Danilov, V., et al., "Real-time coronary artery stenosis detection based on modern neural networks", Sci Rep 11, 7582 (2021). https://doi.org/10.1038/s41598-021-87174-2 .
- a computer program product comprises instructions which when executed by one or more processors, cause the one or more processors to carry out a method of providing a projection image representing a vascular region.
- the method comprises:
- a system 200 for providing a projection image representing a vascular region comprises one or more processors 210 configured to:
Landscapes
- Physics & Mathematics (AREA)
- General Physics & Mathematics (AREA)
- Engineering & Computer Science (AREA)
- Theoretical Computer Science (AREA)
- Apparatus For Radiation Diagnosis (AREA)
Priority Applications (2)
| Application Number | Priority Date | Filing Date | Title |
|---|---|---|---|
| PCT/EP2024/075057 WO2025061493A1 (fr) | 2023-09-18 | 2024-09-09 | Fourniture d'une image de projection d'une région vasculaire |
| CN202480059646.9A CN121889829A (zh) | 2023-09-18 | 2024-09-09 | 提供血管区域的投影图像 |
Applications Claiming Priority (1)
| Application Number | Priority Date | Filing Date | Title |
|---|---|---|---|
| US202363538891P | 2023-09-18 | 2023-09-18 |
Publications (1)
| Publication Number | Publication Date |
|---|---|
| EP4524890A1 true EP4524890A1 (fr) | 2025-03-19 |
Family
ID=88373699
Family Applications (1)
| Application Number | Title | Priority Date | Filing Date |
|---|---|---|---|
| EP23202936.3A Withdrawn EP4524890A1 (fr) | 2023-09-18 | 2023-10-11 | Fourniture d'une image de projection d'une région vasculaire |
Country Status (1)
| Country | Link |
|---|---|
| EP (1) | EP4524890A1 (fr) |
Citations (8)
| Publication number | Priority date | Publication date | Assignee | Title |
|---|---|---|---|---|
| WO2007034359A2 (fr) | 2005-09-22 | 2007-03-29 | Philips Intellectual Property & Standards Gmbh | Decomposition materielle quantitative pour scanographie spectrale |
| WO2008047270A1 (fr) * | 2006-10-17 | 2008-04-24 | Koninklijke Philips Electronics N.V. | Visualisation d'images tridimensionnelles en association avec des images de projection bidimensionnelle |
| WO2012123896A2 (fr) * | 2011-03-17 | 2012-09-20 | Koninklijke Philips Electronics N.V. | Imagerie cardiaque multimodalité |
| WO2016001017A1 (fr) | 2014-06-30 | 2016-01-07 | Koninklijke Philips N.V. | Appareil pour déterminer une valeur de réserve de débit fractionnaire |
| US20160371862A1 (en) * | 2015-06-22 | 2016-12-22 | Toshiba Medical Systems Corporation | Metal artifact reduction for 3d-digtial subtraction angiography |
| EP4162879A1 (fr) * | 2021-10-05 | 2023-04-12 | Koninklijke Philips N.V. | Détermination des paramètres de vaisseau |
| WO2023072752A1 (fr) * | 2021-10-27 | 2023-05-04 | Koninklijke Philips N.V. | Notation d'image de projection de rayons x |
| EP4197429A1 (fr) * | 2021-12-14 | 2023-06-21 | Koninklijke Philips N.V. | Système et procédé pour déterminer la masse partielle d'un organe |
-
2023
- 2023-10-11 EP EP23202936.3A patent/EP4524890A1/fr not_active Withdrawn
Patent Citations (8)
| Publication number | Priority date | Publication date | Assignee | Title |
|---|---|---|---|---|
| WO2007034359A2 (fr) | 2005-09-22 | 2007-03-29 | Philips Intellectual Property & Standards Gmbh | Decomposition materielle quantitative pour scanographie spectrale |
| WO2008047270A1 (fr) * | 2006-10-17 | 2008-04-24 | Koninklijke Philips Electronics N.V. | Visualisation d'images tridimensionnelles en association avec des images de projection bidimensionnelle |
| WO2012123896A2 (fr) * | 2011-03-17 | 2012-09-20 | Koninklijke Philips Electronics N.V. | Imagerie cardiaque multimodalité |
| WO2016001017A1 (fr) | 2014-06-30 | 2016-01-07 | Koninklijke Philips N.V. | Appareil pour déterminer une valeur de réserve de débit fractionnaire |
| US20160371862A1 (en) * | 2015-06-22 | 2016-12-22 | Toshiba Medical Systems Corporation | Metal artifact reduction for 3d-digtial subtraction angiography |
| EP4162879A1 (fr) * | 2021-10-05 | 2023-04-12 | Koninklijke Philips N.V. | Détermination des paramètres de vaisseau |
| WO2023072752A1 (fr) * | 2021-10-27 | 2023-05-04 | Koninklijke Philips N.V. | Notation d'image de projection de rayons x |
| EP4197429A1 (fr) * | 2021-12-14 | 2023-06-21 | Koninklijke Philips N.V. | Système et procédé pour déterminer la masse partielle d'un organe |
Non-Patent Citations (8)
Similar Documents
| Publication | Publication Date | Title |
|---|---|---|
| EP4486213B1 (fr) | Mesure des paramètres du débit sanguin | |
| EP3600045B1 (fr) | Synthèse d'images de perfusion myocardique en tomographie | |
| US7853061B2 (en) | System and method to improve visibility of an object in an imaged subject | |
| JP4728627B2 (ja) | Ct血管造影法における構造を領域分割する方法及び装置 | |
| US8718338B2 (en) | System and method to compensate for respiratory motion in acquired radiography images | |
| US20260011006A1 (en) | Determining a value of a blood flow parameter | |
| CN101529475A (zh) | 3d图像结合2d投影图像的呈现 | |
| EP4311496A1 (fr) | Paramètres de débit sanguin | |
| Wink et al. | Coronary computed tomographic angiography in the cardiac catheterization laboratory: current applications and future developments | |
| EP4498919B1 (fr) | Gradient d'atténuation d'agent de contraste | |
| EP4524890A1 (fr) | Fourniture d'une image de projection d'une région vasculaire | |
| EP4601546B1 (fr) | Fourniture d'informations de guidage pour une procédure d'extraction de dispositif implantable | |
| WO2025061493A1 (fr) | Fourniture d'une image de projection d'une région vasculaire | |
| US20030169254A1 (en) | Method for producing an image sequence from volume datasets | |
| EP4311493A1 (fr) | Données de projection spectrale de rayons x | |
| EP4730358A1 (fr) | Réalisation d'une simulation hémodynamique | |
| US20250384558A1 (en) | Providing a classified data set | |
| EP4651080A1 (fr) | Fourniture d'une représentation d'image d'une région anatomique | |
| CN121712449A (zh) | 针对x射线荧光透视的能谱分离 |
Legal Events
| Date | Code | Title | Description |
|---|---|---|---|
| PUAI | Public reference made under article 153(3) epc to a published international application that has entered the european phase |
Free format text: ORIGINAL CODE: 0009012 |
|
| STAA | Information on the status of an ep patent application or granted ep patent |
Free format text: STATUS: THE APPLICATION HAS BEEN PUBLISHED |
|
| AK | Designated contracting states |
Kind code of ref document: A1 Designated state(s): AL AT BE BG CH CY CZ DE DK EE ES FI FR GB GR HR HU IE IS IT LI LT LU LV MC ME MK MT NL NO PL PT RO RS SE SI SK SM TR |
|
| STAA | Information on the status of an ep patent application or granted ep patent |
Free format text: STATUS: THE APPLICATION IS DEEMED TO BE WITHDRAWN |
|
| 18D | Application deemed to be withdrawn |
Effective date: 20250920 |