EP4534687A2 - Fragmentierung zur messung der methylierung und erkrankung - Google Patents
Fragmentierung zur messung der methylierung und erkrankung Download PDFInfo
- Publication number
- EP4534687A2 EP4534687A2 EP25152224.9A EP25152224A EP4534687A2 EP 4534687 A2 EP4534687 A2 EP 4534687A2 EP 25152224 A EP25152224 A EP 25152224A EP 4534687 A2 EP4534687 A2 EP 4534687A2
- Authority
- EP
- European Patent Office
- Prior art keywords
- methylation
- cell
- amount
- cleavage
- ncg
- Prior art date
- Legal status (The legal status is an assumption and is not a legal conclusion. Google has not performed a legal analysis and makes no representation as to the accuracy of the status listed.)
- Pending
Links
Images













































Classifications
-
- C—CHEMISTRY; METALLURGY
- C12—BIOCHEMISTRY; BEER; SPIRITS; WINE; VINEGAR; MICROBIOLOGY; ENZYMOLOGY; MUTATION OR GENETIC ENGINEERING
- C12Q—MEASURING OR TESTING PROCESSES INVOLVING ENZYMES, NUCLEIC ACIDS OR MICROORGANISMS; COMPOSITIONS OR TEST PAPERS THEREFOR; PROCESSES OF PREPARING SUCH COMPOSITIONS; CONDITION-RESPONSIVE CONTROL IN MICROBIOLOGICAL OR ENZYMOLOGICAL PROCESSES
- C12Q1/00—Measuring or testing processes involving enzymes, nucleic acids or microorganisms; Compositions therefor; Processes of preparing such compositions
- C12Q1/68—Measuring or testing processes involving enzymes, nucleic acids or microorganisms; Compositions therefor; Processes of preparing such compositions involving nucleic acids
- C12Q1/6876—Nucleic acid products used in the analysis of nucleic acids, e.g. primers or probes
- C12Q1/6883—Nucleic acid products used in the analysis of nucleic acids, e.g. primers or probes for diseases caused by alterations of genetic material
-
- C—CHEMISTRY; METALLURGY
- C12—BIOCHEMISTRY; BEER; SPIRITS; WINE; VINEGAR; MICROBIOLOGY; ENZYMOLOGY; MUTATION OR GENETIC ENGINEERING
- C12Q—MEASURING OR TESTING PROCESSES INVOLVING ENZYMES, NUCLEIC ACIDS OR MICROORGANISMS; COMPOSITIONS OR TEST PAPERS THEREFOR; PROCESSES OF PREPARING SUCH COMPOSITIONS; CONDITION-RESPONSIVE CONTROL IN MICROBIOLOGICAL OR ENZYMOLOGICAL PROCESSES
- C12Q1/00—Measuring or testing processes involving enzymes, nucleic acids or microorganisms; Compositions therefor; Processes of preparing such compositions
- C12Q1/68—Measuring or testing processes involving enzymes, nucleic acids or microorganisms; Compositions therefor; Processes of preparing such compositions involving nucleic acids
- C12Q1/6844—Nucleic acid amplification reactions
- C12Q1/6851—Quantitative amplification
-
- C—CHEMISTRY; METALLURGY
- C12—BIOCHEMISTRY; BEER; SPIRITS; WINE; VINEGAR; MICROBIOLOGY; ENZYMOLOGY; MUTATION OR GENETIC ENGINEERING
- C12Q—MEASURING OR TESTING PROCESSES INVOLVING ENZYMES, NUCLEIC ACIDS OR MICROORGANISMS; COMPOSITIONS OR TEST PAPERS THEREFOR; PROCESSES OF PREPARING SUCH COMPOSITIONS; CONDITION-RESPONSIVE CONTROL IN MICROBIOLOGICAL OR ENZYMOLOGICAL PROCESSES
- C12Q1/00—Measuring or testing processes involving enzymes, nucleic acids or microorganisms; Compositions therefor; Processes of preparing such compositions
- C12Q1/68—Measuring or testing processes involving enzymes, nucleic acids or microorganisms; Compositions therefor; Processes of preparing such compositions involving nucleic acids
- C12Q1/6869—Methods for sequencing
-
- C—CHEMISTRY; METALLURGY
- C12—BIOCHEMISTRY; BEER; SPIRITS; WINE; VINEGAR; MICROBIOLOGY; ENZYMOLOGY; MUTATION OR GENETIC ENGINEERING
- C12Q—MEASURING OR TESTING PROCESSES INVOLVING ENZYMES, NUCLEIC ACIDS OR MICROORGANISMS; COMPOSITIONS OR TEST PAPERS THEREFOR; PROCESSES OF PREPARING SUCH COMPOSITIONS; CONDITION-RESPONSIVE CONTROL IN MICROBIOLOGICAL OR ENZYMOLOGICAL PROCESSES
- C12Q1/00—Measuring or testing processes involving enzymes, nucleic acids or microorganisms; Compositions therefor; Processes of preparing such compositions
- C12Q1/68—Measuring or testing processes involving enzymes, nucleic acids or microorganisms; Compositions therefor; Processes of preparing such compositions involving nucleic acids
- C12Q1/6876—Nucleic acid products used in the analysis of nucleic acids, e.g. primers or probes
- C12Q1/6883—Nucleic acid products used in the analysis of nucleic acids, e.g. primers or probes for diseases caused by alterations of genetic material
- C12Q1/6886—Nucleic acid products used in the analysis of nucleic acids, e.g. primers or probes for diseases caused by alterations of genetic material for cancer
-
- C—CHEMISTRY; METALLURGY
- C12—BIOCHEMISTRY; BEER; SPIRITS; WINE; VINEGAR; MICROBIOLOGY; ENZYMOLOGY; MUTATION OR GENETIC ENGINEERING
- C12Q—MEASURING OR TESTING PROCESSES INVOLVING ENZYMES, NUCLEIC ACIDS OR MICROORGANISMS; COMPOSITIONS OR TEST PAPERS THEREFOR; PROCESSES OF PREPARING SUCH COMPOSITIONS; CONDITION-RESPONSIVE CONTROL IN MICROBIOLOGICAL OR ENZYMOLOGICAL PROCESSES
- C12Q1/00—Measuring or testing processes involving enzymes, nucleic acids or microorganisms; Compositions therefor; Processes of preparing such compositions
- C12Q1/68—Measuring or testing processes involving enzymes, nucleic acids or microorganisms; Compositions therefor; Processes of preparing such compositions involving nucleic acids
- C12Q1/6876—Nucleic acid products used in the analysis of nucleic acids, e.g. primers or probes
- C12Q1/6888—Nucleic acid products used in the analysis of nucleic acids, e.g. primers or probes for detection or identification of organisms
-
- C—CHEMISTRY; METALLURGY
- C12—BIOCHEMISTRY; BEER; SPIRITS; WINE; VINEGAR; MICROBIOLOGY; ENZYMOLOGY; MUTATION OR GENETIC ENGINEERING
- C12Q—MEASURING OR TESTING PROCESSES INVOLVING ENZYMES, NUCLEIC ACIDS OR MICROORGANISMS; COMPOSITIONS OR TEST PAPERS THEREFOR; PROCESSES OF PREPARING SUCH COMPOSITIONS; CONDITION-RESPONSIVE CONTROL IN MICROBIOLOGICAL OR ENZYMOLOGICAL PROCESSES
- C12Q1/00—Measuring or testing processes involving enzymes, nucleic acids or microorganisms; Compositions therefor; Processes of preparing such compositions
- C12Q1/70—Measuring or testing processes involving enzymes, nucleic acids or microorganisms; Compositions therefor; Processes of preparing such compositions involving virus or bacteriophage
-
- C—CHEMISTRY; METALLURGY
- C12—BIOCHEMISTRY; BEER; SPIRITS; WINE; VINEGAR; MICROBIOLOGY; ENZYMOLOGY; MUTATION OR GENETIC ENGINEERING
- C12Q—MEASURING OR TESTING PROCESSES INVOLVING ENZYMES, NUCLEIC ACIDS OR MICROORGANISMS; COMPOSITIONS OR TEST PAPERS THEREFOR; PROCESSES OF PREPARING SUCH COMPOSITIONS; CONDITION-RESPONSIVE CONTROL IN MICROBIOLOGICAL OR ENZYMOLOGICAL PROCESSES
- C12Q1/00—Measuring or testing processes involving enzymes, nucleic acids or microorganisms; Compositions therefor; Processes of preparing such compositions
- C12Q1/70—Measuring or testing processes involving enzymes, nucleic acids or microorganisms; Compositions therefor; Processes of preparing such compositions involving virus or bacteriophage
- C12Q1/701—Specific hybridization probes
-
- C—CHEMISTRY; METALLURGY
- C12—BIOCHEMISTRY; BEER; SPIRITS; WINE; VINEGAR; MICROBIOLOGY; ENZYMOLOGY; MUTATION OR GENETIC ENGINEERING
- C12Q—MEASURING OR TESTING PROCESSES INVOLVING ENZYMES, NUCLEIC ACIDS OR MICROORGANISMS; COMPOSITIONS OR TEST PAPERS THEREFOR; PROCESSES OF PREPARING SUCH COMPOSITIONS; CONDITION-RESPONSIVE CONTROL IN MICROBIOLOGICAL OR ENZYMOLOGICAL PROCESSES
- C12Q1/00—Measuring or testing processes involving enzymes, nucleic acids or microorganisms; Compositions therefor; Processes of preparing such compositions
- C12Q1/70—Measuring or testing processes involving enzymes, nucleic acids or microorganisms; Compositions therefor; Processes of preparing such compositions involving virus or bacteriophage
- C12Q1/701—Specific hybridization probes
- C12Q1/706—Specific hybridization probes for hepatitis
- C12Q1/707—Specific hybridization probes for hepatitis non-A, non-B Hepatitis, excluding hepatitis D
-
- G—PHYSICS
- G16—INFORMATION AND COMMUNICATION TECHNOLOGY [ICT] SPECIALLY ADAPTED FOR SPECIFIC APPLICATION FIELDS
- G16B—BIOINFORMATICS, i.e. INFORMATION AND COMMUNICATION TECHNOLOGY [ICT] SPECIALLY ADAPTED FOR GENETIC OR PROTEIN-RELATED DATA PROCESSING IN COMPUTATIONAL MOLECULAR BIOLOGY
- G16B20/00—ICT specially adapted for functional genomics or proteomics, e.g. genotype-phenotype associations
-
- G—PHYSICS
- G16—INFORMATION AND COMMUNICATION TECHNOLOGY [ICT] SPECIALLY ADAPTED FOR SPECIFIC APPLICATION FIELDS
- G16B—BIOINFORMATICS, i.e. INFORMATION AND COMMUNICATION TECHNOLOGY [ICT] SPECIALLY ADAPTED FOR GENETIC OR PROTEIN-RELATED DATA PROCESSING IN COMPUTATIONAL MOLECULAR BIOLOGY
- G16B20/00—ICT specially adapted for functional genomics or proteomics, e.g. genotype-phenotype associations
- G16B20/30—Detection of binding sites or motifs
-
- G—PHYSICS
- G16—INFORMATION AND COMMUNICATION TECHNOLOGY [ICT] SPECIALLY ADAPTED FOR SPECIFIC APPLICATION FIELDS
- G16B—BIOINFORMATICS, i.e. INFORMATION AND COMMUNICATION TECHNOLOGY [ICT] SPECIALLY ADAPTED FOR GENETIC OR PROTEIN-RELATED DATA PROCESSING IN COMPUTATIONAL MOLECULAR BIOLOGY
- G16B30/00—ICT specially adapted for sequence analysis involving nucleotides or amino acids
- G16B30/10—Sequence alignment; Homology search
-
- G—PHYSICS
- G16—INFORMATION AND COMMUNICATION TECHNOLOGY [ICT] SPECIALLY ADAPTED FOR SPECIFIC APPLICATION FIELDS
- G16B—BIOINFORMATICS, i.e. INFORMATION AND COMMUNICATION TECHNOLOGY [ICT] SPECIALLY ADAPTED FOR GENETIC OR PROTEIN-RELATED DATA PROCESSING IN COMPUTATIONAL MOLECULAR BIOLOGY
- G16B40/00—ICT specially adapted for biostatistics; ICT specially adapted for bioinformatics-related machine learning or data mining, e.g. knowledge discovery or pattern finding
-
- G—PHYSICS
- G16—INFORMATION AND COMMUNICATION TECHNOLOGY [ICT] SPECIALLY ADAPTED FOR SPECIFIC APPLICATION FIELDS
- G16B—BIOINFORMATICS, i.e. INFORMATION AND COMMUNICATION TECHNOLOGY [ICT] SPECIALLY ADAPTED FOR GENETIC OR PROTEIN-RELATED DATA PROCESSING IN COMPUTATIONAL MOLECULAR BIOLOGY
- G16B40/00—ICT specially adapted for biostatistics; ICT specially adapted for bioinformatics-related machine learning or data mining, e.g. knowledge discovery or pattern finding
- G16B40/20—Supervised data analysis
-
- G—PHYSICS
- G16—INFORMATION AND COMMUNICATION TECHNOLOGY [ICT] SPECIALLY ADAPTED FOR SPECIFIC APPLICATION FIELDS
- G16B—BIOINFORMATICS, i.e. INFORMATION AND COMMUNICATION TECHNOLOGY [ICT] SPECIALLY ADAPTED FOR GENETIC OR PROTEIN-RELATED DATA PROCESSING IN COMPUTATIONAL MOLECULAR BIOLOGY
- G16B50/00—ICT programming tools or database systems specially adapted for bioinformatics
-
- G—PHYSICS
- G16—INFORMATION AND COMMUNICATION TECHNOLOGY [ICT] SPECIALLY ADAPTED FOR SPECIFIC APPLICATION FIELDS
- G16H—HEALTHCARE INFORMATICS, i.e. INFORMATION AND COMMUNICATION TECHNOLOGY [ICT] SPECIALLY ADAPTED FOR THE HANDLING OR PROCESSING OF MEDICAL OR HEALTHCARE DATA
- G16H50/00—ICT specially adapted for medical diagnosis, medical simulation or medical data mining; ICT specially adapted for detecting, monitoring or modelling epidemics or pandemics
- G16H50/20—ICT specially adapted for medical diagnosis, medical simulation or medical data mining; ICT specially adapted for detecting, monitoring or modelling epidemics or pandemics for computer-aided diagnosis, e.g. based on medical expert systems
-
- C—CHEMISTRY; METALLURGY
- C12—BIOCHEMISTRY; BEER; SPIRITS; WINE; VINEGAR; MICROBIOLOGY; ENZYMOLOGY; MUTATION OR GENETIC ENGINEERING
- C12Q—MEASURING OR TESTING PROCESSES INVOLVING ENZYMES, NUCLEIC ACIDS OR MICROORGANISMS; COMPOSITIONS OR TEST PAPERS THEREFOR; PROCESSES OF PREPARING SUCH COMPOSITIONS; CONDITION-RESPONSIVE CONTROL IN MICROBIOLOGICAL OR ENZYMOLOGICAL PROCESSES
- C12Q1/00—Measuring or testing processes involving enzymes, nucleic acids or microorganisms; Compositions therefor; Processes of preparing such compositions
- C12Q1/68—Measuring or testing processes involving enzymes, nucleic acids or microorganisms; Compositions therefor; Processes of preparing such compositions involving nucleic acids
- C12Q1/6806—Preparing nucleic acids for analysis, e.g. for polymerase chain reaction [PCR] assay
-
- C—CHEMISTRY; METALLURGY
- C12—BIOCHEMISTRY; BEER; SPIRITS; WINE; VINEGAR; MICROBIOLOGY; ENZYMOLOGY; MUTATION OR GENETIC ENGINEERING
- C12Q—MEASURING OR TESTING PROCESSES INVOLVING ENZYMES, NUCLEIC ACIDS OR MICROORGANISMS; COMPOSITIONS OR TEST PAPERS THEREFOR; PROCESSES OF PREPARING SUCH COMPOSITIONS; CONDITION-RESPONSIVE CONTROL IN MICROBIOLOGICAL OR ENZYMOLOGICAL PROCESSES
- C12Q2600/00—Oligonucleotides characterized by their use
- C12Q2600/154—Methylation markers
-
- G—PHYSICS
- G01—MEASURING; TESTING
- G01N—INVESTIGATING OR ANALYSING MATERIALS BY DETERMINING THEIR CHEMICAL OR PHYSICAL PROPERTIES
- G01N2800/00—Detection or diagnosis of diseases
Definitions
- cfDNA Cell-free DNA
- cfDNA Cell-free DNA
- the association between cfDNA fragmentation patterns and nucleosome structures has been demonstrated in a number of studies ( Sun et al. Proc Natl Acad Sci UAS. 2018;115:E5106 ; Snyder et al. Cell. 2016;164:57-68 ).
- the characteristic size profile of cfDNA shows a modal frequency at approximately 166 bp, with smaller molecules forming a series of peaks in a 10-bp periodicity ( Lo et al. Sci Transl Med. 2010;2:61ra91 ).
- “Clinically-relevant DNA” can refer to DNA of a particular tissue source that is to be measured, e.g., to determine a fractional concentration of such DNA or to classify a phenotype of a sample (e.g., plasma).
- a sample e.g., plasma
- clinically-relevant DNA are fetal DNA in maternal plasma or tumor DNA in a patient's plasma or other sample with cell-free DNA.
- Another example includes the measurement of the amount of graft-associated DNA in the plasma, serum, or urine of a transplant patient.
- a further example includes the measurement of the fractional concentrations of hematopoietic and nonhematopoietic DNA in the plasma of a subject, or fractional concentration of a liver DNA fragments (or other tissue) in a sample or fractional concentration of brain DNA fragments in cerebrospinal fluid.
- sequence read refers to a string of nucleotides sequenced from any part or all of a nucleic acid molecule.
- a sequence read may be a short string of nucleotides (e.g., 20-150 nucleotides) sequenced from a nucleic acid fragment, a short string of nucleotides at one or both ends of a nucleic acid fragment, or the sequencing of the entire nucleic acid fragment that exists in the biological sample.
- a sequence read may be obtained in a variety of ways, e.g., using sequencing techniques or using probes, e.g., in hybridization arrays or capture probes as may be used in microarrays, or amplification techniques, such as the polymerase chain reaction (PCR) or linear amplification using a single primer or isothermal amplification.
- Example sequencing techniques include massively parallel sequencing, targeted sequencing, Sanger sequencing, sequencing by ligation, ion semiconductor sequencing, and single molecule sequencing (e.g., using a nanopore, or single-molecule real-time sequencing (e.g. from Pacific Biosciences)).
- Example PCR techniques include real-time PCR and digital PCR (e.g. droplet digital PCR).
- sequence reads can be analyzed, e.g., at least 1,000 sequence reads can be analyzed. As other examples, at least 10,000 or 50,000 or 100,000 or 500,000 or 1,000,000 or 5,000,000 sequence reads, or more, can be analyzed.
- a sequence read can include an " ending sequence" associated with an end of a fragment.
- the ending sequence can correspond to the outermost N bases of the fragment, e.g., 1-30 bases at the end of the fragment. If a sequence read corresponds to an entire fragment, then the sequence read can include two ending sequences. When paired-end sequencing provides two sequence reads that correspond to the ends of the fragments, each sequence read can include one ending sequence.
- a “sequence motif' may refer to a short, recurring pattern of bases in DNA fragments (e.g., cell-free DNA fragments).
- a sequence motif can occur at an end of a fragment, and thus be part of or include an ending sequence.
- An "end motif” (also referred to as a “end sequence motif”) can refer to a sequence motif for an ending sequence that preferentially occurs at ends of DNA fragments, potentially for a particular type of tissue.
- An end motif may also occur just before or just after ends of a fragment, thereby still corresponding to an ending sequence.
- a nuclease can have a specific cutting preference for a particular end motif, as well as a second most preferred cutting preference for a second end motif.
- the number of nucleotides (nt) at the fragment ends used for analysis could be, for example, but not limited to, 1 nt, 2 nt, 3 nt, 4 nt, 5 nt, 6 nt, 7 nt, 8 nt, 9 nt, and 10 nt or above.
- the fragment end motif could be defined by one or more nucleotides across positions nearby the end of a fragment.
- the fragment end motif could be defined by one or more nucleotides in a reference genome surrounding the genomic locus to which the end of a fragment is aligned.
- a " site” (also called a “ genomic site ”) corresponds to a single site, which may be a single base position or a group of correlated base positions, e.g., a CpG site, TSS site, DNase hypersensitivity site, or larger group of correlated base positions.
- a "locus” may correspond to a region that includes multiple sites. A locus can include just one site, which would make the locus equivalent to a site in that context. Various number of regions, sites, or loci can be analyzed, e.g., 50, 100, 200, 500, 1,000, 5,000, 10,000, 50,000, 100,000, 500,000, one million, or more.
- Various techniques can determine a DNA molecule is located at one or more genomic positions in a reference genome, e.g., alignment of a sequence read to the reference genome or using position-specific probes.
- the position determination can be to some or all of the reference genome, e.g., if only part of the genome is being analyzed.
- the amount of the genome analyzed can be greater than 0.01%, 0.1%, 1%, 5%, 10%, or 50%.
- a " cutting site" can refer to a location that DNA was cut by a nuclease, thereby resulting in a DNA fragment.
- a "cleavage profile” can refer to amounts of fragments that end at two or more positions that occur in a window around a site (e.g., a CpG site).
- the amounts of fragments may correspond to different categories according to end motifs (e.g., CGN and NCG for positions 0 and -1, respectively).
- the amounts can be normalized, e.g., as using a sequencing depth at each position, depth in a region, or number of fragments ending in a region. Such a normalized amount at a single position can be referred to as a cleavage ratio, cleavage amount, or a cleavage density.
- a cleavage profile could be defined as patterns of the ratios between fragment ends and the sequencing depth across genomic coordinates within a window related to a CpG site, which could be used to deduce the methylation patterns of that CpG site.
- the window could include, but not limited to, X nucleotides (i.e., X-nt) upstream and Y nucleotides (i.e., Y-nt) downstream of a CpG site.
- the values of X and Y could be 1, 2, 3, 4, 5, 6, 7, 8, 9, 10, 15, 20, 30, 40, 50, 100, 1000, 5000, etc.
- the window can cover a nucleosome size range upstream and downstream of CpG site, e.g., -160 nt to 160 nt.
- a differentially methylated region is a genomic region with different DNA methylation status across two or more biological samples.
- the different DNA methylation status may be defined by the certain difference in methylation index or density, such as but not limited to 1%, 5%, 10%, 20%, 30%, 40%, 50%, 60%, 70%, 80%, 90%, 95%, 99%, etc.
- An “ aggregate value" may refer to a collective property, e.g., of relative frequencies of a set of end motifs. Examples include a mean, a median, a sum of relative frequencies, a variation among the relative frequencies (e.g., entropy, standard deviation (SD), the coefficient of variation (CV), interquartile range (IQR) or a certain percentile cutoff (e.g., 95 th or 99 th percentile) among different relative frequencies), or a difference (e.g., a distance) from a reference pattern of relative frequencies, as may be implemented in clustering.
- an aggregate value can comprise an array/vector of relative frequencies, which can be compared to a reference vector (e.g., representing a multidimensional data point).
- the model may include linear regression, logistic regression, deep recurrent neural network (e.g., long short term memory, LSTM), hidden Markov model (HMM), linear discriminant analysis (LDA), k-means clustering, density-based spatial clustering of applications with noise (DBSCAN), random forest algorithm, support vector machine (SVM), or any model described herein.
- Supervised learning models can be trained in various ways using various cost/loss functions that define the error from the known label (e.g., least squares and absolute difference from known classification) and various optimization techniques, e.g., using backpropagation, steepest descent, conjugate gradient, and Newton and quasi-Newton techniques.
- the fragmentation patterns herein can involve, but not limited to, fragment ends, cleavage profiles, fragment end motifs, genomic coordinates of fragment ends, and fragment sizes.
- sites/regions that are 5hmC-enriched or -depleted for the particular tissue type can be used, e.g., to identify a pathology for the particular tissue type.
- Machine learning models can use such tissue-specific methylation patterns (e.g., hyper- and hypo-methylated as well as 5hmC-enriched and -depleted) to differentiate among different types of cancers.
- the cell-free DNA fragments used for the fragmentation measurements can be filtered, e.g., based on size.
- a pathology can be detected based on an amount of end motifs of cell-free DNA fragments having a particular size.
- fragmentation information can be measured in various ways.
- massively parallel sequencing or genome-wide sequencing can be used.
- targeted sequencing approaches could be used to determine cfDNA fragmentomic features from regions of interest that are used for methylation pattern prediction.
- cfDNA fragmentomic features could be detected by using non-sequencing based approaches, such as quantitative polymerase chain reaction (qPCR), real-time PCR, digital PCR (dPCR), droplet digital PCR (ddPCR), mass spectrometry, etc.
- qPCR quantitative polymerase chain reaction
- dPCR digital PCR
- dddPCR droplet digital PCR
- mass spectrometry etc.
- the present disclosure shows a relation between where DNA is cut (e.g., as part of forming cell-free DNA) and a methylation index (status) of a site in a genome.
- the DNA is cut can be defined as a cleavage profile.
- the DNA is cut can be represented by end motifs.
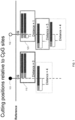
- FIG. 1 illustrates cutting positions relative to CpG sites (also referred to as CG sites) according to embodiments of the present disclosure.
- the horizontal line refers to a reference sequence, e.g., part of a reference genome, which contains two CpG sites. After sequencing, the resulting reads can be mapped to this region.
- the distance between the fragment ends and the position relative to the CpG sites can be calculated. For example, the fragments 110 ended exactly at the CG position, and thus have a distance of 0 (also referred to as position 0).
- the fragments 120 end one position to the left of CpG site 102. Since the fragment was cut one base before the CpG site, the distance is considered one. In this manner, we can calculate the distance between the cutting ends and the CpG sites and group the fragments with the same distance together. As shown below, this distance is associated with the methylation level.
- FIG. 2A shows how DNA fragments can be grouped depending on distance from the 5' ends to the CpG site. If the first two nucleotides at the 5' end of a fragment are CG, the aforementioned distance is 0. If there is one nucleotide at the 5' end immediately preceding the CG, the aforementioned distance is 1, which corresponds to fragments having an NCG motif, where N is any one of the 4 bases.
- the sequenced CpG sites could be grouped into different categories according to their distances relative to 5' ends.
- the maximum distance shown in FIG. 2A is eight, but further distances can be used.
- the methylation index for each distance can be determined in various ways. For example, the number of methylated CpG sites covered by DNA fragments in a group divided by the total number of sequenced CpG sites on DNA fragments for each group may be used. If there are 100 CpG sites on the fragments and 90 of them are methylated, then the index will be 90. As another example, the methylation index can be determined as how many fragments in a group occur at a site that is hypermethylated (e.g., a methylation density at the site greater than a specified percentage, such as 60%, 70%, 80% etc.).
- FIG. 2B provides methylation level for CpG sites each with a given downstream distance from the cutting edge of a plasma DNA molecule (e.g., methylation level for CpG sites with a 5-nt distance to the 5' end).
- FIGS. 2B show the methylation index differs depending on the distance between the 5' ends and CpG sites. There is a correlation between the methylation index of CpG sites and their distance to the 5' end. As one can see, if the distance is 0, the methylation level is the highest in the CpG. If the distance is 1, then the methylation level is the lowest. As the distance further increases, the methylation level became rather stable. When a CpG site is methylated, the cutting will happen more at methylated C, whereas if the CpG site is unmethylated, there will be more random cutting.
- the cutting position is also associated with the motif types. For example, if the fragment is cut exactly at the CG position, then the end motif is CGN**** (where * represents a base and N is any of the 4 bases). If the fragment is cut one base before this CG, the end motif is NCG*** (where * represents a base) and so on. Thus, there is a relation between motif types and methylation level of a CpG site around which the fragment was cut.
- some embodiments can use an amount of CGN motifs and/or NCG motifs to determine a methylation index of a site or a region that includes multiple sites.
- Other examples use a cleavage profile (described in more detail below) and the relation of the distances to methylation to determine methylation.
- the CGN and NCG end motifs can be used to determine a cleavage profile, and a cleavage profile can include counts of CGN and NCG end motifs (also just referred to as motifs).
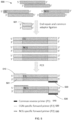
- FIG. 4 shows an example for a method using droplet PCR to determine NCG and CGN motifs in regions of interest according to embodiments of the present disclosure.
- cfDNA molecules 400 can be subjected to the process of DNA end pair, A-tailing (adding an A at the end of the fragment), and common adaptor ligation as optional steps.
- the DNA end repair can make the ends blunted so there is no overhang between the two strands.
- a common adaptor 401 can be added to the end of the fragments.
- DNA molecules would be amplified inside a reaction (e.g., droplet) by the pair of PCR primers.
- Two different fluorescent probes can be used, e.g., a probe 430 to detect CN ending fragments and a probe 440 for detecting NCG ending fragments.
- the fluorescent probe specific to a certain end motif (such as CGN or NCG end motif) can be hydrolyzed and emit fluorescent signals, thus enabling the detection of the presence of a specific motif as well as the quantification of a specific motif.
- the number of reactions positive for a particular end motif can be counted and used to determine the amount of DNA fragments with that end motif in the region analyzed.
- the intensity of each signal can be used as a measure of an amount of DNA fragments ending with a particular motif. The two intensities can be compared to each other
- Another example technique for analyzing fragmentation is targeted sequencing, e.g., by amplifying DNA fragments having a sequence corresponding at least partly from one or more regions of interest and/or using capture probes that select such DNA fragments.
- Certain DNA molecules having particular end motifs corresponding to particular distances from the CpG site to the end of the fragment can be amplified.
- the targeted sequencing approach can be utilized to determine cfDNA fragmentomic features from regions of interest in a cost-effective manner. Targeted sequencing approach could increase the depth of regions of interest, thus improving the accuracy for methylation analysis.
- the CGN and NCG motif-containing DNA fragments can be enriched during sequencing library preparation. This amplification makes the sequencing more efficient, since most of the sequence reads would include CGN and/or NCG motifs.
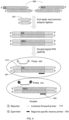
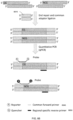
- FIG. 5 shows an example workflow for the sequencing library preparation by selectively amplifying DNA containing NCG or CGN end motifs according to embodiments of the present disclosure.
- the cfDNA molecules 500 can be subjected to the process of DNA end pair, A-tailing, and common adaptor ligation as optional steps, as described above.
- a pair of PCR primers can be designed in a way that one primer 510 could bind to the common adaptor region 501 (P1), and the other primer 520 or 530 could bind to the junctional region between the DNA and the common adaptor (P2).
- CG primary 520
- NCG primary 530
- sequenced reads would be used for performing the analysis of CGN and NCG end motifs, allowing the determining of methylation levels, patterns (e.g., levels at different sites or regions), as well as differences.
- selective amplification of DNA fragments containing CGN or NCG end motif might enrich reads mapping to regions with different methylation levels, e.g., from different tissues within the body, from tumoral versus non-tumoral origin, or from fetus versus maternal in pregnancy.
- cfDNA is a mixture containing DNA molecules derived from different origins, which could have different methylation statuses in one or more CpG sites.
- Different methylation statuses would affect plasma DNA fragmentation patterns during the release of DNA molecules into plasma due to cell death (e.g., via apoptosis) or other mechanisms (e.g., active secretion).
- Different methylation statuses might also affect the clearance of cell-free DNA molecules. Therefore, the use of cfDNA fragmentation patterns will allow for deducing the methylation status of CpG sites.
- cfDNA fragmentation patterns due to methylation status on a CpG would involve plasma DNA cleavages across a series of genomic positions nearby or distal to that CpG site, which could be mediated by one or more DNA nucleases such as DNASE1 and DNASE1L3.
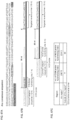
- FIG. 6 shows a schematic illustration for the methylation status deduction based on fragmentation patterns according to embodiments of the present disclosure.
- DNA from different tissues will have different methylomes.
- blood cells will have different methylation at sites than liver, as shown for site 610.
- blood cells have different levels of methylation and liver tissues will have different methylation levels, namely UMU for blood and UMM for liver.
- both tissues also contribute their cell-free fragmentomic features into the plasma.
- the first site is hypomethylated, there will be more unmethylated motifs (e.g., NCG) and the cutting will be more random; whereas in the second site, if they are both hypermethylated, there will be more methylated motifs (CGN).
- CGN methylated motifs
- the end motifs and the cleavage profile will be a mixture of the tissues, and this information can actually deduce the methylation status of each site based on their profiling. This is shown in the section on cfDNA features where site 605 has unmethylation related end motifs 602, and site 608 has methylation related end motifs 601.
- FIG. 6 also shows two methods to deduce methylation status.
- a method 620 uses the cleavage profiles, and a method 630 uses end motif profiles.
- the cleavage profile can correspond to an amount of DNA fragment ending at positions around the CpG site.
- the site that is methylated in both tissues has the highest peak. For unmethylated sites, there is no peak. For highly-methylated sites, there is a high peak. For partially-methylated sites (e.g., only methylated in some tissues), there is a lower peak.
- the cleavage profile could be defined as, but not limited to, the amount of fragment ends at each position across a number of genomic positions surrounding a CpG site being analyzed (also referred to as cleavage measurement window).
- the number of genomic positions (referred to as window size) could be, but not limited to, 1 nt, 2 nt, 3 nt, 4 nt, 5 nt, 6 nt, 7 nt, 8 nt, 9 nt and 10 nt or above.
- the amount of fragment ends could be normalized values such as but not limited to the number of fragment ends divided by the sequencing depth at each position.
- methylation is tissue-specific and because the fragmentomic features reflect methylation, the methylation can further reflect the tissue of origin.
- the fragmentomic features can be used directly (or used to determine methylation that in turn is used) to determine a fractional concentration of a particular tissue type (e.g., using tissue deconvolution if determining multiple tissue concentration), which can provide a fractional concentration of DNA from a particular tissue (e.g., of clinically-relevant DNA).
- the cleavage profiles and the end motif profiles can be used to estimate the fraction for a particular tissue. Accordingly, methylation associated cfDNA fragmentomic features, such as the cleavage profile and the motif profile, can be used to deduce the contribution (fractional concentration) of cfDNA from different tissues of origin.
- a cleavage profile can be determined in various ways, including using certain end motifs, such as CGN end motifs. Example definitions and results are provided below. The results are consistent regardless of how the cleavage profile is defined, e.g., type of normalization used.
- the cleavage profile was constructed according to the cleavage ratio across genomic coordinates within a measurement window related to a CpG site.
- the cleavage ratio is defined as the number of ends at a position over a number of reads covering that site (sequencing depth).
- FIG. 7 illustrates a definition of a cleavage profile using a cleavage ratio according to embodiments of the present disclosure.
- a cleavage measurement window 710 of width 11 is shown, but other widths can be used.
- a set of cell-free DNA fragments 700 is shown above a reference sequence 720. The relative positions are with respective the C of the CpG site.
- the row marked “Ends” shows the number of cell-free DNA fragments that end at that particular base position.
- the row marked “Depth” shows the number of the cell-free DNA fragments that overlap with that base position.
- the cleavage ratio is provided using the equation shown.
- a cleavage profile is analyzed for two sets of CG sites: putative unmethylated and putative methylated.
- cfDNA molecules in healthy participants is derived from leukocytes ( Sun et al. Proc Natl Acad Sci USA. 2015;112:E5503-5512 )
- 1,000 putative methylated CpG sites (beta value > 0.8)
- 1000 putative unmethylated CpG sites (beta value ⁇ 0.1) were identified based on a publicly available Illumina HumanMethylation450 BeadChip data of leukocytes (GSE40279). If a site was methylated in the leukocytes, then it was assumed to be putatively unmethylated.
- methylation affected cfDNA fragmentation
- the cleavage profile of the 1,000 putative unmethylated CpG sites and 1,000 putative methylated CpG sites were analyzed for 8 healthy control cfDNA samples, with a median number of 381 million paired-end sequencing reads (interquartile range: 353 - 404 million).
- the "putative" means that methylation is derived from the loci array data, which is from a publicly available database.
- FIG. 8 shows a comparison of cleavage profiles between methylated CpG sites 810 and unmethylated CpG sites 820 according to embodiments of the present disclosure.
- the x-axis represents the nucleotide positions relative to a CpG site within a measurement window.
- the window herein was defined as 5 nucleotides (i.e., 5-nt) upstream and downstream of the C base in a CpG site (i.e., window size was 11 nt).
- the y-axis represents the mean cleavage ratio.
- the cleavage profile from putative methylated CpG sites or putative unmethylated CpG sites were merged by calculating the mean cleavage ratio of each position within the 11-nt window.
- the cutting is quite preferred at C; whereas when the C is unmethylated, the cutting is not preferred at the C.
- the sequence context might affect the cleavage profile.
- the merged cleavage profiles related to methylated and unmethylated CpG sites were determined from a set of cleavage measurement windows for which the position '-1' corresponded to the cytosine nucleotide, namely, "CCG" subsequence (a total of 6,928,652 measurement windows).
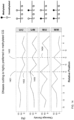
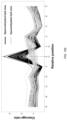
- FIGS. 9-10 shows cleavage profiles of windows associated with different sequence contexts including CCG and methylation status according to embodiments of the present disclosure. This data is generated using bisulfite sequencing results from one healthy control sample as an example (391 million paired-end sequencing reads).
- FIG. 9 shows the merged cleavage profiles of windows contain C, C, and G nucleotide at the positions of -1, 0 and 1.
- the black line 910 represents the merged cleavage profiles of windows contain methylated C at the position 0, and the grey line 920 represents those of windows containing unmethylated C at the position 0.
- the methylated status (denoted by M) was defined by those CpG sites whose methylation index was greater than 70%, whereas the unmethylated status was defined by those CpG sites whose methylation index was less than 30% (denoted by U).
- the cleavage ratio at the position of '0' appeared to be much higher at methylated CpG sites (0.90%) than those unmethylated (0.51%).
- the cutting is preferred at the C; while the C is unmethylated, the cutting is not preferred at that C.
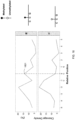
- FIG. 10 shows the merged cleavage profiles of 615,465 windows containing C, G, C, and G nucleotide at the positions 0, 1, 2 and 3 (i.e., CGCG subsequence).
- the cleavage profiles were classified into four groups according to the methylation patterns of the two CpG sites regarding the CGCG subsequence, namely "MM", "MU”, "UM", and "UU”.
- the black solid line 1010 represents the merged cleavage profiles of windows containing methylated C at positions 0 and 2
- the grey dash line 1020 represents those of windows containing unmethylated C at positions 0 and 2.
- FIG. 10 shows cleavage patterns for two CpGs that are next to each other (i.e., in tandem).
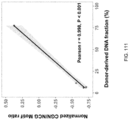
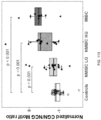
- the CGN/NCG motif ratio corresponds to a ratio of an amount of DNA fragments with the CGN motif and an amount of DNA fragments with the NCG motif.
- adjacent CpGs as those CpG sites located within a range of 75 bp in size but not in tandem.
- adjacent CpGs can be defined as CpG sites located within a range of but not limited to 5 bp, 10 bp, 20 bp, 30 bp, 40 bp, 50 bp, 100 bp, 200 bp, 500 bp, 600 bp, 1000 bp and so on.
- tandem CpGs can be used. As the majority of cfDNA molecules ( ⁇ 93.5%) contain the number of CpG sites no more than 3 in each molecule within the 75-bp range, we analyzed the CGN/NCG motif ratios across different combinations of methylation states for those molecules with 2 and 3 CpG sites, respectively.
- FIG. 11 shows a schematic for a cfDNA grouping at adjacent CpG sites.
- the cleavage site 1105 is on the left at the 5' end.
- the range 1110 is 75 nt.
- the first two examples show DNA fragments with two CpG sites.
- the last two examples show DNA fragments with three CpG sites.
- the right side shows the different combinations of methylation statuses.
- the methylation status of the CpG that was immediately adjacent to the cleavage site of interest showed more pronounced impact on the cfDNA cleavages than those CpG sites away from the cleavage site.
- the data also suggested that the cleavage of the CpG at the 5' end might at least in part be affected by the methylation status of adjacent CpGs. This finding may have some potential applications.
- Another example for normalization uses the number of fragments ending in a region around the site.
- the region can be the same or different than the window used to determine the cleavage profile.
- FIG. 13 illustrates a normalization for a cleavage profile using a cleavage density according to embodiments of the present disclosure.
- the black bar 1305 shows a reference genome that contains a CG 1301.
- the cleavage ratio to deduce the methylation status of the CpG site, we can calculate how many fragments ended at this CpG site.
- For the normalization we divided the numbers of ends at each position divided by the total ends in this whole region. This is another example technique that may be used to normalize amount of DNA fragments with a particular end motif or end at a particular position.
- a similar analysis is performed to determine profiles for various CpG sites for the cleavage density as was done for the cleavage ratio. For example, an analysis of one CG, 2 CGs, and 3 CGs is performed. The sequencing analysis uses merged data from multiple samples to obtain higher sequencing depths. A site is methylated if the methylation index is greater than a first threshold (80% in this example), and a site is unmethylated if the methylation index is less than a second threshold (30% in this example). If the methylation index for a site is in between the threshold, then it is not used for this example. In other implementations, a middle classification can be used.
- FIG. 14 provides cleavage profiles using a cleavage density for various methylation combination of two CpG sites according to embodiments of the present disclosure.
- the CpG sites are tandem in this example, like in FIG. 10 .
- There two dashed lines 1403 and 1404 represent the positions of these two cytosines.
- the first C 1401 is unmethylated and there is no peak at C 1201. But in the bottom two profiles, the first C is methylated, and there is a dramatic increase from -1 to the 0 position.
- the second CG is methylated for the second profile and the fourth profile. In these profiles, there is a peak for the second C 1402.
- the second CG is unmethylated for the first profile and the third profile and the peak is low or disappeared.
- the cleavage density 1405 it has a high value. But there is no relative increase. The relative increase is more important to deduce the methylation status, rather than the exact number at a position.
- the third CG is methylated in the first three profiles, and we observe a peak.
- the third CG is unmethylated in the fourth profile, and the peak is very weak.
- FIG. 16 shows cleavage density of windows including CCG and methylation status according to embodiments of the present disclosure.
- FIG. 17 shows a comparison of cleavage profiles between methylated and unmethylated CpG sites using cleavage density according to embodiments of the present disclosure.
- FIG. 17 is comparable to FIG. 8 and shows similar results but using a different definition for the cleavage profile, namely using cleavage density as opposed to a cleavage ratio.
- putatively hyper-methylated, or putatively hypomethylated CpG status from the published leukocyte methylation array data.
- Each red line 1720 represents a sample with the one thousand methylated CpG regions
- each blue line 1730 represents a sample with one thousand unmethylated CpG sites.
- machine learning techniques can be used. Such techniques can use two or more amounts within the cleavage measurement window and may include a full cleavage profile in the window around the CpG site.
- the machine learning techniques may also use sequence context, e.g., the entire sequence or instances of k-mers, which can be tracked in various ways.
- sequence contexts can also be used outside of machine learning, e.g., the other relative increase from -1 to 0 position may be different depending on the base before the C.
- Machine learning can identify such patterns in any of the positions used in the feature vector input to the ML model.
- Various ML models can be used. This section provides results using support vector machine (SVM) to classify a site as hypermethylated or hypomethylated.
- SVM support vector machine
- cleavage profiles were constructed using the cleavage ratio from 11-nt cleavage measurement window centering on a CpG site.
- the cleavage profiles from the Watson and Crick strands were used to train a machine learning model that was used for deducing the methylation status of the CpG site in the center of the window.
- the support vector machine (SVM) was used to predict whether the aggregated methylation index at a CpG site was over 95% or below 20% on the basis of the cleavage profile associated with that CpG site.
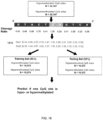
- FIG. 18 shows a workflow for using an SVM to classify CpG sites as hypermethylated or hypomethylated according to embodiments of the present disclosure.
- a training set 33,147 hypomethylated CpG sites and 33,147 hypermethylated CpG sites in a reference genome are used.
- the actual classification of each site was determined using bisulfite sequencing.
- hypomethylated is more than 20 percent for the methylation index
- hypermethylated is higher than 95 percent for the methylation index.
- Half of the sites were used for training and the other half is used for testing.
- the trained model can predict if a CpG site is hypomethylated or hypermethylated based on the cleavage profile.
- the input feature vector is the cleavage ratio at the 11 positions, as is shown at each site.
- Feature vector 1810 is an example of such a feature vector.
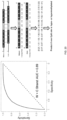
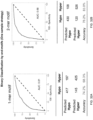
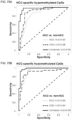
- FIG. 19 shows the performance of single CpG site methylation status prediction using support vector machine (SVM) on the basis of cleavage profiles according to embodiments of the present disclosure.
- the two plots show data from the Watson strand and the Crick strand. When only using the data from the Watson or Crick strand, one can achieve an AUC of around 0.8.
- the cleavage ratios in the cleavage profiles were normalized using sequencing depth at each position.
- the methylation patterns at a CpG site in the Watson strand and the corresponding site in the complementary Crick strand would be symmetrical.
- Cleavage profiles from both the Watson and Crick strands could be merged to train a machine learning model for deducing the methylation status of the CpG site at the center of a window.
- a cleavage profile from each strand is used.
- the feature vector can have 22 values in this example of 11 positions in the measurement window.
- the two strands share the same methylation status.
- FIG. 20 shows the performance of single CpG site methylation status prediction using support vector machine (SVM) on the basis of cleavage profiles from both strands according to embodiments of the present disclosure.
- SVM support vector machine
- the sequencing depth used for the training samples (e.g., 10x) can be higher than used for test samples.
- sequencing context around a CpG site can be analyzed to improve the model performance.
- the training datasets comprising the cleavage profiles associated with methylated and unmethylated CpG sites could be divided into four categories, according to the nucleotide types at the position of '-1' of the Watson strand.
- the sequence context can be used by training different models: one for each of the four sequence contexts.
- the use of cleavage profiles from windows with CCG subsequence at the positions of -1, 0, and 1 in both the Watson strand and Crick strand would further enhance the model performance up to an AUC of 0.97.
- a measurement window of 11 bp was used to determine whether a given site in the genome was hypermethylated or hypomethylated.
- Windows of various widths can be used, e.g., 2, 3, 4, 6, 7, 8, 9, 10, 11, and 20, for any of the embodiments described herein. Results for such widths are shown in table 1.
- Table 1 summarizes the AUC for methylation prediction by SVM models with different window sizes.
- AUC overall is analyzed by the method used in FIG 20 , and the remaining four are analyzed by the method used in FIG 21A using a sequence context of the reference genome at position - 1.
- the measurements use fragments from both the Watson (W) strand and the Crick (C) strand, although measurements can use just one strand.
- the cleavage ratio is determined at the CpG site, i.e., using the number of DNA fragments that end at the C of the CpG site. For this example, the cleavage ratio is determined using the sequencing depth, as described in section III.A.
- the SVM model can receive as input a cleavage ratio for the Watson strand and/or a cleavage ratio for the Crick strand.
- Other machine learning models can be used, such as decision trees or neural networks.
- cleavage ratio can take various forms as described herein, such as a normalization by number of DNA fragments covering a position, a number of DNA fragments in a region around the site, or a number of DNA fragments ending at one or more particular positions around the site. Any of such normalizations can be used for a cleavage profile.
- the cleavage ratio is determined at position 1 to the right of the CpG site. For each of the remaining measurement windows, the specific positions used are identified in the column for window size.
- the data in table 1 is generated using the 33,147 hypomethylated CpG sites and 33,147 hypermethylated CpG sites described above.
- hypomethylated is lower than 20 percent for the methylation index and hypermethylated is higher than 95 percent for the methylation index
- the machine learning model (e.g., a neural network) can consider the sequencing content and the cleavage profile (e.g., more than one cleavage density or cleavage ratio) around the CG site to predict the methylation.
- a convolutional neural network (CNN) was implemented to determine whether a CpG site in a genome was methylated or not.
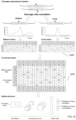
- FIG. 22 shows a schematic illustration for methylation status prediction using a CNN model on the basis of cleavage profiles and sequence context according to embodiments of the present disclosure.
- a methylated status can be defined by a methylation index over 95% (or other value, e.g., as mentioned herein), whereas an unmethylated status could be defined by a methylation index below 20% (or other value, e.g., as mentioned herein).
- the 5-nt upstream e.g., ATCTG
- 5-nt downstream e.g., GAGTA
- the relative positions of this sequence corresponded to -5, -4, -3, -2, -1, 0, +1, +2, +3, +4 and +5, respectively.
- the center position of "0" corresponded to the cytosine at the CpG site that was subjected to methylation status analysis.
- the fragment cleavage ratio for each individual position can be constructed into a 2-dimensional (2-D) matrix 2220 according to the sequence context. For instance, for a position of -1 corresponding to the base of guanine ("G"), the cleavage ratio associated with "G” (1.40) was filled in the corresponding cell between a column of "-1" and a row of "G". The remaining rows corresponding to "A", "C", and “T” in the Watson strand were filled by "0".
- the cleavage profiles and sequence context originating from the Crick strand ('5-[TTACT]C[GCAGA]-3') were also processed similarly.
- the data matrices from the Watson and Crick strand can be combined for downstream analysis.
- Such a data matrix could contain both the sequence context and the cleavage profile information.
- the matrix includes the base (nucleotide), the position, and the cleavage ratio (using one-hot encoding in this example). For example, at -5 in the W strand, the first base is A, and the cleavage ratio is of around 0.25.
- the two matrices can be combined into a combined matrix 2230.
- This combined matrix can be the input metric of the CNN model, which has a convolutional layout to extract the features of these matrices.
- the extracted features can be combined into a linear level to calculate the possibility of whether the CpG site is methylated or unmethylated. We can achieve an AUC of around 0.96.
- the CNN model made use of two one-dimensional (1D)-convolutional layers, each having 64 filters with a kernel size of 4, although other hyperparameters may be used, such as between 50-100 filters or kernel sizes of 3-6.
- the activation function of the rectified linear unit (ReLU) was used for those convolutional layers.
- a batch normalization layer was applied subsequently, followed by a dropout layer with a dropout rate of 0.5.
- a flattened layer was further added, followed by a fully connected layer comprising 128 neurons with the use of the ReLU activation function.
- the output layer with one neuron was finally applied, with a sigmoid activation function to yield the probabilistic score for a CpG site of being methylated (i.e., methylation score).
- the number of convolutional layers can be 1, 3, 4, 5, 6, 7, 8, 9, from 10 to 20, from 30 to 40, from 40 to 50, or more.
- the number of filters for each convolutional layer may be from 1 to 10, from 10 to 20, 20 to 30, 30 to 40, 40 to 50, 50 to 60, 60 to 70, 70 to 80, 80 to 90, 90 to 100, 100 to 150, 150 to 200, or more.
- the kernel size for the filters can be 2, 3, 4, 5, 6, 7, 8, 9, 10, from 10 to 20 or more.
- the CNN may also include a plurality of hidden layers including a plurality of nodes. The first layer of the plurality of hidden layers coupled to the input layer.
- the CNN may further include an output layer coupled to a last layer of the plurality of hidden layers and configured to output an output data structure.
- the optimal parameters of the CNN model were obtained when the overall prediction error between the output scores by the sigmoid function and desired targeted outputs (binary values: 0 or 1) reached a minimum by iteratively adjusting model parameters.
- the overall prediction error was measured by the cross-entropy loss function in deep learning algorithms (pytorch.org).
- the model parameters learned from the training datasets were used for analyzing the testing dataset to output a probabilistic score (referred to as the methylation score in this study) which would indicate the likelihood of a CpG site being methylated.
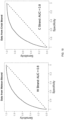
- FIG. 23A shows a performance of methylation status prediction of a single CpG site using CNN on the basis of cleavage profiles and sequence context according to embodiments of the present disclosure.
- the solid line represents the performance of the model trained with cleavage profiles and sequence context
- the dash line represents the performance of the model trained with genome context only.
- the genome context only is just trained on the sequence pattern in reference, without any fragmentation information.
- XLNet XLNet
- BERT XLM
- RoBERTa Bayes' classifier
- HMM hidden Markov model
- LDA linear discriminant analysis
- k-means clustering k-means clustering
- DBSCAN density-based spatial clustering of applications with noise
- DBSCAN random forest algorithm
- AdaBoost adaptive boosting
- XGBoost eXtreme Gradient Boosting
- SVM support vector machine
- the cutting distance is reflective of the methylation index, e.g., as shown in FIGS. 2A-2B and 3 , particularly distances 0 (corresponding to end motif CGN) and 1, where distance 1 corresponds to positions -1 (corresponding to end motif NCG) and +1 (corresponding to cutting site between the C and G).
- the cleavage ratio (e.g., determined using an amount at a particular position) at various positions also shows differences between methylation levels, e.g., as shown in FIGS. 8-10 and 17 . Additional data is provided in this section showing the discrimination among difference methylation levels using an amount of cell-free DNA molecules ending at a first position of the CpG site, where the first position is one of -1 to +1 position. As shown, the -1 position, the 0 position, or the +1 positions can be used.
- FIG. 24A shows performance of methylation status prediction of a single CpG site using a CNN model on the basis of proximal cleavage profiles and sequence context with the exclusion of position 0.
- the sequence context was used as described above. Without the 0 position, the combined matrix for a +/-5 base window would have 10 columns instead of 11, as was used in FIG. 22 .
- AUC 0.79
- any of the positions -1 to +1 can be used alone. While some embodiments can use a ratio (e.g., a CGN/NCG ratio) or others can use a vector of cleavage ratios at multiple positions, an amount of fragments ending at a particular position relative to the CpG site can be used.
- a ratio e.g., a CGN/NCG ratio
- others can use a vector of cleavage ratios at multiple positions, an amount of fragments ending at a particular position relative to the CpG site can be used.
- Methods are provided for using cleavage information to determine methylation at a site in a genome.
- the methylation can be a property of the sample at a position in the genome, e.g., as defined relative to a reference genome.
- the cleavage information can be of various types, as described herein. Various normalizations can be used, and cleavage information for more than one position can be used.
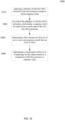
- a first amount of cell-free DNA molecules ending at a first position within a window around the CpG site is determined.
- the first position can be between -1 to +1 position of the window.
- the first amount can be the cell-free DNA at the -1 position
- the first amount can be the cell-free DNA at the 0 position
- the first amount can be the cell-free DNA at the +1 position.
- the first amount can be determined in various ways. For example, when the analysis uses sequence reads, block 2720 can determine a number of reads that align to the CpG site in a reference genome and end with CG (with the 5' end at the left on the Watson strand) or end with GC (with the 5' end at the right on the Crick strand). Thus, the amount can be a count of DNA molecules.
- probe-based techniques can be used. For example, a number of reactions positive for a particular probe can be used. As yet another example, an intensity (e.g., electrical or optical) of a signal (e.g., from real-time PCR) from a particular probe can be used.
- a second amount of cell-free DNA molecules ending at a second position (different than the first position) within a window around the CpG site can optionally be determined at block 2720.
- the second amount can be determined in similar ways as the first amount.
- the amounts can be a raw number (e.g., no normalization) since they are compared to each other.
- a relative frequency can be used. Examples of a relative frequency include a cleavage ratio and a cleavage density, as may be determined using normalization techniques described herein. The two amounts may be used to determine a relative frequency, which is used in later steps.
- normalization or any other normalization mentioned herein can be performed by analyzing a same number of DNA molecules, producing a same number of reads, or using a same sized sample (e.g., specified volume (e.g., number of milliliters)).
- a same sized sample e.g., specified volume (e.g., number of milliliters)
- the second amount can be part of a larger amount.
- a total number of DNA molecules covering the first position e.g., the CpG site
- the total number covering the first position can include the second amount that end at the second position around the CpG site.
- Techniques that use such a total number for normalization use the second amount. Accordingly, when the first amount is normalized, the normalization can use a number of cell-free DNA molecules covering the CpG site. As another example, the normalization can use a number of cell-free DNA molecules ending within a region including the CpG site. As yet another example, the normalization can use an average or median depth of cell-free DNA molecules in a region including the CpG site.
- the second position can be any position within a measurement window, for which example windows are described herein.
- the first position can be at +1 or -1 from the CpG site, if the first position is the 0 position.
- the measurement window can be at least -2 to +2 from the CpG site, and thus larger than 5 bases in width.
- a classification for methylation of the CpG site in the genome of the subject is determined using the first amount.
- the second amount may also be used.
- Various methylation classifications of a site can be determined. For example, it can be determined whether a site is hypomethylated or hypermethylated in the sample and the subject.
- the classification for methylation can be whether the CpG site is in a hypermethylated state (also referred to as a methylated state) or a hypomethylated state (also referred to as an unmethylated sate) in the genome of the subject, as determined by analyzing the plurality of cell-free DNA molecules in the sample.
- the methylated state can have a methylation density above a first threshold that is at least 70%.
- the unmethylated state can have the methylation density below a second threshold that is 30% or less.
- the classification can be any methylation level, which may be provided qualitatively (e.g., high, medium, or low, as may be defined using certain percentage thresholds) or quantitatively (e.g., a particular amount, such as a percentage, which may be provided with a given resolution/range).
- the classification can be determined in various ways. For example, a separation value can be determined using the first amount and the second amount. The separation value can be compared to a calibration value.
- the calibration value can be determined using cell-free DNA molecules that are from one or more calibration samples and that are located at CpG sites having known classifications.
- the known classifications can be determined using a methylation-aware assay or from the results of others that use a methylation-aware assay.
- the calibration value can be a threshold/cutoff above which or below which a particular classification is determined. For example, in FIG. 17 , a calibration value of about 22 for the cleavage ratio at position 0 discriminates between hypermethylated sites and hypomethylated sites.
- a site can be identified as having a methylation level of a particular percentage or percentage range (e.g., 5%, 10%, 15%, 20%, 25%, 30% or less).
- a 20% range is 40%-60%.
- the classification can use at least two positions other than the first position, e.g., other than the CpG site if the first position is position 0. For each position of the at least two positions within the window, a respective amount of cell-free DNA molecules ending at the position can be determined. The first amount of cell-free DNA molecules ending at the first position can be compared to the respective amount of cell-free DNA molecules ending at the position as part of determining the classification. Such a comparison could be of determining a difference between the amount at position -1 to position 0 and the difference between the amount at position 1 to position 0. For instance, FIGS. 8 and 17 both have different amounts of increase from -1 to 0 and decrease from 0 to 1. Additionally, such use of two or more positions can include machine learning techniques, such as those described in sections C and D above.
- TSS regions with a methylation density of over 70% were defined as hypermethylated regions (although other percentage ranges could be used), and regions with a methylation density of below 30% were defined as hypomethylated regions. Regions in between were excluded, but can be included in other embodiments, e.g., to identify regions that are partially methylated. More than three classifications can also be used. CGN and NCG end motif frequencies were calculated for all hypo- and hypermethylated regions and normalized by the expected motif frequencies from 8 healthy control samples (median paired-end sequencing reads of 381 million (IQR: 353 - 404 million)).
- the regions can be of various size (e.g., 100 kb, 200 kb, 500 kb, 1 Mb, 2 Mb, 3 Mb, and 5Mb), with 1 Mb regions just being an example.
- One example technique uses amounts for CGN or NCG, or a ratio of the two, possibly with normalization for either.
- Another example technique uses amounts for each motif, e.g., each 3-mer motif. Higher k values for the k-mer motifs can be used.
- Such amounts can form a feature vector that is input to a machine learning model, which as examples can determine a binary classification or provide a numerical value, such as a particular percentage (or equivalently a decimal value). Regression can provide such numerical values.
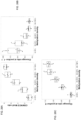
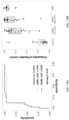
- FIG. 31B shows the training where multiple subjects are used and is labeled as the multiple samples strategy. We merge the seven healthy control cases and got over 43 thousand regions. We tested the model using an individual, which has about 8,000 regions. The technique in FIG. 31B is used to generate data in FIGS. 34A, 34B , and 38 .
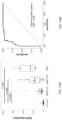
- FIGS. 32A-32B and 33A-33B show the results of the binary classification for different k-mer motifs according to embodiments of the present disclosure. These results used the one sample strategy. We observed the prediction accuracy increased from 1-mer motif to 4-mer motif. The increase is most significant from 2-mer motif to 3-mer motif. The AUC for 3-mer end motifs could achieve of around 0.97 to predict the regional methylation density from the end-motif profiles.
- FIG. 34A shows the performance of regional methylation status prediction using SVM on the basis of regional end motif frequencies or O/E ratios of end motifs according to embodiments of the present disclosure.
- Regional end motif frequencies or O/E ratios of end motifs from TSS regions i.e., ⁇ 1000 bp of TSSs
- TSS regions from one independent healthy control sample were used for performing the ROC analysis regarding differentiating the methylated and unmethylated status of a genomic region.
- the solid and dashed line represents the model performance based on end motif frequencies and O/E ratios of end motifs, respectively.
- SVR support vector regression
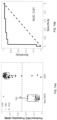
- FIG. 34B shows the performance of regional methylation density estimation using SVR on the basis of regional end motif frequencies according to embodiments of the present disclosure.
- Regional end motif frequencies from TSS regions i.e., ⁇ 1000 bp of TSSs
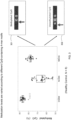
- the scatter plot shows the correlation between predicted methylation densities and observed methylation densities detected by using bisulfite sequencing for a testing sample.
- the predicted methylation densities was well correlated with methylation densities deduced by bisulfite sequencing (Pearson's r: 0.93).
- the data suggested that the 3-mer end motif profiles allowed for deducing the methylation density of a genomic region of interest.
- regional end motif frequencies could be used to predict the methylation density of other regions such as CpG islands (CGI), long interspersed nuclear elements (LINEs), Alu repeats, microsatellites, tandem repeats, enhancers, transposons, transcription factor binding sites, etc.
- end motifs could involve, but not limited to, 1 nt, 2 nt, 3 nt, 4 nt, 5 nt, 6 nt, 7 nt, 8 nt, 9 nt, and 10 nt or above at each end of cell-free DNA molecules.
- other machine learning models can be implemented, such as decision tree, Bayes classifier, support vector regression, recurrent neural network, other neural network-based models, and so on as will be appreciated by the skilled person.
- only certain end motifs are used, e.g., those corresponding to CGN or NCG, or only those including CG (i.e., including CGN and NCG, and even larger motifs depending on the value of k).
- sequence context itself may play a role to predict the methylation status.
- Various types of normalization can be performed using sequence context for a region.
- Example types of normalization can use expected frequency per region (as described above) or a normalization that is per fragment.
- FIG. 35 illustrates a normalization using an expected frequency of a region (regional normalization) for each motif according to embodiments of the present disclosure.
- the normalized motif frequencies for different motifs can then be used to generate a feature vector that is input to a ML model.
- FIG. 37 shows a normalization on a per molecule context using an expected motif frequency in the molecule according to embodiments of the present disclosure.
- the fragments are shown relative to a reference genome, but the normalization is done using the sequence of the respective molecules.
- the sequence of the respective molecule can be determined using the reference though, e.g., when the entire fragment is not sequenced and the two ends of a fragment are mapped to the reference.
- the reference sequence can be used to fill in the parts of the molecule that are not sequenced.
- a plurality of cell-free DNA molecules from a biological sample of the subject are analyzed.
- Block 4110 can be performed in a similar manner as block 2710 and vice versa.
- analyzing a cell-free DNA molecule can include determining a location of the cell-free DNA molecule in a reference genome, e.g., when the region is smaller than the entire genome.
- the plurality of cell-free DNA molecules can be located in the region of the reference genome.
- the region can be the entire reference genome or a portion of the genome of the subject.
- the portion of the genome can be 10 Mb or less of a particular chromosome; other sizes of a region are mentioned herein.
- the plurality of cell-free DNA molecules can be from one or more particular regions of the reference genome. At least one of the one or more particular regions can correspond to a particular genotype or haplotype comprising one or more alleles. In this manner, methylation of a genotype, haplotype, and particular chromosome copy can be determined. If a subject has certain methylation levels at a genotype or a haplotype, such a property can indicate a pathology (e.g., via genomic imprinting, which is described in more detail elsewhere in this disclosure).
- the analysis can include determining an end sequence motif (also referred to as end motif) of at least one end of the cell-free DNA molecule.
- the end sequence motif can be determined from the outermost bases in a sequence read. If a sequence read only includes one end and not the entire DNA fragment/molecule (e.g., as one of paired reads covering both ends), the bases corresponding to the end of the DNA fragment are used and not the bases toward the middle of the fragment.
- An end of the cell-free DNA molecule can have a first position at the outermost position, a second position that is next to the first position, and a third position that is next to the second position.
- a first amount of a first set of one or more end sequence motifs that have C at the first position and that have G at the second position is determined (e.g., an amount of CGN or anyone of more these motifs).
- the first set of one or more end sequence motifs can include one or more of CGA, CGC, CGG, and CGT, with CGN denoting all.
- the first amount can be of a first set of one or more end sequence motifs that have C at the second position and G at the third position (e.g., NCG).
- the first set of one or more end sequence motifs can include one or more of ACG, CCG, GCG, and TCG, with NCG denoting all.
- Such example end motifs can be used in various ways as described herein to determine amounts and/or normalized parameters (e.g., frequencies) for use in making the classification. Additional normalization based on expected frequency per region or per fragment can be used.
- Block 4120 can be performed in a similar manner as block 2720.
- the first amount can be determined using sequencing or probe-based techniques, such as PCR. An amount of sequence reads having the particular end motif can be counted.
- probe-based techniques can be used. For example, a number of reactions positive for a particular probe can be used.
- an intensity signal e.g., electrical or optical from probes that are specific to a particular end motif can be used to determine the first amount.
- Other amounts can be determined, e.g., for normalization. For example, when the first amount is determined using one or more CGN motifs, a second amount of a second set of one or more end sequence motifs that have C at the second position and G at the third position (e.g., NCG) can be determined. Determining the classification can then include normalizing the first amount with the second amount to obtain a normalized first amount that is compared to the calibration value.
- the second set of one or more end sequence motifs can include all of or one or more of ACG, CCG, GCG, and TCG.
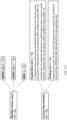
- FIG. 42 shows an example workflow of a machine learning model for predicting methylation status at a single molecule level according to embodiments of the present disclosure.
- the reference genome 4210 is shown with fragments 4205 aligned. For each fragment, three types of information is shown: end-motifs, genomic (sequence) content, and the size.
- Such data can be formed into various data structures for creating a feature vector.
- One example for the feature vector is shown in FIG. 42 .
- the end motif is converted into a matrix that has one-hot encoding for each position.
- the end-motif is a CGCA.
- the first base is a C, so the first row will be one for the C and zero for the other bases.
- the second base is the G, so the second row of G will be one.
- the third base is C; and the fourth base is A.
- a 4-dimensional vector was used for encoding a nucleotide. For example, [1, 0, 0, 0], [0, 1, 0, 0], [0, 0, 1, 0] and [0, 0, 0, 1] represent A, C, G, and T, respectively.
- the matrix would be expressed as the format shown in FIG. 42 (denoted by the feature I).
- the size of the fragment size is determined based on the pair-end sequencing, and alignment of the sequence reads to a reference genome. When an entire molecule is sequenced, the alignment is not needed. A normalization can be done, e.g., by dividing by 600, as most cell-free DNA fragments are less than 600 bp. Accordingly, the fragment size can be determined by the outmost genomic coordinates of the aligned paired-end reads and normalized by a factor of 600 bp (denoted by the feature II).
- the genomic context is a matrix that includes a dinucleotide pattern.
- the first base in the 2-mer is on the rows, and the second base is in the columns.
- a matrix element stores a count for the number of instances of that 2-mer.
- the sequence context can be encoded into a matrix comprising the counts of di-nucleotide types along a single plasma DNA molecule.
- With a 2-nt slide window to scan a single plasma DNA molecule we determined dinucleotide frequencies of a single plasma DNA molecule.
- a 2-dimensional (2-D) matrix was used to express di-nucleotide frequencies (denoted by the feature III).
- genomic (sequence) context can also be the entire sequence. Another example of genomic context is the GC percentage.
- Two or more of these features can be combined (or just end motifs used alone) and input to a machine learning model for predicting whether this molecule is fully methylated or fully unmethylated, or partially methylated.
- the combined feature matrices containing the aforementioned features (I, II and III) were used for training a CNN model to determine whether one DNA fragment is fully methylated or fully unmethylated.
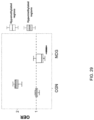
- FIG. 43A shows the performance of methylation status analysis of single molecule using CNN on the basis of end motifs, sequence context, fragment sizes according to embodiments of the present disclosure.
- FIG. 43B shows the performance of methylation status analysis of single molecule using molecules with CGN and NCG end motifs based on a CNN model according to embodiments of the present disclosure.
- the accuracy was determined a subset of the DNA fragments.
- the model performance could be significantly improved (i.e., the AUC of from 0.85 to 0.94; P value ⁇ 0.0001, DeLong test).
- the selective analysis of subset of DNA molecules with certain motifs would allow for enhancing the classification power in deducing the methylation status of a single molecule.
- the CGN and NCG motifs can act like a tag in the DNA fragment that enables distinguishing fully methylated and fully unmethylated DNA fragments on an individual, molecular level more accurately. Accordingly, on a per-fragment basis, embodiments can determine how methylated a particular fragment is.
- test cell-free DNA molecule can be generated in various ways, e.g., using techniques described for block 2710 and 4110.
- the test cell-free DNA molecule can include one or more CpG sites.
- a sequence context of the test cell-free DNA molecule is determined using the one or more sequence reads.
- the sequence context include combination of bases that appear sequentially (e.g., various k-mers, also referred to as K-mers).
- the sequence context can include a K-mer matrix specifying a number of instances of each K-mer in the test cell-free DNA molecule, wherein K is an integer.
- the K-mer matrix is a di-nucleotide matrix specifying a number of instances of di-nucleotide pairs in the test cell-free DNA molecule.
- the sequence context can include sequence information from each nucleotide of the test cell-free DNA molecule (i.e., the entire sequence).
- a first end sequence motif of a first end of the test cell-free DNA molecule is determined using the one or more sequence reads.
- the number of bases in the first end sequence motif can vary. For example, different k-mers can be used. If there is one sequence read for the entire molecule, the outermost k bases can be selected from either end of the sequence read. If two sequence reads are obtained from both ends, the bases corresponding to the ends of the DNA molecule can be identified based on position information obtained in a sequencing process. If probes are used, the signal corresponding to a particular probe provides the ordering from outermost toward the center of the DNA molecule.
- a second end sequence motif of a second end of the test cell-free DNA molecule can also be determined.
- method 4400 includes loading, into memory of a computer system, a machine learning model that is trained using a training set of training cell-free DNA molecules having CpG sites whose methylation status is known.
- the training set can include sequence contexts and end sequence motifs of the training cell-free DNA molecules.
- the methylation levels of training cell-free DNA molecules can be determined using methylation-aware sequencing or by artificially causing all of the CpG sites to be methylated or unmethylated. For instance, whole genome amplification can make the newly synthesized DNA unmethylated, and CpG methyltransferase (M.Sssl) can render an input DNA sample methylated.
- the training can involve various techniques and models, including ensemble models. For example, different subset of training samples can be used, and different subsets can be used for validation.
- the machine learning model can determine a methylation level of the one or more CpG sites of the test cell-free DNA molecule.
- the sequence context of the test cell-free DNA molecule and the first end sequence motif are input to the machine learning model.
- Such a feature vector can use other features.
- the second end sequence motif of the other end can also be input to the machine learning model.
- Another example feature is size of the test cell-free DNA molecule.
- the methylation level can be a percentage of the plurality of CpG sites that are methylated.
- the methylation level can be whether a particular CpG site is methylated.
- the first end sequence motif can be one-hot encoded for inputting to the machine learning model.
- the format for the sequence context can be a matrix of two or higher dimensions, e.g., based on the value of K used for the K-mers.
- the size can be input into the machine learning model as part of determining the methylation level of the one or more CpG sites of the test cell-free DNA molecule.
- the size can have various formats, e.g., a number of bases or a ratio relative to a reference size, e.g., 600 bp.
- the size can be determined in a variety of ways. For example, when one sequence read spans the test cell-free DNA molecule (e.g., as a result of single molecule sequencing), the size of the test cell-free DNA molecule can be determined by counting a number of bases in the one sequence read. As another example, when two sequence reads (paired-end) corresponding to both ends of the test cell-free DNA molecule are obtained, the size can be determined by aligning the two sequence reads to a reference genome.
- An SVM model was trained with the O/E ratios of CG-containing motifs (i.e., ACG, TCG, CCG, GCG, CGA, CGT, CGC, and CGG) using a dataset comprising 1,000 regions with and 1,000 regions without 5hmC, respectively.
- the trained model was used to analyze another independent dataset comprising 1,000 regions with and 1,000 regions without 5hmC, respectively.
- a CGN/NCG ratio can be used for select end motifs, e.g., ones that have an opposite relationship.
- End motif frequencies can also be used, potentially as a feature vector of the CG-containing motifs (e.g., 1-8 values for the different 3-mer end motifs).
- the feature vector can be used in machine learning models, as described herein. Such amounts can be used directly without the normalization for the expected amount.
- FIG. 47 is a flowchart illustrating a method for measuring 5hmC methylation of a region in a genome of a subject using cell-free DNA molecules.
- method 4700 can be performed partially or entirely using a computer system. Blocks performing similar functionality as in other methods can be performed in a similar manner as described for those blocks in other flowcharts.
- the analysis can include determining an end sequence motif (also referred to as end motif) of at least one end of the cell-free DNA molecule, which may done in a similar manner as block 4110.
- the end sequence motif can be determined from the outermost bases in a sequence read. If a sequence read only includes one end and not the entire DNA fragment/molecule (e.g., as one of paired reads covering both ends), the bases corresponding to the end of the DNA fragment are used and not the bases toward the middle of the fragment.
- An end of the cell-free DNA molecule can have a first position at the outermost position, a second position that is next to the first position, and a third position that is next to the second position.
- a first amount of a first set of one or more end sequence motifs that have C at the first position and that have G at the second position is determined (e.g., an amount of CGN or anyone of more these motifs).
- the first set of one or more end sequence motifs can include one or more of CGA, CGC, CGG, and CGT, with CGN denoting all.
- the first amount can be of a first set of one or more end sequence motifs that have C at the second position and G at the third position (e.g., NCG).
- the first set of one or more end sequence motifs can include one or more of ACG, CCG, GCG, and TCG, with NCG denoting all.
- Such example end motifs can be used in various ways as described herein to determine amounts and/or normalized parameters (e.g., frequencies) for use in making the classification. Additional normalization based on expected frequency per region or per fragment can be used.
- Block 4720 can be performed in a similar manner as blocks 2720 and 4120.
- a classification for 5hmC methylation of the region in the genome of the subject is determined by comparing the first amount to a calibration value.
- the calibration value can be determined using cell-free DNA molecules that are from one or more calibration samples and that are located at CpG sites having known classifications for a level of 5hmC methylation.
- the known classifications can be determined using an 5hmC-aware assay (e.g., as described above) or from the results of others that used a 5hmC-aware assay.
- Other amounts can be determined, e.g., for normalization. For example, when the first amount is determined using one or more CGN motifs, a second amount of a second set of one or more end sequence motifs that have C at the second position and G at the third position (e.g., NCG) can be determined. Determining the classification can then include normalizing the first amount with the second amount to obtain a normalized first amount that is compared to the calibration value.
- the second set of one or more end sequence motifs can include all of or one or more of ACG, CCG, GCG, and TCG.
- An expected amount can be determined of the first set of one or more end sequence motifs based on a reference sequence of the reference genome in the region. Then, determining the classification can include normalizing the first amount with the expected amount to obtain a normalized first amount (e.g., O/E ratio) that is compared to the calibration value.
- a normalized first amount e.g., O/E ratio
- a total amount of sequence motifs for the plurality of cell-free DNA molecules can be determined. Then, determining the classification can includes normalizing the first amount with the total amount to obtain a normalized first amount (e.g., a motif ratio or relative frequency) that is compared to the calibration value.
- a normalized first amount e.g., a motif ratio or relative frequency
- a feature vector of multiple amounts can be provided to a machine learning model, e.g., as described in sections above.
- the different amounts can correspond to a selection of end motifs, e.g., those included in the first set and additional end motifs.
- Such end motifs included in the feature vector can be all of the k-mers for a particular k or just a subset. Accordingly, a respective amount of each 3-mer end sequence motif that has a C at the first position and that has G at the second position can be determined (i.e., four amounts for CGN).
- a feature vector including the respective amounts, which include the first amount, can be generated and then input into a machine learning model as part of determining the classification for methylation of the region in the genome of the subject.
- the machine learning model can be trained using cell-free DNA molecules that are from the one or more calibration samples.
- the feature vector can include respective amounts for each 3-mer end sequence motif that has a C at the second position and that has G at the third position (i.e., for NCG).
- the feature vector can include respective amounts of all 3-mer end sequence motifs.
- the relative amount can be measured in various ways.
- the relative amount can be measured as a ratio (such as the CGN/NCG motif ratio, or NCG/CGN motif ratio, or CGN/(CGN+NCG), or NCG/(CGN+NCG)). Comparisons of CGN or NCG to other end motif(s) can also be used.
- normalization or any other normalization mentioned herein can be performed by analyzing a same number of DNA molecules, producing a same number of reads, or using a same sized sample (e.g., specified number of ml). Thus, if the same number of DNA molecules are sequenced from one run to another, then the amount can be used directly, as there is effectively a normalization performed.
- Such various options for normalization can be used by any of the methods described herein.
- results below show that the relative amounts of plasma DNA molecules terminated with CGN or NCG motif at genomic regions exhibiting differential DNA methylation patterns across different tissue types can enable the determination of a probability of the tissue of origin of plasma DNA molecules and determination of a fractional concentration of cell-free DNA molecules of a particular type.
- FIGS. 48A and 48B show motif frequencies for fetal-specific hypermethylated and hypomethylated regions according to embodiments of the present disclosure.
- the CGN and NCG end motif frequencies are distinct between DNA molecules carrying fetal-specific alleles and shared alleles, depending on the methylation status.
- Placenta-specific hypermethylated sites were defined by those CpG sites with a methylation density of over 70% in the placenta tissues but below 30% in the buffy coat samples.
- Placenta-specific hypomethylated sites were defined by those CpG sites with a methylation density of below 30% in the placenta tissues but over 70% in the buffy coat samples.
- fetal-specific alleles specifically single nucleotide polymorphisms.
- FIGS. 49A-49B show a correlation between the fetal DNA fraction and the CGN/NCG ratio based on plasma DNA molecules originating from placenta-specific hypermethylated CpG sites ( FIG. 49A ), and placenta-specific hypomethylated CpG sites ( FIG. 49B ) according to embodiments of the present disclosure.
- the measurements were performed for various pregnancies at different trimesters.
- the shape and color of the data point indicates whether the pregnancy was in the first, second, or third trimester.
- the amount of only CGN or only NCG may also be used.
- the amount for CGN was determined using the amount of sequence reads that had CG at the end that covered the hypermethylated or hypomethylated site.
- the amount for NCG was determined using the amount of sequence reads that had NCG at the end, where the CG covered the hypermethylated or hypomethylated site
- the CGN/NCG ratio from placenta-specific hypermethylated CpG sites and hypomethylated CpG sites were positively and negatively correlated with the fetal fraction deduced by the fetal-specific SNPs, respectively (Pearson's r: 0.90 and -0.86; P value ⁇ 0.0001 for both correlations).
- the data indicates that the relative amounts of plasma DNA molecules ended with CGN and NCG (e.g., the CGN/NCG ratio) could be used for deducing a likelihood for the tissues of origin of plasma DNA molecules and determine a fractional concentration of cell-free DNA for clinically-relevant DNA, such as fetal DNA, tumor DNA, or transplant DNA.
- the lines in FIGS 49A-49B are examples of calibration functions. For any CGN/NCG ratio determined for a new sample, that value can be input to the linear function to provide an output on the X axis of the fetal fraction. Such a calibration function can be viewed as including calibration values of calibration data points, which also include the corresponding fractional concentration.
- the determination of a fractional concentration can include a comparison of a new CGN/NCG ratio (or other feature described herein) to a calibration value for which a corresponding fractional concentration is known.
- the known fraction concentrations can be determined via some other technique, such as a SNP analysis.
- Calibration functions need only be determined once, so such a SNP-based analysis (which may not be applicable in all situations or take more time, assays, and effort to identify the SNPs) does not need to be performed for a new sample.
- Calibration functions can be more complex, such as machine learning techniques (e.g., support vector regression), which would still involve a comparison to a calibration value.
- CGN and NCG can be used independently.
- a measurement window e.g., 11 bp
- the CGN and NCG motif frequency was calculated within the placenta-specific hypermethylated and hypomethylated regions.
- Each region has one CpG site.
- the motif frequency is determined by normalizing the amount of CGN or NCG with the total amount of end motifs from the region, e.g., (CGN or NCG) / total amount of ends in the region).
- FIGS. 50A-50B show the correlation between the fetal DNA fraction and the frequency of NCG and CGN motifs based on plasma DNA molecules originating from placenta-specific hypermethylated CpG sites ( FIG. 50A ), and placenta-specific hypomethylated CpG sites ( FIG. 50B ) according to embodiments of the present disclosure.
- the frequency of NCG and CGN motifs derived from placenta-specific hypermethylated regions were negatively and positively correlated with the fetal fraction deduced by the fetal-specific SNPs, respectively (Pearson's r: -0.84 and 0.87; P value ⁇ 0.0001 for both correlations).
- the CGN motif frequency was defined as the number of end motifs in the region having CGN.
- the NCG motif frequency was defined as the number of end motifs in the region having NCG.
- Such normalization can be performed in a variety of ways. For example, as described above, a total number of cell-free DNA molecules analyzed (e.g., sequenced) or the total number of cell-free DNA ends can be used instead of just limiting the normalization factor to just DNA within a measurement window around a CpG site.
- FIG. 51 shows the correlation of the fetal fraction deduced by SNP-based approach (x-axis) and using CGN/NCG ratios from placenta-specific hypermethylated and hypomethylated CpG sites (y-axis) according to embodiments of the present disclosure.
- a SVR model was used.
- the fetal DNA contributions from pregnant samples estimated by the CGN/NCG ratio were correlated with the fetal fractions deduced by the SNP-based approach (Pearson's r: 0.95; P value ⁇ 0.0001). This correlation was true for all three trimesters.
- the calibration data points shown in FIG. 51 are examples of training data (e.g., calibration data points) used to determine the SVR calibration function. Such training data is from calibration samples, as is described herein for other examples.
- FIG. 51 shows the accuracy of the SVR calibration function.
- tissue types besides fetal/placental can be analyzed using loci having tissue-specific methylation status.
- loci that are hypermethylated or hypomethylated in liver cells, blood cells, or colon cells can be used to determine a percentage (fractional concentration/contribution) of DNA fragments in a sample (e.g., plasma or serum) that are from each of the tissues.
- a sample e.g., plasma or serum
- the relative changes for different tissue types for different types of subjects are analyzed relative to healthy control.
- Tissue-specific hypermethylated CpGs were defined as CpGs with a methylation density of over 70% in a target tissue (e.g., the liver) and below 30% across the remaining tissues being analyzed.
- Tissue-specific hypomethylated CpGs were defined as CpGs with a methylation density of below 30% in a target tissue and over 70% in the remaining tissues.
- the CGN/NCG motif ratio was calculated for each set of tissue-specific CpGs in a plasma DNA sample.
- the relative amount of plasma DNA molecules ended with CGN and NCG could be used for deducing the tissues of origin of plasma DNA molecules from multiple tissues. Accordingly, a relative change (increase or decrease) in the contribution for different tissues can be determined using the motif ratio.
- a baseline motif ratio for a healthy control can be used to determine whether a particular tissue contribution has changed significantly, e.g., by comparing the new motif ratio for a subject where the motif ratio is for a tissue-specific locus.
- a specific fractional contribution for any particular tissue type can be determined using a respective calibration function for a particular tissue type.
- cleavage profiles can be used.
- the usage of the cleavage profiles can be similar as described above.
- One or more amounts e.g., cleavage ratios/densities
- Such amounts can be used with one or more calibration values (e.g., as a calibration function) for which fractional concentrations are known and which form calibration data points, as described herein.
- a cleavage amount at a given position or a cleavage profile for two or more positions may be used.
- each vector contains 11 numbers that reflect the average cleavage ratio of each position. Other numbers of values may be used for different widths of the cleavage profile, as described herein, such as widths of 4, 5, 6, 7, 8, 9, and 10.
- the fetal fraction is determine using a fetal-specific allele.
- the training of the SVR model was performed using the leave-one-out strategy, which trains the model with 29 samples, then predict the fetal fraction of one sample. Then, we train on a different 29 and test another one until all the samples of the thirty samples have been in the testing set and have a fetal fraction predicted. We compared the predicted fetal fraction with the SNP-based analysis.
- FIG. 57 shows the correlation between the fetal fractions deduced by proximal cleavage profiles and the SNP-based approach according to embodiments of the present disclosure.
- the estimated fetal DNA contribution from pregnancy samples by the cleavage profiles was well correlated with the fetal fraction deduced by the fetal-specific SNPs (Pearson's r: 0.97; P value ⁇ 0.0001).
- the cleavage profile could be used to predict the DNA contribution of other tissues, including, but not limited to, the liver, brain, T cells, B cells, neutrophil, muscle, heart, placenta, ovary, breast, testis, etc.
- the tissue fraction can be of clinically-relevant DNA, e.g., tumor DNA.
- cleavage profile could be input to a machine learning model.
- all of the cleavage profiles could be input at the same time to the machine learning model. In this manner, more features would be input to the machine learning model.
- Such a feature matrix can be the size of the number of CpG sites by the number of positions in the measurement window.
- the fractional concentration of cell-free DNA molecules (cell-free DNA fragments) from a particular tissue type can be determined in various ways. For example, the amount of DNA fragments ending at the 0 or -1 position of one or more CpG sites in a new sample and calibration information (e.g., from calibration samples having known or measured fractional concentration by other means) can be used to determine the fractional concentration in the new sample.
- the analyzing can be done in various ways (e.g., as described herein) and can include physical steps, which may be controlled by a computer.
- analyzing can be performed by sequencing or PCR (e.g., droplet digital PCR) or mass spectrometry or electrophoresis.
- method 5800 includes identifying a first set of CpG sites that all have a first differential methylation for the first tissue type in the reference genome.
- the first differential methylation can be that all of the first set of CpG sites are hypomethylated or that all of the first set of CpG sites are hypermethylated.
- all of the first set of CpG sites are 5hmC-enriched or that all of the first set of CpG sites are 5hmC-depleted.
- both types of CpG sites may be used, e.g., when amounts at each are used as separate features for a machine learning model.
- a second set of CpG sites of the other type e.g., hypermethylated if the first set is hypomethylated
- the first amount can be determined of a first set of one or more end sequence motifs.
- the first set of one or more sequence motifs can have C at the first position and G at the second position.
- the first set of one or more sequence motifs can have C at the second position and G at the third position.
- determining the first amount can include determining respective amounts of cell-free DNA molecules ending at the 0 or -1 position of each of the first set of CpG sites.
- determining the fractional concentration of DNA from the first tissue type can include comparing each of the respective amounts to a respective calibration value.
- Such respective amounts can be used in a feature vector for a model.
- comparing each of the respective amounts to the respective calibration value can be performed by inputting the respective first amounts as part of a feature vector into a machine learning model.
- cleavage profile for each site can be used (See B.3 above). Accordingly, for each CpG site(s), a cleavage profile (e.g., for each position of at least two positions within a window around the CpG site) can be determined, e.g., by determining a respective amount of cell-free DNA molecules ending at the position. The respective amounts for the at least two positions and the CpG site can be included in the feature vector.
- method 5800 includes determining the fractional concentration of DNA from the first tissue type in the biological sample by comparing the first amount to a calibration value.
- the calibration value can be determined from one or more calibration samples having known fractional concentrations of DNA from the first tissue type.
- the fractional concentration of DNA can have various resolution, e.g., above or below a certain percentage or within a range. Such range can have various resolutions, such as 5%, 10%, 15%, 20%, 25%, and 30% resolution or less. As an example, a 5% resolution can correspond to 35%-40%
- a second amount of cell-free DNA molecules ending at a first position within a window around any one the first set of CpG sites can be determined, such as the -1 position corresponding to NCG, if the first amount used the 0 position. Then, determining the fractional concentration can includes normalizing the first amount with the second amount to obtain a normalized first amount (e.g., CGN/NGC) that is compared to the calibration value.
- the first position can be at +1 or -1 from one of the one or more CpG sites.
- the window can be at least -2 to +2 from a CpG site, or at least -4 to +4 from a CpG site.
- a cleavage profile can be determined in the window, e.g., as described above.
- the cleavage profile can be of at least two positions (e.g., the first position) in the window other than one of the CpG sites.
- a respective amount (including the second amount) of cell-free DNA molecules ending at the position can be determined.
- the first amount of cell-free DNA molecules ending at 0 or -1 position of the CpG site can be compared to the respective amount of cell-free DNA molecules ending at the position. For instance, a separate ratio of each of the respective amounts and the first amount can be determined.
- the comparison of the respective amounts can be performed as part of a machine learning model (e.g., support vector regression).
- a feature vector can include the respective amounts and the first amount.
- the feature vector can then be input into a machine learning model to determine the fractional concentration.
- the machine learning model can be trained using cell-free DNA molecules from the one or more calibration (training) samples having the known (e.g., measured) fractional concentrations of DNA from the first tissue type.
- the training can be performed using various techniques, as will be appreciated by the skilled person.
- a second set of one or more CpG sites that are all hypermethylated can be used (e.g., as described in FIGS. 45-47 ).
- a first feature vector can be generated for the first set, and a second feature vector can be generated for the second set. Both feature vectors can be input into the machine learning model as part of determining the fractional concentration.
- the at least two positions can include all positions within the window.
- the window can be at least +2 to -2 from a CpG site or at least +4 to -4 from a CpG site.
- multiple tissue types can be analyzed to determine fractional concentrations or changes thereof.
- a second set of one or more CpG sites that are all hypomethylated or all hypermethylated for a second tissue type in the reference genome can be identified.
- a second amount of cell-free DNA molecules ending within a window around any one of the second set of CpG sites can be determined.
- a change in a fractional concentration of DNA from the second tissue type in the biological sample can be determined by comparing the second amount to another calibration value (e.g., a baseline in a healthy control).
- another calibration value e.g., a baseline in a healthy control.
- the other calibration value can be determined from one or more other calibration samples.
- a reference matrix A can include values at a set of sites, such as CpG sites and surrounding sites, e.g., when cleavage profiles are used. End motif values may also be used.
- Each column in the reference matrix can correspond to a different tissue type or to a different template sample (e.g., specified contributions for different tissues).
- the measurement of the values b (measurement vector) in the cell-free mixture e.g., plasma, urine, etc.
- the contribution vector x provides the percentage for each tissue type when the columns in A correspond to the different tissue types.
- the reference values in the reference matrix from cells of the tissues can be prepared using various DNA nucleases (e.g., DNASE1L3, DNASE1, DFFB, etc.) to digest nuclei from those corresponding tissues.
- the nuclei from the liver tissue can be subjected to DNSE1L3-based digestion.
- the sequencing data of digested DNA is analyzed to obtain reference values (e.g., of cleavage profiles and/or the end motif profiles) at various sites to obtain tissue-specific profiles of fragmentomics features to which the plasma fragmentomics features of cfDNA can be compared.
- a reference can be generated through the analysis of tissue-specific cfDNA molecules. For example, one could use liver transplant cases, identify liver-specific DNA (e.g., using a tissue-specific allele) and use the liver-specific sequence reads to determine a tissue-specific profile. A similar technique can be used for other tissues.
- each template sample can correspond to a set of percentages that total 100%.
- a liver transplant subject can be used as a template, with specified percentages for each of a set of tissues.
- Other templates might be for pathologies of each organ, e.g., so that there is a template for each tissue type whose contribution is to be determined.
- a healthy subject can also be used.
- To determine a percentage contribution for each tissue the contribution of a template would be used in combination with the percentage of that tissue type for that template sample, which would be done for each template sample.
- FIG. 28 above shows that fragmentation at a CpG site reflects methylation.
- a pathology such as cancer
- can be determined using fragmentation e.g., over a whole genome or over repeat sections of the genome.
- Such an analysis can also be performed for all or a large part of the genome, e.g., at least 10 Mb, 20 Mb, 50 Mb, 100 Mb, 500 Mb, 1Gb or more.
- the part of the genome does not need to be contiguous, e.g., the 50 Mb could be split among five 10 Mb regions that are disjoint (i.e., not contiguous).
- the genome-wide CGN/NCG ratios could be used to reflect genome-wide methylation levels and be used for disease detection.
- Global methylation density was analyzed for 6 healthy controls and 8 patients with hepatocellular carcinoma (HCC) with a median of 424 million paired-end bisulfite sequencing reads (IQR: 352- 519 million).
- FIG. 59A-59C show boxplots illustrating the difference of genome-wide methylation density ( FIG. 59A ), genome-wide CGN/NCG ratio ( FIG. 59B ), and CGN/NCG ratio for Alu regions ( FIG. 59C ) between healthy controls and HCC cases according to embodiments of the present disclosure.
- HCC cases indicated significantly lower methylation levels compared with healthy controls (P value ⁇ 0.001, Wilcoxon test).
- the genome-wide CGN/NCG ratio was analyzed for each patient and showed a significant reduction in the HCC group compared with the control group ( FIG. 59B ; P value ⁇ 0.001, Wilcoxon Rank Sum test).
- the global and repeat-specific fragmentation patterns specific to CGN and NCG can provide accurate disease detection.
- the separation between healthy and HCC are surprising for the use of fragmentation values, which do not require the use of a methylation-aware assay.
- the end motifs of CGN and NGC can also be used individually.
- the CGN and NCG motif frequency were calculated across the genome, as well as for the Alu regions.
- FIGS. 60A-60D show boxplots illustrating the difference of CGN and NCG motif frequency from whole genome and Alu regions between healthy controls and HCC cases according to embodiments of the present disclosure.
- short cfDNA fragments can be defined as cfDNA fragments with a length of lower than but not limited to 50bp, 60bp, 70bp, 80bp, 90bp, 100bp, 200bp, 300bp, 400bp, 500bp, 600bp, 1000bp, etc
- long cfDNA fragments can be defined as cfDNA fragments with a length of higher than but not limit to 300bp, 400bp, 500bp, 600bp, 700bp, 800bp, 900bp, 1000bp, 2000bp, 3000bp, 4000bp, 5000bp, etc.
- cfDNA fragments with different sizes can be obtained from Illumina sequencing platforms, long-read sequencing technologies, or other platforms. Mass can also be used as a measure of size, instead of length.
- the pathology can be determined in various ways. For example, the amount of DNA fragments ending at CpG sites (e.g., CGN end motifs, or subsets thereof) in a new sample.
- the amount can be determined using a group for DNA fragments within a particular size range.
- the classification can be determined using various models, such as a comparison of one amount to a threshold, cutoff, or reference value or a machine learning model. Such models can be trained using reference/calibration samples having known or measured classification (e.g., via using a different technique). As with training of other models, different accuracy goals can be selected, e.g., a desired tradeoff between sensitivity and specificity. Such training can be done for other techniques described herein.
- FIG. 72 is a flowchart illustrating a method 7200 for determining a level of a pathology according to embodiments of the present disclosure.
- the biological sample including cell-free DNA.
- method 7200 can be performed partially or entirely using a computer system. Blocks performing similar functionality as in other methods can be performed in a similar manner as described for those blocks in other flowcharts.
- method 7200 includes analyzing a plurality of cell-free DNA molecules from the biological sample to obtain sequence reads.
- the sequence reads can include ending sequences corresponding to ends of the plurality of cell-free DNA molecules.
- Block 7210 can be performed in a similar manner as block 2710 and other analysis steps described herein.
- analyzing a cell-free DNA molecule can include determining a location of the cell-free DNA molecule in a reference genome, e.g., when the analysis is of a region smaller than the entire genome. Such a region can be a chromosome.
- the plurality of cell-free DNA molecules can be located in the region of the reference genome. The location can be determined in various ways, as described herein, such as aligning sequence reads to the reference genome or using location-based probes.
- method 7200 includes, for each of the plurality of cell-free DNA molecules, determining a sequence motif for each of one or more ends of the cell-free DNA molecule.
- Block 7220 can be implemented via any of the techniques described herein to determine an end motif, e.g., via sequencing or probe-based techniques, including PCR.
- Block 7220 can be implemented in a similar manner as block 4120.
- the end sequence motif can be determined from the outermost bases in a sequence read. If a sequence read only includes one end and not the entire DNA fragment/molecule (e.g., as one of paired reads covering both ends), the bases corresponding to the end of the DNA fragment are used and not the bases toward the middle of the fragment.
- An end of a cell-free DNA molecule can have a first position at the outermost position, a second position that is next to the first position, and a third position that is next to the second position.
- method 7200 includes determining a first amount of a first set of one or more end sequence motifs that have C at the first position and that have G at the second position (e.g., an amount of CGN or any one of more these motifs).
- the first set of one or more end sequence motifs can include one or more of CGA, CGC, CGG, and CGT, with CGN denoting any nucleotide at the third position.
- the first amount can be normalized in various ways.
- the first amount can be of a first set of one or more end sequence motifs that have C at the second position and G at the third position (e.g., NCG).
- the first set of one or more end sequence motifs can include one or more of ACG, CCG, GCG, and TCG, with NCG denoting all.
- Such example end motifs can be used in various ways as described herein to determine amounts and/or normalized parameters for use in making the classification.
- Block 7230 can be performed in a similar manner as block 2730 and similar steps described herein.
- Other amounts can be determined and used, e.g., other end motifs, such as NCG to determine a CGN/NCG ratio.
- a second amount of a second set of end sequence motifs that have C at the second position and G at the third position can be determined, corresponding to NCG or any subset thereof.
- the classification can then include normalizing the first amount with the second amount to obtain a normalized first amount that is compared to a reference value.
- a total amount of sequence motifs e.g., in one or more particular regions
- the normalized first amount e.g., a motif ratio or relative frequency
- method 7200 includes determining a classification of the level of pathology for the subject based on a comparison of the first amount to a reference value.
- the reference value can be determined as part of training a model, e.g., using reference samples with known classifications.
- the comparison to the reference value can be performed in various ways, e.g., a direct comparison to the reference value, where values above or below indicate a different classification. As another example, the comparison can be performed via a machine learning model.
- the plurality of cell-free DNA molecules can be from one or more particular regions of a reference genome.
- the pathology can be in these one or more particular regions.
- at least one of the one or more particular regions corresponds to a particular genotype or haplotype comprising one or more alleles.
- a property can indicate a level of a pathology, resulting from a disease (e.g., cancer or inflammation) or an abnormal condition/disorder of or linked to a physiological process (e.g., via ageing, or a developmental process, or genomic imprinting, which is described in more detail elsewhere in this disclosure).
- a copy number aberration can be such a pathology.
- Embodiments can also determine a normal level of a physiological process, e.g., monitoring of a stage of gestation, ageing of a person, or a type or level of genomic imprinting of a person.
- the analysis of the cell-free DNA molecules can include measuring a size of the cell-free DNA molecule.
- the first amount can then be determined for a first group of cell-free DNA molecules that are within a first size range, e.g., as described in section 5.
- the first size range can correspond to sizes that are less than a size cutoff or to sizes that are greater than a first size cutoff.
- a second amount can be determined for a second group of cell-free DNA molecules that are within a second, different size range, e.g., corresponding to sizes that are less than a second size cutoff when the first range is greater than the first size cutoff.
- the second amount can be of one or more end motifs of CGN or NCG, as described above.
- the classification can then be determined using the first amount and the second amount.
- a third amount of NCG long DNA fragments and a fourth amount of NCG short DNA fragments can be used, e.g., as defined using the first size cutoff and the second size cutoff.
- the classification can use a ratio of the first amount and the second amount, can use a difference of the first amount and the second amount, or can use a machine learning model that receives the first amount and the second amount as separate inputs.
- certain sites can be analyzed. For example, sites that are hypermethylated or hypomethylated for a particular tissue can be analyzed. Such an analysis can determine whether a particular type of cancer (e.g., tissue origin/source) is present.
- the size of the region can be at least 2 bp, 10 bp, 100 bp, 200 bp, 500 bp, 1 kb, 2 kb, 3 kb, 4 kb, 5 kb, 10 kb, 50 kb, 100 kb, 500 kb, 1 Mb, and so on.
- the DNA fragments from a particular region/site can be obtained via targeted techniques (also referred to as enrichment), which may be performed via amplification of certain regions or by capturing DNA from certain regions. Further details for enrichment can be found in other sections of this disclosure.
- the amount of CGN end motifs should increase, and the amount of NCG end motifs should decrease.
- the CGN/NCG ratio should increase. But if the enzyme activity was downregulated, then such a ratio might decrease.
- the amount of CGN should decrease, and the amount of NCG should increase.
- the CGN/NCG ratio should decrease.
- cleavage profiles or other methylation related cfDNA fragmentomic features from liver or HCC specific hypomethylated regions could be used for HCC detection.
- methylation related cfDNA fragmentomic features from other tissue-specific hypomethylated or hypermethylated regions could be used for the detection of other cancers.
- methylation related cfDNA fragmentomic features from colon-, breast-, or prostate-specific hypomethylated or hypermethylated regions could be used for colon cancer, breast cancer, or prostate cancer diagnosis, respectively.
- Such methylation related cfDNA fragmentomic features from specific regions could be deduced from targeted sequencing results.
- the targeted sequencing could be based on but not limited to probe-based hybridization, amplicon-based sequencing, immunoprecipitation followed by sequencing, etc.
- End motif frequencies from tissue-specific hypomethylation or hypermethylation are used to detect and monitor diseases such as cancer.
- HBV chronic hepatitis B
- HCC hepatocellular carcinoma
- cleavage profiles For the data collection, we determined the cleavage profiles from placenta-specific hypermethylated and hypomethylated CpG sites. The cleavage profiles were determined using techniques described herein. Such cleavage profiles from 30 pregnancy samples (median paired-end sequencing reads: 206 million (IQR: 142 - 232 million)) and 9 non-pregnancy healthy female cases (median paired-end sequencing reads: 397 million (IQR: 350 - 424 million)) were determined. In this example implementation, the cleavage profiles can be generated by merging data for all of the sites of a particular type, e.g., merging the data for all the hypomethylated sites for one cleavage profile and all the hypermethylated sites for another cleavage profile.
- PCs principal components based on the cleavage profiles from placenta-specific hypermethylated sites
- PC1 and PC2 could classify pregnant and non-pregnant subjects into two clusters, with only two non-pregnant subjects overlapping with pregnant subjects.
- Principal components based on the cleavage profiles derived from placenta-specific hypomethylated sites (i.e., PC1 and PC2) showed a better differentiation between pregnant and non-pregnant cases without any overlap between the two groups ( FIG 79B ).
- PCs based on the cleavage profiles from both placenta-specific hypermethylated and hypomethylated sites displayed a complete separation between pregnant and non-pregnant cases ( FIG. 80 ).
- the data suggested that the selective analysis of cleavage profiles derived from hypomethylated and/or hypermethylated CpG sites would improve the classification power for classifying different pathological and physiological states.
- FIG. 81 shows the performance of HCC detection on the basis of the cleavage profiles.
- the model performance could reach an AUC of 0.915, 0.939 and 0.947 to distinguish HCC patients from non-HCC controls when trained with cleavage profiles from HCC-specific hypermethylated or hypomethylated, or the combination of hypermethylated and hypomethylated CpGs.
- N amounts can be determined, each amount corresponding to an amount of DNA fragments at a respective region or CpG site.
- Such N amounts can be a feature vector that is input to a machine learning model.
- cleavage profiles can be determined for each CpG site (or some subset of sites), and these individual cleavage sites can be used, e.g., input to a machine learning model. Each cleavage profile could be input to a machine learning model to determine the level of a pathology.
- all of the cleavage profiles could be input at the same time to the machine learning model. In this manner, more features would be input to the machine learning model.
- a feature matrix can be the size of the number of CpG sites by the number of positions in the measurement window.
- the input feature vector can include a total of N*K values.
- separate cleavage ratios can be determined for each cleavage profile for different subsets of CpG sites, and a majority vote can be used to determine the level of pathology.
- tissue-specific regions/sites can be for a cancer tissue type, or just for the tissue itself.
- Methylation related cfDNA fragmentomic features from other tissue-specific hypomethylated or hypermethylated regions could be used for the detection of other cancers.
- methylation related cfDNA fragmentomic features from colon-, breast-, or prostate-specific hypomethylated or hypermethylated regions could be used for colon cancer, breast cancer, lung cancer, bladder cancer, kidney cancer, or prostate cancer diagnosis, respectively, or differentially methylated regions specific to those cancers can be used.
- cleavage profiles would be useful for classifying the subtypes of cancer such as adenocarcinoma versus squamous cell carcinoma.
- methylation related cfDNA fragmentomic features from specific regions could be deduced from targeted sequencing results.
- the targeted sequencing could be based on but not limited to probe-based hybridization, amplicon-based sequencing, immunoprecipitation followed by sequencing, etc. Such enrichment can be performed for any technique described herein that used tissue-specific sites.
- a machine learning model can use an input feature vector including fragmentomic features (e.g., end motifs or cleave profiles as described herein) for various tissue types.
- the tissue types can include cancer tissues and/or non-cancer tissues.
- the non-cancer tissues can include normal tissues and non-malignant tissues adjacent to a particular cancer tissue.
- one set of fragmentomic features can correspond to differentially-methylated regions for bladder cancer (or just bladder tissue), another set of features for prostate cancer (or just prostate), and another set for kidney cancer (or just the kidney).
- a particular model may be trained to identify a particular one of the cancers, with different model trained to detect a different one of the cancers.
- one model can be trained to detect bladder cancer, even though fragmentomic features at prostate-specific methylated regions are also used in the model, i.e., in addition to bladder-specific methylated regions.
- the section on urine examples provides further details.
- Each model can provide a probability, and the type of cancer with the highest probability can be identified for further analysis, e.g., for treatment or for further screening tests (e.g., imaging), as are described herein.
- embodiments can use one multiclass model (e.g., a neural network such as one that has convolutional layers, a CNN), which provides probabilities for each of the cancer types whose tissue-specific methylated regions are used for generating the fragmentomic features.
- a multiclass model e.g., a neural network such as one that has convolutional layers, a CNN
- the section on urine examples provides further details.
- the classification of cancer type can be performed after (or in conjunction with) a cancer vs non-cancer determination.
- the training samples might only be of a set of relevant cancer types (e.g., those whose DNA would show up significantly in urine), as it can be assumed that an initial model was used to detect cancer. Both models can use the same raw data, e.g., sequencing or PCR data about the end motifs of fragments.
- CG-containing 3-mer end motifs examples include CG-containing 3-mer end motifs (a total of 8 types of end motifs) for the classification of multiple cancer types in plasma DNA.
- clustering and classification analyses for a total of 45 plasma DNA samples (median reads: 457 million, IQR: 249 - 522 million), including 34 patients with hepatocellular carcinoma (HCC), 11 patients with colorectal cancer (CRC) samples.
- HCC hepatocellular carcinoma
- CRC colorectal cancer
- Such a CG-containing 3-mer end motif analysis can be performed using a set of tissue-informative methylation markers across different tissue types.
- Unsupervised clustering algorithms can be used, which may include but not limited to principal component analysis (PCA), t-distributed stochastic neighbor embedding (tSNE), uniform manifold approximation and projection (UMAP), etc.
- PCA principal component analysis
- tSNE t-distributed stochastic neighbor embedding
- UMAP uniform manifold approximation and projection
- FIG. 83A shows an unsupervised clustering analysis for patients with HCC and CRC on the basis of 5' 3-mer CG containing end motifs related to tissue-informative and tissue-shared CpG sites.
- a total of 48 5' 3-mer CG containing end motifs from HCC and CRC-informative hypermethylated and hypomethylated CpGs and tissue-shared hypermethylated and hypomethylated CpGs were used as input features.
- PCA analysis showed that patients with HCC and patients with CRC tended to be clustered into two groups.
- FIGS. 83B-83C show performance of HCC classifier on the basis of 5' 3-mer CG containing end motifs related to tissue-informative and tissue-shared CpG sites.
- FIG. 83B is a boxplot showing the probability of having HCC predicted by the classifier.
- FIG. 83C is a ROC analysis in differentiating between patients with HCC and with CRC using the classifier.
- the cancer types could be more than two, including, lung cancer, stomach cancer, esophageal cancer, etc. When more than 2 cancer types are considered, multiple binary classifiers can be used, and the cancer type that gives the highest probability score would be regarded as the most probable cancer type which the tested subject is suffering from.
- One can use one multiclass classification model e.g., convolutional neural networks (CNN)
- CNN convolutional neural networks
- Other multiclass classification models can be used, including decision trees, random forests, deep neural networks, recurrent neural networks, etc.
- the level of pathology (e.g., cancer, inflammation, or an abnormal level of a physiological process) in a particular tissue type can be determined using one or more regions (which include or be defined by CpG sites) that are differentially methylated in the tissue type.
- the regions/sites of a same type e.g., all hypermethylated or hypomethylated
- FIG. 84 is a flowchart of a method 8400 for determining a level of a pathology for a particular tissue using tissue-specific differentially methylated regions according to embodiments of the present disclosure.
- the biological sample includes cell-free DNA.
- method 8400 can be performed partially or entirely using a computer system. Blocks performing similar functionality as in other methods can be performed in a similar manner as described for those blocks in other flowcharts.
- the analysis can include determining an end sequence motif (also referred to as end motif) of at least one end of the cell-free DNA molecule.
- the end sequence motif can be determined from the outermost bases in a sequence read. If a sequence read only includes one end and not the entire DNA fragment/molecule (e.g., as one of paired reads covering both ends), the bases corresponding to the end of the DNA fragment are used and not the bases towards the middle of the fragment.
- An end of the cell-free DNA molecule can have a first position at the outermost position, a second position that is next to the first position, and a third position that is next to the second position.
- method 8400 includes (b) determining a first amount of a first set of one or more end sequence motifs that have C at the first position and that have G at the second position. (e.g., an amount of CGN or anyone of more these motifs).
- the first amount can be of a first set of one or more end sequence motifs that have C at the second position and G at the third position (e.g., NCG).
- Block 8420 can be performed in a similar manner as other techniques described herein that determine an amount of sequence motif(s), such as blocks 2720, 4120, or 7230. Given that such motifs include CGN and NCG, they can define CpG sites. When a plurality of regions are used, a total amount at the regions/sites can be determined or the respective amount at each region/site can be determined and used.
- Other amounts can be determined and used, e.g., other end motifs, such as NCG to determine a CGN/NCG ratio.
- a second amount of a second set of end sequence motifs that have C at the second position and G at the third position can be determined, corresponding to NCG or any subset thereof.
- the classification can then include normalizing the first amount with the second amount to obtain a normalized first amount that is compared to a reference value.
- a total amount of sequence motifs e.g., in one or more particular regions
- the normalized first amount e.g., a motif ratio or relative frequency
- a total amount of sequence motifs for the plurality of cell-free DNA molecules can be determined. Then, determining the classification can include normalizing the first amount with the total amount to obtain a normalized first amount (e.g., a motif ratio or relative frequency) that is compared to the reference value.
- a normalized first amount e.g., a motif ratio or relative frequency
- the first amount can be determined for a first group of cell-free DNA molecules that are within a first size range.
- the first size range can correspond to sizes that are less than a size cutoff or that are greater than a second size cutoff.
- method 8400 includes (c) determining a classification of the level of pathology in the first tissue type for the subject based on a comparison of the first amount to a reference value.
- Block 8430 can be performed in a similar manner as other techniques described herein that perform such a comparison to a reference/calibration value, such as blocks 4130, 5840, and 7240.
- Separate values can be determined for each region/site. Respective amounts of cell-free DNA molecules ending at each of the first set of CpG sites are determined, each of the respective amounts can be compared to a respective reference value, e.g., directly or by inputting the respective first amounts as part of a feature vector into a machine learning model. A cleavage profile can be determined for each site. Thus, for each of at least two positions within a window around each site, a respective amount can be determined. The respective amounts for the at least two positions, including the CpG site, can be included in the feature vector.
- a feature vector of multiple amounts can be provided to a machine learning model, e.g., as described in sections above.
- the different amounts can correspond to a selection of end motifs, e.g., those included in the first set and additional end motifs.
- Such end motifs included in the feature vector can be all of the k-mers for a particular k or just a subset.
- a respective amount of each 3-mer end sequence motif that has a C at the first position and that has G at the second position can be determined (i.e., four amounts).
- a feature vector including the respective amounts, which include the first amount can be generated and then input into a machine learning model as part of determining the classification of the level of pathology for the subject.
- the feature vector can include respective amounts for each 3-mer end sequence motif that has a C at the second position and that has G at the third position.
- blocks 8410-8430 can be repeated for one or more additional sets of one or more regions of the reference genome, where the one or more additional sets are all hypomethylated or all hypermethylated in one or more respective other tissue types.
- the classification can indicate a level of a pathology, resulting from a disease (e.g., cancer or inflammation) or an abnormal condition/disorder of or linked to a physiological process (e.g., via ageing, or a developmental process, or genomic imprinting, which is described in more detail elsewhere in this disclosure).
- a copy number aberration can be such a pathology.
- Embodiments can also determine a normal level of a physiological process, e.g., monitoring of a stage of gestation, ageing of a person, or a type or level of genomic imprinting of a person.
- a particular set of region(s), e.g., for a particular differential-methylation state and tissue type, can include multiple regions of multiple region types.
- a first region type e.g., type I
- a second region type e.g., type II
- a tissue-shared type can also be used, such that another particular set of region(s) are all hypomethylated or all hypermethylated in the cancer tissue type of a first tissue and a healthy first tissue, e.g., HCC tissue and healthy liver tissue.
- the classification can use a first machine learning model that is trained using all of the regions, including ones from different tissue types. Further, amounts of the sequence motif(s) for the same regions for other can be used to train one or more other machine learning models using training samples having the pathology in one or more other tissue types (e.g., for colon cancer if first tissue type is HCC).
- the classification of the level of pathology can use a multiclass machine learning model (e.g., a CNN) that provides a probability of each of the plurality of tissue types having the pathology.
- the plurality of tissue types can include cancer tissue types (e.g., bladder cancer and CRC) and non-cancer tissue types (e.g., bladder tissue and colon tissue).
- 5-hydroxymethylcytosine is an important mammalian DNA epigenetic modification that has been linked to gene regulation and cancer pathogenesis.
- Different regions have different 5hmC methylation patterns. For example, some regions will be 5hmC-enriched or 5hmC-depleted in one tissue type (which may be a cancer tissue type), and other regions will be 5hmC-enriched or 5hmC-depleted in another tissue type.
- Such enrichment or depletion relates to the proportion of methylated molecules in a region that have 5hmC methylation relative to other types of methylation.
- HCC-specific 5hmC-enriched and 5hmC-depleted regions were identified by analyzing hMe-Seal data of plasma DNA samples from 10 healthy subjects and 11 HCC cases ( Song et al. Cell Res 2017; 27(10):1231-1242 ).
- HCC-specific 5hmC-enriched regions were defined as regions across which the peak signals in sequencing coverage were present in HCC samples but were absent in healthy subjects.
- HCC-specific 5hmC-depleted regions were defined as regions across which the peak signals in sequencing coverage were present in healthy subjects but were absent in HCC samples.
- FIGS. 85A-85B show performance of HCC detection on the basis of 5' 3-mer CG containing end motifs from HCC-specific 5hmC-enriched and 5hmC-depleted CpGs.
- the SVM model can have a total of 16 features: the eight 3-mer end motifs that include CG in 5hmC-enriched regions and the eight 3-mer end motifs that include CG in 5hmC-depleted regions.
- the probability of HCC is provided based on the separation of the 3-mer end O/E ratio relative to the training samples that had HCC or the training samples that were non-HCC.
- the horizontal axis of FIG. 85A corresponds to different subjects: healthy, HMB, early HCC (eHCC), intermediate HCC (iHCC), and advanced HCC (aHCC).
- FIG. 85B shows an AUC of 0.96.
- a CGN/NCG ratio can be used for select end motifs, e.g., ones that have an opposite relationship.
- End motif frequencies can also be used, potentially as a feature vector of the CG-containing motifs (e.g., 1-8 values for the different 3-mer end motifs).
- the feature vector can be used in machine learning models, as described herein. Such amounts can be used directly without the normalization for the expected amount.
- the first amount can be determined for a first group of cell-free DNA molecules that are each located within one or more regions that are each 5hmC-enriched or each 5hmC-depleted for a particular tissue type.
- the pathology can be of the particular tissue type, e.g., of a particular cancer type.
- the particular tissue type can be the HCC cancer tissue.
- the method can further comprise determining a second amount of the first set of one or more end sequence motifs of the plurality of cell-free DNA molecules that are each located within one or more regions that are each 5hmC-depleted for the particular tissue type.
- the classification can be determined using the first amount and the second amount, e.g., via a machine learning model analysis as is described above for SVM.
- Such techniques can detect and monitor virus-related cancers such as but not limited to Burkitt's lymphoma, some types of Hodgkin's and non-Hodgkin's lymphoma, stomach cancer, nasopharyngeal carcinoma (NPC), hepatocellular carcinoma, cervical cancer, etc.
- virus-related cancers such as but not limited to Burkitt's lymphoma, some types of Hodgkin's and non-Hodgkin's lymphoma, stomach cancer, nasopharyngeal carcinoma (NPC), hepatocellular carcinoma, cervical cancer, etc.
- viruses including but not limited to, Epstein-Barr virus (EBV), hepatitis B virus (HBV), hepatitis C virus (HCV), human immunodeficiency virus (HIV), human herpesvirus 8 (HHV-8), human papillomavirus (HPV), etc.
- EBV Epstein-Barr virus
- HBV hepatitis B virus
- methods can include determining a second amount of a second set of end sequence motifs that have C at the second position and G at the third position. Determining the classification can include normalizing the first amount with the second amount to obtain a normalized first amount that is compared to the reference value.
- the second set of end sequence motifs can include NCG, where N includes any nucleotide at the first position.
- a respective amount of cell-free DNA molecules ending at the position can be determined, thereby determining respective amounts.
- a feature vector can include the respective amounts and the first amount.
- the feature vector can be input into a machine learning model as part of determining the classification of the level of pathology.
- the machine learning model is trained using cell-free DNA molecules from training samples having known classifications.
- Respective amounts of cell-free DNA molecules ending at each of the first set of CpG sites can be determined.
- Determining classification of the level of pathology can includes comparing each of the respective amounts to a respective reference value. Comparing each of the respective amounts to the respective reference value can be performed by inputting the respective first amounts as part of a feature vector into a machine learning model.
- a respective amount of cell-free DNA molecules ending at the position can be determined, thereby determining respective amounts.
- the feature vectors can include the respective amounts for the at least two positions and the respective amount for the CpG site.
- Methods can include determining a respective amount of each 3-mer end sequence motif that has a C at the first position and that has G at the second position.
- a feature vector can include the respective amounts, which include the first amount.
- the feature vector can be input into a machine learning model as part of determining the classification of the level of pathology. Additionally or alternatively, the feature vector can include respective amounts for each 3-mer end sequence motif that has a C at the second position and that has G at the third position.
- the feature vector can include respective amounts of all 3-mer end sequence motifs.
- Analyzing the plurality of viral cell-free DNA molecules can includes determining a size of each of the plurality of viral cell-free DNA molecules. A statistical value of a size distribution of the plurality of viral cell-free DNA molecules can be determined. Determining the classification of the level of pathology for the subject further can includes comparing the statistical value to a size reference value.
- Some embodiments can perform a fragmentation analysis for certain genotypes/haplotypes, which can correspond to different types of tissue.
- a donor, a fetus, or a tumor can have a tumor-specific allele.
- end motif frequencies from a genomic region of interest could be used to predict its methylation density.
- Plasma DNA molecules originating from hypermethylated regions bore a higher frequency of 5'-CGN motif (where N can be A, T, C or G, i.e., the sum of CGA, CGT, CGC, and CGG end motifs) but a lower frequency of 5'-NCG motif (i.e., the sum of ACG, TCG, GCG, and CCG end motifs), when compared with those from hypomethylated regions (See FIG. 29 ).
- FIGS. 100A and 100B show CGN and NCG end motif frequencies could be used for predicting genomic imprinting according to embodiments of the present disclosure.
- FIG. 100A shows allele-specific methylation at imprinted loci (the GNAS gene: chr20:57,415,043-57,415,176). The filled and unfilled circles represent the methylated and unmethylated CpG sites, respectively. Each row represents one sequenced DNA fragment. The vertical numbers indicate the genomic coordinates for CpG sites being analyzed (hg 19). The nucleotide alleles (A/G) correspond to the genomic location of SNP. Those molecules carrying the A alleles were methylated, and those carrying the G alleles were unmethylated.
- FIG. 100B shows a bar plot illustrating the CGN and NCG motif frequencies deduced from those molecules carrying A alleles and G alleles, respectively.
- DNA fragments carrying alleles of "A” or "G” at a SNP site are inherited from different parents. Those DNA fragments carrying G alleles were unmethylated, while those carrying A alleles were methylated.
- DNA fragments carrying A alleles (methylated) showed a higher frequency of CGN motifs (13.9% vs 3.7%) but a lower frequency of NCG motifs (2.8% vs 13.0%), compared with the corresponding DNA fragments carrying G alleles (unmethylated).
- the approaches based on CGN and NCG end motifs could be used for detecting a number of diseases and disorders linked to genetic imprinting, including but not limited to Angelman syndrome, Prader-Willi syndrome, and Beckwith-Wiedemann syndrome.
- imprinting can be identified. If the end motif frequency is the same for the two alleles, then imprinting is not present. In this manner, bisulfite sequencing is not needed, as the sequencing information at the end of the fragments can provide information about the imprinting between the methylation levels and the alleles. In this manner, it can be determined which of the alleles is from the mother and which is from the father.
- cancer-specific methylation alteration could be predicted by analyzing the regional CGN and NCG end motifs. For example, differences in the end motifs can occur when copy number aberrations exist or when a tumor is differentially methylated between haplotypes.
- a tonality issue can be identified.
- one allele can be A and the other can be T allele.
- a allele For fragments with the A allele, it can be determined the percentage that end at a neighboring CpG site. The same can be done for the T allele.
- the ratio of the two differences can indicate a difference in fragmentation (e.g., due to methylation) between the two haplotypes
- women have two X chromosomes, but one of them for any one cell will be methylated and one is unmethylated. But if you summarize all the trillions of cells in the body, the methylation should be balanced.
- the tonality imbalance in the cleavage profile or CGN and/or NCG profiles between the two haplotypes can be used to determine which haplotype is inherited from the mother.
- AB maternal heterozygous sites
- the two maternal haplotypes are Hap I and Hap II. If the maternal Hap I is transmitted into the fetus, then the maternal cfDNA linked to the Hap I would be over-represented compared to the Hap II, as some sites in which the foetus will be homozygous (AA) will skew the haplotype dosage linked to Hap I and Hap II. Thus, the over-represented Hap I will have more fetal-derived cfDNA than the Hap II. Hap I would show the hypomethylation nature.
- a second methylation level corresponding to a second haplotype of the female can be determined using a second amount of the first set of end sequence motif(s) for cell-free DNA molecules from the second haplotype. Then, an inherited haplotype of the fetus can be determined based on the first methylation level and the second methylation level.
- the region can include a sequence variant or a copy number aberration determined from the plurality of cell-free DNA molecules, e.g., via a count of DNA fragments at a region or a size analysis, as described in U.S. Patent Publication Nos. 2013/0040824 and 2016/0201142 .
- Whether the sequence variant or the copy number variation is from a tumor can be determined based on the classification for methylation of the region. For example, if the fragmentation indicates a methylation below a threshold, then the sequence variant or the copy number variation can be identified as originating from a tumor.
- Such analyses can use any of the methylation classifications described above, including for an individual fragment, for a site, and for a region.
- FIG. 101 shows performance in differentiating between methylated and unmethylated regions depending on the sequencing depths according to embodiments of the present disclosure.
- the CG-containing motifs i.e., CGN and NCG end motifs
- the distributions of CGN end motifs in methylated regions and unmethylated regions could be written as Bin(n, 0.83) and Bin(n, 0.22), respectively, where "Bin” represented binomial distribution function and "n” represented total numbers of CG-containing motifs (ranging from 1 to 100).
- Bin represented binomial distribution function
- n represented total numbers of CG-containing motifs (ranging from 1 to 100).
- AUC receiver-operating characteristic curve
- FIG. 104 shows the CGN/NCG motif ratios of putatively hypermethylated and hypomethylated CpGs in the sequencing libraries of plasma DNA prepared with 4 PCR cycles, 8 PCR cycles, and without PCR, respectively.
- the CGN/NCG motif ratio of putatively hypermethylated CpGs was higher in the library prepared without PCR (4.39) or with 4 PCR cycles (4.28), compared with that with 8 PCR cycles (2.55).
- There was no distinct difference in the CGN/NCG motif ratio for putatively hypomethylated CpGs between PCR and PCR-free libraries PCR-free: 0.69; 4 PCR cycles: 0.75; 8 PCR cycles: 0.70; FIG. 104 ).
- tissue-shared sites can be of various tissues present in the sample, such as different blood cells, as well as other organs of the body (e.g., liver, colon, breast, lung, and pancreas).
- patient one has 64 features and is indicated as having bladder cancer.
- Patient two also has 64 features and is labeled as bladder cancer. The patients were clustered to see if these markers can separate the different cancer types without any training.
- CG-containing 3-mer end motifs from tissue-informative hypermethylated and hypomethylated CpGs together with a set of commonly hypermethylated or hypomethylated CpGs across all tissues were considered as input features for clustering and classification analyses.
- the commonly hypermethylated and hypomethylated CpGs across all tissues were defined as a methylation density of over 70% or below 30% in normal urothelium, blood cell, normal kidney, bladder cancer, kidney cancer and prostate cancer tissues, also referred to as the tissue-shared hypermethylated and hypomethylated CpG sites.
- Various unsupervised clustering algorithms can be used, which may include but not limited to principal component analysis (PCA), t-distributed stochastic neighbor embedding (tSNE), uniform manifold approximation and projection (UMAP), etc.
- PCA principal component analysis
- tSNE t-distributed stochastic neighbor embedding
- UMAP uniform manifold approximation and projection
- FIG. 122 shows unsupervised clustering analysis for patients with bladder, kidney and prostate cancers on the basis of 5' 3-mer CG containing end motifs related to tissue-informative and tissue-shared CpG sites.
- a total of 64 5' 3-mer CG containing end motifs from bladder, kidney, and prostate cancer-informative hypermethylated and hypomethylated CpGs and tissue-shared hypermethylated and hypomethylated CpGs were used as input features.
- a support vector machine was used to train probabilistic classifiers, but other machine learning models can be used, e.g., as described herein.
- the training was performed among different types of cancer related to urine. Other types of cancer can be used when plasma is the sample. Also, such models can differentiate when cancer is present or not.
- cancer detection is performed as an initial assay, e.g., using any of the techniques described herein or via other techniques.
- FIG. 123 shows a schematic for classification of multiple cancer types with multiple binary classifications.
- a subject based on the cancer status, i.e., whether a subject has cancer or not. If the test subject is classified as having cancer, the subject will be further subjected to the classification of cancer types.
- SVM is usually used for binary classification
- multiple binary classifications can be used to determine the cancer type for a patient detected to have cancer when more than two cancer types are being considered. For illustration purposes, three cancer types, including bladder, kidney and prostate cancers, are considered as possible cancers in this example.
- a first SVM classifier (referred to as bladder cancer classifier) was constructed by analyzing the end motif features from bladder cancer-, kidney-cancer, prostate-cancer informative and tissue-shared CpG sites (i.e., 64 features) between Group A and Group B.
- kidney cancer classifier A second SVM classifier (referred to as kidney cancer classifier) was then constructed by analyzing the same set of end motif features which were used in the first SVM classifier but with the use of different patient groups, namely patients with kidney cancers (Group A) versus patients with bladder or prostate cancers (Group B).
- the classification analysis would be repeated by changing another type of cancer (for example kidney cancer) to be the Group A cancer, and the non-kidney cancers (i.e., bladder cancer and prostate cancer) to be the Group B cancer.
- a third SVM classifier (referred to as prostate cancer classifier) was constructed by analyzing the same end motif features as used in the previous two SVM classifiers, but comparing different patient groups, namely, patients with prostate cancer (group A) versus patients with other cancers (group B).
- FIGS. 124A-124B show performance of bladder cancer classifier on the basis of 5' 3-mer CG containing end motifs related to tissue-informative and tissue-shared CpG sites.
- FIG. 124A is a boxplot shows the probability of having bladder cancer predicted by the bladder cancer classifier.
- FIG. 124B shows an ROC analysis differentiating between patients with bladder cancer and with other cancer types using bladder cancer classifier.
- bladder cancer classifier As shown, using the bladder cancer classifier, patients with bladder cancer had higher probability scores compared with patients with kidney and prostate cancers (median: 0.979 vs. 0.012; range: 0.860-0.997 vs. 0.005-0.036). ROC analysis showed that the AUC for the bladder cancer classifier was determined to be 1.00 for distinguishing bladder cancer patients from other cancers.
- the cancer type that gives the highest probability score can be regarded as the most probable cancer type that the tested subject is suffering.
- a sample is classified using the 3 classifiers, i.e., bladder cancer classifier, kidney cancer classifier, prostate cancer classifier.
- the probability scores for the sample using these 3 classifiers are 0.91, 0.12 and 0.08, respectively.
- bladder cancer is considered to be the most probable cancer type which the patient is suffering from based on the results of this analysis.
- Some embodiments can use a multiclass classification model (e.g., convolutional neural networks (CNN)) to analyze multiple cancer types without repeatedly performing multiple binary classifications using CG-containing end motifs related to tissue-informative and tissue-shared CpG sites.
- a multiclass classification model there is one model that provides multiple probabilities, e.g., three probabilities for each three difference cancers in the example above.
- the same input features can be the 64 CG-containing end motifs in the example above.
- FIGS. 126A-126B shows a schematic illustration for multiple cancer classification using a CNN model on the basis of CG-containing motifs. Frequencies of CG-containing 3-mer end motifs from tissue-informative hypermethylated and hypomethylated CpGs together with a set of tissue-shared hypermethylated or hypomethylated CpGs were analyzed.
- the column represents the type of CG-containing motifs (i.e., ACG, TCG, CCG, GCG, CGA,CGT,CGC,CGG) and the row represents the motif frequency be calculated.
- ACG CG-containing motifs
- the "ACG” motif frequency from bladder cancer-informative hypermethylated CpGs (13.21) was filled in the corresponding cell between a column of "Bladder cancer-informative hypermethylation" and a row of "ACG”.
- Table 4 showed an overall accuracy of ⁇ 91.7% (66/72) with an accuracy of 100% (46/46), 81.3% (13/16), and 70% (7/10) for bladder, kidney, and prostate cancers, respectively.
- multiple cancer classification analyses can be done in cfDNA from other body fluids, such as plasma, cerebrospinal fluid, saliva, pleural fluid, etc.
- the cancer types could be more than three, including liver cancer, colorectum cancer, lung cancer, etc.
- other multiclass classification models can be used, including decision trees, random forests, deep neural networks, recurrent neural networks, etc. Table 4.
- the models can improve. When more cancer types are used, more input features will be used, which might benefit the multiclass model more than the individual binary classifiers.
- the classification can uses differentially-methylated regions for a plurality of tissue types, including the first tissue type
- other sets of cell-free DNA molecules from the biological sample can be analyzed.
- Each set of cell-free DNA molecules are located in a respective set of one or more regions of the reference genome, with each of the respective set of one or more regions being hypomethylated or hypermethylated in a respective tissue type of the plurality of tissue types.
- the feature vector can form a matrix with each row corresponding to one of the respective sets of one or more regions of the reference genome.
- a column can correspond to the respective amount of each sequence motif of the first set, and the machine learning model can be a convolutional neural network.
- the subject can be referred for additional screening modalities, e.g. using chest X ray, ultrasound, computed tomography, magnetic resonance imaging, or positron emission tomography. Such screening may be performed for cancer.
- Embodiments of the present disclosure can accurately predict disease relapse, thereby facilitating early intervention and selection of appropriate treatments to improve disease outcome and overall survival rates of subjects.
- an intensified chemotherapy can be selected for subjects, in the event their corresponding samples are predictive of disease relapse.
- a biological sample of a subject who had completed an initial treatment can be sequenced to identify viral DNA that is predictive of disease relapse.
- alternative treatment regimen e.g., a higher dose
- a different treatment can be selected for the subject, as the subject's cancer may have been resistant to the initial treatment.
- the embodiments may also include treating the subject in response to determining a classification of relapse of the pathology. For example, if the prediction corresponds to a loco-regional failure, surgery can be selected as a possible treatment. In another example, if the prediction corresponds to a distant metastasis, chemotherapy can be additionally selected as a possible treatment. In some embodiments, the treatment includes surgery, radiation therapy, chemotherapy, immunotherapy, targeted therapy, hormone therapy, stem cell transplant, or precision medicine. Based on the determined classification of relapse, a treatment plan can be developed to decrease the risk of harm to the subject and increase overall survival rate. Embodiments may further include treating the subject according to the treatment plan.
- Embodiments may further include treating the pathology in the patient after determining a classification for the subject.
- Treatment can be provided according to a determined level of pathology, the fractional concentration of clinically-relevant DNA, or a tissue of origin.
- an identified mutation can be targeted with a particular drug or chemotherapy.
- the tissue of origin can be used to guide a surgery or any other form of treatment.
- the level of the pathology can be used to determine how aggressive to be with any type of treatment, which may also be determined based on the level of pathology.
- a pathology e.g., cancer
- the more the value of a parameter e.g., amount or size
- the more aggressive the treatment may be.
- Treatment may include resection.
- treatments may include transurethral bladder tumor resection (TURBT). This procedure is used for diagnosis, staging and treatment.
- TURBT transurethral bladder tumor resection
- a surgeon inserts a cystoscope through the urethra into the bladder.
- the tumor is then removed using a tool with a small wire loop, a laser, or high-energy electricity.
- NMIBC non-muscle invasive bladder cancer
- TURBT may be used for treating or eliminating the cancer.
- Another treatment may include radical cystectomy and lymph node dissection. Radical cystectomy is the removal of the whole bladder and possibly surrounding tissues and organs.
- Treatment may also include urinary diversion. Urinary diversion is when a physician creates a new path for urine to pass out of the body when the bladder is removed as part of treatment.
- Treatment may include chemotherapy, which is the use of drugs to destroy cancer cells, usually by keeping the cancer cells from growing and dividing.
- the drugs may involve, for example but are not limited to, mitomycin-C (available as a generic drug), gemcitabine (Gemzar), and thiotepa (Tepadina) for intravesical chemotherapy.
- the systemic chemotherapy may involve, for example but not limited to, gemcitabine, methotrexate (Rheumatrex, Trexall), vinblastine (Velban), doxorubicin, and cisplatin.
- treatment may include immunotherapy.
- Immunotherapy may include immune checkpoint inhibitors that block a protein called PD-1.
- Inhibitors may include but are not limited to atezolizumab (Tecentriq), nivolumab (Opdivo), avelumab (Bavencio), durvalumab (Imfinzi), and pembrolizumab (Keytruda).
- Some treatments may include radiation therapy. Radiation therapy can include the use of high-energy photons (e.g., x-rays) or other particles to destroy cancer cells. In addition to each individual treatment, combinations of these treatments described herein may be used. In some embodiments, when the value of the parameter exceeds a threshold value, which itself exceeds a reference value, a combination of the treatments may be used. Information on treatments in the references are incorporated herein by reference.
- FIG. 127 illustrates a measurement system 12700 according to an embodiment of the present disclosure.
- the system as shown includes a sample 12705, such as cell-free DNA molecules within an assay device 12710, where an assay 12708 can be performed on sample 12705.
- sample 12705 can be contacted with reagents of assay 12708 to provide a signal of a physical characteristic 12715.
- An example of an assay device can be a flow cell that includes probes and/or primers of an assay or a tube through which a droplet moves (with the droplet including the assay).
- Physical characteristic 12715 e.g., a fluorescence intensity, a voltage, or a current
- detector 12720 Physical characteristic 12715 (e.g., a fluorescence intensity, a voltage, or a current), from the sample is detected by detector 12720.
- Detector 12720 can take a measurement at intervals (e.g., periodic intervals) to obtain data points that make up a data signal.
- an analog-to-digital converter converts an analog signal from the detector into digital form at a plurality of times.
- Assay device 12710 and detector 12720 can form an assay system, e.g., a sequencing system that performs sequencing according to embodiments described herein.
- a data signal 12725 is sent from detector 12720 to logic system 12730.
- data signal 12725 can be used to determine sequences and/or locations in a reference genome of DNA molecules.
- Data signal 12725 can include various measurements made at a same time, e.g., different colors of fluorescent dyes or different electrical signals for different molecule of sample 12705, and thus data signal 12725 can correspond to multiple signals.
- Data signal 12725 may be stored in a local memory 12735, an external memory 12740, or a storage device 12745.
- Logic system 12730 may be, or may include, a computer system, ASIC, microprocessor, graphics processing unit (GPU), etc. It may also include or be coupled with a display (e.g., monitor, LED display, etc.) and a user input device (e.g., mouse, keyboard, buttons, etc.). Logic system 12730 and the other components may be part of a stand-alone or network connected computer system, or they may be directly attached to or incorporated in a device (e.g., a sequencing device) that includes detector 12720 and/or assay device 12710. Logic system 12730 may also include software that executes in a processor 12750.
- a display e.g., monitor, LED display, etc.
- a user input device e.g., mouse, keyboard, buttons, etc.
- Logic system 12730 and the other components may be part of a stand-alone or network connected computer system, or they may be directly attached to or incorporated in a device (e.g., a
- Logic system 12730 may include a computer readable medium storing instructions for controlling measurement system 12700 to perform any of the methods described herein.
- logic system 12730 can provide commands to a system that includes assay device 12710 such that sequencing or other physical operations are performed. Such physical operations can be performed in a particular order, e.g., with reagents being added and removed in a particular order. Such physical operations may be performed by a robotics system, e.g., including a robotic arm, as may be used to obtain a sample and perform an assay.
- Measurement system 12700 may also include a treatment device 12760, which can provide a treatment to the subject.
- Treatment device 12760 can determine a treatment and/or be used to perform a treatment. Examples of such treatment can include surgery, radiation therapy, chemotherapy, immunotherapy, targeted therapy, hormone therapy, and stem cell transplant.
- Logic system 12730 may be connected to treatment device 12760, e.g., to provide results of a method described herein.
- the treatment device may receive inputs from other devices, such as an imaging device and user inputs (e.g., to control the treatment, such as controls over a robotic system).
- a computer system includes a single computer apparatus, where the subsystems can be the components of the computer apparatus.
- a computer system can include multiple computer apparatuses, each being a subsystem, with internal components.
- a computer system can include desktop and laptop computers, tablets, mobile phones and other mobile devices.
- the subsystems shown in FIG. 128 are interconnected via a system bus 75. Additional subsystems such as a printer 74, keyboard 78, storage device(s) 79, monitor 76 (e.g., a display screen, such as an LED), which is coupled to display adapter 82, and others are shown. Peripherals and input/output (I/O) devices, which couple to I/O controller 71, can be connected to the computer system by any number of means known in the art such as input/output (I/O) port 77 (e.g., USB, FireWire ® ). For example, I/O port 77 or external interface 81 (e.g.
- Ethernet, Wi-Fi, etc. can be used to connect computer system 10 to a wide area network such as the Internet, a mouse input device, or a scanner.
- the interconnection via system bus 75 allows the central processor 73 to communicate with each subsystem and to control the execution of a plurality of instructions from system memory 72 or the storage device(s) 79 (e.g., a fixed disk, such as a hard drive, or optical disk), as well as the exchange of information between subsystems.
- the system memory 72 and/or the storage device(s) 79 may embody a computer readable medium.
- Another subsystem is a data collection device 85, such as a camera, microphone, accelerometer, and the like. Any of the data mentioned herein can be output from one component to another component and can be output to the user.
- a computer system can include a plurality of the same components or subsystems, e.g., connected together by external interface 81, by an internal interface, or via removable storage devices that can be connected and removed from one component to another component.
- computer systems, subsystem, or apparatuses can communicate over a network.
- one computer can be considered a client and another computer a server, where each can be part of a same computer system.
- a client and a server can each include multiple systems, subsystems, or components.
- aspects of embodiments can be implemented in the form of control logic using hardware circuitry (e.g. an application specific integrated circuit or field programmable gate array) and/or using computer software stored in a memory with a generally programmable processor in a modular or integrated manner, and thus a processor can include memory storing software instructions that configure hardware circuitry, as well as an FPGA with configuration instructions or an ASIC.
- a processor can include a single-core processor, multi-core processor on a same integrated chip, or multiple processing units on a single circuit board or networked, as well as dedicated hardware. Based on the disclosure and teachings provided herein, a person of ordinary skill in the art will know and appreciate other ways and/or methods to implement embodiments of the present disclosure using hardware and a combination of hardware and software.
- Any of the software components or functions described in this application may be implemented as software code to be executed by a processor using any suitable computer language such as, for example, Java, C, C++, C#, Objective-C, Swift, or scripting language such as Perl or Python using, for example, conventional or object-oriented techniques.
- the software code may be stored as a series of instructions or commands on a computer readable medium for storage and/or transmission.
- a suitable non-transitory computer readable medium can include random access memory (RAM), a read only memory (ROM), a magnetic medium such as a hard-drive or a floppy disk, or an optical medium such as a compact disk (CD) or DVD (digital versatile disk) or Blu-ray disk, flash memory, and the like.
- the computer readable medium may be any combination of such devices.
- the order of operations may be re-arranged.
- a process can be terminated when its operations are completed, but could have additional steps not included in a figure.
- a process may correspond to a method, a function, a procedure, a subroutine, a subprogram, etc.
- its termination may correspond to a return of the function to the calling function or the main function
- Such programs may also be encoded and transmitted using carrier signals adapted for transmission via wired, optical, and/or wireless networks conforming to a variety of protocols, including the Internet.
- a computer readable medium may be created using a data signal encoded with such programs.
- Computer readable media encoded with the program code may be packaged with a compatible device or provided separately from other devices (e.g., via Internet download). Any such computer readable medium may reside on or within a single computer product (e.g. a hard drive, a CD, or an entire computer system), and may be present on or within different computer products within a system or network.
- a computer system may include a monitor, printer, or other suitable display for providing any of the results mentioned herein to a user.
- Any of the methods described herein may be totally or partially performed with a computer system including one or more processors, which can be configured to perform the steps. Any operations performed with a processor (e.g., aligning, determining, comparing, computing, calculating) may be performed in real-time.
- the term "real-time" may refer to computing operations or processes that are completed within a certain time constraint. The time constraint may be 1 minute, 1 hour, 1 day, or 7 days.
- embodiments can be directed to computer systems configured to perform the steps of any of the methods described herein, potentially with different components performing a respective step or a respective group of steps. Although presented as numbered steps, steps of methods herein can be performed at a same time or at different times or in a different order.
- portions of these steps may be used with portions of other steps from other methods. Also, all or portions of a step may be optional. Additionally, any of the steps of any of the methods can be performed with modules, units, circuits, or other means of a system for performing these steps.
Landscapes
- Life Sciences & Earth Sciences (AREA)
- Chemical & Material Sciences (AREA)
- Health & Medical Sciences (AREA)
- Engineering & Computer Science (AREA)
- Organic Chemistry (AREA)
- Proteomics, Peptides & Aminoacids (AREA)
- Physics & Mathematics (AREA)
- Bioinformatics & Cheminformatics (AREA)
- Analytical Chemistry (AREA)
- Zoology (AREA)
- Wood Science & Technology (AREA)
- General Health & Medical Sciences (AREA)
- Biotechnology (AREA)
- Biophysics (AREA)
- Genetics & Genomics (AREA)
- Immunology (AREA)
- Medical Informatics (AREA)
- Molecular Biology (AREA)
- Microbiology (AREA)
- Biochemistry (AREA)
- General Engineering & Computer Science (AREA)
- Theoretical Computer Science (AREA)
- Bioinformatics & Computational Biology (AREA)
- Spectroscopy & Molecular Physics (AREA)
- Evolutionary Biology (AREA)
- Pathology (AREA)
- Data Mining & Analysis (AREA)
- Databases & Information Systems (AREA)
- Public Health (AREA)
- Bioethics (AREA)
- Epidemiology (AREA)
- Software Systems (AREA)
- Evolutionary Computation (AREA)
- Computer Vision & Pattern Recognition (AREA)
- Artificial Intelligence (AREA)
- Virology (AREA)
- Hospice & Palliative Care (AREA)
- Oncology (AREA)
- Chemical Kinetics & Catalysis (AREA)
- Communicable Diseases (AREA)
Applications Claiming Priority (5)
| Application Number | Priority Date | Filing Date | Title |
|---|---|---|---|
| US202263307622P | 2022-02-07 | 2022-02-07 | |
| US202263328710P | 2022-04-07 | 2022-04-07 | |
| US202263400244P | 2022-08-23 | 2022-08-23 | |
| PCT/CN2023/074730 WO2023147783A1 (en) | 2022-02-07 | 2023-02-07 | Fragmentation for measuring methylation and disease |
| EP23749362.2A EP4476358A4 (de) | 2022-02-07 | 2023-02-07 | Fragmentierung zur messung der methylierung und erkrankung |
Related Parent Applications (1)
| Application Number | Title | Priority Date | Filing Date |
|---|---|---|---|
| EP23749362.2A Division EP4476358A4 (de) | 2022-02-07 | 2023-02-07 | Fragmentierung zur messung der methylierung und erkrankung |
Publications (2)
| Publication Number | Publication Date |
|---|---|
| EP4534687A2 true EP4534687A2 (de) | 2025-04-09 |
| EP4534687A3 EP4534687A3 (de) | 2025-07-16 |
Family
ID=87553104
Family Applications (4)
| Application Number | Title | Priority Date | Filing Date |
|---|---|---|---|
| EP25152221.5A Pending EP4534686A3 (de) | 2022-02-07 | 2023-02-07 | Fragmentierung zur messung der methylierung und erkrankung |
| EP25152224.9A Pending EP4534687A3 (de) | 2022-02-07 | 2023-02-07 | Fragmentierung zur messung der methylierung und erkrankung |
| EP23749362.2A Pending EP4476358A4 (de) | 2022-02-07 | 2023-02-07 | Fragmentierung zur messung der methylierung und erkrankung |
| EP25152220.7A Pending EP4530356A3 (de) | 2022-02-07 | 2023-02-07 | Fragmentierung zur messung der methylierung und erkrankung |
Family Applications Before (1)
| Application Number | Title | Priority Date | Filing Date |
|---|---|---|---|
| EP25152221.5A Pending EP4534686A3 (de) | 2022-02-07 | 2023-02-07 | Fragmentierung zur messung der methylierung und erkrankung |
Family Applications After (2)
| Application Number | Title | Priority Date | Filing Date |
|---|---|---|---|
| EP23749362.2A Pending EP4476358A4 (de) | 2022-02-07 | 2023-02-07 | Fragmentierung zur messung der methylierung und erkrankung |
| EP25152220.7A Pending EP4530356A3 (de) | 2022-02-07 | 2023-02-07 | Fragmentierung zur messung der methylierung und erkrankung |
Country Status (12)
| Country | Link |
|---|---|
| US (3) | US20230313314A1 (de) |
| EP (4) | EP4534686A3 (de) |
| JP (1) | JP2025506435A (de) |
| KR (1) | KR20240144954A (de) |
| CN (1) | CN119301278A (de) |
| AU (2) | AU2023216340C1 (de) |
| CA (1) | CA3243726A1 (de) |
| GB (4) | GB2636510B (de) |
| IL (3) | IL317917B1 (de) |
| MX (2) | MX2024009647A (de) |
| TW (1) | TW202342765A (de) |
| WO (1) | WO2023147783A1 (de) |
Families Citing this family (8)
| Publication number | Priority date | Publication date | Assignee | Title |
|---|---|---|---|---|
| US12592321B2 (en) | 2020-06-19 | 2026-03-31 | University Health Network | Cancer detection and classification using methylome analysis |
| WO2025076452A1 (en) * | 2023-10-06 | 2025-04-10 | Guardant Health, Inc. | Detecting tumor-related information based on methylation status of cell-free nucleic acid molecules |
| TW202530420A (zh) * | 2023-10-13 | 2025-08-01 | 創新診斷科技中心 | 長游離dna之基因體來源、片段組學及轉錄相關性 |
| US20250171858A1 (en) * | 2023-11-29 | 2025-05-29 | Centre For Novostics | Enrichment of clinically-relevant nucleic acids |
| CN117935909B (zh) * | 2024-01-26 | 2024-10-01 | 哈尔滨工业大学 | 基于电信号与序列融合的第三代测序dna甲基化检测方法 |
| WO2025179073A1 (en) * | 2024-02-21 | 2025-08-28 | Adela, Inc. | Methods and systems for tissue informed differentially methylated region analysis |
| CN119380811B (zh) * | 2024-10-23 | 2025-09-09 | 安徽农业大学 | 一种基于二次微调和集成算法的dna甲基化位点预测方法 |
| CN119832995B (zh) * | 2025-03-14 | 2025-07-18 | 中国科学院合肥物质科学研究院 | 一种基于主题模型的dna甲基化测序数据反卷积方法 |
Citations (4)
| Publication number | Priority date | Publication date | Assignee | Title |
|---|---|---|---|---|
| US20130040824A1 (en) | 2010-11-30 | 2013-02-14 | The Chinese University Of Hong Kong | Detection of genetic or molecular aberrations associated with cancer |
| WO2014043763A1 (en) | 2012-09-20 | 2014-03-27 | The Chinese University Of Hong Kong | Non-invasive determination of methylome of fetus or tumor from plasma |
| US20160201142A1 (en) | 2015-01-13 | 2016-07-14 | The Chinese University Of Hong Kong | Using size and number aberrations in plasma dna for detecting cancer |
| US20210047679A1 (en) | 2019-08-16 | 2021-02-18 | The Chinese University Of Hong Kong | Determination of base modifications of nucleic acids |
Family Cites Families (17)
| Publication number | Priority date | Publication date | Assignee | Title |
|---|---|---|---|---|
| US9732390B2 (en) | 2012-09-20 | 2017-08-15 | The Chinese University Of Hong Kong | Non-invasive determination of methylome of fetus or tumor from plasma |
| EP3494234B1 (de) | 2016-08-05 | 2025-02-12 | The Broad Institute, Inc. | Verfahren zur genomcharakterisierung |
| WO2018081130A1 (en) * | 2016-10-24 | 2018-05-03 | The Chinese University Of Hong Kong | Methods and systems for tumor detection |
| SG11201906397UA (en) * | 2017-01-25 | 2019-08-27 | Univ Hong Kong Chinese | Diagnostic applications using nucleic acid fragments |
| CN111051536A (zh) * | 2017-07-26 | 2020-04-21 | 香港中文大学 | 利用不含细胞的病毒核酸改善癌症筛选 |
| AU2019277698A1 (en) | 2018-06-01 | 2020-11-19 | Grail, Llc | Convolutional neural network systems and methods for data classification |
| CN113366122B (zh) * | 2018-12-19 | 2024-01-12 | 香港中文大学 | 游离dna末端特征 |
| US20210189494A1 (en) | 2019-12-18 | 2021-06-24 | The Chinese University Of Hong Kong | Cell-free dna fragmentation and nucleases |
| EP4087942A4 (de) * | 2020-01-08 | 2024-01-24 | The Chinese University Of Hong Kong | Biterminale dna-fragmenttypen in zellfreien proben und deren verwendung |
| IL303888B2 (en) * | 2020-02-05 | 2025-09-01 | Univ Hong Kong Chinese | Molecular testing using long cell-free fragments in pregnancy |
| CA3169488A1 (en) * | 2020-02-28 | 2021-09-02 | Collin MELTON | Identifying methylation patterns that discriminate or indicate a cancer condition |
| KR20230038263A (ko) * | 2020-07-13 | 2023-03-17 | 더 차이니즈 유니버시티 오브 홍콩 | 무세포 핵산에 대한 뉴클레아제 관련 말단 특징 분석 |
| CN112735531B (zh) | 2021-03-30 | 2021-07-02 | 臻和(北京)生物科技有限公司 | 循环无细胞核小体活性区域的甲基化分析方法和装置、终端设备及存储介质 |
| TW202305142A (zh) * | 2021-04-08 | 2023-02-01 | 香港中文大學 | 游離dna甲基化及核酸酶介導之片段化 |
| US20240011105A1 (en) * | 2022-07-08 | 2024-01-11 | The Chinese University Of Hong Kong | Analysis of microbial fragments in plasma |
| US20240043935A1 (en) * | 2022-07-29 | 2024-02-08 | Centre For Novostics Limited | Epigenetics analysis of cell-free dna |
| US20240203530A1 (en) * | 2022-12-16 | 2024-06-20 | Centre For Novostics | Machine learning techniques to determine base methylations |
-
2023
- 2023-02-07 EP EP25152221.5A patent/EP4534686A3/de active Pending
- 2023-02-07 GB GB2501650.2A patent/GB2636510B/en active Active
- 2023-02-07 EP EP25152224.9A patent/EP4534687A3/de active Pending
- 2023-02-07 AU AU2023216340A patent/AU2023216340C1/en active Active
- 2023-02-07 TW TW112104317A patent/TW202342765A/zh unknown
- 2023-02-07 IL IL317917A patent/IL317917B1/en unknown
- 2023-02-07 WO PCT/CN2023/074730 patent/WO2023147783A1/en not_active Ceased
- 2023-02-07 GB GB2501648.6A patent/GB2636508B/en active Active
- 2023-02-07 CN CN202380028477.8A patent/CN119301278A/zh active Pending
- 2023-02-07 IL IL317918A patent/IL317918B1/en unknown
- 2023-02-07 CA CA3243726A patent/CA3243726A1/en active Pending
- 2023-02-07 JP JP2024546428A patent/JP2025506435A/ja active Pending
- 2023-02-07 MX MX2024009647A patent/MX2024009647A/es unknown
- 2023-02-07 IL IL314466A patent/IL314466B1/en unknown
- 2023-02-07 GB GB2411921.6A patent/GB2630241A/en active Pending
- 2023-02-07 EP EP23749362.2A patent/EP4476358A4/de active Pending
- 2023-02-07 KR KR1020247028242A patent/KR20240144954A/ko active Pending
- 2023-02-07 GB GB2501649.4A patent/GB2636509B/en active Active
- 2023-02-07 US US18/106,793 patent/US20230313314A1/en active Pending
- 2023-02-07 EP EP25152220.7A patent/EP4530356A3/de active Pending
- 2023-03-06 US US18/117,992 patent/US12258634B2/en active Active
- 2023-03-06 US US18/118,024 patent/US20230374602A1/en active Pending
-
2024
- 2024-08-05 MX MX2025009554A patent/MX2025009554A/es unknown
-
2025
- 2025-05-01 AU AU2025203115A patent/AU2025203115A1/en active Pending
Patent Citations (4)
| Publication number | Priority date | Publication date | Assignee | Title |
|---|---|---|---|---|
| US20130040824A1 (en) | 2010-11-30 | 2013-02-14 | The Chinese University Of Hong Kong | Detection of genetic or molecular aberrations associated with cancer |
| WO2014043763A1 (en) | 2012-09-20 | 2014-03-27 | The Chinese University Of Hong Kong | Non-invasive determination of methylome of fetus or tumor from plasma |
| US20160201142A1 (en) | 2015-01-13 | 2016-07-14 | The Chinese University Of Hong Kong | Using size and number aberrations in plasma dna for detecting cancer |
| US20210047679A1 (en) | 2019-08-16 | 2021-02-18 | The Chinese University Of Hong Kong | Determination of base modifications of nucleic acids |
Non-Patent Citations (11)
| Title |
|---|
| CHAN ET AL., PROC NATL ACAD SCI USA., vol. 113, 2016, pages E8159 - E8168 |
| JIANG ET AL., PROC NATL ACAD SCI USA., vol. 115, 2018, pages E1 0925 - E1 0933 |
| LO ET AL., SCI TRANSL MED., vol. 2, 2010, pages 61ra91 |
| SCHREIBER ET AL., PROC NATL ACAD SCI USA, vol. 110, 2013, pages 18910 - 18915 |
| SNYDER ET AL., CELL, vol. 164, 2016, pages 57 - 68 |
| SONG ET AL., CELL RES, vol. 27, no. 10, 2017, pages 1231 - 1242 |
| SUN ET AL., PROC NATL ACAD SCI U S A., vol. 115, 2018, pages E5106 - E5114 |
| SUN ET AL., PROC NATL ACAD SCI UAS, vol. 115, 2018, pages E5106 |
| SUN ET AL., PROC NATL ACAD SCI USA., vol. 112, 2015, pages E5503 - 5512 |
| TSE ET AL., PROC NATL ACAD SCI USA, vol. 118, 2021, pages e2019768118 |
| ZHENG ET AL., NUCLEIC ACIDS RESEARCH, vol. 45, 2017, pages 8697 - 8711 |
Also Published As
Similar Documents
| Publication | Publication Date | Title |
|---|---|---|
| EP4534687A2 (de) | Fragmentierung zur messung der methylierung und erkrankung | |
| JP7168247B2 (ja) | 癌スクリーニング及び胎児分析のための変異検出 | |
| US20230279498A1 (en) | Molecular analyses using long cell-free dna molecules for disease classification | |
| HK40120868A (en) | Fragmentation for measuring methylation and disease | |
| HK40119075A (en) | Fragmentation for measuring methylation and disease | |
| HK40120041A (en) | Fragmentation for measuring methylation and disease | |
| US20250171858A1 (en) | Enrichment of clinically-relevant nucleic acids | |
| HK40120384A (zh) | 用於测量甲基化和疾病的片段化 | |
| US20250101528A1 (en) | Uses of cell-free dna fragmentation patterns associated with epigenetic modifications | |
| HK40111738A (zh) | 使用长游离dna分子进行疾病分类的分子分析 |
Legal Events
| Date | Code | Title | Description |
|---|---|---|---|
| PUAI | Public reference made under article 153(3) epc to a published international application that has entered the european phase |
Free format text: ORIGINAL CODE: 0009012 |
|
| STAA | Information on the status of an ep patent application or granted ep patent |
Free format text: STATUS: THE APPLICATION HAS BEEN PUBLISHED |
|
| AC | Divisional application: reference to earlier application |
Ref document number: 4476358 Country of ref document: EP Kind code of ref document: P |
|
| AK | Designated contracting states |
Kind code of ref document: A2 Designated state(s): AL AT BE BG CH CY CZ DE DK EE ES FI FR GB GR HR HU IE IS IT LI LT LU LV MC ME MK MT NL NO PL PT RO RS SE SI SK SM TR |
|
| REG | Reference to a national code |
Ref country code: DE Ref legal event code: R079 Free format text: PREVIOUS MAIN CLASS: C12Q0001680000 Ipc: C12Q0001688600 |
|
| PUAL | Search report despatched |
Free format text: ORIGINAL CODE: 0009013 |
|
| AK | Designated contracting states |
Kind code of ref document: A3 Designated state(s): AL AT BE BG CH CY CZ DE DK EE ES FI FR GB GR HR HU IE IS IT LI LT LU LV MC ME MK MT NL NO PL PT RO RS SE SI SK SM TR |
|
| RIC1 | Information provided on ipc code assigned before grant |
Ipc: C12Q 1/6886 20180101AFI20250606BHEP Ipc: G16B 20/00 20190101ALI20250606BHEP Ipc: G16B 30/00 20190101ALI20250606BHEP Ipc: C12Q 1/70 20060101ALI20250606BHEP |
|
| REG | Reference to a national code |
Ref country code: HK Ref legal event code: DE Ref document number: 40120868 Country of ref document: HK |
|
| STAA | Information on the status of an ep patent application or granted ep patent |
Free format text: STATUS: REQUEST FOR EXAMINATION WAS MADE |
|
| 17P | Request for examination filed |
Effective date: 20260116 |