EP4553489A1 - Verfahren zur gewinnung eines annähernden signals für jeden von mehreren zielanalyten und computervorrichtung zur durchführung davon - Google Patents
Verfahren zur gewinnung eines annähernden signals für jeden von mehreren zielanalyten und computervorrichtung zur durchführung davon Download PDFInfo
- Publication number
- EP4553489A1 EP4553489A1 EP23835817.0A EP23835817A EP4553489A1 EP 4553489 A1 EP4553489 A1 EP 4553489A1 EP 23835817 A EP23835817 A EP 23835817A EP 4553489 A1 EP4553489 A1 EP 4553489A1
- Authority
- EP
- European Patent Office
- Prior art keywords
- approximate function
- parameter
- target analyte
- value
- data set
- Prior art date
- Legal status (The legal status is an assumption and is not a legal conclusion. Google has not performed a legal analysis and makes no representation as to the accuracy of the status listed.)
- Pending
Links
Images















Classifications
-
- G—PHYSICS
- G01—MEASURING; TESTING
- G01N—INVESTIGATING OR ANALYSING MATERIALS BY DETERMINING THEIR CHEMICAL OR PHYSICAL PROPERTIES
- G01N21/00—Investigating or analysing materials by the use of optical means, i.e. using sub-millimetre waves, infrared, visible or ultraviolet light
- G01N21/62—Systems in which the material investigated is excited whereby it emits light or causes a change in wavelength of the incident light
- G01N21/63—Systems in which the material investigated is excited whereby it emits light or causes a change in wavelength of the incident light optically excited
- G01N21/64—Fluorescence; Phosphorescence
-
- G—PHYSICS
- G16—INFORMATION AND COMMUNICATION TECHNOLOGY [ICT] SPECIALLY ADAPTED FOR SPECIFIC APPLICATION FIELDS
- G16B—BIOINFORMATICS, i.e. INFORMATION AND COMMUNICATION TECHNOLOGY [ICT] SPECIALLY ADAPTED FOR GENETIC OR PROTEIN-RELATED DATA PROCESSING IN COMPUTATIONAL MOLECULAR BIOLOGY
- G16B40/00—ICT specially adapted for biostatistics; ICT specially adapted for bioinformatics-related machine learning or data mining, e.g. knowledge discovery or pattern finding
- G16B40/10—Signal processing, e.g. from mass spectrometry [MS] or from PCR
-
- C—CHEMISTRY; METALLURGY
- C12—BIOCHEMISTRY; BEER; SPIRITS; WINE; VINEGAR; MICROBIOLOGY; ENZYMOLOGY; MUTATION OR GENETIC ENGINEERING
- C12Q—MEASURING OR TESTING PROCESSES INVOLVING ENZYMES, NUCLEIC ACIDS OR MICROORGANISMS; COMPOSITIONS OR TEST PAPERS THEREFOR; PROCESSES OF PREPARING SUCH COMPOSITIONS; CONDITION-RESPONSIVE CONTROL IN MICROBIOLOGICAL OR ENZYMOLOGICAL PROCESSES
- C12Q1/00—Measuring or testing processes involving enzymes, nucleic acids or microorganisms; Compositions therefor; Processes of preparing such compositions
- C12Q1/68—Measuring or testing processes involving enzymes, nucleic acids or microorganisms; Compositions therefor; Processes of preparing such compositions involving nucleic acids
- C12Q1/6844—Nucleic acid amplification reactions
- C12Q1/686—Polymerase chain reaction [PCR]
Definitions
- the present disclosure relates to a method for obtaining an approximate signal for each of a plurality of target analytes and a computer device for performing the same.
- a nucleic acid amplification reaction known as a Polymerase chain reaction includes repeated cycles of denaturation process of double-stranded DNA, annealing process of oligonucleotide primers to a DNA template, and extension process of primers by DNA polymerase ( Mullis et al., U.S. Pat. No. 4,683,195 , 4,683,202 and 4,800,159 ; Saiki et al., Science 230:1350-1354 (1985 )).
- Real-time PCR is a PCR-based technique for detecting target nucleic acids in a sample in real-time.
- a signal generation means that emits a detectable fluorescent signal in proportion to the amount of the target nucleic acid during the PCR reaction is used.
- a fluorescence signal proportional to the amount of the target nucleic acid is detected at each measurement point (cycle) through real-time PCR to obtain a data set including each measurement point and signal values at the measurement points, and an amplification curve or an amplification profile curve indicating the intensity of the detected fluorescence signal compared to the measurement point is obtained from the data set.
- an amplification curve by real-time PCR is divided into a baseline region, an exponential region, and a plateau region.
- the exponential region is a region in which a fluorescence signal emitted in proportion to an increase in a PCR amplification product is increased
- the plateau region is a region in which an increase in the PCR amplification product and the emission of the fluorescence signal reaches a saturation state and an increase in the fluorescence signal no longer appears.
- the baseline region the change in the magnitude of the fluorescence signal at the beginning of the reaction is not remarkable.
- the fluorescent signal emitted by the PCR reaction product is not sufficient to be detected. Therefore, in this region, a background signal, which is a fluorescent signal of the reaction sample itself and a fluorescent signal of the measurement system itself, occupies most of the fluorescent signal, rather than the fluorescent signal obtained by amplifying the target analyte.
- the signal detected at the detection temperature of relatively high temperature may include a signal for the target nucleic acid sequence having the detection temperature of relatively high temperature.
- the signal detected at the detection temperature of relatively low temperature may include both a signal for the target nucleic acid sequence having the detection temperature of relatively low temperature and a signal for the target nucleic acid sequence having the detection temperature of relatively high temperature.
- the presence of the target nucleic acid sequence having the detection temperature of relatively high temperature can be determined by a signal detected at the detection temperature of relatively high temperature
- the presence of the target nucleic acid sequence having the detection temperature of relatively low temperature can be determined by the difference between a signal detected at the detection temperature of relatively high temperature and a signal detected at the detection temperature of relatively low temperature using a reference value.
- the reference value is a value obtained in advance, and is obtained from a difference(s) between a signal detected at the detection temperature of relatively high temperature and a signal detected at the detection temperature of relatively low temperature, which are detected as the target nucleic acid sequence having the detection temperature of relatively high temperature is incubated with the signal generation composition in a reaction well(s) other than the above one reaction well.
- the reference value is a value obtained in advance from signals in another reaction wells, and is not a value derived from a signal in the target reaction well in which the plurality of target analytes are to be detected. Accordingly, there is a limitation in that it is difficult to reflect a difference generated according to a detection environment such as a reaction well, a detection device, or the like.
- the reference value is obtained only when the target nucleic acid sequence having the detection temperature of relatively low temperature does not exist and the target nucleic acid sequence having the detection temperature of relatively high temperature exists in the reaction well, by obtaining a difference between a signal detected at the detection temperature of relatively high temperature and a signal detected at the detection temperature of relatively low temperature, and thus there is a limitation that the reference value cannot be obtained in an unknown target reaction well in which the presence or absence of the target analyte is unknown.
- a problem to be solved by the present disclosure is to provide a technology for obtaining an approximate signal for each of a plurality of target analytes from signal values detected at each of different temperatures.
- the process of obtaining the approximate signal includes a process of separating or extracting only signal values for a specific target analyte from the detected signal value, and in this process, a predetermined parameter is used.
- the problem to be solved may include that the value of this parameter is applied as an optimized value for each reaction well.
- a method for obtaining an approximate signal for each of a plurality of target analytes performed by a computer device includes: obtaining, from a signal generation reaction of a plurality of cycles for a first target analyte and a second target analyte in a sample, a first data set measured at a first detection temperature at the plurality of cycles and a second data set measured at a second detection temperature at the plurality of cycles; wherein the first data set includes signal values at the first detection temperature dependent on the presence of the first target analyte in the sample, and the second data set includes signal values at the second detection temperature dependent on the presence of the first target analyte and the second target analyte in the sample; and wherein the signal generation reaction is performed by incubating the sample with a first signal generation composition for detecting the first target analyte in the sample and a second signal generation composition for detecting the second target analyte in the sample
- the performing the j oint-estimation includes: performing the joint-estimation on a parameter value of a first parameter group including approximate function parameters of the approximate function 1-1 and the approximate function 2 and the magnitude parameter; wherein the magnitude parameter in the first parameter group indicates a ratio between the magnitude at the second detection temperature and the magnitude at the first detection temperature; or, performing the joint-estimation on a parameter value of a second parameter group including approximate function parameters of the approximate function 1-2 and the approximate function 2 and the magnitude parameter; wherein the magnitude parameter in the second parameter group indicates a ratio between the magnitude at the first detection temperature and the magnitude at the second detection temperature.
- the performing the joint-estimation includes: estimating a value of an approximate function parameter 1-1 of the approximate function 1-1 by using the first data set; and performing the joint-estimation on a value of an approximate function parameter 2 of the approximate function 2 and the value of the magnitude parameter, by at least partially using the estimated value of the approximate function parameter 1-1 and the second data set.
- the value of the approximate function 1-1 parameter is estimated in such a manner that a sum of differences between the approximate function 1-1 and the first data set at each of the plurality of cycles is minimized.
- the performing the joint-estimation on the value of the approximate function parameter 2 and the value of the magnitude parameter includes: preparing a value of the approximate function 1-2, by using the value of the magnitude parameter and the value of the approximate function 1-1 having the estimated value of the approximate function parameter 1-1; calculating a difference between (a) the second data set and (b) a sum of the approximate function 2 and the approximate function 1-2 at each of the plurality of cycles; and performing the joint-estimation on the value of the approximate function parameter 2 and the value of the magnitude parameter in such a manner that a sum of the difference at each of the plurality of cycles is minimized.
- the performing the j oint-estimation includes: performing the joint-estimation on a value of an approximate function parameter 1-1 of the approximate function 1-1, a value of an approximate function parameter 2 of the approximate function 2, and the value of the magnitude parameter, in consideration of (a) a sum of a difference between the first data set and the approximate function 1-1 at each of the plurality of cycles and (b) a sum of a difference at each of the plurality of cycles between (b-1) the second data set and (b-2) the approximate function 2 and the approximate function 1-2.
- the value of the approximate function parameter 1-1, the value of the approximate function parameter 2, and the value of the magnitude parameter are estimated based on a joint maximum likelihood estimation.
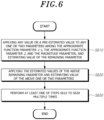
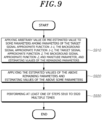
- the performing the joint-estimation further includes: applying an arbitrary value or a pre-estimated value to one or two parameters among the approximate function parameter 1-1, the approximate function parameter 2 and the magnitude parameter, and estimating values of the remaining parameters; and applying the estimated values of the remaining parameters and estimating values of the one or two parameters, wherein the estimating values of the remaining parameters and the estimating values of the one or two parameters are performed multiple times.
- each of the first data set and the second data set is a raw data set obtained from a detection device that detects the first target analyte and the second target analyte in the sample; a mathematically transformed data set of the raw data set; a normalized data set of the raw data set; or a normalized data set of the mathematically transformed data set.
- each of the approximate function 1-1, the approximate function 1-2, and the approximate function 2 include at least one selected from the group consisting of a sigmoid function, a logistic function, a Gompertz function, and a Chapman function.
- each of the approximate function parameter 1-1 and the approximate function parameter 1-2 includes at least one of: a parameter indicating a first slope for the cycle of the signal values dependent on the presence of the first target analyte; a parameter indicating a cycle corresponding to a point at which the first slope is maximum; a parameter indicating signal values in a baseline region; and a parameter indicating signal values in a plateau region
- the approximate function 2 has an approximate function parameter 2; the approximate function parameter 2 includes at least one of: a parameter indicating a second slope for the cycle of signal values dependent on the presence of the second target analyte; a parameter indicating a cycle corresponding to a point at which the second slope is maximum; a parameter indicating signal values in a baseline region; and a parameter indicating signal values in a plateau region.
- each of the approximate function 1-1, the approximate function 1-2, and the approximate function 2 further includes a parameter of a background signal approximate function for a background signal
- the parameter of the background signal approximate function in each of the approximate function 1-1 and the approximate function 1-2 includes at least one of: a parameter that approximates a slope of the cycle of a first background signal further included in the first data set; a parameter that approximates signal values in a baseline region; and a parameter that approximates a cycle corresponding to a point at which a magnitude of the first background signal is minimum
- the parameter of the background signal approximate function of the approximate function 2 includes at least one of: a parameter that approximates a slope of the cycle of a second background signal further included in the second data set; a parameter that approximates signal values in a baseline region; and a parameter that approximates a cycle corresponding to a point at which a magnitude of the second background signal is minimum.
- the parameter of the background signal approximate function is a parameter of a constant or a polynomial function.
- the signal generation reaction involves a nucleic acid amplification.
- the performing the j oint-estimation includes j oint-estimating the value of the magnitude parameter for each of two or more cycle sections selected from the plurality of cycles.
- the performing the j oint-estimation includes j oint-estimating the value of the magnitude parameter for each of the plurality of cycles.
- the performing the joint-estimation includes: estimating a value of an approximate function parameter 1-1 of the approximate function 1-1 by using the first data set; and performing the joint-estimation on a value of an approximate function parameter 2 of the second approximate function 2 and a value of the magnitude parameter, by using the first data set and the second data set.
- the performing the joint-estimation on the value of the approximate function parameter 2 and the value of the magnitude parameter includes: calculating a difference between (a) the second data set; and (b) the first data set and the magnitude parameter; at each of the plurality of cycles, and performing the joint-estimation on the value of the approximate function parameter 2 and the value of the magnitude parameter in such a manner that a sum of the differences at each of the plurality of cycles is minimized.
- a computer program stored in a computer-readable recording medium, programmed to perform each step included in the method.
- a non-transitory computer-readable recording medium storing a computer program programmed to perform each step included in the method.
- a computer device includes: a memory configured to store at least one instruction; and a processor configured to execute the one or more instructions stored in the memory, wherein the instructions, when executed by the processor, cause the processor to: obtaining, from a signal generation reaction of a plurality of cycles for a first target analyte and a second target analyte in a sample, a first data set measured at a first detection temperature at the plurality of cycles and a second data set measured at a second detection temperature at the plurality of cycles; wherein the first data set includes signal values at the first detection temperature dependent on the presence of the first target analyte in the sample, and the second data set includes signal values at the second detection temperature dependent on the presence of the first target analyte and the second target analyte in the sample; and wherein the signal generation reaction is performed by incubating the sample with a first signal generation composition for detecting the first target analyte in the sample and
- a method for obtaining an approximate signal for each of a plurality of target analytes performed by a computer device includes: obtaining, from a signal generation reaction of a plurality of cycles for a first target analyte and a second target analyte in a sample, a first data set measured at a first detection temperature at the plurality of cycles and a second data set measured at a second detection temperature at the plurality of cycles; wherein the first data set includes signal values at the first detection temperature dependent on the presence of the first target analyte in the sample, and the second data set includes signal values at the second detection temperature dependent on the presence of the first target analyte and the second target analyte in the sample; and wherein the signal generation reaction is performed by incubating the sample with a first signal generation composition for detecting the first target analyte in the sample and a second signal generation composition for detecting the second target analyte in the sample; where
- a method for obtaining an approximate signal for each of a plurality of target analytes performed by a computer device includes: obtaining, from a signal generation reaction of a plurality of cycles for a first target analyte, a second target analyte and a third target analyte in a sample, a first data set measured at a first detection temperature at each of the plurality of cycles, a second data set measured at a second detection temperature at each of the plurality of cycles and a third data set measured at a third detection temperature at each of the plurality of cycles; wherein the first data set includes signal values at the first detection temperature dependent on the presence of the first target analyte in the sample, the second data set includes signal values at the second detection temperature dependent on the presence of the first target analyte and the second target analyte in the sample, and the third data set includes signal values at the third detection temperature dependent on the presence of the first target analyt
- the plurality of magnitude parameters include at least one selected from the group consisting: a first magnitude parameter indicates a relationship between signal values dependent on the presence of the first target analyte at the first detection temperature and signal values dependent on the presence of the first target analyte at the second detection temperature; a second magnitude parameter indicates a relationship between signal values dependent on the presence of the first target analyte at the second detection temperature and signal values dependent on the presence of the first target analyte at the third detection temperature; a third magnitude parameter indicates a relationship between signal values dependent on the presence of the second target analyte at the second detection temperature and signal values dependent on the presence of the second target analyte at the third detection temperature; and a fourth magnitude parameter indicates a relationship between signal values dependent on the presence of the first target analyte at the first detection temperature and signal values dependent on the presence of the first target analyte at the third detection temperature.
- an optimized value may be estimated for each reaction unit for the corresponding signal generation reaction.
- the relationship between signals at two detection temperatures generated in the presence of a specific target analyte may be expressed as a term called the reference value.
- a method of experimentally or statistically measuring such the reference value according to a predetermined procedure before analyzing a signal generation reaction for an arbitrary sample, and applying this previously obtained reference value to the process of extracting the signal value for each target analyte in the process of analyzing the signal generation reaction for the arbitrary sample has been used.
- the related art has a limitation in that a difference generated according to various detection environments such as a reaction well, a detection device, and the like for each reaction may not be reflected, and accordingly, there is a problem in that signal distortion occurs as the reference value is over or under applied, and as a result, detection accuracy of each target analyte decreases.
- the value of the magnitude parameter optimized for the corresponding reaction is estimated for each reaction in which the signal generation reaction for the sample is performed, and applied to the extraction of the signal value. Accordingly, the signal value of each target analyte may be more accurately extracted, and as a result, the detection accuracy of each target analyte may be improved.
- a value of a parameter of an approximate function that approximates signal values generated under the presence of each target analyte from the data sets may be estimated together with the magnitude parameter.
- These parameters have a correlation that affects each other for the overall error.
- the magnitude parameter and the parameters of each approximate function one parameter depends on the other parameter, and vice versa. Accordingly, rather than estimating a value in consideration of only one parameter, the optimized values of the parameters are joint-estimated in consideration of the correlation between the parameters together, thereby minimizing the overall error.
- the value of the magnitude parameter may be estimated for each of a plurality of cycles. Accordingly, a more optimized value for the magnitude parameter may be applied for each cycle for each reaction, and the detection accuracy of each target analyte may be further improved than a case to which a single value is applied.
- a value of a parameter of a background signal approximate function that approximates signal values that is independent of the presence of the target analyte may be joint-estimated together.
- a parameter value of an approximate function approximating a background signal which has been difficult to analyze in the related art, may be estimated together with the above-described parameters, from a raw data set having no artificial signal distortion caused by a signal analysis process.
- by adding functions for various background elements to a model for joint-estimation through subdivided modeling of the background signal there is an advantage in that it is easy to expand and manage parameters that are subject to the joint-estimation.
- target analyte may refer a variety of substances (e.g., biological and non-biological substances).
- the target analyte may include a biological substance, more specifically at least one of nucleic acid molecules (e.g., DNA and RNA), proteins, peptides, carbohydrates, lipids, amino acids, biological compounds, hormones, antibodies, antigens, metabolites, and cells.
- sample may refer to a biological sample (e.g., cells, tissues, and body fluids) and a non-biological sample (e.g., food, water, and soil).
- the biological sample may include at least one of, for example, virus, bacteria, tissue, cells, blood (including whole blood, plasma, and serum), lymph, bone marrow, saliva, sputum, swab, aspiration, milk, urine, stool, eye fluid, semen, brain extract, spinal fluid, joint fluid, thymus fluid, bronchial lavage fluid, ascites, and amniotic fluid.
- a sample may or may not contain the above-described target analyte.
- a nucleic acid extraction process as known in the art may be performed on the sample estimated to contain the target analyte.
- the nucleic acid extraction process may vary depending on the type of sample.
- a reverse transcription process may be additionally performed to synthesize cDNA (See Sambrook, J. et al., Molecular Cloning. A Laboratory Manual, 3rd ed. Cold Spring Harbor Press(2001 ).
- data set refers to the data obtained from a signal generation reaction on the target analyte using a signal generation composition (the signal generation composition is described below).
- the term "signal generation reaction” refers to a reaction that generates a signal depending on the properties of the target analyte in the sample, such as activity, amount or presence/absence (or absence), specifically presence/absence (or absence).
- the signal generation reactions include biological reactions and chemical reactions.
- the biological reactions include genetic analysis processes, such as PCR, real-time PCR and microarray analysis, immunological analysis processes, and bacterial growth analysis.
- the chemical reactions include the process of analyzing the generation, change or destruction of chemicals.
- the signal generation reaction may be the genetic analysis process, or may be a nucleic acid amplification reaction such as the PCR or isothermal amplification reaction, an enzymatic reaction, or microbial growth.
- amplification reaction amplification of a target analyte (e.g., a nucleic acid molecule) may or may not be accompanied.
- the amplification reaction may mean an amplification reaction of a signal accompanied by amplification of a target analyte.
- the above-described signal generation reactions are accompanied by signal changes. Therefore, the progress of the signal generation reaction may be evaluated by measuring the change in signal.
- the signal generation reaction may denote a reaction in which a signal appears or a reaction in which a signal disappears.
- the signal change may include an increase in signal or a decrease in signal.
- the term "signal" means a measurable output. Further, the measured magnitude or change in the signal serves as an indicator qualitatively or quantitatively indicating the properties of the target analyte, specifically, the presence/absence or absence of the target analyte in the sample.
- the indicator examples include fluorescence intensity, luminescence intensity, chemiluminescence intensity, bioluminescence intensity, phosphorescence intensity, charge transfer, voltage, current, power, energy, temperature, viscosity, light scatter, radioactivity intensity, reflectance, transmittance and absorbance, but are not limited thereto.
- signal generation composition means a means for providing a signal indicative of the properties of the target analyte to be analyzed, specifically the presence/absence or absence of the target analyte.
- the signal generation composition includes a label itself or a label-attached oligonucleotide.
- the label includes a fluorescent label, a luminescent label, a chemiluminescent label, an electrochemical label, and a metal label.
- the label may be used as a label itself, such as an intercalating dye.
- the label may be used as a single label or interactive dual label including a donor molecule and an acceptor molecule, in the form attached to one or more oligonucleotides.
- the signal generation composition may include an enzyme with nucleolytic activity to generate signals (e.g., an enzyme with 5' nucleolytic activity or an enzyme with 3' nucleolytic activity).
- an enzyme with nucleolytic activity e.g., an enzyme with 5' nucleolytic activity or an enzyme with 3' nucleolytic activity.
- various methods are known for generating a signal indicating the presence/absence of a target analyte, particularly a target nucleic acid molecule, by the signal generation composition.
- Representative examples may include: TaqManTM probe method ( U.S. Patent No. 5,210,015 ), molecule beacon method ( Tyagi, Nature Biotechnology v.14 MARCH 1996 ), Scorpion method ( Whitcombe et al., Nature Biotechnology 17:804-807(1999 )), Sunrise or Amplifluor method ( Nazarenko et al., Nucleic Acids Research, 25(12):2516-2521(1997 ), and U.S. Patent No. 6,117,635 ), Lux method ( U.S. Patent No.
- signal generation reaction may include a signal amplification reaction.
- amplification reaction means a reaction that increases or decreases the signal generated by the signal generation composition.
- the amplification reaction refers to a reaction for increasing (or amplifying) the signal generated by the signal generation composition depending on the presence/absence of the target analyte.
- the amplification reaction may or may not be accompanied by amplification of the target analyte (e.g., nucleic acid molecule). More specifically, the amplification reaction may refer to a signal amplification reaction accompanied by amplification of the target analyte.
- the target analyte e.g., nucleic acid molecule
- the data set obtained through the amplification reaction may include an amplification cycle.
- cycle refers to a unit of change in a predetermined condition in a plurality of measurements accompanied by the change in the condition.
- the change in the predetermined condition means an increase or decrease in temperature, reaction time, number of reactions, concentration, pH, or number of copies of the measurement target (e.g., nucleic acid).
- the cycle may be a time or process cycle, unit operation cycle, or reproductive cycle.
- cycle means one unit of repetition when a reaction of a predetermined process is repeated or a reaction is repeated based on a predetermined time interval.
- one cycle means a reaction including denaturation of nucleic acids, annealing of primers, and extension of primers.
- the change in the predetermined condition is an increase in the number of repetitions of the reaction, and a repeating unit of the reaction including the above series of steps is set as one cycle.
- the amplification reaction for amplifying the signal indicating the presence/absence of the target analyte may be performed in a manner in which the signal is also amplified while the target is amplified (e.g., real-time PCR method).
- the amplification reaction may be performed in a manner in which only a signal indicating the presence/absence of the target is amplified without amplifying the target analyte (e.g., CPT method ( Duck P, et al., Biotechniques, 9:142-148(1990 )), Invader assay ( U.S.Patent Nos. 6,358,691 and 6,194,149 )).
- target analyte particularly target nucleic acid molecules
- PCR polymerase chain reaction
- LCR ligase chain reaction
- SDA strand displacement amplification
- Walker et al. Nucleic Acids Res. 20(7):1691-6 (1992 ); Walker PCR Methods Appl 3(1):1-6 (1993 )
- transcription-mediated amplification Phyffer, et al., J. Clin. Microbiol.
- the amplification reaction amplifies the signal while accompanying the amplification of the target (specifically, the target nucleic acid molecule).
- the amplification reaction is carried out by PCR, specifically real-time PCR, or isothermal amplification reaction (e.g., LAMP or RPA).
- a data set obtained by the signal generation reaction includes a plurality of data points including cycles of the signal generation reaction and signal values at the cycles.
- signal value refers to a value(s) obtained by quantifying the signal level (e.g., signal intensity) actually measured in a cycle(s) of a signal generation reaction(s), in particular, an amplification reaction, according to a predetermined scale, or a modified value thereof.
- the modified value may mean a mathematically processed signal value of the actually measured signal value. Examples of mathematically processed signal values of actually measured signal values (i.e., signal values of raw data sets) may denote logarithmic values or derivatives.
- data point means a coordinate value that includes signal values and cycles.
- data refers to all information that constitutes a data set. For example, each cycle and signal value of the amplification reaction may be data.
- Data points obtained from the signal generation reaction, specifically the amplification reaction may be represented by coordinate values on a Cartesian coordinate system.
- the X axis represents the cycles of the amplification reaction and the Y axis represents the signal value measured in each cycle or the processed value of the signal value.
- data set refers to a collection of the data points.
- the data set may be a collection of data points obtained directly through an amplification reaction performed under the presence of the signal generation composition or may be a modified data set of such data sets.
- the data set may be some or all of a plurality of data points obtained by an amplification reaction or modified data points thereof.
- the data set may include a data set obtained by processing a plurality of data sets.
- data sets for the plurality of target analytes may be obtained through processing of data sets obtained from reactions performed in the one reaction well.
- a data set for a plurality of target analytes made in one reaction well may be obtained by processing a plurality of data sets obtained from signals measured at different temperatures.
- a method of detecting signals generated at different detection temperatures using a single type of detector in order to detect two target nucleic acid sequences in a sample is known (see Korean Patent No. 10-2050601 ).
- the data set may be obtained from a signal generation reaction of a plurality of cycles for at least two target analytes in a sample.
- the at least two target analytes may include two target analytes different from each other, such as a first target analyte and a second target analyte, or may include three or more target analytes different from each other according to an embodiment.
- the data sets may be measured at least two temperatures.
- the at least two temperatures may include two different temperatures such as a first temperature and a second temperature, or may include three or more different temperatures according to an embodiment.
- a first data set refers to a data set obtained from a first signal generation reaction of a plurality of cycles by a first signal generation composition for detecting a first target analyte in a sample, specifically, a data set measured at a first temperature at each of the plurality of cycles.
- a second data set refers to a data set obtained from a second signal generation reaction of the plurality of cycles by a second signal generation composition for detecting a second target analyte in the sample, specifically, a data set measured at a second temperature at each of the plurality of cycles.
- the above-described data sets may further include a m-th data set refers to a data set obtained from a m-th signal generation reaction of the plurality of cycles by a m-th signal generation composition for detecting a m-th target analyte in the sample, specifically, a data set measured at a m-th temperature at each of the plurality of cycles.
- the m-th temperature indicates the detection temperature of the m-th target analyte.
- the above-described data sets may further include one or more additional data sets measured at different temperatures for different target analytes.
- the signal generation reaction may be performed by incubating the sample with the first signal generation composition for detecting the first target analyte and the second signal generation composition for detecting the second target analyte in one reaction well.
- the first temperature is a detection temperature of the first target analyte
- the second temperature is a detection temperature of the second target analyte.
- signal values dependent on the first target analyte may be generated at each of the first temperature and the second temperature by the first signal generation reaction.
- signal values dependent on the second target analyte may be generated at the second temperature by the second signal generation reaction.
- the first data set may include signal values at the first temperature dependent on the first target analyte
- the second data set may include signal values at the second temperature dependent on the first target analyte and signal values at the second temperature dependent on the second target analyte.
- this "temperature” and “detection temperature” may be used interchangeably.
- the signal generation reaction may be performed by incubating the sample with the first to m-th signal generation compositions.
- m 3
- signal values dependent on the first target analyte may be generated at each of the first temperature, the second temperature, and a third temperature by the first signal generation reaction.
- signal values dependent on the second target analyte may be generated at the second temperature and the third temperature by the second signal generation reaction.
- signal values dependent on the third target analyte may be generated at a third temperature by a third signal generation reaction.
- the first data set may include signal values at the first temperature dependent on the first target analyte
- the second data set may include signal values at the second temperature dependent on the first target analyte and signal values at the second temperature dependent on the second target analyte
- the third data set may include signal values at the third temperature dependent on the first target analyte, signal values at the third temperature dependent on the second target analyte, and signal values at the third temperature dependent on the third target analyte.
- the first signal generation composition and the second signal generation composition include the same label, and signals from the label may not be differentiated for each target analyte by a single type of detector.
- the m-th signal generation composition may also include the same label as the first signal generation composition and the second signal generation composition.
- not being differentiated for each target analyte by the single type of detector means that signals are indistinguishable from each other by the single type of detector due to their same or substantially the same signal characteristics (e.g., optical characteristics, emission wavelengths, and electrical signals).
- the same label e.g., FAM
- a single type of detector is used to detect the emission wavelength from the FAM
- the first temperature and the second temperature are temperatures at which the signal generation composition emits a signal.
- the signal generated at the first temperature may include a fluorescence signal (e.g., relative fluorescence unit (RFU)) generated depending on the presence or absence of the first target analyte in the sample.
- the signal generated at the second temperature may include a fluorescence signal generated depending on the presence or absence of the first target analyte in the sample and a fluorescence signal generated depending on the presence or absence of the second target analyte in the sample.
- the first temperature and the second temperature may be selected from a temperature in a range of 75°C to 40°C.
- each of the first temperature and the second temperature may be any one of 72°C, 65°C, 60°C, 55°C, and 50°C, and the first temperature and the second temperature may be different from each other.
- the first temperature may be greater than the second temperature.
- the first temperature may be 72°C
- the second temperature may be 60°C.
- the second temperature may be greater than the first temperature.
- the second temperature may be 72°C
- the first temperature may be 60°C.
- the third temperature different from the first temperature and the second temperature described above may also be assumed.
- the first temperature, the second temperature, and the third temperature may be selected at a temperature in the range of 90°C to 40°C.
- each may be any one of 85°C, 83°C, 75°C, 72°C, 65°C, 60°C, 55°C, and 50°C, and the first to third temperatures may be different temperatures.
- the first temperature may be greater than the second temperature, and the second temperature may be greater than the third temperature.
- the first temperature may be about 83°C
- the second temperature may be about 72°C
- the third temperature may be about 60°C.
- the first temperature may be less than the second temperature
- the second temperature may be less than the third temperature.
- the third temperature may be 83°C
- the second temperature may be 72°C
- the first temperature may be 60°C.
- one or more m-th temperatures described above may be considered, and may be selected as a temperature different from the first temperature and the second temperature, respectively, within a temperature range of, for example, 90°C to 40°C.
- the data set may be a raw data set obtained from the detection device, a mathematically transformed data set of the raw data set, and normalized data of the raw data set, or a standardized data set of the mathematically transformed data set.
- the raw data set refers to a data set including signal values obtained directly from a signal generating reaction.
- the raw data set includes a set of signals obtained from the data provision device 100 (e.g., a detecting device), subjected to basic signal processing on the data provision device 100, and then passed to the signal analysis step.
- the mathematically processed data set refers to a data set transformed through mathematical processing from the raw data set.
- the mathematically processed data set is a baseline subtracted data set obtained by removing at least some background signal from the raw data set.
- Baseline subtracted data sets can be obtained by various methods known in the art (e.g., US Pat. No. 8,560,247 ).
- normalization refers to a process of reducing or eliminating signal deviations between data sets for a plurality of responses.
- standardization is an aspect of correction or adjustment that corrects or modifies data (especially signal values) of a data set for analysis purposes.
- the data set for the target analyte includes not greater than 200, not greater than150, not greater than100, not greater than 80, not greater than 60, not greater than 50, not greater than 45, not greater than 40, and not greater than 30 data points.
- the data set for the target analyte includes not less than 2, not less than 5, not less than 10, not less than 15 and not less than 20 data points.
- magnitude parameter describes a magnitude relationship of signal values at different detection temperatures when two or more signal values are measured at two or more different detection temperatures.
- the different detection temperatures may be the first temperature and the second temperature
- the magnitude parameter means a parameter that represents a relationship between (a) the magnitude of signal values dependent on the presence of a specific target analyte at the first temperature and (b) the magnitude of signal values dependent on the presence of the specific target analyte at the second temperature.
- the magnitude parameter is one or more values for reflecting a pattern (rule) of signal value change dependent on a specific target analyte in the first temperature and the second temperature, and may refer to a parameter used for converting, transferring, adjusting, or modifying signal values detected at the first temperature to signal values at the second temperature.
- the magnitude parameter may have one value.
- the magnitude parameter may be expressed in the form of a constant indicating the magnitude relationship of signal values dependent on the specific target analyte (e.g., the first target analyte) at the first temperature and the second temperature.
- the magnitude parameter may have two or more values.
- the magnitude parameter may be expressed in the form of a set of two or more constant values representing a magnitude relationship of signal values dependent on the specific target analyte (e.g., the first target analyte) at the first temperature and the second temperature in one or more of the plurality of cycles.
- a magnitude approximate function indicating the magnitude relationship of signal values dependent on the specific target analyte (e.g., the first target analyte) at the first temperature and the second temperature is defined in the form of a polynomial function (e.g., a first-order function, a second-order function) having the cycle as an independent variable, and the magnitude parameter may be one or more parameters (e.g., coefficients of the first-order function) of the magnitude approximate function.
- the magnitude parameter may define not only a magnitude relationship between the first temperature and the second temperature but also a magnitude relationship between the first temperature and the third temperature and a magnitude relationship between the second temperature and the third temperature for each target analyte.
- the magnitude parameter for the first temperature and the second temperature are mainly described, and these embodiments may be equally applied to a case to which the m-th temperature is applied, such as the magnitude parameter for the first temperature and the third temperature and the magnitude parameter for the second temperature and the third temperature. Examples of this magnitude parameter will be described later.
- the above-described data set may be plotted, by which an amplification curve may be obtained.
- the term "difference” may mean a difference in magnitude between two elements to be compared, or may mean an error corresponding to the difference in magnitude.
- the difference between A and B may mean (A-B), (B-A), (A/B), (B/A),
- loss function e.g., mean squared error, root mean squared error, etc.
- FIG. 1 is a block diagram illustrating a target analyte detection system 1000 according to an embodiment.
- the target analyte detection system 1000 may include at least one of a data provision device 100 and a computer device 200.
- the target analyte detection system 1000 is not limited to that shown in FIG. 1 .
- the target analyte detection system 1000 may include at least two data provision devices 100 or at least two computer devices 200.
- the data provision device 100 may obtain a data set from a signal generation reaction of the plurality of cycles for the first target analyte and the second target analyte in a sample, and directly or indirectly provide the obtained data set to the computer device 200.
- the data set may include the first data set measured at the first temperature and the second data set measured at the second temperature by the signal generation reaction.
- the third data set measured at the third temperature may be included in the data set.
- the data provision device 100 may include a detection device (e.g., a nucleic acid amplification device) implemented to detect the first target analyte and the second target analyte in the sample.
- a detection device e.g., a nucleic acid amplification device
- the data provision device 100 may directly obtain the data set by controlling the environment (temperature, etc.) of the reaction well in which the sample is accommodated so that the signal generation reaction is performed, and may directly or indirectly provide the obtained data set to the computer device 200.
- the data provision device 100 may include the detection device and a computer implemented to execute a program that processes and provides a detection result (e.g., a nucleic acid amplification result) generated by the detection device.
- the computer device 200 may be implemented to obtain an approximate signal for each of a plurality of target analytes.
- the process of obtaining the approximate signal for each of the plurality of target analytes may include not only a process of separating or extracting signal values dependent on each of two or more target analytes in the sample from the data set, but also a process of approximating the separated or extracted signal value.
- the separation or extraction process and the approximation process will be described in detail later through an embodiment.
- a predetermined parameter is used in the process of separating or extracting the signal value, and the above-described computer device 200 may estimate or set a value of the parameter as an optimal value for each reaction well in which the sample is accommodated.
- a process of estimating or setting the value of the parameter will be described in detail later through an embodiment.
- the computer device 200 may obtain the data set from the data provision device 100.
- the computer device 200 may be electrically connected to the data provision device 100 or through a network, and may obtain the data set from the data provision device 100.
- the network may be configured through various communication networks such as wired and wireless networks, and for example, may be configured as various communication networks such as a Local Area Network (LAN), a Metropolitan Area Network (MAN), and a Wide Area Network (WAN).
- LAN Local Area Network
- MAN Metropolitan Area Network
- WAN Wide Area Network
- the computer device 200 may be implemented as a computer operating through a computer program designed to realize the functions described in the present specification.
- the computer device 200 may be implemented to include the data provision device 100, or the following functions performed by the computer device 200 may be implemented to be included in the data provision device 100.
- the following functions may be mounted on the nucleic acid amplification device, and may be implemented as software in a computer in which a program for providing a nucleic acid amplification result generated by the nucleic acid amplification device is executed.
- the target analyte detection system 1000 may further include other components in addition to the components shown in FIG. 1 .
- one of the components illustrated in FIG. 1 may be omitted.
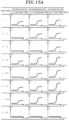
- the first data set and the second data set are exemplarily illustrated.
- the first temperature and the second temperature are 72°C and 60°C., respectively.
- the first target analyte and the second target analyte are genome DNA of Chlamydia trachomatis (CT) and Neisseria gonorrhoeae (NG), respectively. It should be clear that these kinds of temperature and target analytes are merely examples.
- the first data set measured at the first temperature may include signal values dependent on the presence of the first target analyte among the first target analyte (e.g., CT) and the second target analyte (e.g., NG).
- the second data set measured at the second temperature e.g., 60°C.
- tube 1 in which only CT is present among CT and NG an amplification curve dependent on the presence of CT appears in each of the first data set and the second data set, but there is a difference in the magnitude of the amplification curve in each data set due to the temperature difference.
- tube 2 in which only NG is present an amplification curve dependent on the presence of NG appears only in the second data set.
- tube 3 in which CT and NG with similar high concentrations are present together an amplification curve dependent on the presence of CT is shown in the first data set.
- an amplification curve dependent on the presence of CT and an amplification curve dependent on the presence of NG are combined in the second data set, but the shapes of the amplification curves are similar due to similar concentrations and thus appear as one amplification curve.
- an amplification curve dependent on the presence of CT is shown in the first data set.
- an amplification curve dependent on the presence of CT and an amplification curve dependent on the presence of NG are combined in the second data set, and appear as a bumpy curve having different shapes of the amplification curves due to different concentrations.
- an amplification curve dependent on the presence of CT and an amplification curve dependent on the presence of NG are not shown in both the first data set and the second data set.
- FIG. 2B exemplarily illustrates signal values dependent on the presence of the first target analyte at the first temperature and signal values dependent on the presence of the second target analyte at the second temperature, which are estimated from the first data set and the second data set shown in FIG. 2A .
- each of the signal value dependent on the presence of the first target analyte (e.g., CT) at the first temperature (e.g., 72°C) and the signal value dependent on the presence of the second target analyte (e.g., NG) at the second temperature (e.g., 60°C.) may be extracted from the first data set and the second data set.
- the amplification curve dependent on the presence of corresponding target analyte at the detection temperature of the corresponding target analyte may be extracted as shown in tubes 1 and 2.
- the amplification curve dependent on the presence of each target analyte at the detection temperature of each target analyte may be extracted as shown in tubes 3 and 4, but a number of cycles in which the slope of the amplification curve is maximum may be different according to the concentration difference. For example, in the case of a target analyte with a relatively low concentration, the number of cycles in which the slope of the amplification curve is maximum may be relatively pushed back compared to a target analyte at a relatively high concentration.
- FIG. 3 schematically shows a block diagram of the computer device 200 according to an embodiment.
- the computer device 200 may include an acquisition unit 210, a memory 220, a display 230, and a processor 240.
- the acquisition unit 210 is implemented to obtain the first data set and the second data set from a signal generation reaction of the plurality of cycles for the first target analyte and the second target analyte in a sample.
- the acquisition unit 210 may obtain the first data set and the second data set from the data provision device 100.
- the signal generation reaction may be performed in the computer device 200, although not shown in the drawings, the acquisition unit 210 may obtain the first data set and the second data set from this performed result.
- the acquisition unit 210 may include a transceiver (not shown). In this case, the acquisition unit 210 may receive the first data set and the second data set from the data provision device 100 by using the transceiver. In another embodiment, the acquisition unit 210 may include a data input port (not shown). In this case, the acquisition unit 210 may read the first data set and the second data set generated by the data provision device 100 and stored in the corresponding device, from a storage device (e.g., a universal serial bus (USB)) electrically connected to the computer device 200 by using the data input port.
- a storage device e.g., a universal serial bus (USB)
- the memory 220 may store at least one instruction or data to be executed by the processor 240, which will be described later.
- the memory 220 may include at least one of a read only memory (ROM) and a random access memory (RAM).
- the display 230 may display an image, a graph, a table, a text, or the like obtained as at least one instruction is executed by the processor 240.
- the display 230 may display the detection result for the target analyte as text or the like, which is detected using the values of the parameters estimated by the processor 240 or the estimation result
- the display 230 may comprehensively mean a data output device for displaying data.
- the display 230 may be implemented as a liquid crystal display, a thin film transistor-liquid crystal display, an organic light-emitting diode, a flexible display, a three-dimensional (3D) display, or the like.
- the processor 240 may control the overall operation of the computer device 200, and perform a series of operations for estimating a value(s) of a parameter(s) used to obtain an approximate signal(s) for a target analyte(s).
- the processor 240 may refer to a central processing unit (CPU), a graphics processing unit (GPU), a micro controller unit (MCU), or a dedicated processor on which methods according to embodiments are performed.
- the processor 240 may be implemented to include at least one core.
- the computer device 200 may further include a bus line used for transmission of data between the components, various input/output devices, and an interface therefor.
- the components illustrated in FIG. 3 may be omitted.
- the processor 240 may provide various functions described below by executing at least one instruction stored in the memory 220.
- various functions described below may be implemented as one or more computer programs, and instructions and data for execution of each computer program may be stored in the memory 220 and executed by the processor 240, but are not limited thereto.
- the processor 240 may be implemented to estimate a value(s) of the approximate function parameter and a value(s) of the magnitude parameter by at least partially using the first data set and the second data set.
- the approximate function parameter indicates a parameter included in at least one approximate function from among the approximate function 1 and the approximate function 2.
- the approximate function 1 includes a function that approximates signal values dependent on the presence of the first target analyte in the sample at the first temperature or the second temperature.
- the signal dependent on the presence of the first target analyte may be generated at each of the first temperature and the second temperature by the signal generation reaction of the plurality of cycles for the first target analyte.
- the approximate function 1 may include a function (hereinafter, referred to as an approximate function 1-1) that approximates the signal value amplified depending on the presence of the first target analyte at the first temperature, and in another embodiment, may include a function (hereinafter, referred to as an approximate function 1-2) that approximates the signal value amplified depending on the presence of the first target analyte at the second temperature.
- an approximate function 1-1 is mainly described, but is not limited thereto.
- the approximate function 1 may be interpreted as the approximate function 1-1 and/or the approximate function 1- 2 according to the embodiments.
- the approximate function 1 may include at least one selected from the group consisting of a sigmoid function, a logistic function, a Gompertz function, and a Chapman function.
- each of the approximate function 1-1 and/or the approximate function 1-2 may include a function represented by any one of the following Math Figure 1 to 6 , but is not limited thereto, and may be represented in various other ways.
- a parameter(s) of the approximate function 1 may represent a characteristic of a line represented by signal values of the plurality of cycles, wherein the signal values here are signal values that depend on the presence of the first target analyte.
- the approximate function parameter 1-1 of the approximate function 1-1 may include parameters (e.g., ⁇ 1 to ⁇ 5 of Equations 1 to 6) for a shape, a gradient, a start point, and an end point of a line indicated by signal values of the plurality of cycles, wherein the signal values here are signal values that depend on the presence of the first target analyte at the first detection temperature.
- the approximate function parameter 1-2 of the approximate function 1-2 may include parameters for a shape, a gradient, a start point, and an end point of a line indicated by signal values of the plurality of cycles, wherein the signal values here are signal values that depend on the presence of the first target analyte at the second detection temperature.
- the approximate function parameter may be understood as a concept including a singular or plural number.
- the approximate function parameter 1 may include at least one of: (a) a parameter indicating a first slope for a cycle of the signal value dependent on the presence of the first target analyte; (b) a parameter indicating a cycle corresponding to a point at which the first slope is maximum; (c) a parameter indicating signal values in a baseline region of the signal value dependent on the presence of the first target analyte; and (d) a parameter indicating signal values in a plateau region of the signal value dependent on the presence of the first target analyte.
- each of ⁇ 1 to ⁇ 5 in Math Figure 1 to 6 may be the approximate function parameter 1 , and may be a parameter indicating the above first slope, the cycle corresponding to the point at which the first slope is maximum, the signal value in the baseline region or the signal value in the plateau region, a degree of steep slope of a curve at some points, or the like.
- ⁇ 1 is a parameter indicating the degree of steepness of the slope in the S-shaped curve indicated by the sigmoid function, and may be a parameter indicating the above-described first slope.
- the overall slope of the curve represented by the sigmoid function may increase, and the signal value may rapidly increase for a relatively short cycle to reach the saturation point of the curve, and may represent the above-described first slope.
- ⁇ 2 is a parameter indicating signal values in the baseline region of the signal value dependent on the presence of the corresponding target analyte
- ⁇ 3 is a parameter indicating signal values between the baseline region and the plateau region of the signal value dependent on the presence of the corresponding target analyte
- ⁇ 4 is a parameter indicating a cycle corresponding to a point at which a slope of signal values with respect to cycles in the exponential region is maximum among signal values dependent on the presence of a corresponding target analyte. For example, as ⁇ 4 increases, the saturation point of the curve indicated by the sigmoid function may be delayed backward.
- ⁇ 5 is a parameter indicating the degree to which the S-shaped curve indicated by the sigmoid function is asymmetrical, and may be, for example, a parameter indicating the degree to which a partial slope is steep in an initial local section where the increase in slope within the exponential region is remarkable (e.g., the cycle section from the cycle where the slope increases by more than the set value until the signal value reaches the inflection point).
- the curve represented by the sigmoid function may not be a symmetrical S-shaped curve, but may be an asymmetrical S-shaped curve in which the initial gradient increases relatively steeply compared to the subsequent gradient.
- the above-described parameters are exemplary, and may be implemented in various modified forms according to the type of an approximate function or a concrete form of a mathematical formula.
- the approximate function 1 may include a target signal approximate function 1 that approximates signal values dependent on the presence of the first target analyte in the sample, and a background signal approximate function 1 that approximates a background signal (hereinafter, referred to as a first background signal) independent of the presence of the first target analyte in the first data set.
- a background signal that approximates a background signal (hereinafter, referred to as a first background signal) independent of the presence of the first target analyte in the first data set.
- the "background signal” will be described later.
- the approximate function 1-1 may include a target signal approximate function 1-1 (e.g., f 11 ( ⁇ 11 ,t)) that approximates the signal values dependent on the presence of the first target analyte in the sample at the first temperature, and a background signal approximate function 1-1 (e.g., g 11 ( ⁇ 11 ,t)) that approximates the first background signal at the first temperature.
- a target signal approximate function 1-1 e.g., f 11 ( ⁇ 11 ,t)
- a background signal approximate function 1-1 e.g 11 ( ⁇ 11 ,t)
- the approximate function 1-2 may include a target signal approximate function 1-2 (e.g., f 12 ( ⁇ 12 ,t)) that approximates the signal values dependent on the presence of the first target analyte in the sample at the second temperature, and a background signal approximate function 1-2 (e.g., g 12 ( ⁇ 12 ,t)) that approximates the first background signal at the second temperature.
- ⁇ 11 refers to parameters of the target signal approximate function 1-1
- ⁇ 12 refers to parameters of the target signal approximate function 1-2.
- the target signal approximate function 1-1 and/or the target signal approximate function 1-2 may include the embodiments of the approximate function 1 described above, and the parameters of the corresponding target signal approximate function may include the embodiments of the approximate function parameter 1 described above (e.g., ⁇ 1 ⁇ 5 in the above Math Figures).
- the background signal approximate function 1 may be a constant or a polynomial function.
- each of the background signal approximate function 1-1 and/or the background signal approximate function 1-2 may be expressed by Math Figure 7 below as the constant, or may be expressed by any one of Math Figure 8 to 10 below as the polynomial function of the second order or less, but is not limited thereto, and may be modified and expressed in various other forms.
- the approximate function parameter of the background signal approximate function 1 may indicate a characteristic of a line indicated by the first background signal.
- the approximate function parameter of the background signal approximate function 1 may include at least one of: (a) a parameter that approximates a slope of the cycle of the first background signal further included in the first data set; (b) a parameter that approximates signal values in the baseline region of the first background signal; and (c) a parameter that approximates the cycle corresponding to a point at which the magnitude of the first background signal is minimum.
- the approximate function parameter of the background signal approximate function 1 may include parameters (e.g., ⁇ 0 to ⁇ 2 ) for a shape, a slope, a start point, and a minimum point of a line indicated by the first background signal.
- the approximate function 2 represents a function that approximates signal values dependent on the presence of the second target analyte in the sample.
- the signal dependent on the presence of the second target analyte may be generated at the second temperature from among the first temperature and the second temperature by the second signal generation reaction of the plurality of cycles for the second target analyte.
- the approximate function 2 may be a function that approximates the signal value amplified depending on the presence of the second target analyte among the signal values included in the second data set measured at the second temperature, and may be interpreted as an approximate function 2-2 at the second temperature with reference to the embodiment of the approximate function 1-1 or the approximate function 1-2 described above.
- the approximate function 2 may include any one selected from the group consisting of the sigmoid function, the logistic function, the Gompertz function, and the Chapman function. Likewise, the approximate function 2 may include a function represented by any one of Math Figures 1 to 6 , but is not limited thereto.
- a parameter(s) included in the approximate function 2 may represent a characteristic of a line indicated by the signal value dependent on the presence of the second target analyte.
- the approximate function parameter 2 may include at least one of: (a) a parameter indicating a second slope for a cycle of the signal value dependent on the presence of the second target analyte; (b) a parameter indicating a cycle corresponding to a point at which the second slope is maximum; (c) a parameter indicating signal values in the baseline region of the signal value dependent on the presence of the second target analyte; and (d) a parameter indicating signal values in the plateau region of the signal value dependent on the presence of the second target analyte.
- the approximate function parameter 2 may include the above-described embodiments with respect to the approximate function parameter 1 .
- the approximate function 2 may include a target signal approximate function 2 that approximates signal values dependent on the presence of the second target analyte in the sample, and a background signal approximate function 2 that approximates a background signal (hereinafter, referred to as a second background signal) independent of the presence of the second target analyte in the second data set.
- the approximate function 2 may include the target signal approximate function 2-2 (e.g., f 22 ( ⁇ 22 ,t)) that approximates signal values dependent on the presence of the second target analyte in the sample at the second temperature, and a background signal approximate function 2-2 (e.g., g 22 ( ⁇ 22 ,t)) that approximates the second background signal at the second temperature.
- ⁇ 22 refers to parameters of the target signal approximate function 2-2
- ⁇ 22 refers to parameters of background signal approximate function 2-2
- the target signal approximate function 2-2 may include the embodiments of the approximate function 2 described above
- the parameters included in the target signal approximate function 2-2 may include the embodiments of the approximate function parameter 2 described above.
- the background signal approximate function 2 may be the constant or the polynomial function.
- the background signal approximate function 2-2 may be expressed by one of Math Figures 7 to 10 .
- the approximate function parameter of the background signal approximate function 2 may indicate a characteristic of a line indicated by the second background signal.
- the approximate function parameter of the background signal approximate function 2 may include at least one of: (a) a parameter that approximates a slope of a cycle of the second background signal further included in the second data set; (b) a parameter that approximates signal values in the baseline region of the second background signal; and (c) a parameter that approximates a cycle corresponding to a point at which a magnitude of the second background signal is minimum.
- the approximate function parameter included in the background signal approximate function 2 may include the above-described embodiments with respect to the approximate function parameter included in the background signal approximate function 1.
- the background signal may be a signal obtained depending on the type of at least one of the detection device (e.g., CFX96) in which the signal generation reaction for the target analyte is performed, the reaction well in which the sample is accommodated (e.g., a well shape, an accommodation method, etc.), and a plate in which the reaction well is placed (e.g., 12x8 arrangement structure).
- the first background signal may be generated by the type of detection device, the shape of the reaction well, etc., that are causes other than the presence of the first target analyte in the first data set.
- the second background signal may be generated by the type of detection device, the shape of the reaction well, etc., that are causes other than the presence of one or more among the first target analyte and the second target analyte in the second data set.
- a m-th background signal including a third background signal may also be interpreted in the same manner.
- the background signal may be subdivided into a plurality of preset background elements (e.g., a baseline element in the detection device, a noise element due to channel interference, an element for correcting a signal pattern difference due to the use of a specific signal generation composition (e.g., a label, an enzyme, etc.), etc.).
- the background signal approximate function for approximating this background signal may be expressed in the form of a linear function of a constant or polynomial function in which all the corresponding background elements are considered, or may be expressed in the form of a nonlinear function obtained by combining (e.g., summing) the constant or polynomial function for each background element.
- the background signal approximate function may be extended in a form in which several background elements are considered in the above manner.
- the magnitude parameter indicates a magnitude relationship between (a) the signal value dependent on the presence of the first target analyte at the first detection temperature and (b) the signal value dependent on the presence of the first target analyte at the second detection temperature.
- the magnitude parameter may be a parameter indicating a ratio of (a) the signal value dependent on the presence of the first target analyte at the second temperature to (b) the signal value dependent on the presence of the first target analyte at the first temperature (or vice versa).
- the magnitude parameter may mean a ratio of b to a (e.g., b/a), a ratio of a to b (e.g., a/b), or a value corresponding thereto.
- the magnitude parameter is a cut-off ratio used in the art, may be a parameter for a constant or a set of constants that approximates the ratio, and may be used to specify a portion of the signal value dependent on the presence or absence of the first target analyte at the second temperature.
- a statistical value of the magnitude parameter was previously obtained from signal values of a plurality of experimental data in which information about which target analyte is present with what quantities in a sample is provided in advance, and the value of the magnitude parameter was previously set based on the statistical value.
- the value of the preset magnitude parameter was uniformly applied to the any sample. Accordingly, it is difficult to reflect a difference generated due to different detection environments in the process of detecting the target analyte, such as a composition in a sample, the type of the reaction well or a the detection device, and thus there is a problem in that detection accuracy is reduced.
- this magnitude parameter may be estimated. Accordingly, an optimized value is obtained for each reaction well in which the sample is accommodated or for each reaction performed on the sample to apply a more accurate magnitude parameter.
- numerous procedures for setting the magnitude parameter conventionally required can be omitted, thereby having a cost-effective advantage.
- the processor 240 may perform a j oint-estimation on (a) a value(s) of at least one of the approximate function parameter 1 and the approximate function parameter 2; and (b) a value(s) of the magnitude parameter, by at least partially using at least one of the first data set and the second data set.
- the joint-estimation means that two or more parameters are jointly estimated at the same time. For example, it indicates a case where one parameter depends on another parameter, and vice versa.
- one or more of various known algorithms such as a residual analysis-based linear regression, a generalized additive model-based non-linear regression, a joint maximum likelihood estimation, and a Bayesian optimization may be used for the j oint-estimation, but are not limited thereto.
- the processor 240 may perform the joint-estimation on a value(s) of the approximate function parameter 1, a value(s) of the approximate function parameter 2, and a value(s) of the magnitude parameter, by at least partially using the first data set and the second data set.
- the processor 240 may calculate the value of the approximate function parameter 1, the value of the approximate function parameter 2, and the value of the magnitude parameter, which enable a total error to be minimized by considering both (a) a difference between the first data set and a first approximate data set calculated using the approximate function 1, and (b) a difference between the second data set and a second approximate data set calculated using all of the approximate function 1, the approximate function 2, and the magnitude parameter, for the plurality of cycles.
- the processor 240 may perform the j oint-estimation on a value(s) of the approximate function parameter 2 and a value(s) of the magnitude parameter, by at least partially using the second data set. For example, the processor 240 may calculate a value of the approximate function parameter 2 and a value of the magnitude parameter, which minimize a difference between the second approximate data set and the second data set for the plurality of cycles.
- the joint-estimation process may be performed in a method of joint-estimating a value(s) of the approximate function parameter and a value(s) of the magnitude parameter, wherein the approximate function here includes at least one selected from the group consisting of the approximate function 1-1, the approximate function 1-2, and the approximate function 2.
- the joint-estimation may be performed on a parameter value(s) of a first parameter group including the approximate function parameter of the approximate function 1-1 and the approximate function 2 and the magnitude parameter.
- the magnitude parameter in the first parameter group may indicate a ratio of a signal magnitude at the second detection temperature to a signal magnitude at the first detection temperature.
- the j oint-estimation may be performed on a parameter value(s) of a second parameter group including the approximate function parameter of the approximate function 1-2 and the approximate function 2, and the magnitude parameter.
- the magnitude parameter in the second parameter group may indicate a ratio of a signal magnitude at the first detection temperature to a signal magnitude at the second detection temperature.
- the processor 240 may prepare a joint-estimation for the above-described parameters based on a pre-stored statistical model.
- preparing the joint-estimation may be understood as a concept encompassing an operation of loading or storing a statistical model in the memory 220 or executing one or more instructions stored in the memory 220 in order to perform a parameter estimation function using the statistical model.
- a mathematical relationship for separating signal values dependent on the presence of the first target analyte from the first data set measured at the first temperature may be defined.
- a mathematical relationship for excluding signal values dependent on the presence of the first target analyte from the second data set measured at the second temperature and separating signal values dependent on the presence of the second target analyte may be defined.
- the statistical model may include Math Figure 11 below defining a relationship between the first data set and the approximate function 1-1 and defining a relationship between the second data set, the approximate function 1-1 , the approximate function 2, and the magnitude parameter. Math Figure 11 may be expressed as Math Figures 12 to 13 .
- t denotes the cycle
- y 1,t denotes the first data set measured at the first temperature at each of the plurality of cycles
- y 2,t denotes the second data set measured at the second temperature at each of the plurality of cycles
- ⁇ 11 denotes the approximate function parameter 1-1
- ⁇ 22 denotes the approximate function parameter 2-2
- CR denotes the magnitude parameter
- f 11 ( ⁇ 11,t ) represents the approximate function 1-1 (specifically, the target signal approximate function 1-1 ) in which the approximate function parameter 1-1 and the cycle are input variables
- f 22 ( ⁇ 22,t ) represents the approximate function 2-2 (specifically, the target signal approximate function 2-2 ) in which the approximate function parameter 2-2 and the cycle are input variables.
- each of e 1 and e 2 represents a first error representing an error component in the first data set and a second error representing an error component in the second data set, respectively.
- the error component means a component that cannot be described based on a predetermined rule or criterion, and for example, may be expressed as a residual component corresponding to a difference between the data set and an approximate data set approximated through the approximate function.
- the first data set may be defined as the sum of the approximate function 1-1 and the first error
- the second data set may be defined as a sum of: (a) a product of the approximate function 1-1 and the magnitude parameter; (b) the approximate function 2; and (c) the second error.
- the first data set may be defined as a sum of: (a) a product of an inverse of the magnitude parameter and the approximate function 1-2 ; and (b) the first error.
- the second data set may be defined as a sum of: (a) the approximate function 1-2 ; (b) the approximate function 2; and (c) the second error, and the following objective functions may be modified in a similar manner.
- the processor 240 may perform the joint-estimation on the above-described parameters based on the statistical model.
- the statistical model may include one or more objective functions for estimation of values of optimized parameters that approximate the data set.
- the processor 240 may obtain a value(s) of a parameter(s) that causes the objective function to be a maximum value or a minimum value and calculate the value as an estimate of the optimized parameter.
- various embodiments in which the joint-estimation is performed on values of parameters by using various objective functions based on likelihood will be described.
- FIG. 5 is a flowchart exemplarily illustrating a method for performing the joint-estimation on the value of the approximate function parameter 2 and the value of the magnitude parameter through the processor 240 by the computer device 200 according to the first embodiment.
- the processor 240 may estimate a value of the approximate function parameter 1-1 of the approximate function 1-1 by using the first data set. For example, the processor 240 may calculate the value of the approximate function parameter 1-1 that best approximates signal values dependent on the first target analyte at the first temperature from the first data set.
- the value of the approximate function parameter 1-1 may be estimated in such a manner that the sum of differences between the approximate function 1-1 and the first data set at each of the plurality of cycles is minimized.
- the difference between the approximate function 1-1 and the first data set may simply mean a magnitude difference, or may mean an absolute value, a square, or a mean squared error, a root mean squared error, or the like corresponding to the magnitude difference.
- the processor 240 may estimate a value(s) of the approximate function 1-1 parameter by using a first objective function for the first data set.
- the first objective function may be determined based on a difference (e.g., the first error) between the first data set and the approximate function 1-1 at each of the plurality of cycles.
- the first objective function may be expressed as Math Figure 14 below, but is not limited thereto, on the assumption that the first error follows a normal distribution of N(0, ⁇ 2 first ).
- the first objective function may be expressed as a sum of a difference between the approximate function 1 and the first data set at each of the plurality of cycles, may be expressed as an average of the sum of the corresponding difference, or may be expressed in various other modified forms.
- the processor 240 may calculate a value(s) of the approximate function parameter 1-1 that causes the first objective function to be a maximum value or a minimum value.
- a differentiation method a difference method, a step difference method, a ratio approach, a linear regression analysis, and a gradient descent method of the signal value may be used.
- an optimized value of the approximate function parameter 1 , ⁇ 11 may be derived through an operation of finding extremum by partial differentiation for the approximate function parameter 1-1 , ⁇ 11 , to be optimized in the first objective function.
- the value of the approximate function parameter 1-1 may be estimated based on maximum likelihood estimation method or maximum likelihood estimate method.
- being based on maximum likelihood estimation or maximum likelihood estimate may be understood as a concept including a log-likelihood estimation (or estimate) and a negative log-likelihood estimation (or estimate) obtained by adding a predetermined mathematical operation (e.g., a log operation, a negative operation, or the like) to the calculation result of the maximum likelihood estimation or the maximum likelihood estimate.
- a predetermined mathematical operation e.g., a log operation, a negative operation, or the like
- the processor 240 may perform the joint-estimation on a value(s) of the approximate function parameter 2 of the approximate function 2 and a value(s) of the magnitude parameter, by at least partially using the result of estimating the approximate function parameter 1-1 and the second data set. For example, when the value of the approximate function parameter 1-1 estimated in step S510 is applied, the processor 240 may calculate the value of the magnitude parameter and the value of the approximate function parameter 2 that best approximate the signal value dependent on the first target analyte at the second temperature and the signal value dependent on the second target analyte at the second temperature in the second data set.
- each of the value of the approximate function parameter 2 and the value of the magnitude parameter may be estimated in such a manner that a difference between (a) the second data set and (b) the sum of the approximate function 2 and the signal value dependent on the first target analyte at the second temperature (or the approximate function 1-2 ) is minimized, at each of the plurality of cycles,.
- the difference may mean a simple magnitude difference, an absolute value, a square or a mean squared error, a root mean squared error, or the like of the corresponding magnitude difference.
- the processor 240 may prepare the signal value (or the value of the approximate function 1-2 ) dependent on the first target analyte at the second temperature by using the value of the magnitude parameter and the value of the approximate function 1-1 having the estimated value of the approximate function parameter 1 .
- the processor 240 may calculate a difference between (a) the second data set; and (b) a sum of the approximate function 2 and the signal value (or the approximate function 1-2 ) dependent on the first target analyte at the second temperature, at each of the plurality of cycles.
- the processor 240 may perform the joint-estimation on the value of the approximate function parameter 2 and the value of the magnitude parameter so that the sum of the differences at the plurality of cycles is minimized.
- the processor 240 may perform the joint-estimation on the value of the approximate function parameter 2 and the value of the magnitude parameter, by using a second objective function for the second data set.
- the second objective function may output a difference (e.g., the second error) between (a) the second data set; and (b) a sum of the approximate function 2 and the signal value (or the approximate function 1-2 ) dependent on the first target analyte at the second temperature, at each of the plurality of cycles.
- the second objective function may be expressed as Math Figure 15 below, but is not limited thereto.
- the sum of the approximate function 2 and the signal value (or the approximate function 1-2 ) dependent on the first target analyte at the second temperature at each of the plurality of cycles may be calculated as the sum of the above-described operation results (e.g., f 22 ( ⁇ 22 , t) + CR*f 11 ( ⁇ 11 , t)).
- the processor 240 may calculate a value(s) of the approximate function parameter 2 and a value(s) of the magnitude parameter that enable the second objective function to be the maximum value or the minimum value. For example, the processor 240 may obtain the signal value (e.g., CR*f 11 ( ⁇ 11 )) dependent on the first target analyte at the second temperature or the value (e.g., f 12 ( ⁇ 12 , t)) of the approximate function 1-2 , by using the magnitude parameter and the value of the approximate function 1-1 having the estimated value of the approximate function parameter 1 .
- the signal value e.g., CR*f 11 ( ⁇ 11 )
- the processor 240 may obtain the signal value (e.g., CR*f 11 ( ⁇ 11 )) dependent on the first target analyte at the second temperature or the value (e.g., f 12 ( ⁇ 12 , t)) of the approximate function 1-2 , by using the magnitude parameter and the value of the approximate function 1-1 having the estimated value of
- the processor 240 may obtain a difference (e.g., y 2,t - CR*f 11 ( ⁇ 11 ) - f 22 ( ⁇ 22 )) between (a) the second data set (e.g., y 2,t ); and (b) a sum of the approximate function 2-2 (e.g., f22( ⁇ 22)) and the signal value (e.g., CR*f 11 ( ⁇ 11 )) dependent on the first target analyte at the second temperature, at each of the plurality of cycles.
- the processor 240 may perform the joint-estimation on the value of the approximate function parameter 2-2 and the value of the magnitude parameter so that the sum of the above differences at the plurality of cycles is minimized.
- the joint estimation instead of by using the result estimated with respect to the approximate function parameter 1-1 and the second data set, the joint estimation may be performed by using the first data set and the second data set.
- the processor 240 may estimate a value(s) of the approximate function parameter 1-1 of the approximate function 1-1 by using the first data set, and may perform the joint-estimation on a value of(s) the approximate function parameter 2 and a value of the magnitude parameter by using the first data set and the second data set.
- the processor 240 may calculate a difference between (a) the second data set; and (b) the first data set and the magnitude parameter;, at each of the plurality of cycles, and may perform the joint-estimation on the value of the approximate function parameter 2 and the value of the magnitude parameter so that the sum of the differences at each of the plurality of cycles is minimized.
- f 11 ( ⁇ 11 , t) described in Math Figure 15 may correspond to a result of estimating the approximate function parameter 1-1 , and the corresponding f 11 ( ⁇ 11 , t) in Math Figure 15 may be replaced with y 1,t corresponding to the first data set.
- Math Figure 12 there is an advantage in that an error corresponding to the first error due to the approximate function 1-1 may be improved in the process of estimating the approximate function 2 and the magnitude parameter.
- each of the value of the approximate function parameter 2 and the value of the magnitude parameter may be estimated in such a manner that the total error determined based on the difference between (a) the second data set; and (b) the sum of the approximate function 2 and the signal value (or the approximate function 1-2) dependent on the first target analyte at the second temperature, at each of the plurality of cycles, is minimized.
- the total error is a value obtained by scaling the first error and the second error, and for example, may be calculated by summing or arithmetically averaging the values of the first error and the second error which are scaled in units through standardization for making an average be 0 and a variance be 1 or mean normalization for making an average be 0 and a value range from -1 to 1.
- the processor 240 may perform the joint-estimation on the value of the approximate function parameter 2-2 and the value of the magnitude parameter, by using an entire objective function for the first data set and the second data set.
- the entire objective function may output an overall error determined based on a sum of: (a) a sum of a difference (e.g., the first error) between the first data set and the approximate function 1-1 at each of the plurality of cycles; and (b) a sum of a difference (e.g., the second error) between (b1) the second data set and (b2) a sum of the approximate function 2-2 and the signal value (or the approximate function 1-2 ) dependent on the first target analyte at the second temperature, at each of the plurality of cycles.
- a sum of a difference e.g., the first error
- a difference e.g., the second error
- ⁇ 1 represents the standard deviation of the first error for the plurality of cycles when the statistical sample is the first data set (specifically, a set of the first errors in the plurality of cycles).
- ⁇ 2 represents the standard deviation of the second error for the plurality of cycles when the statistical sample is the second data set (specifically, a set of the second errors in the plurality of cycles))
- the processor 240 may apply the pre-estimated value of the approximate function parameter 1-1 to the approximate function 1-1 in the entire objective function, and may calculate the value of the approximate function parameter 2 and the value of the magnitude parameter that enable the entire objective function to be a maximum value or a minimum value.
- the processor 240 may apply the value of the approximate function parameter 1-1 estimated in the previous step to the approximate function 1-1 included in the entire objective function, and perform the joint-estimation on the value of the approximate function parameter 2-2 and the value of the magnitude parameter so that the entire objective function is minimized.
- a preset value may be applied to each of the variance (e.g., ⁇ 1 2 ) of the first error and the variance (e.g., ⁇ 2 2 ) of the second error in the entire objective function.
- ⁇ 1 2 may be estimated as ⁇ n/(n-1) *(an output value of the first objective function) ⁇
- ⁇ 2 2 may be estimated as ⁇ n/(n-1)*(an output value of the second objective function) ⁇ or ⁇ 1 2 .
- a process of scaling a unit so that a normal distribution for the first error and the second error follows N(0, 1) may be added through an operation of dividing each of the variance of the first error and the variance of the second error for each of the output value of the first objective function and the output value of the second objective function.
- At least one of the differentiation method, the difference method, the step difference method, the ratio approach, the linear regression analysis, and the gradient descent method of the signal value may be used.
- an optimized values of the approximate function parameter 2-2 , ⁇ 22 , and the magnitude parameter CR may be derived together through the joint-estimation that finds extremum by partial differentiation for each of the approximate function parameter 2-2 , ⁇ 22 , and the magnitude parameter CR to be optimized in the second objective function or the third objective function.
- each of the value of the approximate function parameter 2 and the value of the magnitude parameter may be estimated based on the joint maximum likelihood estimation.
- being based on the joint maximum likelihood estimation may be understood as a concept encompassing the joint log-likelihood estimation, the joint negative log-likelihood estimation, and the like.
- the processor 240 may perform the joint-estimation on the value of the approximate function parameter 1-1 , the value of the approximate function parameter 2 , and the value of the magnitude parameter, by at least partially using the first data set and the second data set.
- the processor 240 may perform the joint-estimation on the approximate function parameter 1 , the approximate function parameter 2 , and the magnitude parameter, in consideration of (a) the sum of the differences (e.g., the first error) between the first data set and the approximate function 1-1 at each of the plurality of cycles and (b) the sum of the difference (e.g., the second error) between the approximate function 2 and the sum of the signal values (or the approximate function 1-2 ) dependent on the first target analyte at the second temperature.
- the processor 240 may perform the joint-estimation on the approximate function parameter 1 , the approximate function parameter 2 , and the magnitude parameter, in consideration of (a) the sum of the differences (e.g., the first error) between the first data set and the approximate function 1-1 at each of the plurality of cycles and (b) the sum of the difference (e.g., the second error) between the approximate function 2 and the sum of the signal values (or the approximate function 1-2 ) dependent on the first target analyte at the second
- the processor 240 may perform the joint-estimation on the value of the approximate function parameter 1-1 , the value of the approximate function parameter 2 , and the value of the magnitude parameter by using the entire objective function for the first data set and the second data set.
- the entire objective function may be expressed as Math Figure 16 .
- the processor 240 may calculate the value of the approximate function parameter 1-1 , the value of the approximate function parameter 2 , and the value of the magnitude parameter that make the entire objective function the minimum value.
- FIG. 6 is a flowchart illustrating a detailed method in which the computer device 200 according to the second embodiment performs the j oint-estimation on the value of the approximate function parameter 1-1 , the value of the approximate function parameter 2, and the value of the magnitude parameter through the processor 240.
- the processor 240 may apply any value or a pre-estimated value to any one or two parameters among the approximate function parameter 1-1 , the approximate function parameter 2 , and the magnitude parameter, and estimate the value of the remaining parameter.
- the processor 240 may apply a randomly determined value within a preset range to each of the approximate function parameter 2-2 and the magnitude parameter in the entire objective function, and may estimate the value of the approximate function parameter 1-1 that makes the entire objective function have a minimum value.
- ⁇ 1 2 ⁇ n/(n-1)*(an output value of the first objective function) ⁇
- ⁇ 2 2 ⁇ 1 2 .
- the processor 240 may apply the estimated values of the above remaining parameter and estimate the value of the above one or two parameters.
- the processor 240 may apply the value estimated in the previous step to the approximate function parameter 1-1 in the entire objective function, and may estimate the value of the magnitude parameter and the value of the approximate function parameter 2-2 that make the entire objective function to have a minimum value.
- ⁇ 2 2 ⁇ n/(n-1)*(an output value of the second objective function) ⁇ may be estimated.
- a backfitting algorithm may be used in the process of the joint-estimation on the value of the approximate function parameter 1-1 , the value of the approximate function parameter 2 , and the value of the magnitude parameter, which cause the entire objective function to be the minimum value, through such repetition.
- the processor 240 may repeatedly perform the operation of applying the value of the parameter estimated in the previous step to the entire objective function and estimating the values of the parameter not estimated in the previous step in such a manner that the entire objective function becomes the minimum value, until a preset condition is satisfied.
- the preset condition may be a condition that the count of repetitions (e.g., learning rate) is equal to or greater than a preset value, and may be a condition that the output value of the entire objective function is within a predetermined value range or in a specific state (e.g., minimization, optimization), but is not limited thereto.
- the processor 240 may perform the joint-estimation on the value of the above-described parameters based on another embodiment of the statistical model in which the background signal is considered.
- FIG. 7A exemplarily illustrates the first data set and the second data set.
- the first data set and the second data set under similar conditions to those in FIG. 2A are illustrated as an example.
- the data set further includes an exemplary background signal unlike in FIG. 2A .
- such a form of the background signal is for exemplary purposes only.
- FIG. 7B exemplarily illustrates signal values dependent on the presence of the first target analyte at the first temperature, the background signal at the first temperature, signal values dependent on the presence of the second target analyte at the second temperature, and the background signal at the second temperature, which are estimated from the first data set and the second data set shown in FIG. 7A .
- FIG. 7B when signal values dependent on the presence of the first target analyte at the first temperature and signal values dependent on the presence of the second target analyte at the second temperature are extracted from the first data set and the second data set, unlike FIG.
- the first background signal independent of the presence of the first target analyte measured at the first temperature and the second background signal independent of the presence of the first target analyte or the second target analyte measured at the second temperature may be extracted together.
- the approximate function 1 may further include the background signal approximate function 1 for approximating the first background signal
- the approximate function 2 may further include the background signal approximate function 2 for approximating the second background signal
- the processor 240 may perform the joint-estimation on one or more approximate function parameters of the background signal approximate function 1 and the background signal approximate function 2 together in the above-described operation of the joint-estimation.
- a mathematical relationship for separating the first background signal and the signal values dependent on the presence of the first target analyte from the first data set measured at the first temperature may be defined.
- a mathematical relationship for excluding the signal values dependent on the presence of the first target analyte from the second data set measured at the second temperature and separating the signal values dependent on the presence of the second target analyte and the second background signal may be defined.
- the statistical model may include Math Figure 17 below, and Math Figure 17 may be expressed as Math Figure 18 to 19.
- ⁇ 11 denotes the approximate function parameter of the background signal approximate function 1
- ⁇ 22 denotes the approximate function parameter of the background signal approximate function 2
- f 11 ( ⁇ 11 ,t)+ ⁇ 11 ( ⁇ 11 ,t) represents the approximate function 1-1 in which the background signal is considered.
- f 11 ( ⁇ 11 ,t) represents the target signal approximate function 1-1 in which the approximate function parameter of the target signal approximate function 1-1 and the cycle are input variables
- g 11 ( ⁇ 11 ,t) represents the background signal approximate function 1 at the first temperature in which the approximate function parameter of the background signal approximate function 1 and the cycle are input variables.
- f 22 ( ⁇ 22 ,t)+g 22 ( ⁇ 22 ,t) represents the approximate function 2-2 in which the background signal is considered.
- f 22 ( ⁇ 22 ,t) represents the target signal approximate function 2-2 in which the approximate function parameter of the target signal approximate function 2-2 and the cycle are input variables
- g 22 ( ⁇ 22 ,t) represents the background signal approximate function 2 at the second temperature in which the approximate function parameter of the background signal approximate function 2 and the cycle are input variables.
- the first data set may be defined as the sum of the target signal approximate function 1-1 , the background signal approximate function 1 , and the first error.
- the second data set may be defined as the sum of: the product of the target signal approximate function 1-1 and the magnitude parameter; the target signal approximate function 2-2 ; the background signal approximate function 2 ; and the second error.
- the first data set may be defined as the sum of: the product of an inverse of the magnitude parameter and the target signal approximate function 1-2 ; the background signal approximate function 1 ; and the first error
- the second data set may be defined as a sum of: the target signal approximate function 1-2 ; the target signal approximate function 2-2 ; the background signal approximate function 2 ; and the second error.
- the following objective functions may be modified in a similar manner.
- the processor 240 may perform the joint-estimation on the values of the above-described parameters based on another embodiment of the statistical model in which the background signal is considered.
- another embodiment of the statistical model may include one or more objective functions for estimating the optimized value of the parameter, and the processor 240 may obtain the value of the parameter that causes the objective function to be the maximum value or the minimum value and calculate the value as the optimized estimate of the parameter.
- the joint-estimation for values of the parameters is performed by using various objective functions will be described.
- the value of at least one parameter of the background signal approximate function 1 and the background signal approximate function 2 may be further joint-estimated.
- FIG. 8 is a flowchart illustrating a method in which the processor 240 performs the joint-estimation on the value of the approximate function parameter 2 and the value of the magnitude parameter in consideration of the background signal, according to the third embodiment.
- FIG. 8 may be understood with reference to the embodiments described above with reference to FIGS. 1 to 7 , and a description of overlapping or similar technical principles will be omitted.
- the processor 240 may estimate the value of the parameter of the target signal approximate function 1-1 for signal values dependent on the first target analyte included in the approximate function 1-1 and the value of the parameter of the background signal approximate function 1-1 for the first background signal by using the first data set.
- each of the value of the parameter of the target signal approximate function 1-1 and the value of the parameter of the background signal approximate function 1-1 may be joint-estimation in such a manner that the sum of the differences between the first data set and the approximate function 1-1 for which the first background signal is considered at each of the plurality of cycles is minimized.
- the processor 240 may estimate the value of the parameter of the target signal approximate function 1-1 and the value of a parameter of the background signal approximate function 1-1 by using the first objective function for the first data set.
- the first objective function may be expressed as Math Figure 20 below, assuming that the first error follows a normal distribution of N(0, ⁇ 1 2 ).
- the processor 240 may calculate the value of the parameter of the target signal approximate function 1-1 and the value of a parameter of the background signal approximate function 1-1 , in such a manner that the first objective function has a minimum value.
- the processor 240 may perform the joint-estimation on the value of the parameter of the target signal approximate function 2 for signal values dependent on the second target analyte included in the approximate function 2 , the value of the parameter of the background signal approximate function 2 for the second background signal, and the value of the magnitude parameter, by at least partially using the estimated value of the parameter of the target signal approximate function 1-1 , the estimated value of the parameter of the background signal approximate function 1-1 , and the second data set.
- each of the value of the parameter of the target signal approximate function 2 , the value of the parameter of the background signal approximate function 2 , and the value of the magnitude parameter may be joint-estimated in such a manner that a difference at each of the plurality of cycles between (a) the second data set; and (b) the sum of the approximate function 2 and the signal values (or the approximate function 1-2 ) dependent on the first target analyte at the second temperature; is minimized.
- the processor 240 may perform the joint-estimation on the value of the parameter of the target signal approximate function 2-2 , the value of the parameter of the background signal approximate function 2-2 , and the value of the magnitude parameter, by using the second objective function for the second data set.
- the second objective function may be expressed as Math Figure 21 below, assuming that the second error follows a normal distribution of N(0, ⁇ 2 2 ).
- the processor 240 may calculate the value of the parameter of the target signal approximate function 2-2 , the value of the parameter of the background signal approximate function 2-2 , and the value of the magnitude parameter, which enable the second objective function to have a minimum value.
- the processor 240 may perform the joint-estimation on the value of the parameter of the target signal approximate function 2 , the value of the parameter of the background signal approximate function 2 , and the value of the magnitude parameter, by using the entire objective function for the first data set and the second data set.
- the entire objective function may be expressed as Math Figure 22 below, assuming that the first error follows a normal distribution of N(0, ⁇ 1 2 ) and the second error follows a normal distribution of N(0, ⁇ 2 2 ).
- the processor 240 may apply the values of the parameters previously estimated in the previous step to the approximate function 1-1 in the entire objective function, and may calculate the value of the parameter of the target signal approximate function 2-2 , the value of the parameter of the background signal approximate function 2-2 , and the value of the magnitude parameter, which enable the entire objective function to have a minimum value.
- the value of at least one parameter among the background signal approximate function 1 and the background signal approximate function 2 may be further joint-estimated.
- FIG. 9 is a flowchart illustrating an example of a method in which the processor 240 performs the joint-estimation on the value of the approximate function parameter 1-1 , the value of the approximate function parameter 2 , and the value of the magnitude parameter in consideration of the background signal, according to a fourth embodiment.
- FIG. 9 may be understood with reference to the embodiments described above with reference to FIGS. 1 to 8 .
- the processor 240 may apply an arbitrary value or a pre-estimated value to some parameters among the parameter of the target signal approximate function 1-1 , the parameter of the background signal approximate function 1-1 , the parameter of the target signal approximate function 2 , the parameter of the background signal approximate function 2 , and the magnitude parameter, and may estimate values of the remaining parameters.
- the processor 240 may apply a randomly determined value within a preset range to each of the value of the parameter of the target signal approximate function 2-2 , the value of the parameter of the background signal approximate function 2-2 , and the magnitude parameter in the entire objective function, and may perform the joint-estimation on the value of the parameter of the target signal approximate function 1-1 and the value of the parameter of the background signal approximate function 1-1 in such a manner that the entire objective function has a minimum value.
- the processor 240 may apply the estimated values of the above remaining parameters and estimate the values of the above some parameters.
- the processor 240 may apply the value estimated in the previous step to the parameter of the target signal approximate function 1-1 and the background signal approximate function 1-1 in the entire objective function, and perform the joint-estimation on the value of the parameter of the target signal approximate function 2-2 , the value of the parameter of the background signal approximate function 2-2 , and the value of the magnitude parameter in such a manner that the entire objective function becomes the minimum value.
- ⁇ 2 2 ⁇ n/(n-1)*(an output value of the second objective function) ⁇ .
- the processor 240 may perform at least one of steps S910 to S920 multiple times. In an embodiment, the processor 240 may repeatedly perform the operation of applying the values of the parameter estimated in the previous step to the entire objective function and estimating the values of the parameter not estimated in the previous step in such a manner that the entire objective function becomes the minimum value until the above-described preset condition is satisfied.
- FIGS. 10A to 10D illustrate simulation results according to the third embodiment in which the background signal is considered as a constant. Specifically, according to the third embodiment, the results are illustrated in which the processor 240 estimates the values of the parameters of the target signal approximate function 1-1 and the background signal approximate function 1-1 by using the first data set, and then performs the joint-estimation on the values of the parameters of the target signal approximate function 2-2 and the background signal approximate function 2-2 and the values of the magnitude parameter by using the estimated values and the second data set.
- Math Figure 6 is used for the target signal approximate functions 1-1 and 2-2
- Math Figure 7 is used for the background signal approximate functions 1-1 and 2-2 as the background signal is considered as a constant, and the parameter value in each background signal approximate function was set to be estimated as a value corresponding to the estimate of ⁇ 2 , which is the parameter indicating signal values in the baseline region.
- Math Figure 20 is used for the j oint-estimation on the value of the parameter of the approximate function 1-1
- Math Figure 22 is used for the joint-estimation on the value of the parameter of the approximate function 2-2 and the value of the magnitude parameter.
- a predetermined statistically calculated value range (e.g., 0.7 to 1.3) is set in the magnitude parameter.
- the first data set and the second data set in the case corresponding to each of tubes 1 to 4 shown in FIG. 7 are shown in the upper graph of each of FIGS. 10A to 10D .
- the bottom graph shows simulation results for the approximate function 1-1 and the approximate function 2-2 to which the values of the parameters estimated from the corresponding first data set and second data set according to the third embodiment are applied.
- a solid line graph shows output values of the approximate function 1-1 and the approximate function 2-2 corresponding to an estimate (including signal values dependent on each target analyte and the background signal)
- a dotted line graph shows signal values corresponding to raw data of each target analyte in which an error is included.
- FIG. 10A illustrates a case in which only the first target analyte is present among the first target analyte and the second target analyte in the sample, and the values of the parameters ⁇ 11-1 to ⁇ 11-5 of the target signal approximate function 1-1 (see Math Figure 6 ), the values of the parameters ⁇ 22-1 to ⁇ 22-5 of the target signal approximate function 2-2 (see Math Figure 6 ), the values of the parameters ⁇ 1-0 of the background signal approximate function 1-1 (see Math Figure 7 ), the values of the parameters ⁇ 2-0 of the background signal approximate function 2-2 (see Math Figure 7 ), and the values of the magnitude parameter, which are estimated to minimize the total error according to the third embodiment, are shown in Table 1 below.
- the approximate function 1-1 and the approximate function 2-2 may be visualized as shown in the lower graph of FIG. 10A , and it can be seen that each approximate function is appropriately estimated from the first data set and the second data set.
- the approximate function 2-2 has relatively little amplification amount compared to the approximate function 1-1 , but in detail, it may appear as an S-shaped curve according to the characteristics of the sigmoid function.
- FIG. 10B illustrates a case in which only the second target analyte is present among the first target analyte and the second target analyte in the sample, and similarly, the values of the parameters estimated to minimize the overall error according to the third embodiment are shown in Table 2 below.
- each approximate function to which the estimated values of the parameters are applied may be visualized as shown in the lower graph of FIG. 10B , and it can be seen that the values are appropriately estimated from the first data set and the second data set.
- the approximate function 1 may be amplified in a relatively small amount compared to the approximate function 2 , but in detail, it may appear as an S-shaped curve according to the characteristics of the sigmoid function.
- FIG. 10C illustrates a case in which the first target analyte and the second target analyte in the sample are present together with similar high concentrations, and similarly, the values of the parameters estimated to minimize the overall error according to the third embodiment are shown in Table 3 below.
- each approximate function to which the estimated values of the parameters are applied may be visualized as shown in the lower graph of FIG. 10C , and although the value of the magnitude parameter is on the boundary of the maximum range, it can be seen that each approximate function is separated from the first data set and the second data set to a reasonable degree.
- FIG. 10D illustrates a case in which the first target analyte is present with a relatively high concentration and the second target analyte is present with a relatively low concentration together in the sample, and similarly, the values of the parameters estimated to minimize the overall error according to the third embodiment are shown in Table 4 below.
- each approximate function to which the estimated values of the parameters are applied may be visualized as shown in the lower graph of FIG. 10D , and it can be seen that each approximate function is appropriately separated from the first data set and the second data set.
- the value of the approximate function parameter 1-1 , the value of the approximate function parameter 2-2 , and the value of the magnitude parameter in which the background signal is considered may be joint-estimated by using the first data set and the second data set, and it can be seen that the algorithm according to the present disclosure operates well as shown in FIG. 10 .
- FIGS. 11A to 11D illustrate simulation results according to the third embodiment in which the background signal is considered as a first-order function
- FIGS. 12A to 12C illustrate simulation results according to the third embodiment in which the background signal is considered as a second-order function. It was simulated under similar conditions to the simulation described above.
- Math Figure 8 is used for each background signal approximate function as the background signal is considered as the first-order function
- Math Figure 10 is used for each background signal approximate function as the background signal is considered as the second-order function.
- the first data set and the second data set in cases corresponding to tubes 1, 2, and 4 illustrated in FIG. 7 are illustrated.
- the middle and bottom graphs show simulation results for the signal values dependent on the presence of the first target analyte at the first temperature (the target signal approximate function 1-1 ), the signal values dependent on the presence of the second target analyte at the second temperature (the target signal approximate function 2-2 ), the first background signal (the background signal approximate function 1-1 ), and the second background signal (the background signal approximate function 2-2 ) to which the values of the parameters estimated from the corresponding first data set and second data set are applied according to the simulation.
- the solid line graph shows output values of the approximate function 1-1 and the approximate function 2-2 corresponding to estimates
- the dotted line graph shows signal values corresponding to raw data of each target analyte in which the background signal is removed and the error is reflected.
- the processor 240 may perform the above-described joint-estimation according to another embodiment in which the magnitude parameter has two or more values.
- the magnitude parameter may have two or more values.
- the magnitude parameter may have two or more values applied to each of two or more cycle sections selected from the plurality of cycles.
- each cycle section may be a continuous section or a discontinuous section.
- the magnitude parameter may have, for example, three values applied to each of a first cycle section (e.g., 1 to 10), a second cycle section (e.g., 11 to 30), and a third cycle section (e.g., 31 to 45), which are continuously divided from a preset cycle section (e.g., 1 to 45).
- the magnitude parameter may have two values applied to each of the first cycle sections (e.g., 10 to 15, 30 to 33, . . . , 44) and the second cycle sections (e.g., 16 to 29, 34 to 39, ... , 45) which are continuously or discontinuously divided from among the preset cycle sections (e.g., 1 to 45).
- the cycle section may be selected from a part of the entire cycle period, or may be selected from the remaining period excluding one or more preset periods (e.g., 1 to 5) of the entire cycle period.
- the value of the magnitude parameter may be joint-estimated for each of two or more cycle sections selected from the plurality of cycles.
- the value of the magnitude parameter may be estimated for each of two or more cycle sections.
- a count of values of the magnitude parameter is 2, and there are different CR values corresponding to each of cycle sections 1 and 2, and each CR value may be estimated so that the total error is minimized by applying the CR for each cycle section in the above-described joint-estimation process.
- the magnitude parameter may have a plurality of values for the plurality of cycles.
- the magnitude parameter may be processed in the form of a set of data points, each of which contains values for the cycle and the magnitude parameter, or in the form of a two-dimensional array where the cycle is a row and the magnitude parameter is a column.
- the magnitude parameter may be processed in the form of a one-dimensional array that is a bundle of values of the magnitude parameter arranged according to the corresponding cycle order.
- the value of the magnitude parameter may be joint-estimated for each of the plurality of cycles.
- CR included in the corresponding Math Figures may be replaced with CRt representing CR in each of the plurality of cycles t.
- the magnitude parameter may be one or more parameters included in a magnitude approximate function defined in the form of a polynomial function.
- the CR included in the above-described Math Figures may be replaced with the corresponding magnitude approximate function, and in the above-described joint-estimation process, the corresponding coefficient values may be estimated as values of the corresponding magnitude parameter together with the values of the approximate function parameter 1 and/or the approximate function parameter 2 .
- FIGS. 14A to 14D illustrate simulation results in which the value of the magnitude parameter is estimated for each of the plurality of cycles according to another embodiment described above.
- the simulation process has been simulated in the same or similar manner as described above with reference to FIGS. 10A to 10D , and the upper graph and the lower graph of each of FIGS. 14A to 14D may also be interpreted in the same manner.
- the background signal is a constant was applied for convenience in the corresponding simulation process.
- the background signal is the first-order function or the second-order function, simulated results were obtained appropriately.
- FIG. 14A illustrates a case in which only the first target analyte is present, and the values of the parameters estimated to minimize the overall error according to the above-described embodiment are shown in Table 5 below, and in particular, the values of the magnitude parameters are estimated for each of the plurality of cycles. Each approximate function to which the estimated values of the parameters are applied may be visualized as shown in the lower graph.
- FIG. 14B illustrates a case in which only the second target analyte is present, and the values of the parameters estimated to minimize the total error according to the above-described embodiment are as shown in Table 6 below, and each approximate function to which the estimated values of the parameters are applied may be visualized as shown in the lower graph.
- FIG. 14C illustrates a case in which the first target analyte and the second target analyte are present together with similar high concentrations, the values of the parameters estimated to minimize the total error according to the above-described embodiment are as shown in Table 7 below, and each approximate function to which the estimated values of the parameters are applied may be visualized as shown in the lower graph.
- FIG. 14D illustrates a case in which the first target analyte is present together with a relatively high concentration and the second target analyte is present together with a relatively low concentration, and the values of the parameters estimated to minimize the total error according to the above-described embodiment are shown in Table 8 below, and each approximate function to which the estimated values of the parameters are applied may be visualized as shown in the lower graph.
- joint-estimation is performed on the parameter value of the first parameter group including the approximate function parameter included in the approximate function 1-1 and the approximate function 2 and the magnitude parameter.
- the joint-estimation may be performed on the parameter value of the second parameter group including the approximate function parameter included in the approximate function 1-2 and the approximate function 2 and the magnitude parameter.
- the statistical model may include at least one of Math Figures 23 to 27 below.
- ⁇ 12 represents the approximate function parameter 1-2
- f 12 ( ⁇ 12 ,t) represents the approximate function 1-2 (specifically, the target signal approximate function 1-2 ) in which the approximate function parameter 1-2 and the cycle are input variables.
- the first objective function, the second objective function, and the entire objective function may be expressed as in Math Figures 28, 29, and 30 below.
- the processor 240 may separate signal values dependent on the presence of the first target analyte at the first temperature and signal values dependent on the presence of the second target analyte at the second temperature, from the first data set and the second data set.
- the processor 240 may determine a cycle threshold (Ct) used to detect each of the first target analyte and the second target analyte in the sample by using the joint-estimation result.
- the processor 240 may determine a first cycle threshold for the first target analyte by using the estimated value of the approximate function parameter 1 , and may determine a second cycle threshold for the second target analyte by using the estimated value of the approximate function parameter 2.
- the cycle threshold may be a count of the cycles at a point where signal values (e.g., RFU) dependent on each target analyte exceeds a predetermined reference signal value (e.g., 200), but is not limited thereto.
- signal values e.g., RFU
- the first cycle threshold for the first target analyte is 38.0808
- the second cycle threshold for the second target analyte is 29.2071.
- the cycle threshold may be broadly interpreted as a meaning including a signal value, the count of the cycles, or a measured value of a specific parameter when a result of a predetermined analysis (e.g., a derivative, etc.) derived from the corresponding approximate function satisfies a predetermined condition.
- the cycle threshold may refer to the count of cycles in which the first-order, the second-order, or the multi-order derivative of the approximate function having the estimated value of the approximate function parameter is calculated and then the maximum value of the calculated derivative is obtained.
- the cycle threshold may be interpreted as a meaning encompassing the terms CP (cross point), TOP (take-off point), or CQ (quantization cycle) used in the art.
- the processor 240 may detect each of the first target analyte and the second target analyte in the sample by using the joint-estimation result. In an embodiment, the processor 240 may determine whether each of the first target analyte and the second target analyte in the sample is positive or negative by at least partially using the first cycle threshold and the second cycle threshold. For example, the processor 240 may determine whether each target analyte is present depending on whether each cycle threshold is within a preset range (e.g., 0 to 40).
- a preset range e.g., 0 to 40
- the processor 240 may determine whether each target analyte is present in the sample based on whether a magnitude of the cycle threshold, an amount of change in the signal values dependent on each target analyte during the entire cycles, a slope of cycles corresponding to signal values dependent on each target analyte in the exponential region, and the like satisfy a predetermined condition, and output a determination result including whether each target analyte is positive or negative and the cycle threshold.
- the determination result may further include the joint-estimation result, and for example, function information used for the estimation, the estimated values of the parameters, and the like may be provided together.
- the processor 240 may use the approximate function 1 that approximates the signal values at the first temperature or the second temperature. For example, it may be determined whether each target analyte in the sample at different temperatures is present by using the approximate function 1 that approximates the signal values at the first temperature and the approximate function 2 that approximates the signal values at the second temperature. In addition, it may be determined whether each target analyte in the sample at the same second temperature is present by using the approximate function 1 that approximates the signal values at the second temperature and the approximate function 2 that approximates the signal values at the second temperature.
- FIG. 13 is a flowchart exemplarily illustrating a method for obtaining the approximate signal for each of the plurality of target analytes, performed by the computer device 200 according to an embodiment.
- the computer device 200 may obtain, from the signal generation reaction of the plurality of cycles for the first target analyte and the second target analyte in a sample, the first data set measured at the first detection temperature at each of the plurality of cycles and the second data set measured at the second detection temperature at each of the plurality of cycles.
- the computer device 200 may perform the joint-estimation on a value(s) of at least one approximate function parameter of at least one approximate function and a value(s) of the magnitude parameter; wherein the at least one approximate function may include at least one selected from the group consisting of: the approximate function 1-1 for approximating signal values dependent on the presence of the first target analyte at the first detection temperature; the approximate function 1-2 for approximating signal values dependent on the presence of the first target analyte at the second detection temperature; and the approximate function 2 for approximating signal values dependent on the presence of the second target analyte at the second detection temperature; wherein the magnitude parameter may indicate a relationship between the signal values dependent on the presence of the first target analyte at the first detection temperature and the signal values dependent on the presence of the first target analyte at the second detection temperature.
- step S1320 may be performed according to various embodiments, but is not limited thereto.
- the computer device 200 may estimate the value of the approximate function parameter 1-1 by using the first data set.
- the computer device 200 may perform the joint-estimation on the value of the approximate function parameter 2 and the value of the magnitude parameter by at least partially using the value estimated for the approximate function parameter 1-1 and the second data set.
- the computer device 200 may perform the joint-estimation on the value of the approximate function parameter 1-1 , the value of the approximate function parameter 2 , and the value of the magnitude parameter, in consideration of: (a) the sum of the differences between the first data set and the approximate function 1-1 at each of the plurality of cycles; and (b) the sum of the difference at each of the plurality of cycles between (b-1) the second data set and (b-2) the sum of the approximate function 2 and the signal value dependent on the first target analyte at the second temperature (or the approximate function 1-2 ).
- the computer device 200 may estimate the value of the parameter of the target signal approximate function 1-1 and the background signal approximate function 1-1 included in the approximate function 1 , by using the first data set. In addition, the computer device 200 may perform the joint-estimation on the value of the parameter of the target signal approximate function 2-2 and the background signal approximate function 2-2 included in the approximate function 2-2 and the magnitude parameter value, by at least partially using the estimated value of the parameter and the second data set.
- the computer device 200 may perform the joint-estimation on the value of the parameter of the target signal approximate function 1-1 , the background signal approximate function 1-1 , the target signal approximate function 2-2 , the background signal approximate function 2-2 , and the magnitude parameter, in consideration of: (a) the sum of the difference between the first data set and the approximate function 1-1 at each of the plurality of cycles; and (b) the sum of the differences at each of the plurality of cycles between (b-1) the second data set and (b-2) the sum of the approximate function 2-2 and the signal value dependent on the first target analyte at the second temperature (or the approximate function 1-2 ).
- values of parameters may be estimated in a more systematic and easy-to-apply manner by performing the joint-estimation on the value of the approximate function parameter and values of the magnitude parameter that are used to separate signal values dependent on each target analyte.
- a more accurate positive/negative determination result for the target analyte may be obtained.
- cost efficiency may be improved by omitting numerous procedures required to previously set the value of the magnitude parameter in the related art.
- the method for obtaining the approximate signal may be implemented as a computer-readable recording medium storing a computer program programmed to perform each step included in the above-described method, or may be implemented by a computer program stored in a computer-readable recording medium programmed to perform each step included in the above-described method.
- a method for detecting each of the plurality of target analytes may be performed by the computer device 200 according to another embodiment of the present disclosure.
- the computer device 200 may detect each of the first target analyte and the second target analyte in the sample by using the joint-estimation result. Specifically, the computer device 200 may determine the presence or absence of the first target analyte in the sample by using the approximate function 1-1 having the value of the approximate function parameter 1-1 and/or the approximate function 1-2 having the value of the approximate function parameter 1-2 included in the joint-estimation result, and determine the presence or absence of the second target analyte in the sample by using the approximate function 2 having the value of the approximate function parameter 2 included in the joint-estimation result.
- the computer device 200 may determine the first cycle threshold from the approximate function 1-1 having the estimated value of the approximate function parameter 1-1 or may determine the second cycle threshold determined from the approximate function 1-2 having the estimated value of the approximate function parameter 1-2 . In addition, the computer device 200 may determine the presence or absence of the first target analyte in the sample, based on whether the first cycle threshold or the second cycle threshold satisfies a preset condition (e.g., whether it is within a predetermined value range).
- a preset condition e.g., whether it is within a predetermined value range.
- the computer device 200 may determine the second cycle threshold from the approximate function 2 having the estimated value of the approximate function parameter 2 , and determine the presence or absence of the second target analyte in the sample based on whether the second cycle threshold satisfies the above-described condition.
- the computer device 200 may perform the joint-estimation on the parameter of the approximate function that approximate signal values dependent on the presence of each of three target analytes and the magnitude parameter, from three data sets measured at each of the first detection temperature to the third detection temperature.
- the computer device 200 may obtain, from a signal generation reaction of the plurality of cycles for the first target analyte, the second target analyte, and the third target analyte in a sample, the first data set measured at the first detection temperature at each of the plurality of cycles, the second data set measured at the second detection temperature at each of the plurality of cycles, and the third data set measured at the third detection temperature at each of the plurality of cycles.
- the first data set may include signal values dependent on the presence of the first target analyte in the sample at the first detection temperature
- the second data set may include signal values dependent on the presence of the first target analyte and the second target analyte in the sample at the second detection temperature
- the third data set may include signal values dependent on the presence of the first target analyte, the second target analyte, and the third target analyte in the sample at the third detection temperature.
- this signal generation reaction is performed by incubating a sample with the first signal generation composition for detecting the first target analyte in the sample, the second signal generation composition for detecting the second target analyte, and the third signal generation composition for detecting the third target analyte in one reaction well, wherein the first signal generation composition, the second signal generation composition, and the third signal generation composition include the same label, and wherein signals from the label are not differentiated for each target analyte by a single type of detector.
- the first data set, the second data set, and the third data set are exemplarily illustrated.
- the first temperature, the second temperature, and the third temperature are 83°C., 72°C., and 60°C., respectively.
- target 1 refers to the first target analyte
- target 2 refers to the second target analyte
- target 3 refers to the third target analyte.
- the background signal is not considered is exemplarily illustrated, but a case in which the background signal is considered may be understood in the same or similar manner as the above-described embodiments.
- an amplification curve dependent on the presence of target 1 appears in each of the first to third data sets.
- an amplification curve dependent on the presence of target 2 appears in the second to third data sets.
- an amplification curve dependent on the presence of target 3 appears in the third data set.
- FIG. 15B illustrates the signal values on the presence of each target analyte at each temperature dependent, which are joint-estimated from the first data set to the third data set shown in FIG. 15A .
- an amplification curve generated in the presence of each target analyte at the detection temperature of each target analyte may be extracted as in tubes 1 to 3.
- an amplification curve generated in the presence of each target analyte at the detection temperature of each target analyte may be extracted as in tubes 4 to 7.
- the computer device 200 may perform the joint-estimation on (a) a value of the approximate function parameter of at least one approximate function among the approximate function 1 , the approximate function 2 , and the approximate function 3 , and (b) a value of at least one magnitude parameter among a plurality of magnitude parameters.
- the approximate function 1 may include at least one of the approximate function 1-1 that approximates signal values dependent on the presence of the first target analyte at the first detection temperature, the approximate function 1-2 that approximates signal values dependent on the presence of the first target analyte at the second detection temperature, and the approximate function 1-3 that approximates signal values dependent on the presence of the first target analyte at the third detection temperature.
- the approximate function 2 may include at least one of the approximate function 2-1 that approximates signal value dependent on the presence of the second target analyte at the first detection temperature, the approximate function 2-2 that approximates signal value dependent on the presence of the second target analyte at the second detection temperature, and the approximate function 2-3 that approximates signal value dependent on the presence of the second target analyte at the third detection temperature.
- the approximate function 3 is a function that approximates signal values dependent on the presence of the third target analyte, and may include at least one of an approximate function 3-1 that approximates signal values dependent on the presence of the third target analyte at the first detection temperature, an approximate function 3-2 that approximates signal values dependent on the presence of the third target analyte at the second detection temperature, and an approximate function 3-3 that approximates signal values dependent on the presence of the third target analyte at the third detection temperature.
- the approximate function 3 may be interpreted in the same or similar manner as the above-described embodiments with respect to the approximate function 1 or the approximate function 2 .
- the approximate function 3 may be represented by any one of Math Figures 1 to 6 described above as a constant or a polynomial function, and according to an embodiment, may include a target signal approximate function 3 that approximates signal values dependent on the presence of the third target analyte and a background signal approximate function 3 that approximates the third background signal independent from the presence of the third target analyte.
- each magnitude parameter represents a relationship between (i) signal values dependent on the presence of at least one target analyte among the target analytes at any one detection temperature among from the first detection temperature to the third detection temperature, and (ii) signal values dependent on the presence of the at least one target analyte at another one detection temperature among from the first detection temperature to the third detection temperature.
- each magnitude parameter may represent a relationship of changes in the signals provided by each signal generation composition at two temperatures selected from the first detection temperature, the second detection temperature, and the third detection temperature in the presence of each target analyte, and may be determined, for example, as a difference or ratio between signal values detected at the two selected temperatures.
- the plurality of magnitude parameters may include at least one selected from the group consisting: a first magnitude parameter indicates a relationship between signal values dependent on the presence of the first target analyte at the first detection temperature and signal values dependent on the presence of the first target analyte at the second detection temperature; a second magnitude parameter indicates a relationship between signal values dependent on the presence of the first target analyte at the second detection temperature and signal values dependent on the presence of the first target analyte at the third detection temperature; a third magnitude parameter indicates a relationship between signal values dependent on the presence of the second target analyte at the second detection temperature and signal values dependent on the presence of the second target analyte at the third detection temperature; and a fourth magnitude parameter indicates a relationship between signal values dependent on the presence of the first target analyte at the first detection temperature and signal values dependent on the presence of the first target analyte at the third detection temperature.
- Each magnitude parameter is a value or a set of values indicating a change pattern of signal values dependent on a specific target analyte at different temperatures, and may mean, for example, a magnitude ratio of the corresponding signal values, or a value or a set of values calculated therefrom according to a predetermined equation.
- the first magnitude parameter it may be obtained as the ratio of the signal values dependent on the presence of the first target analyte at the first detection temperature to the signal values dependent on the presence of the first target analyte at the second detection temperature, or as the ratio of the signal values dependent on the presence of the first target analyte at the first detection temperature to the signal values dependent on the presence of the first target analyte at the second detection temperature.
- the magnitude parameter of the present disclosure is not limited to the above-described embodiments, and according to embodiments, the magnitude parameter may further include magnitude parameters indicating various other signal relationships.
- the plurality of magnitude parameters may include at least one selected from the group consisting: a fifth magnitude parameter indicating a relationship between signal values dependent on the presence of the second target analyte at the first detection temperature and signal values dependent on the presence of the second target analyte at the second detection temperature; a sixth magnitude parameter indicating a relationship between signal values dependent on the presence of the second target analyte at the first detection temperature and signal values dependent on the presence of the second target analyte at the third detection temperature; a seventh magnitude parameter indicating a relationship between signal values dependent on the presence of the third target analyte at the first detection temperature and signal values dependent on the presence of the third target analyte at the second detection temperature; an eighth magnitude parameter indicating a relationship between signal values dependent on the presence of the third target analyte at the second detection temperature and signal values
- the joint-estimation process may be performed in a method for performing the joint-estimation on (a) the value of the approximate function parameter of at least one approximate function selected from the group consisting of the approximate function 1-1 , the approximate function 1-2 , the approximate function 1-3 , the approximate function 2-2 , the approximate function 2-3 , and the approximate function 3-3 , and (b) the value of at least one magnitude parameter among the plurality of magnitude parameters.
- the joint-estimation process may be performed in a method for performing the j oint-estimation on (a) the value of the approximate function parameter of at least one approximate function selected from the group consisting of the approximate function 1-1 , the approximate function 1-2 , the approximate function 1-3 , the approximate function 2-1 , the approximate function 2-2 , the approximate function 2-3 , the approximate function 3-1, the approximate function 3-2 , and the approximate function 3-3 , and (b) the value of at least one magnitude parameter among the plurality of magnitude parameters.
- the joint-estimation may be performed on values of the third parameter group including (a) the approximate function parameters of the approximate function 1-1 , the approximate function 2-2 , and the approximate function 3-3 and (b) the first magnitude parameter to the third magnitude parameter.
- the joint-estimation may be performed on values of the fourth parameter group including (a) the approximate function parameters of the approximate function 1-1 , the approximate function 2-2 , and the approximate function 3-3 and (b) the first magnitude parameter, the second magnitude parameter, and the fourth magnitude parameter.
- the combination of parameters to be subjected to the joint-estimation is not limited to the above-described embodiments, and may be modified and implemented in various ways.
- the computer device 200 may prepare the joint-estimation for the above-described parameters based on the pre-stored statistical model.
- a mathematical relationship for separating signal values dependent on the presence of the first target analyte from the first data set measured at the first temperature may be defined.
- a mathematical relationship for excluding signal values dependent on the presence of the first target analyte and separating signal values dependent on the presence of the second target analyte from the second data set measured at the second temperature may be defined.
- a mathematical relationship for excluding signal values dependent on the presence of the first target analyte and signal values dependent on the presence of the second target analyte and separating signal values dependent on the presence of the third target analyte from the third data set measured at the third temperature may be defined.
- the statistical model may include Math Figure 31 below defining the relationship between the data sets and the approximate function and/or the magnitude parameter, and Math Figure 31 may be expressed as Math Figures 32 to 34.
- Math Figure 31 may be expressed as Math Figures 32 to 34.
- y 3,t denotes the third data set measured at the third temperature at each of the plurality of cycles
- ⁇ 33 denotes the approximate function parameter 3-3 that is the parameter of the approximate function 3-3
- CR 1
- the computer device 200 may perform the joint-estimation on the above-described parameters based on the statistical model.
- the statistical model may include one or more objective functions for estimating the optimized value of the parameter that approximates the data set, and the computer device 200 may obtain the value of the parameter that causes the objective function to be a preset condition (e.g., a maximum value or a minimum value) and calculate the value as an optimized estimate of the parameter.
- the first objective function with respect to the first error, the second objective function with respect to the second error, the third objective function with respect to the third error, and the entire objective function with respect to the total error may be represented by Math Figures 35 to 38.
- the computer device 200 may estimate the value of the approximate function parameter 1-1 by using the first data set. Also, the computer device 200 may perform the j oint-estimation on the value of the approximate function parameter 2-2 and the value of the first magnitude parameter by at least partially using the result of estimating the approximate function parameter 1- 1 and the second data set. Also, the computer device 200 may perform the j oint-estimation on the value of the approximate function parameter 3-3 , the value of the second magnitude parameter, and the value of the third magnitude parameter by at least partially using the result of estimating the values of the approximate function parameter 2-2 and the magnitude parameter 1-1 , and the third data set.
- the computer device 200 may perform the joint-estimation on the values of the approximate function parameters 1 to the approximate function parameters 3 and the values of the first to third magnitude parameters by at least partially using the first to third data sets.
- the above-described backfitting algorithm may be used in the joint-estimation process, and this process may be understood with reference to the embodiments described throughout the specification.
- the above-described approximate function 1 to the approximate function 3 may further include the background signal approximate function for approximating the first background signal to the third background signal.
- the parameter values of the background signal approximate functions may be joint-estimated together.
- the corresponding process may be understood with reference to the above-described embodiments.
- FIGS. 16A to 16F illustrate simulation results obtained by performing the above-described j oint-estimation from the first to third data sets in consideration of the background signal, according to an embodiment.
- Math Figure 5 was used for each target signal approximate function
- Math Figure 10 was used for each background signal approximate function as the background signal is considered as the second-order function
- equations in a modified form further including the background signal approximate function in Math Figures 31 to 38 were used for the joint-estimation for the values of the parameters.
- the first data set to the third data set in each case are illustrated in the upper graphs of FIGS. 16A to 16F .
- the intermediate graph shows a simulation result for each approximate function to which values of parameters estimated from corresponding data sets are applied in a case in which a value of each magnitude parameter is 1.
- the bottom graph shows a simulation result for each approximate function to which values of parameters estimated from corresponding data sets are applied in a case in which a plurality of values of each magnitude parameter are provided (specifically, values for each cycle).
- the approximate function 1, 2 and 3 represent the approximate functions 1-1, 2-2, and 3-3.
- FIG. 16A illustrates a case in which only the first target analyte is present, and corresponds to a case in which the first target analyte is present with a relatively high concentration (upper line) and a case in which the first target analyte is present with a relatively low concentration (lower line).
- FIGS. 16B and 16C illustrate a case in which only the second target analyte is present and a case in which only the third target analyte is present, respectively, which correspond to a case in which each target analyte is present with a relatively high concentration (upper line) and a case in which each target analyte is present with a relatively low concentration (lower line).
- each approximate function to which the values of the parameters estimated to minimize the overall error according to the above-described embodiment are applied is visualized in the middle and lower graphs, and it can be seen that each approximate function is appropriately estimated from the corresponding data sets.
- FIG. 16D corresponds to a case in which all of the first to third target analytes are present, the first target analyte and the second target analyte are present with a relatively high concentration, and the third target analyte is present with a relatively low concentration.
- FIG. 16E corresponds to a case in which the first and third target analytes are present with a relatively high concentration and the second target analyte is present with a relatively low concentration
- FIG. 16F corresponds to a case in which the second and third target analytes are present with a relatively high concentration and the second target analyte is present with a relatively low concentration.
- each approximate function to which the values of the parameters estimated to minimize the overall error according to the above-described embodiment are applied is visualized in the middle and lower graphs, and it can be seen that each approximate function is appropriately estimated from the corresponding data sets.
- FIG. 17 is a flowchart exemplarily illustrating a method for obtaining the approximate signal for each of the plurality of target analytes, performed by the computer device 200 according to an embodiment.
- the computer device 200 may obtain, from a signal generation reaction of the plurality of cycles for the first target analyte, the second target analyte and the third target analyte in a sample, the first data set measured at the first detection temperature at each of the plurality of cycles, the second data set measured at the second detection temperature at each of the plurality of cycles and the third data set measured at the third detection temperature at each of the plurality of cycles.
- this signal generation reaction is performed by incubating the sample with the first signal generation composition for detecting the first target analyte in the sample, the second signal generation composition for detecting the second target analyte in the sample and the third signal generation composition for detecting the third target analyte in the sample, wherein the first signal generation composition, the second signal generation composition and the third signal generation composition include the same label, and wherein signals from the label are not differentiated for each target analyte by a single type of detector.
- the computer device 200 may perform the j oint-estimation on (a) a value(s) of at least one approximate function parameter of at least one approximate function, wherein the at least one approximate function includes at least one selected from the group consisting of: the approximate function 1-1 for approximating signal values dependent on the presence of the first target analyte at the first detection temperature; the approximate function 1-2 for approximating signal values dependent on the presence of the first target analyte at the second detection temperature; the approximate function 1-3 for approximating signal values dependent on the presence of the first target analyte at the third detection temperature; the approximate function 2-2 for approximating signal values dependent on the presence of the second target analyte at the second detection temperature; the approximate function 2-3 for approximating signal values dependent on the presence of the second target analyte at the third detection temperature; and the approximate function 3-3 for approximating signal values dependent on the presence of the group consisting of: the approximate function 1-1 for approximating signal values dependent on the
- a method for detecting each of the plurality of target analytes may be performed by the computer device 200 according to another embodiment of the present disclosure. After steps S1710 to S1720 are performed, the computer device 200 may detect each of the first target analyte to the third target analyte in the sample by using the joint-estimation result, and may be understood in the same or similar manner as in the above-described embodiments.
- Combinations of each block of the block diagram attached to the present invention and each step of the flowchart may be performed by computer program instructions. Since the computer program instructions may be installed in an encoding processor of a general purpose computer, a special purpose computer, or other programmable data processing device, the computer program instructions performed through the encoding processor of the computer or other programmable data processing device generate means for performing the functions described in each block of the block diagram or each step of the flowchart.
- the computer program instructions may be stored in a computer-usable or computer-readable memory that may direct a computer or other programmable data processing equipment to implement functions in a specific method
- the instructions stored in the computer-usable or computer-readable memory may produce manufacturing items including instruction means for performing the functions described in each block of the block diagram or each step of the flowchart.
- the computer program instructions may be mounted on a computer or other programmable data processing device, the instructions, which perform a series of operation steps on the computer or other programmable data processing device to generate a process executed by the computer, may provide steps for executing functions described in each block of the block diagram and each step of the flowchart.
- each block or each step may represent a module, a segment, or a portion of code including one or more executable instructions for executing the specified logical function(s).
- the functions mentioned in the blocks or steps may occur out of order.
- two blocks or steps shown in succession may in fact be carried out substantially simultaneously or the blocks or steps may sometimes be carried out in reverse order depending on the function to which they correspond.
Landscapes
- Health & Medical Sciences (AREA)
- Life Sciences & Earth Sciences (AREA)
- Engineering & Computer Science (AREA)
- Physics & Mathematics (AREA)
- Chemical & Material Sciences (AREA)
- General Health & Medical Sciences (AREA)
- Medical Informatics (AREA)
- Spectroscopy & Molecular Physics (AREA)
- Organic Chemistry (AREA)
- Biotechnology (AREA)
- Molecular Biology (AREA)
- Biophysics (AREA)
- Bioinformatics & Cheminformatics (AREA)
- Chemical Kinetics & Catalysis (AREA)
- Biochemistry (AREA)
- Zoology (AREA)
- Wood Science & Technology (AREA)
- Immunology (AREA)
- Proteomics, Peptides & Aminoacids (AREA)
- Analytical Chemistry (AREA)
- Software Systems (AREA)
- Data Mining & Analysis (AREA)
- Artificial Intelligence (AREA)
- Theoretical Computer Science (AREA)
- Signal Processing (AREA)
- Bioethics (AREA)
- Bioinformatics & Computational Biology (AREA)
- Computer Vision & Pattern Recognition (AREA)
- Public Health (AREA)
- Evolutionary Biology (AREA)
- Evolutionary Computation (AREA)
- Epidemiology (AREA)
- Databases & Information Systems (AREA)
- Microbiology (AREA)
- General Engineering & Computer Science (AREA)
- Genetics & Genomics (AREA)
- Nuclear Medicine, Radiotherapy & Molecular Imaging (AREA)
- General Physics & Mathematics (AREA)
- Pathology (AREA)
- Investigating Or Analyzing Materials Using Thermal Means (AREA)
Applications Claiming Priority (2)
| Application Number | Priority Date | Filing Date | Title |
|---|---|---|---|
| KR20220082751 | 2022-07-05 | ||
| PCT/KR2023/009459 WO2024010351A1 (ko) | 2022-07-05 | 2023-07-05 | 복수의 표적 분석물 각각에 대한 근사 신호의 획득 방법 및 이를 수행하는 컴퓨터 장치 |
Publications (1)
| Publication Number | Publication Date |
|---|---|
| EP4553489A1 true EP4553489A1 (de) | 2025-05-14 |
Family
ID=89453721
Family Applications (1)
| Application Number | Title | Priority Date | Filing Date |
|---|---|---|---|
| EP23835817.0A Pending EP4553489A1 (de) | 2022-07-05 | 2023-07-05 | Verfahren zur gewinnung eines annähernden signals für jeden von mehreren zielanalyten und computervorrichtung zur durchführung davon |
Country Status (4)
| Country | Link |
|---|---|
| US (1) | US20260004883A1 (de) |
| EP (1) | EP4553489A1 (de) |
| KR (1) | KR20250020611A (de) |
| WO (1) | WO2024010351A1 (de) |
Family Cites Families (19)
| Publication number | Priority date | Publication date | Assignee | Title |
|---|---|---|---|---|
| US4683195A (en) | 1986-01-30 | 1987-07-28 | Cetus Corporation | Process for amplifying, detecting, and/or-cloning nucleic acid sequences |
| US4683202A (en) | 1985-03-28 | 1987-07-28 | Cetus Corporation | Process for amplifying nucleic acid sequences |
| US4800159A (en) | 1986-02-07 | 1989-01-24 | Cetus Corporation | Process for amplifying, detecting, and/or cloning nucleic acid sequences |
| US5210015A (en) | 1990-08-06 | 1993-05-11 | Hoffman-La Roche Inc. | Homogeneous assay system using the nuclease activity of a nucleic acid polymerase |
| US5538848A (en) | 1994-11-16 | 1996-07-23 | Applied Biosystems Division, Perkin-Elmer Corp. | Method for detecting nucleic acid amplification using self-quenching fluorescence probe |
| US6117635A (en) | 1996-07-16 | 2000-09-12 | Intergen Company | Nucleic acid amplification oligonucleotides with molecular energy transfer labels and methods based thereon |
| US6194149B1 (en) | 1998-03-03 | 2001-02-27 | Third Wave Technologies, Inc. | Target-dependent reactions using structure-bridging oligonucleotides |
| US6977295B2 (en) | 1999-04-21 | 2005-12-20 | Invitrogen Corporation | Locked nucleic acid hybrids and methods of use |
| WO2000079009A2 (en) | 1999-06-22 | 2000-12-28 | Invitrogen Corporation | Improved primers and methods for the detection and discrimination of nucleic acids |
| EP1278889B1 (de) | 2000-03-29 | 2006-07-26 | LGC Limited | Hybridisierungsprobe und methode zum schnellen nachweis und zur schnellen unterscheidung von sequenzen |
| EP1647910A1 (de) * | 2004-09-29 | 2006-04-19 | Roche Diagnostics GmbH | Qualitative Bestimmung einer Probe mittels eines Algorithmus |
| JPWO2009093458A1 (ja) * | 2008-01-22 | 2011-05-26 | パナソニック株式会社 | 微粒子測定装置および微粒子測定方法 |
| WO2010030686A1 (en) | 2008-09-09 | 2010-03-18 | Bio-Rad Laboratories, Inc. | Multi-stage, regression-based pcr analysis system |
| US9447457B2 (en) | 2009-09-24 | 2016-09-20 | Seegene, Inc. | Detection of target nucleic acid sequences by cyclic exonucleolytic reactions |
| MX352460B (es) | 2011-01-11 | 2017-11-24 | Seegene Inc | Detección de secuencias de ácido nucleico objetivo mediante ensayo de escisión y extensión del pto. |
| KR20130101952A (ko) | 2012-02-02 | 2013-09-16 | 주식회사 씨젠 | Pto 절단과 연장-의존적 혼성화를 이용한 타겟 핵산서열의 검출 |
| WO2015147370A1 (en) | 2014-03-28 | 2015-10-01 | Seegene, Inc. | Detection of target nucleic acid sequences using different detection temperatures |
| CN108351918B (zh) * | 2015-11-20 | 2021-09-17 | Seegene株式会社 | 对目标分析物的数据集的校准方法 |
| WO2017171469A1 (en) * | 2016-04-01 | 2017-10-05 | Seegene, Inc. . | Detection of abnormal signal using two or more datasets |
-
2023
- 2023-07-05 EP EP23835817.0A patent/EP4553489A1/de active Pending
- 2023-07-05 WO PCT/KR2023/009459 patent/WO2024010351A1/ko not_active Ceased
- 2023-07-05 KR KR1020257000245A patent/KR20250020611A/ko active Pending
- 2023-07-05 US US18/881,046 patent/US20260004883A1/en active Pending
Also Published As
| Publication number | Publication date |
|---|---|
| US20260004883A1 (en) | 2026-01-01 |
| KR20250020611A (ko) | 2025-02-11 |
| WO2024010351A1 (ko) | 2024-01-11 |
Similar Documents
| Publication | Publication Date | Title |
|---|---|---|
| US7668663B2 (en) | Levenberg-Marquardt outlier spike removal method | |
| US20190095576A1 (en) | Universal method to determine real-time pcr cycle threshold values | |
| EP2120154B1 (de) | Systeme und Verfahren zum Entfernen der Diskontinuität in Echtzeit-PCR-Fluoreszenzdaten | |
| JP6602374B2 (ja) | 試料の分析方法 | |
| CN108351918B (zh) | 对目标分析物的数据集的校准方法 | |
| KR102326604B1 (ko) | 신호 변화량 데이터 세트를 이용한 샘플 내 타겟 분석물질 검출 방법 | |
| KR102300738B1 (ko) | 타겟 분석물질에 대한 데이터 세트의 노이즈 수준 감축 방법 | |
| KR102165931B1 (ko) | 타겟 분석물질의 존재 또는 부존재를 결정하기 위한 다중 데이터 세트 분석법 | |
| US7844403B2 (en) | Temperature step correction with double sigmoid Levenberg-Marquardt and robust linear regression | |
| US20240404639A1 (en) | Method and device for analyzing a dataset | |
| KR102165933B1 (ko) | 둘 이상의 데이터 세트를 이용한 비정상적인 시그널의 검출 | |
| EP3895170B1 (de) | Verfahren zum nachweis eines zielanalyten in einer probe unter verwendung einer s-förmigen funktion für einen anstiegsdatensatz | |
| EP4553489A1 (de) | Verfahren zur gewinnung eines annähernden signals für jeden von mehreren zielanalyten und computervorrichtung zur durchführung davon | |
| KR102110999B1 (ko) | 타겟 핵산 서열에 대한 시그널을 제공하는 방법 | |
| US20180011967A1 (en) | Method for real-time quantification of nucleic acid | |
| US20240418649A1 (en) | Device and method for reading positive/negative with respect to target assay substance in sample | |
| US20250322914A1 (en) | Device and method for displaying performance comparison result with respect to fluorescence data analysis algorithm | |
| US20250336479A1 (en) | Apparatus and method for providing interface for setting threshold value of parameter | |
| EP4607520A1 (de) | Verfahren zur anleitung mehrerer detaillierter leistungsexperimente zur entwicklung eines reagens zur detektion eines zielnukleinsäuremoleküls und organisieren von experimentergebnis-aufzeichnungsblättern | |
| US20250037799A1 (en) | Device and method for providing interface for setting parameters | |
| KR20240148407A (ko) | 타겟 존부 판독용 단말 및 이에서 수행되는 타겟 존부 판독 방법, 갱신 정보를 배포하는 서버 및 이에서 수행되는 갱신 정보의 배포 방법 |
Legal Events
| Date | Code | Title | Description |
|---|---|---|---|
| STAA | Information on the status of an ep patent application or granted ep patent |
Free format text: STATUS: THE INTERNATIONAL PUBLICATION HAS BEEN MADE |
|
| PUAI | Public reference made under article 153(3) epc to a published international application that has entered the european phase |
Free format text: ORIGINAL CODE: 0009012 |
|
| STAA | Information on the status of an ep patent application or granted ep patent |
Free format text: STATUS: REQUEST FOR EXAMINATION WAS MADE |
|
| 17P | Request for examination filed |
Effective date: 20250109 |
|
| AK | Designated contracting states |
Kind code of ref document: A1 Designated state(s): AL AT BE BG CH CY CZ DE DK EE ES FI FR GB GR HR HU IE IS IT LI LT LU LV MC ME MK MT NL NO PL PT RO RS SE SI SK SM TR |
|
| DAV | Request for validation of the european patent (deleted) | ||
| DAX | Request for extension of the european patent (deleted) |