EP4575424A1 - Procédé de pesage d'un article - Google Patents
Procédé de pesage d'un article Download PDFInfo
- Publication number
- EP4575424A1 EP4575424A1 EP23220067.5A EP23220067A EP4575424A1 EP 4575424 A1 EP4575424 A1 EP 4575424A1 EP 23220067 A EP23220067 A EP 23220067A EP 4575424 A1 EP4575424 A1 EP 4575424A1
- Authority
- EP
- European Patent Office
- Prior art keywords
- disturbance
- weighing
- signal analysis
- type
- signal
- Prior art date
- Legal status (The legal status is an assumption and is not a legal conclusion. Google has not performed a legal analysis and makes no representation as to the accuracy of the status listed.)
- Pending
Links
Images



Classifications
-
- G—PHYSICS
- G01—MEASURING; TESTING
- G01G—WEIGHING
- G01G23/00—Auxiliary devices for weighing apparatus
- G01G23/06—Means for damping oscillations, e.g. of weigh beams
- G01G23/10—Means for damping oscillations, e.g. of weigh beams by electric or magnetic means
-
- G—PHYSICS
- G01—MEASURING; TESTING
- G01G—WEIGHING
- G01G19/00—Weighing apparatus or methods adapted for special purposes not provided for in the preceding groups
- G01G19/387—Weighing apparatus or methods adapted for special purposes not provided for in the preceding groups for combinatorial weighing, i.e. selecting a combination of articles whose total weight or number is closest to a desired value
- G01G19/393—Weighing apparatus or methods adapted for special purposes not provided for in the preceding groups for combinatorial weighing, i.e. selecting a combination of articles whose total weight or number is closest to a desired value using two or more weighing units
-
- G—PHYSICS
- G01—MEASURING; TESTING
- G01G—WEIGHING
- G01G23/00—Auxiliary devices for weighing apparatus
- G01G23/01—Testing or calibrating of weighing apparatus
-
- G—PHYSICS
- G01—MEASURING; TESTING
- G01G—WEIGHING
- G01G23/00—Auxiliary devices for weighing apparatus
- G01G23/18—Indicating devices, e.g. for remote indication; Recording devices; Scales, e.g. graduated
- G01G23/36—Indicating the weight by electrical means, e.g. using photoelectric cells
- G01G23/37—Indicating the weight by electrical means, e.g. using photoelectric cells involving digital counting
Definitions
- the invention is related to a method of weighing an item, wherein weighing data comprising a plurality of single weight measurement signals measured for the item at different measurement times are provided via the weighing process which might be subject to disturbance from environmental and/or weighing internal conditions, and wherein the weighing data are analyzed by performing a signal analysis to detect the presence of a disturbance.
- EP 3 926 309 A1 discloses a signal analysis of weight values performed by artificial neuronal network to provide estimated values in less time as when one would wait for issuance of the final weight signal, such that even under disturbances reliable estimated values are available for combination weighing.
- the analysis comprises Fourier analysis and the filtering of disturbance-frequencies.
- EP 0 622 617 A1 discloses a weighing machine being a combinational weighing machine having scale cells and a plurality of dummy cells and comprising filters to remove high-frequency vibration components and floor vibration correcting means to calculate a weight value of an object via a modification of the weight component modified by a vibration component.
- This object is, in terms of a method, solved by a further development of a method according to the initially introduced kind, which is essentially characterized in that the weighing data are analyzed by performing a further second signal analysis different from said signal analysis, said signal analysis being a first signal analysis representative of a first type of disturbance, the second signal analysis being to detect a second type of disturbance different from the first type of disturbance, thereby allowing identification of not only presence but also type of disturbance within a classification comprising at least two different types of disturbance.
- a user is enabled to set up operable working conditions in an easier and more rapid way, since the user is not required to seek for the origin of f.i. repeatedly signalled disturbances, such as f.i. performing extensive search for identifying possible vibration or shock disturbances when the true reason for non-reliable weight results come from f.i. turbulent air flow.
- the same may apply for signal control via first analysis to control vibrations resulting from weight change, while the classification according to the invention may indicate disturbance on a lower level caused by electrostatic influence of the weighing cell.
- the inventive method can be applied to all kind of weighing cells and weighing systems.
- the advantages are in particular beneficial for high precision weight measurement with weighing cells having an accuracy of at least 10 mg, further preferred at least 1 mg, in particular at least 0.1 mg.
- the invention may also be beneficial for other weighing such as weighing during transport (check weigher), or combination weighing including a group of balances, in particular a larger group of balances.
- the process applies to a single balance system.
- a measurement value indicative for the weigh of the item is derived from the weighing data and an instability indicator is determined and in particular displayed to a user, indicating whether one or more of the detected disturbance indicates a reliability of the derived weight measurement value being lower than a pre-set reliability.
- the indicator could be displayed or otherwise indicated to a user, f.i. via a symbol displayed in screen, an alarm or else.
- the indicator is triggered, also start of an automated procedure leading to a repetition of measurement or sorting out of faulty measured item can be provided.
- a type indicator is determined and in particular displayed to a user, indicating the type of disturbance of one or more of the detected disturbances.
- Said further indicator can comprise a subset of sub-indicator selectable in dependency of the result of the first and/or second signal analysis.
- one or more sub-indicators may be displayed on a display of a balance, a monitor of a separate surveillance station for the balance, including graphical user interfaces, exemplarily in a pre-defined window on the screen. This window could also appear in the foreground at the moment that there is triggering of said further indicator.
- a user is enabled to check for the physical origin of the identified disturbance by said classification and indicator without time delay. Even if the weighing results are still considered sufficiently stable, a user/weighing device operator is informed of f.i. laboratory environment influences or that his weighing setting practice can give suboptimal performance.
- the weighing process may signalize also a classification hint in terms of two or more sub-indicators out of a group of sub-indicators with a maximum number larger than the number of indicated sub-indicators.
- the function of the further indicator can also be that of excluding a specific type of disturbance.
- each of said different type of disturbances may include subclasses of disturbance origins, said types still being different from each other f.i. regarding the level of magnitude of disturbance or periodic nature of disturbance versus aperiodic nature of disturbance, such as vibration versus air flow turbulence.
- the second signal analysis comprises a transformation of the weighing data, in particular after pre-data treatment, into a two-dimensional representation comprising both information in time domain and its complementary domain. This provides benefit for detection of aperiodic disturbance, such as turbulent air flow. The remaining information regarding time domain in the two-dimensional representation enriches the signal evaluation possibilities beyond having frequency-only based representations.
- wavelet analysis is performed for the second signal analysis.
- the mother wavelet may belong to some predefined set of wavelet functions, such as Morlet, DOG or other, and could also be user-defined or learned from other processes to match known existing disturbance profiles. Regarding predefined set of functions, most preferred is the DOG mother wavelet.
- Pre-data treatment may include to make the original weighing data, that is a number of single measurement values w i mean-free and normalized by standard deviation.
- the signal analysis may start upon automatic triggering or user-triggered, f.i. once a buffer provided for the weight values is full.
- the results of the wavelet analysis can be grouped in vectors O, where j indexes the complementary domain, said vector containing all values of c j,k of the two-dimensional representation, the index k being indicative for the time domain.
- the relevant set of indexes can be smaller than the overall set used for wavelet analysis due to boundary effects.
- the invention provides additionally and independently protection-worthy also a method of weighing an item, wherein weighing data comprising a plurality of single weight measurement signals measured for the item at different measurement times are provided via the weighing process which might be subject to disturbance from environmental and/or weighing internal conditions, and wherein the weighing data are analyzed by performing a signal analysis to detect the presence of a disturbance, said signal analysis comprising a transformation of the weighing data, in particular after pre-data treatment, into a two-dimensional representation comprising both information in time domain and its complementary domain, and said signal analysis being in particular for detecting a type of disturbance related to air turbulence or electrostatic error and/or used for a check of presence of deviations from reference (baseline) values to provide for an in particular quantifiable deviation of working conditions.
- the second signal analysis comprises establishing a set of signal statistic values derived from said two-dimensional representation.
- the signal statistics may comprise maximum statistics, higher order statistics and/or correlation statistics.
- higher order statistics determination of Kurtosis is preferred.
- Higher order statistics may also be limited to only determination of Kurtosis. In one preferred and simple way, only maximum statistics might be considered. In another preferred embodiment, only maximum statistics and higher order statistics are considered. On the other hand, even more complicated statistics may be taken into account and/or a combination of different statistic evaluations.
- the establishing comprises determination of a maximum over values in the time domain attributed to a respective index in the complementary domain for a group of, preferably the majority of, in particular all the indices in the complementary domain.
- said maximum statistics might be implemented in a simple manner by just using all available values of the relevant set of indexes (after consideration of boundary effects), both in time and complementary (frequency) domain.
- indices can be considered, such selection simplifying the evaluation in terms of calculation effort.
- selection may omit values either by rougher scaling, otherwise via specific omissions due to known reference values of signal portions less important for evaluation.
- the establishing further comprising for a group of, preferably the majority of, in particular all the indices in the complementary domain the forming of statistical moments and in particular their ratio of respectively equal order, and/or correlation statistics involving such statistical moments for at least two indices in the complementary domain being in particular neighbored to each other.
- the detection of the second type of disturbance involves comparing the set of signal statistic values, in particular having substracted a set of base line values, with a set of predetermined threshold values.
- the base line values can be formed by characteristic weight signal stored at a previous time interval, they can also be preset, f.i. triple of standard deviation for maxima, three for Kurtosis and zero for correlation. Again, comparison with threshold values can be done for a group, the majority or all index values in the complementary domain.
- the predetermined threshold values can be used within a decision tree, leading to a characterisation of the type of disturbance. For instance, turbulence can be detected when one, two or all comparisons for maximum statistics, higher order statistics and correlation statistics are above the threshold.
- the threshold values may be set via calibration under condition of known preset turbulence of environmental influence. One may have a plurality of thresholds attributed to calibration information from experimental calibration for different known applied disturbances, theoretical simulations and/or data sets reflecting experience values.
- the check for turbulence is subsequent to a check for mechanical disturbance and/or a check for vibration.
- a quantification information of disturbance of second type is done by having two sets of thresholds and hysteresic thresholding with attributed scaling coefficient and time length.
- the method comprises a correlation evaluation of the results of second detection with the instability indicator.
- Such correlation evaluation of second analysis and instability indicator allows determination of still valid measurement results although there is indication of (mild) disturbance, when the quantified disturbance is not significant enough to render the measurement values invalid. Nonetheless, useful information is given to the user for optimizing the weighing system settings and/or weighing process. This can be done by identifying sources of disturbance and their reduction/elimination, or by modifying settings of the balance as thresholds of the algorithms, draft, etc.
- the classification comprises at least one of shock, weight-change and vibration, and at least one of air turbulence and electrostatic error.
- Shock, weight-change and vibration are typical examples of disturbance on a rather high level, which, once identified, could also be countered in terms of modification of the weight signal by superposition of a compensation signal as known in the art.
- Air turbulence and electrostatic error are rather considered on a lower level of magnitude and aperiodic, and can notwithstanding lower influence be considered detrimental, respectively a user may adapt the weighing settings/weighing environmental conditions.
- the method involves pre-definition or change of parameters of the second signal analysis and/or detection algorithm of second detection by user input, from learned data and/or from history data from the actually used weighing means and/or from similar earlier measurements of other weighing units.
- the method involves setting a set of in particular figurative icons attributed to a set of types of disturbance, in particular sub-types of disturbance, in particular determined involving a decision tree, and displaying the icon on a graphical user interface in dependency of the outcome of the detection via the first and/or second signal analysis. This enhances user-friendly handability of the weighing system when disturbances are identified and classified.
- the invention provides also a computer program product to perform said method, and in terms of device a weighing means capable to and being controlled to perform a mode of operation, such a method.
- the (digital) signal processing may be carried out on an embedded platform running on a microchip of weighing control, in particular at the weighing unit.
- a balance 1 is shown in a schematical manner.
- the balance 1 has a load platform 2 and a sensor (load cell) 3 detecting the load of mass m of an item 0 when the item 0 is placed on platform 2.
- a control (not shown in Fig. 1 ) is provided with software function to calculate, from weight signals received from sensor 3, a weight measurement value as result of the weighing process for item 0. Said result can be displayed on a display, respectively user interface 4 of the balance 1.
- Fig. 1 there might be environmental disturbance during weighing, which may arise from shock or vibrations, load change, but also lower order disturbance as air turbulence or even electrostatic disturbance.
- the balance can be a laboratory scale, and may have a weighing accuracy of at least 1 mg, while it may also be a scale without additional windshield used to minimize influence by air of the environment.
- the control may collect/sample discretized weight signal w at regular time intervals (of course, the invention is not limited to have equidistant weight signal values in time).
- weight values might be pre-processed and stored in a buffer of the control. All this can be done as usually in the prior art, and also the calculation of a weight value to be given out at the display or any other receiving unit for the final weighing result can be done according to the usual evaluation techniques to arrive at the weighing result of the weighing process.
- further signal evaluation is done to determine whether there can be, additionally to possible disturbances in terms of vibration or shock, a disturbance of f.i. turbulent air flow.
- Pre-processing may include additional steps as applying filter, decimation and/or creating a function of the values, as f.i. the square root w . For instance, decimation can be done such that the analyzed signal has M so that all the values can be accommodated in the provided memory, f.i. 500 or more.
- the normalized and mean-free signal can be decomposed into a set of basis functions or frames, arriving a two-dimensional representation of the signal containing both information in the time domain and its complementary (frequency) domain.
- Such representation could be a Window-Fourier representation or, preferably, obtained by wavelet analysis.
- J may be larger than 16 and lower than 128.
- J can be 64.
- mother wavelet ⁇ can be used a suitably defined wavelet, preferred embodiments could include the Morlet wavelet or the DOG-wavelet, in particular DOG-wavelet is preferred.
- a user-defined wavelet can be used in dependency of learned existing disturbance profiles, to match them suitably.
- ⁇ e i, ⁇ j,k > ⁇ (2 j i-k)
- e i being a basis vector having 1 (one) at position i and zero otherwise.
- the coefficients c j,k the relevant set of indexes may be smaller due to boundary effects.
- ⁇ j is defined as a set comprising coefficients c j,k for k element of ⁇ j and may form for the respective relevant index j a coefficient vector C j .
- maximum statistics it is, of course, possible to calculate maximum statistics not for all frequency scales j, but for a pre-defined set thereof, which may, however, preferably include the majority of the frequency scales.
- At least one higher order statistical moment s j m ⁇ j m / ⁇ j m can be calculated where ⁇ j m is the estimate value E [(C j ) m) ], while ⁇ j m is ⁇ square root (E[(C j - ⁇ j ) 2 ]) ⁇ m .
- m is set to 4, and one determines for predefined set of frequency scales j, in particular for the majority thereof, even for all frequency scales j, as s j 4 is adapted to signal heavier tails in the respective distribution coming from turbulent flow by its intermittent nature.
- the metric s j max can signal large outlines, another property of turbulent flow.
- correlation s j corr ( E [ (C j - ⁇ j 1 )(C j +1 - ⁇ j+1 ) ] / ⁇ j 2 ⁇ j+1 2 ).
- pattern recognition is effected on the basis of a two-dimensional representation to achieve spectral information resolved in also the time domain.
- only maximum statistics s j max is performed, in another embodiment, additional higher order statistics is included, preferably by including at least Kurtosis.
- additional higher order statistics is included, preferably by including at least Kurtosis.
- said correlation statistics s j corr can be added.
- base line values can be calculated, either from characteristic weight signal stored at a previous time point, representing f.i. normal device operation for the weighing device. Otherwise, for base line values one can also use pre-set values, f.i. the triple of standard deviation for maxima, three for and zero for correlation. Subsequently, base line values are indicated by ⁇ j max , ⁇ j m , ⁇ j corr .
- differences ⁇ s j are performed for each of desired s j max , s j corr , s j m , by substracting the baseline values ⁇ j max , ⁇ j m , ⁇ j corr and these differences ⁇ s j are compared with respective threshold values (d j max , respectively d j m , d j corr).
- a decision tree is set up, which may include the decision that turbulence is deemed to be detected when ⁇ s j is above threshold d j max for a selected subset of frequency scales j, in particular the majority, in particular all frequency indices j.
- the decision tree can include checks for ⁇ s corr above d corr (leading frequency scale index j apart), respectively ⁇ s being above d m .
- threshold values are selected such that being below threshold should no more influence stability of the weighing result, one can still use two sets of threshold values and a coefficient for hysteresic thresholding r and time length ⁇ , to perform hysteresis thresholding by means of f.i. Canny algorithm or similar.
- the invention also provides a monitoring of the functional state of weighing means on the basis of the second signal analysis repeatedly performed for a plurality of weighing processes.
- a graphical user interface may have an area in the display, in Fig. 2 on the left side next to the indication of a weighing result.
- This area comprises first and second subareas.
- an icon here a circle, for indicating instable weight results.
- a further icon or more icons may be indicated, representative for the possible cause of disturbance.
- the result of the weighing is instable due to a draft disturbance.
- the item might be appropriately selected to represent either origin or type of disturbance or both.
- the user is alarmed of the presence of air turbulence through the graphical user interface (GUI) through set indicators on the screen.
- GUI graphical user interface
- the turbulence detection indicator can be presented together with the balance instability indicator. Since disturbance detection indicator is, in this example, paired to the logic of the stability indicator, one can avoid showing presence of mild turbulent distance when the device is still delivering stable measurement and thereby also avoid a constant flickering of turbulence detection.
- Those signal analysis detection and their results can be enriched for further sensitivity and specificity of the classification by use of other sensors such as a flow sensor (e.g. an anemometer or a tube) and/or a temperature sensor.
- a flow sensor e.g. an anemometer or a tube
- a temperature sensor e.g. a thermosensor
- Fig. 2 Not shown in Fig. 2 are input options, f.i. via touchscreen of the GUI, for the user to give the balance, about recording signals f.i. at calm environment or by environment affected by disturbance, such that within the algorithms, elements of pattern recognition, such as base line and thresholds and the spectral transform basis can be learned from the environment.
- elements of pattern recognition such as base line and thresholds and the spectral transform basis can be learned from the environment.
- an operator or a user or a developer can change some basic algorithmic parameter, such as thresholds for detection.
- first signal analysis in particular meant to identify vibration or signal disturbances as weight-change or short time-shocks can use, f.i. Fourier analysis and its further evaluations such as cepstrum or other quantities derivable from the Fourier harmonics via linear or non-linear transforms. These are, as such, well known and not reported in more detail here. Thereby, a filtering operation can be included to cut irregular frequencies respectively to get rid of noise. On the other hand, also here wavelet decomposition can be used, f.i. to detect loss of continuity in higher harmonics.
- the first two metrics can even be updated online.
- Further ways of detecting turbulence might include Kalman filter and MUSIC-algorithms. While these might be harder to threshold, this still may allow an indication of disturbance frequency, and, in case of Kalman filter, even other parameters of the disturbance.
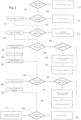
- FIG. 3 An example of a decision tree which can be used to classify different types of disturbances including turbulence such as air turbulence is shown in Fig. 3 .
- decision steps are denoted as D1, D2, ...
- classification steps are denoted as C1, C2, ...
- steps such as computing steps or other steps of action are denoted by S1, S2, ...
- One decision step is D1 checking whether there was recently a weight change. Whether at a given time there has recently been a weight change can be, for instance, checked by information from an overall control means controlling the weighing process. When there has been a recent weight change, the resulting signal fluctuations can easily be attributed and classified as weight change (step C1).
- step D2 one may already be able to decide whether there was a recent mechanical disturbance (step D2), for instance by an optional additional sensor such as f.i. an acceleration sensor. If the presence of such a mechanical disturbance can be checked already on external level without looking at the weight signal, one can already classify a mechanical disturbance (step C2).
- an optional additional sensor such as f.i. an acceleration sensor. If the presence of such a mechanical disturbance can be checked already on external level without looking at the weight signal, one can already classify a mechanical disturbance (step C2).
- step S1 a minimum-maximum statistics is computed based on the weight signal data which can, for instance, be just the single weight sampling data, and in step D3, said min-max statistics can be compared with a predetermined threshold but, if it is too high, one may classify as mechanical disturbance (step C3), in accordance with category B above.
- the cepstrum obtained from the weight data can be computed by any suitable way, for instance also by Fourier harmonics (step S2), and a classification as vibration (step C4), as category C above, can occur when in decision step D4 it is found that the cepstrum is above a respective predefined threshold.
- Said threshold might be decreased (step S3) in dependency of whether the threshold is at a default value (step D5), and one may set a default threshold for vibration in step S4.
- the decision tree gives the possibility for classification on a level of disturbance of mechanical disturbance as a shock and vibration, but is not only capable to indicate the disturbance as such, but also to indicate the origin of the disturbance on this level.
- the decision tree has a further decision step D6 to decide whether turbulence such as air turbulence can be the origin of disturbance and to classify the disturbance as turbulence (step C5), as category D above.
- wavelet transform is performed (step S5) based on the weighing data obtained from the weighing device, to obtain a transformation of the weighing data in a two-dimensional representation (time and frequency).
- step S6 From the wavelet transform obtained in step S5, statistics is derived in step S6, such as those described in detail above, giving information about maximum statistics, higher order statistics or even correlation statistics, for instance maximum absolute value can be computed and flatness can be computed.
- step D6 these statistics are compared to given thresholds, as also explained in detail above.
- the threshold for turbulence can also be decreased (step S7) in dependency of a comparison whether the threshold is at default value (step D7) and default threshold can be set in step S8.
- step S9 standard deviation can be computed (step S9), based on the wavelet transformation data.
- the weighing process can be classified as "calm" (step C6), that is without indication of disturbance or positively as disturbance-free, corresponding to category A above.
- control may classify as "other" than A, B, C, D - type of disturbance. This can give the user an indication to check for possible electrostatic disturbances.
- the user does not obtain an information only about the presence of a disturbance but, by means of the type-indicator or even sub-indicator derived via the classification steps also an information about the origin of disturbance.
- step S5 can be performed at an earlier stage, and for instance the computing steps S1 and S2 could be computing steps on the basis of the wavelet data.
- other two-dimensional representations can be used, such as windows Fourier, although wavelet transform is preferred.
- exemplary wavelet statistics data is displayed in the two-dimension frequency and time domain, during upsurge of turbulence.
- the maximum of the absolute value of the wavelets is displayed on the other two axes.
- the time of the signal recorded by the weighing device (balance) in seconds between 0 and 300 seconds, and the logarithm (log 10 ) of the period T of the wavelet related to the wavelet number.
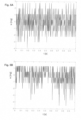
- the balance raw signal in the time interval between 10 s and 11 s leading to the wavelet statistics in Fig. 4 is shown in Fig. 5A
- the underlying balance raw signal in the interval from 100 s and 101 s of Fig. 3 is shown in Fig. 5B .
Landscapes
- Physics & Mathematics (AREA)
- General Physics & Mathematics (AREA)
- Measurement Of Mechanical Vibrations Or Ultrasonic Waves (AREA)
Priority Applications (3)
| Application Number | Priority Date | Filing Date | Title |
|---|---|---|---|
| EP23220067.5A EP4575424A1 (fr) | 2023-12-22 | 2023-12-22 | Procédé de pesage d'un article |
| US18/956,226 US20250207968A1 (en) | 2023-12-22 | 2024-11-22 | Method of weighing an item |
| CN202411890344.4A CN120194799A (zh) | 2023-12-22 | 2024-12-20 | 称重物品的方法 |
Applications Claiming Priority (1)
| Application Number | Priority Date | Filing Date | Title |
|---|---|---|---|
| EP23220067.5A EP4575424A1 (fr) | 2023-12-22 | 2023-12-22 | Procédé de pesage d'un article |
Publications (1)
| Publication Number | Publication Date |
|---|---|
| EP4575424A1 true EP4575424A1 (fr) | 2025-06-25 |
Family
ID=89430366
Family Applications (1)
| Application Number | Title | Priority Date | Filing Date |
|---|---|---|---|
| EP23220067.5A Pending EP4575424A1 (fr) | 2023-12-22 | 2023-12-22 | Procédé de pesage d'un article |
Country Status (3)
| Country | Link |
|---|---|
| US (1) | US20250207968A1 (fr) |
| EP (1) | EP4575424A1 (fr) |
| CN (1) | CN120194799A (fr) |
Citations (3)
| Publication number | Priority date | Publication date | Assignee | Title |
|---|---|---|---|---|
| EP0622617A1 (fr) | 1993-04-30 | 1994-11-02 | ISHIDA CO., Ltd. | Dispositif de pesage |
| US6907128B2 (en) * | 2002-05-17 | 2005-06-14 | Ishida Co., Ltd. | Noise canceling apparatus for weight measurement, and noise canceling method for weight measurement |
| EP3926309A1 (fr) | 2020-06-19 | 2021-12-22 | MULTIPOND Wägetechnik GmbH | Procédé de traitement du signal pour peseuses multi-têtes |
-
2023
- 2023-12-22 EP EP23220067.5A patent/EP4575424A1/fr active Pending
-
2024
- 2024-11-22 US US18/956,226 patent/US20250207968A1/en active Pending
- 2024-12-20 CN CN202411890344.4A patent/CN120194799A/zh active Pending
Patent Citations (3)
| Publication number | Priority date | Publication date | Assignee | Title |
|---|---|---|---|---|
| EP0622617A1 (fr) | 1993-04-30 | 1994-11-02 | ISHIDA CO., Ltd. | Dispositif de pesage |
| US6907128B2 (en) * | 2002-05-17 | 2005-06-14 | Ishida Co., Ltd. | Noise canceling apparatus for weight measurement, and noise canceling method for weight measurement |
| EP3926309A1 (fr) | 2020-06-19 | 2021-12-22 | MULTIPOND Wägetechnik GmbH | Procédé de traitement du signal pour peseuses multi-têtes |
Also Published As
| Publication number | Publication date |
|---|---|
| CN120194799A (zh) | 2025-06-24 |
| US20250207968A1 (en) | 2025-06-26 |
Similar Documents
| Publication | Publication Date | Title |
|---|---|---|
| US12007270B2 (en) | Status detection method and apparatus for load cell | |
| US10809153B2 (en) | Detecting apparatus, detection method, and program | |
| US10133703B2 (en) | Anomaly detection method, program, and system | |
| US20200104224A1 (en) | Anomaly detection device, anomaly detection method and storage medium | |
| US8650137B2 (en) | Method and apparatus for creating state estimation models in machine condition monitoring | |
| CN109186813A (zh) | 一种温度传感器自检装置及方法 | |
| CN116337135B (zh) | 一种仪表故障诊断方法、系统、电子设备及可读存储介质 | |
| US11698323B2 (en) | Methods and system for determining a control load using statistical analysis | |
| EP4575424A1 (fr) | Procédé de pesage d'un article | |
| US7366639B2 (en) | Methods for establishing alerts and/or alert limits for monitoring mechanical devices | |
| CN120317327B (zh) | 一种基于应力波信号的裂纹扩展定量检测的增量学习方法 | |
| JP6394787B2 (ja) | 製品検査装置、製品検査方法及びコンピュータプログラム | |
| CN113985040A (zh) | 一种实验室检测设备精度控制的控制方法及装置 | |
| CN112906765A (zh) | 一种基于rbf神经网络的客户洗钱风险等级划分方法及系统 | |
| CN118470877A (zh) | 一种基于多源传感感知的电缆通道防侵入预警方法及装置 | |
| CN116176860A (zh) | 一种燃油系统测试方法、系统、设备及可读存储介质 | |
| CN118561118B (zh) | 一种电梯运行状态判定方法、系统、介质及电子设备 | |
| CN120171351B (zh) | 一种车辆充电站异常检测方法、装置、设备及介质 | |
| CN113030558B (zh) | 一种识别数据异常的方法、装置、设备及可读存储介质 | |
| CN120994494B (zh) | 一种融合指标调整的企业运营数据预警方法及系统 | |
| CN120492905B (zh) | 称重传感器故障时间预测方法、装置、设备及存储介质 | |
| CN119221789B (zh) | 一种尾门驱动状态的控制方法及装置 | |
| CN116569121B (zh) | 异常诊断系统和异常诊断方法 | |
| US20230281453A1 (en) | Creating method of classification model about hard disk efficiency problem, analyzing method of hard disk efficiency problem and classification model creating system of hard disk efficiency problem | |
| CN121596927A (zh) | 一种基于多传感器融合的转台在线颤振控制方法 |
Legal Events
| Date | Code | Title | Description |
|---|---|---|---|
| PUAI | Public reference made under article 153(3) epc to a published international application that has entered the european phase |
Free format text: ORIGINAL CODE: 0009012 |
|
| STAA | Information on the status of an ep patent application or granted ep patent |
Free format text: STATUS: THE APPLICATION HAS BEEN PUBLISHED |
|
| AK | Designated contracting states |
Kind code of ref document: A1 Designated state(s): AL AT BE BG CH CY CZ DE DK EE ES FI FR GB GR HR HU IE IS IT LI LT LU LV MC ME MK MT NL NO PL PT RO RS SE SI SK SM TR |
|
| STAA | Information on the status of an ep patent application or granted ep patent |
Free format text: STATUS: REQUEST FOR EXAMINATION WAS MADE |
|
| 17P | Request for examination filed |
Effective date: 20251217 |