ES2746121T3 - Method, apparatus and software for the identification of responders in a clinical setting - Google Patents
Method, apparatus and software for the identification of responders in a clinical setting Download PDFInfo
- Publication number
- ES2746121T3 ES2746121T3 ES06815414T ES06815414T ES2746121T3 ES 2746121 T3 ES2746121 T3 ES 2746121T3 ES 06815414 T ES06815414 T ES 06815414T ES 06815414 T ES06815414 T ES 06815414T ES 2746121 T3 ES2746121 T3 ES 2746121T3
- Authority
- ES
- Spain
- Prior art keywords
- treatment
- measurements
- period
- patient
- patients
- Prior art date
- Legal status (The legal status is an assumption and is not a legal conclusion. Google has not performed a legal analysis and makes no representation as to the accuracy of the status listed.)
- Active
Links
Classifications
-
- G—PHYSICS
- G16—INFORMATION AND COMMUNICATION TECHNOLOGY [ICT] SPECIALLY ADAPTED FOR SPECIFIC APPLICATION FIELDS
- G16H—HEALTHCARE INFORMATICS, i.e. INFORMATION AND COMMUNICATION TECHNOLOGY [ICT] SPECIALLY ADAPTED FOR THE HANDLING OR PROCESSING OF MEDICAL OR HEALTHCARE DATA
- G16H10/00—ICT specially adapted for the handling or processing of patient-related medical or healthcare data
- G16H10/20—ICT specially adapted for the handling or processing of patient-related medical or healthcare data for electronic clinical trials or questionnaires
-
- G—PHYSICS
- G16—INFORMATION AND COMMUNICATION TECHNOLOGY [ICT] SPECIALLY ADAPTED FOR SPECIFIC APPLICATION FIELDS
- G16H—HEALTHCARE INFORMATICS, i.e. INFORMATION AND COMMUNICATION TECHNOLOGY [ICT] SPECIALLY ADAPTED FOR THE HANDLING OR PROCESSING OF MEDICAL OR HEALTHCARE DATA
- G16H10/00—ICT specially adapted for the handling or processing of patient-related medical or healthcare data
- G16H10/60—ICT specially adapted for the handling or processing of patient-related medical or healthcare data for patient-specific data, e.g. for electronic patient records
-
- G—PHYSICS
- G16—INFORMATION AND COMMUNICATION TECHNOLOGY [ICT] SPECIALLY ADAPTED FOR SPECIFIC APPLICATION FIELDS
- G16H—HEALTHCARE INFORMATICS, i.e. INFORMATION AND COMMUNICATION TECHNOLOGY [ICT] SPECIALLY ADAPTED FOR THE HANDLING OR PROCESSING OF MEDICAL OR HEALTHCARE DATA
- G16H20/00—ICT specially adapted for therapies or health-improving plans, e.g. for handling prescriptions, for steering therapy or for monitoring patient compliance
-
- G—PHYSICS
- G16—INFORMATION AND COMMUNICATION TECHNOLOGY [ICT] SPECIALLY ADAPTED FOR SPECIFIC APPLICATION FIELDS
- G16H—HEALTHCARE INFORMATICS, i.e. INFORMATION AND COMMUNICATION TECHNOLOGY [ICT] SPECIALLY ADAPTED FOR THE HANDLING OR PROCESSING OF MEDICAL OR HEALTHCARE DATA
- G16H50/00—ICT specially adapted for medical diagnosis, medical simulation or medical data mining; ICT specially adapted for detecting, monitoring or modelling epidemics or pandemics
- G16H50/70—ICT specially adapted for medical diagnosis, medical simulation or medical data mining; ICT specially adapted for detecting, monitoring or modelling epidemics or pandemics for mining of medical data, e.g. analysing previous cases of other patients
Landscapes
- Engineering & Computer Science (AREA)
- Health & Medical Sciences (AREA)
- Medical Informatics (AREA)
- Public Health (AREA)
- Epidemiology (AREA)
- General Health & Medical Sciences (AREA)
- Primary Health Care (AREA)
- Data Mining & Analysis (AREA)
- Biomedical Technology (AREA)
- Databases & Information Systems (AREA)
- Pathology (AREA)
- Investigating Or Analysing Biological Materials (AREA)
Abstract
Un método implementado por computadora para analizar el efecto terapéutico de un tratamiento de pacientes en un entorno clínico que comprende los siguientes pasos: (i) identificar una pluralidad de registros relacionados con pacientes en una base de datos clínica, comprendiendo dichos registros mediciones para los pacientes relacionadas con pruebas administradas durante un período sin tratamiento y un período en tratamiento; (ii) identificar al menos una prueba en dicha pluralidad de registros relacionados con mediciones k de cada paciente durante un período sin tratamiento; (iii) identificar al menos una prueba en dicha pluralidad de registros relacionados con mediciones j de cada paciente durante un período de tratamiento; (iv) identificar la mejor medición de dichas mediciones k de cada paciente durante dicho período sin tratamiento; (v) realizar una evaluación de distribución estadística en dicha pluralidad de registros para identificar las probabilidades de una pluralidad de subconjuntos de dichas mediciones de tratamiento que exceden dicha mejor medición, en donde la evaluación de distribución estadística utiliza un modelo de computadora basado en la generación de números aleatorios o se deriva de ejecutar una distribución de disparidad de rango; (vi) seleccionar una probabilidad de umbral, que corresponde a la probabilidad de una cantidad de mediciones j que exceden dicha mejor medición, excediendo dicha cantidad de mediciones dicha mejor medición indicando un rendimiento mejorado y, por lo tanto, una respuesta al tratamiento en un paciente; (vii) identificar uno o más subconjuntos aceptables de la pluralidad de subconjuntos de mediciones j de tratamiento con probabilidades respectivas que no están por encima del umbral de probabilidad; (viii) comparar dichas mediciones j de tratamiento con dicha mejor medición; y (ix) seleccionar a los pacientes que tienen el número de mediciones j que exceden dicha mejor medición como uno de los subconjuntos aceptables.A computer-implemented method of analyzing the therapeutic effect of a patient treatment in a clinical setting comprising the following steps: (i) identifying a plurality of patient-related records in a clinical database, said records comprising measurements for patients related to tests administered during a period without treatment and a period under treatment; (ii) identify at least one test in said plurality of records related to k measurements of each patient during a period without treatment; (iii) identify at least one test in said plurality of records related to measurements j of each patient during a treatment period; (iv) identify the best measurement of each patient's k measurements during said period without treatment; (v) performing a statistical distribution evaluation on said plurality of records to identify the probabilities of a plurality of subsets of said treatment measurements that exceed said best measurement, where the statistical distribution evaluation uses a generation-based computer model of random numbers or derived from running a range disparity distribution; (vi) select a threshold probability, which corresponds to the probability of a number of measurements j that exceed said best measurement, said number of measurements exceeding said best measurement indicating improved performance and, therefore, a response to treatment in a patient; (vii) identify one or more acceptable subsets of the plurality of subsets of treatment measurements j with respective probabilities that are not above the probability threshold; (viii) comparing said treatment measurements j with said best measurement; and (ix) select patients who have the number of measurements j that exceed said best measurement as one of the acceptable subsets.
Description
DESCRIPCIÓNDESCRIPTION
Método, aparato y software para la identificación de respondedores en un entorno clínicoMethod, apparatus and software for the identification of responders in a clinical setting
FONDOBACKGROUND
[0001] Los investigadores clínicos tienen el problema continuo de no poder predecir o planificar con precisión los ensayos futuros, y no pueden recuperar ni aprender de los ensayos clínicos fallidos. Hay muchas razones para esto. Primero, las mediciones funcionales de sujetos de ensayos clínicos con ciertos tipos de afecciones, como EM y otras dolencias, pueden variar de manera extensa y aleatoria con el tiempo. Esto es problemático, porque si estas mediciones se van a utilizar como medidas de resultado del tratamiento, la variabilidad espontánea puede oscurecer los efectos relacionados con el tratamiento. Esta interferencia entre cambios espontáneos e inducidos puede ser particularmente problemática en condiciones en las que solo un subconjunto de sujetos de prueba responde al tratamiento. En estas condiciones, los no respondedores pueden diluir el efecto del tratamiento en los sujetos sensibles además de la contaminación de la variabilidad espontánea. [0001] Clinical researchers have the continuing problem of being unable to accurately predict or plan future trials, and cannot retrieve or learn from failed clinical trials. There are many reasons for this. First, functional measurements of clinical trial subjects with certain types of conditions, such as MS and other conditions, can vary widely and randomly over time. This is problematic, because if these measurements are to be used as outcome measures of treatment, spontaneous variability may obscure treatment related effects. This interference between spontaneous and induced changes can be particularly problematic in conditions where only a subset of test subjects respond to treatment. Under these conditions, non-responders can dilute the effect of treatment on sensitive subjects in addition to contamination by spontaneous variability.
[0002] Por otra parte, los ensayos clínicos también con frecuencia se basan en sólo unas pocas mediciones, intermitentes en las visitas clínicas ampliamente espaciadas. Estas pocas mediciones de muestra no representarán adecuadamente el rango completo de variación de la variable de resultado, ya sea durante el período de comparación inicial o durante el período de tratamiento. Cuando la magnitud de la variabilidad espontánea de la población es grande en comparación con el efecto del tratamiento esperado en el individuo, puede ser difícil determinar la presencia de respuesta al tratamiento en función de la diferencia promedio entre los períodos de referencia y de tratamiento. Un solo valor periférico grande en una dirección u otra de la media puede enmascarar una respuesta más pequeña pero consistente o, alternativamente, producir la impresión de una respuesta que no es realmente consistente durante el período de tratamiento. Por lo tanto, existe la necesidad de detectar una respuesta consistente al tratamiento a lo largo del tiempo sin encontrar resultados falsos de las variables mencionadas anteriormente. [0002] Furthermore, clinical trials are also often based on only a few measurements, intermittent at widely spaced clinical visits. These few sample measurements will not adequately represent the full range of variation of the outcome variable, either during the initial comparison period or during the treatment period. When the magnitude of spontaneous population variability is large compared to the effect of the expected treatment on the individual, it may be difficult to determine the presence of response to treatment based on the average difference between the reference and treatment periods. A single large peripheral value in one direction or the other of the mean may mask a smaller but consistent response or, alternatively, give the impression of a response that is not really consistent during the treatment period. Therefore, there is a need to detect a consistent response to treatment over time without finding false results for the variables mentioned above.
[0003] Por tanto un objeto de la invención consiste en proporcionar un medio para detectar la verdadera respuesta, coherente con el tratamiento en el tiempo utilizando un pequeño número de mediciones de sobre-tratamiento y períodos sin tratamiento se ha ideado para proporcionar una solución para este problema. [0003] Therefore an object of the invention is to provide a means to detect the true response, consistent with treatment over time using a small number of measurements of over-treatment and periods without treatment has been devised to provide a solution for this problem.
[0004] Un objeto adicional de la presente invención consiste en proporcionar un método que implica el examen de la frecuencia con que los valores de medida durante el período de tratamiento están fuera de la gama de valores registrados durante el período sin tratamiento del ensayo. [0004] A further object of the present invention is to provide a method that involves examining the frequency with which the measurement values during the treatment period are outside the range of values recorded during the non-treatment period of the test.
[0005] El documento WO02051354A2 se refiere a un sistema y método para investigadores médicos en el procedimiento o intervención farmacológica, o la eficacia, seguridad, economía o uso del dispositivo, para desarrollar y ensayar un modelo de decisión que determine individualmente para los pacientes la probable eficacia, seguridad, beneficios económicos y uso de drogas o dispositivos médicos. El modelo utiliza estudios para determinar la fiabilidad de las mediciones, criterios de significación clínica, criterios de significación estadística, estudios de la validez interna de las evaluaciones de los pacientes en condiciones controladas con placebo doble ciego y no controladas con placebo no doble ciego, métodos de confirmar las predicciones del modelo de ensayo clínico, y estudios de predicciones a largo plazo del estado de salud a partir de mediciones de resultados, y ensayos clínicos u otros diseños de investigación médica, para identificar la respuesta de cada individuo al tratamiento. [0005] Document WO02051354A2 refers to a system and method for medical researchers in the pharmacological procedure or intervention, or the efficacy, safety, economy or use of the device, to develop and test a decision model that individually determines for patients the probable efficacy, safety, economic benefits and use of drugs or medical devices. The model uses studies to determine the reliability of measurements, criteria of clinical significance, criteria of statistical significance, studies of internal validity of patient evaluations under double-blind placebo-controlled and non-double-blind placebo controlled methods. to confirm the predictions of the clinical trial model, and studies of long-term predictions of health status from outcome measurements, and clinical trials or other medical research designs, to identify the response of each individual to treatment.
[0006] El documento US2005075832A1 se refiere a un sistema y método de análisis continuo de datos de ensayos de un ensayo clínico en curso. Se realiza un análisis estadístico en una base de datos de prueba que contiene datos de prueba del sujeto. Si el resultado del análisis estadístico no excede un valor umbral predeterminado, entonces el análisis estadístico se repite mientras el ensayo clínico está en curso. En un ensayo clínico cegado, se genera una base de datos agrupada a partir de la base de datos del ensayo y una base de datos cegadora antes de realizar el análisis estadístico. La base de datos agrupada agrupa los datos del ensayo sujeto según los grupos de estudio. [0006] US2005075832A1 refers to a system and method of continuous analysis of trial data from an ongoing clinical trial. Statistical analysis is performed on a test database containing test data from the subject. If the result of the statistical analysis does not exceed a predetermined threshold value, then the statistical analysis is repeated while the clinical trial is in progress. In a blinded clinical trial, a pooled database is generated from the trial database and a blinding database before statistical analysis is performed. The pooled database groups the data from the subject trial according to study groups.
SUMARIO DE LA INVENCIÓNSUMMARY OF THE INVENTION
[0007] La presente invención se define por las reivindicaciones independientes, con características opcionales de realizaciones específicas descritas en las reivindicaciones dependientes. [0007] The present invention is defined by the independent claims, with optional features of specific embodiments described in the dependent claims.
[0008] Esta invención se refiere a una aplicación de método, aparato, y el software de ordenador que se puede utilizar para analizar efecto terapéutico de un tratamiento de los pacientes en un entorno clínico. [0008] This invention relates to an application method, apparatus, and computer software that can be used to analyze therapeutic effect of a treatment of patients in a clinical setting.
[0009] Más específicamente, la presente invención se puede utilizar para analizar la respuesta de los pacientes en un entorno clínico para muchos tipos diferentes de aflicciones, incluyendo, pero no limitado a, trastornos neurológicos tales como esclerosis múltiple, lesiones de la médula espinal, la enfermedad de Alzheimer y ELA. [0009] More specifically, the present invention can be used to analyze the response of patients in a clinical setting for many different types of afflictions, including, but not limited to, neurological disorders such as multiple sclerosis, spinal cord injury, Alzheimer's disease and ALS.
[0010] Un aspecto de la presente descripción se refiere a un método, aparato y programa de software para el análisis de datos de tratamiento de pacientes clínicos con el fin de predecir futuros ensayos clínicos. [0010] One aspect of the present disclosure relates to a method, apparatus and software program for analysis of clinical patient treatment data in order to predict future clinical trials.
[0011] Otro aspecto de la presente descripción se refiere a un método, aparato y programa de software para el análisis de datos de tratamiento de pacientes clínicos con el fin de obtener valor de los ensayos clínicos terminados, independientemente del resultado de la prueba particular. [0011] Another aspect of the present disclosure relates to a method, apparatus and software program for analysis of clinical patient treatment data in order to obtain value from completed clinical trials, regardless of the result of the particular test.
[0012] Otro aspecto de la presente descripción se refiere a un método, aparato y programa de software para la selección de individuos en base a la capacidad de respuesta a un tratamiento. El método comprende identificar una pluralidad de individuos; administrando una prueba a cada individuo antes de un período de tratamiento; administrar un tratamiento a una o más de las personas durante el período de tratamiento; administrar la prueba una pluralidad de veces a cada individuo durante el período de tratamiento; y seleccionar uno o más individuos, en donde los individuos seleccionados exhiben un rendimiento mejorado durante la mayoría de las pruebas administradas durante el período de tratamiento en comparación con la prueba administrada antes del período de tratamiento. En ciertos aspectos, el método puede comprender además administrar la prueba a cada individuo después del período de tratamiento, en donde los individuos seleccionados exhiben además un rendimiento mejorado durante la mayoría de las pruebas administradas durante el período de tratamiento en comparación con la prueba administrada después del período de tratamiento. [0012] Another aspect of the present description refers to a method, apparatus and software program for the selection of individuals based on the responsiveness to a treatment. The method comprises identifying a plurality of individuals; administering a test to each individual prior to a treatment period; giving a treatment to one or more of the people during the treatment period; administer the test a plurality of times to each individual during the treatment period; and selecting one or more individuals, where the selected individuals exhibit improved performance during most tests administered during the treatment period compared to the test administered prior to the treatment period. In certain aspects, the method may further comprise administering the test to each individual after the treatment period, where the selected individuals further exhibit improved performance during most tests administered during the treatment period compared to the test administered after of the treatment period.
[0013] Un aspecto adicional se refiere a un método de selección de individuos basado en la capacidad de respuesta a un tratamiento, comprendiendo el método la identificación de una pluralidad de individuos; administrar una prueba a cada individuo antes de un período de tratamiento; administrar un tratamiento a una o más de las personas durante el período de tratamiento; administrar la prueba una pluralidad de veces a cada individuo durante el período de tratamiento; administrar la prueba a cada individuo después del período de tratamiento; y seleccionando uno o más individuos, en donde los individuos seleccionados exhiben un rendimiento mejorado durante la mayoría de las pruebas administradas durante el período de tratamiento en comparación con el mejor rendimiento de la prueba administrada antes del período de tratamiento y la prueba administrada después del período de tratamiento. [0013] A further aspect relates to an individual selection method based on responsiveness to a treatment, the method comprising identifying a plurality of individuals; administer a test to each individual prior to a treatment period; giving a treatment to one or more of the people during the treatment period; administer the test a plurality of times to each individual during the treatment period; administer the test to each individual after the treatment period; and selecting one or more individuals, where the selected individuals exhibit improved performance during the majority of tests administered during the treatment period compared to the best performance of the test administered before the treatment period and the test administered after the period of treatment.
BREVE DESCRIPCIÓN DE LOS DIBUJOSBRIEF DESCRIPTION OF THE DRAWINGS
[0014][0014]
Figura 1 es un diagrama de flujo ejemplar que muestra una forma en la que el proceso inventivo puede presentarse en una realización asistida por computadora para que los datos de tratamiento de un ensayo clínico de un número dado de pacientes puedan analizarse para determinar los respondedores en el mismo; Figure 1 is an exemplary flowchart showing one way in which the inventive process can be presented in a computer assisted embodiment so that treatment data from a clinical trial of a given number of patients can be analyzed to determine responders in the same;
Figura 2 es un diagrama de flujo ejemplar que muestra una forma en la que la generación de distribución de probabilidad del proceso inventivo puede presentarse en una realización asistida por computadora para ofrecer una línea de base comparativa contra los valores del respondedor; Figure 2 is an exemplary flowchart showing one way in which the probability distribution generation of the inventive process can be presented in a computer aided embodiment to provide a comparative baseline against responder values;
Figura 3 es un diagrama de bloques de nivel de sistema generalizado de un sistema ejemplar que emplea el proceso inventivo descrito en este documento; y Figure 3 is a generalized system level block diagram of an exemplary system employing the inventive process described herein; Y
Figuras 4 (a) - 4 (d) son histogramas y gráficos de distribución de poblaciones de respondedores y no respondedores que se muestran en el contexto de una utilización ilustrativa de la presente invención. Figures 4 (a) - 4 (d) are histograms and distribution graphs of populations of responders and non-responders shown in the context of an illustrative use of the present invention.
DESCRIPCIÓN DETALLADA DE LA INVENCIÓNDETAILED DESCRIPTION OF THE INVENTION
[0015] Antes de describir las presentes composiciones y métodos, se ha de entender que esta invención no se limita a las moléculas, composiciones, metodologías o protocolos descritos particulares, ya que estos pueden variar. También debe entenderse que la terminología utilizada en la descripción tiene el propósito de describir únicamente las versiones o realizaciones particulares, y no pretende limitar el alcance de la presente invención, que estará limitado solo por las reivindicaciones adjuntas. [0015] Before describing the present compositions and methods, it is to be understood that this invention is not limited to the particular disclosed molecules, compositions, methodologies, or protocols, as these may vary. It should also be understood that the terminology used in the description is for the purpose of describing only the particular versions or embodiments, and is not intended to limit the scope of the present invention, which will be limited only by the appended claims.
[0016] Los términos utilizados en este documento tienen significados reconocidos y conocidos por los expertos en la técnica, sin embargo, por conveniencia e integridad, términos particulares y sus significados se exponen a continuación. [0016] The terms used herein have meanings recognized and known to those skilled in the art, however, for convenience and completeness, particular terms and their meanings are set forth below.
[0017] También hay que señalar que, como se usa aquí y en las reivindicaciones adjuntas, las formas singulares "un", "una", “el”, y "la" incluyen la referencia en plural a menos que el contexto dicte claramente lo contrario. A menos que se defina lo contrario, todos los términos técnicos y científicos utilizados en este documento tienen los mismos significados que los entendidos comúnmente por un experto en la materia. Aunque cualquier método y material similar o equivalente a los descritos en este documento se puede usar en la práctica o prueba de las realizaciones de la presente invención, ahora se describen los métodos, dispositivos y materiales preferidos. Todas las publicaciones mencionadas en este documento se incorporan por referencia. Nada en este documento debe interpretarse como una admisión de que la invención no tiene derecho a anteceder dicha divulgación en virtud de la invención anterior. [0017] It should also be noted that, as used herein and in the appended claims, the singular forms "a", "an", "the", and "the" include the plural reference unless the context clearly dictates otherwise. Unless otherwise defined, all technical and scientific terms used in this document have the same meanings as those commonly understood by a person skilled in the art. Although any method and material similar or equivalent to those described herein can be used in the practice or testing of embodiments of the present invention, the preferred methods, devices and materials are now described. All publications mentioned in this document are incorporated by reference. Nothing in this document should be construed as an admission that the invention has no right to precede such disclosure by virtue of the prior invention.
[0018] "Software" significa todas las formas de código ejecutable por vía electrónica, con independencia de la lengua empleada para la codificación, la arquitectura específica del sistema codificado, y con independencia del medio de almacenamiento utilizado (disco, descarga, ASP, etc.). [0018] "Software" means all forms of code executable electronically, regardless of the language used for encoding, the specific architecture of the encoded system, and regardless of the storage medium used (disk, download, ASP, etc. .).
[0019] Los términos "paciente" y "sujeto" significan todos los animales incluyendo seres humanos. Los ejemplos de pacientes o sujetos incluyen humanos, vacas, perros, gatos, cabras, ovejas, ratas, cerdos, etc. [0019] The terms "patient" and "subject" mean all animals including humans. Examples of patients or subjects include humans, cows, dogs, cats, goats, sheep, rats, pigs, etc.
[0020] Por lo tanto, un aspecto de la invención se refiere a un proceso para proporcionar que la frecuencia mencionada anteriormente se compare entre los grupos de tratamiento y control, así como con las predicciones de un modelo informático simple basado en la generación de números aleatorios. Por lo tanto, si hay mediciones j realizadas durante el tratamiento y k mediciones realizadas durante el período sin tratamiento, se puede generar un modelo de computadora que predecirá la frecuencia con la que un subconjunto dado de las mediciones j excederá el mayor de las mediciones sin tratamiento k. Esto se efectúa usando el método y el programa de computadora de la presente invención para generar miles de cadenas de números aleatorios j + k dentro de un rango preestablecido y ensayando la frecuencia con la cual los números en el conjunto j exceden todos los números en el conjunto k. En el transcurso de miles de iteraciones, será posible determinar la probabilidad de que 1,2,3... j del conjunto j excederá todos los k establecidos dentro de cualquier iteración. [0020] Therefore, one aspect of the invention relates to a process for providing that the above mentioned frequency is compared between the treatment and control groups, as well as with the predictions of a simple computer model based on the generation of numbers. random. Therefore, if there are measurements j made during treatment and k measurements made during the no-treatment period, a computer model can be generated that will predict the frequency with which a given subset of measurements j will exceed the largest of the measurements without treatment k. This is done using the method and the computer program of the present invention to generate thousands of strings of random numbers j + k within a preset range and testing the frequency with which the numbers in set j exceed all the numbers in the set k. Over the course of thousands of iterations, it will be possible to determine the probability that 1,2,3 ... j of the set j will exceed all the k set within any one iteration.
[0021] A modo de sólo un ejemplo, cuando j y k son números enteros pequeños (por ejemplo,>3, <8), habrá una probabilidad relativamente alta de que solo (o al menos) uno del conjunto j supera el máximo del conjunto k, pero la probabilidad disminuirá rápidamente para números más altos del conjunto j, con la menor probabilidad de que todos los números en el conjunto j sean más altos que el máximo del conjunto k. Como tal, el modelo podrá generar una distribución de probabilidad para la cantidad de mediciones j en tratamiento que probablemente excedan el máximo de las mediciones sin tratamiento k. Los datos de los ensayos clínicos para cada sujeto individual o paciente P pueden examinarse directamente para determinar el número de mediciones en tratamiento que exceden la medición máxima sin tratamiento. La distribución del número de mediciones j que exceden la medición máxima k para individuos en el grupo tratado puede compararse con una distribución similar para el grupo tratado con placebo u otro grupo de comparación. [0021] As an example only, when j and k are small integers (eg> 3, <8), there will be a relatively high probability that only (or at least) one of the set j exceeds the maximum of the set k, but the probability will decrease rapidly for higher numbers in set j, with the least probability that all numbers in set j are higher than the maximum in set k. As such, the model will be able to generate a probability distribution for the number of measurements j in treatment that are likely to exceed the maximum of the measurements without treatment k. Clinical trial data for each individual subject or P patient can be directly examined to determine the number of measurements in treatment that exceed the maximum measurement without treatment. The distribution of the number of measurements j that exceed the maximum measurement k for individuals in the treated group can be compared with a similar distribution for the group treated with placebo or another comparison group.
[0022] Las diferencias en la distribución deberían estar presentes para los números más altos de mediciones j que exceden la medición k máxima. Estas diferencias permiten establecer un criterio adecuado para el número mínimo de valores de j que exceden el valor máximo de k que representa una alta probabilidad de una respuesta al tratamiento, basado en una clara separación de probabilidad en la parte superior del rango. Un criterio de trabajo sería que una respuesta al tratamiento es probable cuando la mayoría de las mediciones de j excedan la medición máxima de k, bajo la condición de que j y k coincidan con enteros pequeños (más o menos uno). La probabilidad de que la mayoría de los valores de j estén por encima del rango de los valores de k debería ser baja en función de la variabilidad aleatoria. [0022] Differences in distribution should be present for the highest numbers of j measurements that exceed the maximum k measurement. These differences allow establishing an adequate criterion for the minimum number of values of j that exceed the maximum value of k that represents a high probability of a response to treatment, based on a clear probability separation in the upper part of the range. A working criterion would be that a response to treatment is probable when most measurements of j exceed the maximum measurement of k, under the condition that j and k coincide with small integers (plus or minus one). The probability that most of the j values are above the range of the k values should be low based on random variability.
[0023] De manera similar, los datos de ensayos clínicos también pueden ser en comparación con la distribución de probabilidad del modelo de ordenador para comprobar que la distribución de probabilidad de los datos de comparador es similar al modelo de número aleatorio y que no hay una desviación profunda de las predicciones del modelo que indicaría un efecto relacionado con el período de tratamiento que fue independiente del tratamiento. [0023] Similarly, the clinical trial data may also be compared to the probability distribution of the computer model to check that the probability distribution of the comparator data is similar to the random number model and that there is no deep deviation from model predictions that would indicate a treatment period related effect that was independent of treatment.
[0024] Una vez que el criterio para la respuesta puede ser establecida mediante la comparación de las distribuciones tratadas y de comparación, a continuación, en estudios posteriores este criterio se puede utilizar para identificar el número de personas que parecen responder al tratamiento en los grupos activamente tratados y de comparador o tratados con placebo y la importancia de las diferencias en la tasa de respuesta pueden determinarse mediante pruebas estadísticas sencillas de esas frecuencias. Cuando se configura como tal, las características de la respuesta al tratamiento del grupo de respuesta también se pueden examinar, sin diluir por la población que no responde. Sin embargo, como se puede apreciar, las descripciones anteriores con respecto a detalles tales como los comparadores específicos empleados, el número y tipo de pruebas empleadas, el número o pacientes, el número de tratamientos con y sin tratamiento pueden modificarse para adaptarse a necesidades particulares del clínico y la aflicción específica y/o fármaco que se examina. [0024] Once the criterion for response can be established by comparing the treated and comparison distributions, then in subsequent studies this criterion can be used to identify the number of people who appear to respond to treatment in the groups actively treated and comparator or placebo treated and the significance of differences in response rate can be determined by simple statistical tests of these frequencies. When configured as such, the characteristics of the response response to treatment can also be examined, undiluted by the unresponsive population. However, as can be seen, the above descriptions regarding details such as the specific comparators used, the number and type of tests used, the number or patients, the number of treatments with and without treatment can be modified to suit particular needs. of the clinician and the specific condition and / or drug being examined.
[0025] Por lo tanto, como se ve en un aspecto a modo de ejemplo de la divulgación, el aspecto más amplio de la invención puede ser detallado como que comprende un método, un método de una instancia o ejecutado en un aparato electrónico tal como un ordenador, y/o un medio legible por ordenador ejecutando los siguientes pasos de: identificar una pluralidad de registros relacionados con pacientes en una base de datos clínica, comprendiendo dichos registros mediciones para pacientes relacionadas con pruebas administradas durante un período de no tratamiento y un período de tratamiento; identificar al menos una prueba en dicha pluralidad de registros relacionados con mediciones de cada individuo durante un período sin tratamiento; identificar al menos una prueba en dicha pluralidad de registros relacionados con mediciones de cada individuo durante un período de tratamiento; identificar una medida de referencia de cada individuo durante dicho período sin tratamiento; realizar una distribución estadística en dicha pluralidad de registros para identificar la probabilidad de que dichas mediciones en tratamiento y sin tratamiento excedan dicha línea de base para comparar dichas mediciones con dicha línea de base; y seleccionando uno o más individuos ("respondedores"), en donde los individuos seleccionados exhiben un rendimiento mejorado durante la mayoría de las pruebas administradas durante el período de tratamiento en comparación con una respuesta mejor (por ejemplo, más rápida, más fuerte, etc.) de la prueba administrada en el período sin tratamiento. Sin embargo, como se puede apreciar, la invención puede tomar la forma de un medio legible por computadora para ejecutar los pasos detallados anteriormente, o alternativamente, puede comprender un sistema basado en computadora para seleccionar individuos basados en la respuesta a un tratamiento, que comprende: [0025] Therefore, as seen in an exemplary aspect of the disclosure, the broader aspect of the invention may be detailed as comprising a method, an instance method, or performed on an electronic apparatus such as a computer, and / or a computer readable medium executing the following steps of: identifying a plurality of patient-related records in a clinical database, said records comprising patient measurements related to tests administered during a non-treatment period and a treatment period; identifying at least one test in said plurality of records related to measurements of each individual during a period without treatment; identifying at least one test in said plurality of records related to measurements of each individual during a treatment period; identify a reference measure of each individual during said period without treatment; performing a statistical distribution on said plurality of records to identify the probability that said measurements in treatment and without treatment exceed said baseline to compare said measurements with said baseline; and selecting one or more individuals ("responders"), where selected individuals exhibit improved performance during most tests administered during the treatment period compared to a better response (eg, faster, stronger, etc.). .) of the test administered in the period without treatment. However, as can be appreciated, the invention may take the form of a computer readable medium to perform the steps detailed above, or alternatively, it may comprise a computer based system for selecting individuals based on response to treatment, comprising :
un módulo de memoria para almacenar mediciones de pacientes, y para almacenar al menos un primer conjunto de instrucciones relacionadas con la entrada y análisis de dichas mediciones de pacientes, y un segundo conjunto de instrucciones para emitir información de respuesta de dichas mediciones de pacientes; una unidad central de procesamiento para ejecutar dicho primer y segundo conjunto de instrucciones; y un módulo de salida para emitir dicha información de respuesta.a memory module for storing patient measurements, and for storing at least a first set of instructions related to input and analysis of said patient measurements, and a second set of instructions for outputting response information from said patient measurements; a central processing unit for executing said first and second set of instructions; and an output module to output said response information.
[0026] Por consiguiente, como se ve en las Figs. 1, 2 y 3, es una representación ejemplar del proceso inventivo en: un diagrama de flujo generalizado (Fig. 1) (que muestra los pasos 100 a 130, con reinicios opcionales para rediseñar o volver a realizar el proceso para restablecer resultados indeseables); un diagrama de flujo generalizado sobre un enfoque para generar una distribución estadística especializada y única (por ejemplo, el paso 114 de la Fig. 1) utilizada dentro del proceso general (por ejemplo, los pasos 100-130) en la Fig. 1; y una configuración de hardware (aparato) ejemplar (Fig. 3), sobre la cual se procesa el flujo ejemplar en las Figs. 1 y 2 son ejecutados por el software inventivo. El software inventivo para ejecutar los procesos descritos anteriormente, y para analizar los datos ingresados, genera información útil, como los datos del respondedor. El software y el proceso de la invención pueden estar incorporados en la computadora de cualquier forma de código legible, y pueden estar contenidos en cualquier medio legible por computadora, como un disco duro (ya sea basado en PC o servidor remoto), disco, CD, etc. Cuando se configura como tal, las mediciones de los pacientes P se formatean como señales que pueden recibir el aparato de la Figura 3 para que el proceso inventivo y el software puedan transformarse en salidas útiles para un usuario. Esta información emitida puede ser recibida por el aparato para ser procesada y analizada por el proceso inventivo para uso de un usuario que puede recibir las señales emitidas que se han formado mediante los pasos descritos en este documento. Como tal, el efecto técnico es tal que cuando las señales se procesan de acuerdo con lo anterior, el resultado tangible y útil es que los ensayos clínicos pueden ser mejor planificados y/o analizados por investigadores que pueden identificar a los respondedores a un tratamiento dado para una aflicción de casi cualquier naturaleza en formas que no estaban disponibles hasta ahora. En cualquier caso, para lograr este resultado deseable, debe enfatizarse que las figuras incluidas son meramente ilustrativas, y pueden reconfigurarse o revisarse de muchas maneras diferentes, como puede apreciar un experto en la materia. [0026] Accordingly, as seen in Figs. 1, 2 and 3, is an exemplary representation of the inventive process in: a generalized flowchart (Fig. 1) (showing steps 100 to 130, with optional restarts to redesign or redo the process to restore undesirable results) ; a generalized flow chart about an approach to generate a specialized and unique statistical distribution (eg, step 114 in Fig. 1) used within the overall process (eg, steps 100-130) in Fig. 1; and an exemplary hardware (apparatus) configuration (Fig. 3), upon which the exemplary flow is processed in Figs. 1 and 2 are executed by the inventive software. Inventive software for executing the processes described above, and for analyzing the data entered, generates useful information, such as responder data. The software and process of the invention may be embedded in the computer in any form of human readable code, and may be contained in any computer readable medium, such as a hard disk (either PC based or remote server), disk, CD , etc. When configured as such, patient P measurements are formatted as signals that can be received by the apparatus of Figure 3 so that the inventive process and software can be transformed into useful outputs for a user. This emitted information can be received by the apparatus to be processed and analyzed by the inventive process for use by a user who can receive the emitted signals that have been formed by the steps described in this document. As such, the technical effect is such that when signals are processed in accordance with the above, the tangible and useful result is that clinical trials can be better planned and / or analyzed by researchers who can identify responders to a given treatment. for an affliction of almost any nature in ways not previously available. In any case, to achieve this desirable result, it should be emphasized that the figures included are merely illustrative, and can be reconfigured or revised in many different ways, as one skilled in the art may appreciate.
[0027] En una aplicación de ejemplo específicas de un aspecto de la presente descripción, un método para analizar el tratamiento de una aflicción ilustrativa, tal como se proporciona la esclerosis múltiple. En tal ejemplo, el objetivo podría ser emplear el proceso inventivo general y el software descrito en este documento para mostrar los resultados de un estudio clínico completado, o estructurar un estudio clínico futuro que tenga como objetivo identificar a los respondedores de un grupo de pacientes que reciben un determinado tratamiento ejemplar. Al hacerlo, se pueden emplear muchos indicadores, pero en la ilustración ejemplar indicada en los Apéndices A, B, C, D y E adjuntos (cada uno de los cuales se incorpora explícitamente por referencia en su totalidad), tales indicadores pueden ser mediciones tan específicas como aumento de la velocidad de marcha en pacientes, o aumento del tono muscular o la fuerza muscular en pacientes. [0027] In a specific example application of an aspect of the present disclosure, a method of analyzing the treatment of an illustrative affliction, such as multiple sclerosis is provided. In such an example, the goal might be to employ the general inventive process and software described in this document to show the results of a completed clinical study, or to structure a future clinical study that aims to identify responders from a group of patients who they receive a certain exemplary treatment. In doing so many indicators may be employed, but in the exemplary illustration given in the attached Appendices A, B, C, D, and E (each of which is explicitly incorporated by reference in its entirety), such indicators may be measurements as specific as increased walking speed in patients, or increased muscle tone or muscle strength in patients.
[0028] Por lo tanto, en la aflicción ejemplar dado¡a y tratamiento clínico representado en los Apéndices A, B, C, D, y E, típicamente sería de esperar que sólo una parte de los pacientes con EM tuvieran axones de relevancia funcional apropiados que son susceptibles a estos efectos farmacológicos, dada la patología altamente variable de la enfermedad. Sin embargo, cuando el proceso inventivo y el software se emplean de la manera descrita aquí, y como se ilustra ampliamente en las Figs. 1, 2 y 3, la metodología innovadora identifica y caracteriza el subconjunto de pacientes que responden al fármaco ejemplar fampridina. [0028] Therefore, in the exemplary affliction given and clinical treatment depicted in Appendices A, B, C, D, and E, it would typically be expected that only a portion of MS patients had axons of appropriate functional relevance that they are susceptible to these pharmacological effects, given the highly variable pathology of the disease. However, when the inventive process and software are employed in the manner described herein, and as widely illustrated in Figs. 1, 2 and 3, the innovative methodology identifies and characterizes the subset of patients who respond to the exemplary drug fampridine.
[0029] Para este fin, la presente invención proporciona un método de selección de individuos en base a la capacidad de respuesta a un tratamiento. En un aspecto, el método comprende identificar una pluralidad de individuos; administrar una prueba a cada individuo antes de un período de tratamiento; administrar un tratamiento, que incluye, entre otros, administrar un agente terapéutico o medicamento a una o más de las personas durante el período de tratamiento; administrar la prueba una pluralidad de veces a cada individuo durante el período de tratamiento; y seleccionar uno o más individuos, en donde los individuos seleccionados exhiben un rendimiento mejorado durante la mayoría de las pruebas administradas durante el período de tratamiento en comparación con la prueba administrada antes del período de tratamiento. En ciertos aspectos, el método puede comprender además administrar la prueba a cada individuo después del período de tratamiento, en donde los individuos seleccionados exhiben además un rendimiento mejorado durante la mayoría de las pruebas administradas durante el período de tratamiento en comparación con la prueba administrada después del período de tratamiento [0029] To this end, the present invention provides a method of selecting individuals based on responsiveness to treatment. In one aspect, the method comprises identifying a plurality of individuals; administer a test to each individual prior to a treatment period; administering a treatment, including but not limited to administering a therapeutic agent or medication to one or more of the individuals during the treatment period; administer the test a plurality of times to each individual during the treatment period; and selecting one or more individuals, where the selected individuals exhibit improved performance during most tests administered during the treatment period compared to the test administered prior to the treatment period. In certain aspects, the method may further comprise administering the test to each individual after the treatment period, where the selected individuals further exhibit improved performance during most tests administered during the treatment period compared to the test administered after of the treatment period
[0030] Es importante tener en cuenta que este aspecto selecciona sujetos que muestran un patrón de cambio que es consistente con una respuesta al tratamiento, pero no define las características completas de esa respuesta. El criterio en sí mismo no especifica la cantidad de mejora ni especifica que la mejora debe ser estable en el tiempo. Por ejemplo, una disminución progresiva en el efecto durante el transcurso del período de estudio, incluso una que resulte en velocidades más lentas que el valor máximo sin tratamiento, no sería excluida por el criterio; Como ejemplo específico, los cambios desde el valor máximo sin tratamiento de, respectivamente, 20%, 5%, 1% y -30% durante el período de tratamiento doble ciego serían calificados como respuesta bajo el criterio, pero en realidad muestran un cambio promedio neto negativo para todo el período, poca estabilidad y un punto final negativo. Los análisis post-hoc de los estudios discutidos con mayor detalle a continuación indican que podemos esperar que los respondedores definidos por la consistencia del efecto también demuestren una mayor magnitud y estabilidad del beneficio. Por lo tanto, como se indica en los Apéndices A, B, C, D y E, la existencia de un subconjunto de pacientes que responden consistentemente al medicamento puede ser respaldada por observaciones cuantitativas en los estudios clínicos ejemplares que se analizan a continuación. [0030] It is important to note that this aspect selects subjects that show a pattern of change that is consistent with a response to treatment, but does not define the full characteristics of that response. The criterion itself does not specify the amount of improvement nor does it specify that the improvement must be stable over time. For example, a progressive decrease in effect over the course of the study period, even one that results in velocities slower than the maximum value without treatment, would not be excluded by the criterion; As a specific example, changes from the maximum untreated value of, respectively, 20%, 5%, 1%, and -30% during the double-blind treatment period would be rated as response under the criterion, but actually show an average change Net negative for the entire period, little stability and a negative end point. Post-hoc analyzes of Studies discussed in greater detail below indicate that we can expect responders defined by consistency of effect to also demonstrate greater magnitude and stability of benefit. Therefore, as indicated in Appendices A, B, C, D, and E, the existence of a subset of patients who consistently respond to the drug can be supported by quantitative observations in the exemplary clinical studies discussed below.
[0031] Como se ha señalado más en la aplicación ejemplar del proceso inventivo y el software en el ensayo clínico ilustrativo descrito en los Apéndices A, B, C, D, y E, antes del tratamiento, los sujetos en estos dos ensayos exhibieron velocidades medias de caminata en la medición TW25 de aproximadamente 2 pies por segundo (ft/seg). Este es un déficit significativo, ya que la velocidad de caminata esperada para un individuo no afectado es de 5-6 pies/seg. Los sujetos en MS-F202 fueron seleccionados para el tiempo de caminata TW-25 en el examen de 8-60, que es equivalente a un rango de velocidad de 0,42-3,1 pies/seg. La variabilidad del estado funcional es una característica inherente de la EM, y esto se puede ver en la medición repetida de la velocidad al caminar en el transcurso de semanas o meses. En cualquiera de las tres visitas durante el período de tratamiento estable, el 15-20% de los sujetos tratados con placebo mostraron una mejora >20% con respecto a la velocidad inicial de la caminata, un umbral elegido como uno que probablemente indique un verdadero cambio en la velocidad de la caminata sobre las fluctuaciones de fondo. Una proporción mayor de los sujetos tratados con Fampridina-SR mostró tales mejoras, pero esta diferencia no fue estadísticamente significativa, dado el tamaño de la muestra y la tasa de respuesta al placebo. [0031] As further noted in the exemplary application of the inventive process and software in the illustrative clinical trial described in Appendices A, B, C, D, and E, prior to treatment, subjects in these two trials exhibited velocities walking averages at the TW25 measurement of approximately 2 feet per second (ft / sec). This is a significant deficit, since the expected walking speed for an unaffected individual is 5-6 feet / sec. Subjects in MS-F202 were selected for walk time TW-25 on exam 8-60, which is equivalent to a speed range of 0.42-3.1 ft / sec. Variability of functional status is an inherent feature of MS, and this can be seen in repeated measurement of walking speed over the course of weeks or months. At any of the three visits during the stable treatment period, 15-20% of the placebo-treated subjects showed an improvement of> 20% over the initial walking speed, a threshold chosen as one likely to indicate true change in walking speed on background fluctuations. A greater proportion of subjects treated with Fampridine-SR showed such improvements, but this difference was not statistically significant, given the sample size and the response rate to placebo.
[0032] Teniendo en cuenta las a menudo grandes variaciones en función experimentadas por las personas con EM, es difícil para el sujeto o un observador capacitado separar una mejora relacionada con el tratamiento de una mejora relacionada con la enfermedad sin el elemento de consistencia en el tiempo. Por lo tanto, se podría esperar que la consistencia del beneficio sea una medida más selectiva del verdadero efecto del tratamiento que la magnitud del cambio. Sobre la base de esta justificación, las respuestas de los sujetos individuales en el ensayo EM-F202 se examinó para determinar el grado en que su velocidad de marcha mostró una mejoría durante el período de tratamiento doble ciego y volvió a los valores previos al tratamiento después de dejar el medicamento, en el seguimiento. Este examen sujeto por sujeto arrojó un subgrupo de sujetos cuyo patrón de velocidad de marcha a lo largo del tiempo parecía ser consistente con una respuesta al fármaco. Esto condujo al análisis ilustrado en la Figura 1. Esto compara los grupos tratados con placebo y Fampridina-SR con respecto al número de visitas durante el período de tratamiento doble ciego en el que la velocidad de caminata en el TW25 fue más rápida que la velocidad máxima de las cinco visitas sin tratamiento (cuatro visitas antes de la aleatorización y una visita de seguimiento después del período de tratamiento farmacológico). [0032] Given the often large variations in function experienced by people with MS, it is difficult for the subject or a trained observer to separate a related improvement treating a related improvement disease without the element of consistency in the weather. Therefore, consistency of benefit could be expected to be a more selective measure of the true effect of treatment than the magnitude of change. Based on this justification, responses from individual subjects in the EM-F202 trial were examined to determine the extent to which their walking speed showed improvement during the double-blind treatment period and returned to pretreatment values after to stop the medication, in the follow-up. This subject-by-subject examination yielded a subset of subjects whose walking speed pattern over time appeared to be consistent with a response to the drug. This led to the analysis illustrated in Figure 1. This compares the groups treated with placebo and Fampridine-SR with respect to the number of visits during the double-blind treatment period in which the walking speed in TW25 was faster than the speed. maximum of five visits without treatment (four visits before randomization and one follow-up visit after the drug treatment period).
[0033] El grupo tratado con placebo mostró un claro patrón de disminución exponencial en el número de sujetos con un mayor número de visitas "positivas". Esto es lo que se esperaría de un proceso aleatorio de variabilidad. En contraste, el patrón de respuesta en el grupo tratado con Fampridina-SR divergió fuertemente de esta distribución; un número mucho mayor de sujetos tratados con Fampridina-SR mostraron tres o cuatro visitas con velocidades de caminata más altas que la velocidad máxima de las cinco visitas sin tratamiento y menos de la mitad de la proporción esperada no tuvo visitas con velocidades más altas. Estos resultados indican que hubo una subpoblación de sujetos en el grupo tratado con Fampridina-SR que experimentó un aumento constante en la velocidad de caminata relacionada con el tratamiento. [0033] The placebo-treated group showed a clear pattern of exponential decrease in the number of subjects with a higher number of "positive" visits. This is what would be expected from a random process of variability. In contrast, the response pattern in the Fampridine-SR treated group diverged strongly from this distribution; a much larger number of subjects treated with Fampridine-SR showed three or four visits with higher walking speeds than the maximum speed of the five visits without treatment and less than half of the expected proportion had no visits with higher speeds. These results indicate that there was a subpopulation of subjects in the Fampridine-SR treated group that experienced a steady increase in treatment-related walking speed.
[0034] Este análisis sugiere que un criterio relativamente muy selectivo para un respondedor de tratamiento probablemente sería: un sujeto con una velocidad de caminar más rápido por lo menos tres (es decir, tres o cuatro) de las cuatro visitas durante el período de tratamiento doble ciego en comparación con el valor máximo para las cinco visitas sin tratamiento. Las cuatro visitas antes del inicio del tratamiento doble ciego proporcionan una línea de base inicial contra la cual medir la consistencia de la respuesta durante las cuatro visitas de tratamiento. La inclusión de la visita de seguimiento como un componente adicional de la comparación se consideró valiosa principalmente al excluir a aquellos sujetos que no mostraron la pérdida esperada de mejoría después de dejar el medicamento. Es probable que se trate de sujetos que por casualidad mejoraron sus síntomas de EM en el momento del inicio del tratamiento, pero cuya mejora no se revirtió con la interrupción del medicamento porque en realidad no estaba relacionado con el medicamento. Por lo tanto, la incorporación de la visita de seguimiento como parte del criterio puede ayudar a excluir los falsos positivos, si la velocidad TW25 sigue siendo alta en el seguimiento. [0034] This analysis suggests that a relatively highly selective criterion for a treatment responder would likely be: a subject with a faster walking speed for at least three (ie three or four) of the four visits during the treatment period double blind compared to the maximum value for the five visits without treatment. The four visits before the start of double-blind treatment provide an initial baseline against which to measure the consistency of response during the four treatment visits. The inclusion of the follow-up visit as an additional component of the comparison was considered valuable mainly in excluding those subjects who did not show the expected loss of improvement after stopping the medication. It is likely that these were subjects who incidentally improved their MS symptoms at the time of initiation of treatment, but whose improvement was not reversed with discontinuation of the drug because it was not actually related to the drug. Therefore, the incorporation of the follow-up visit as part of the criterion can help to exclude false positives, if the TW25 speed remains high at follow-up.
[0035] Como se describe en el Ejemplo 5 en el Apéndice A, este criterio de respuesta se encontró con 8,5%, 35,3%, 36,0% y 38,6% de los sujetos en el placebo, 10 mg, 15 mg, y 20 mg grupos de tratamiento b.i.d., respectivamente, mostrando una diferencia altamente significativa y consistente entre el placebo y los grupos de tratamiento farmacológico. Dado que había poca diferencia en la respuesta entre las tres dosis examinadas, se realizaron análisis más detallados comparando los grupos tratados con Fampridina-SR agrupados con el grupo tratado con placebo. Los resultados completos de este análisis para estudio se describen en las siguientes secciones. Estos muestran que el grupo de respuesta así identificado experimentó un aumento promedio >25% en la velocidad de caminata durante el período de tratamiento y que este aumento no disminuyó durante el período de tratamiento. El grupo de respuesta también mostró un aumento en el puntaje de Impresión Global del Sujeto y una mejora en el puntaje en el MSWS-12. Por lo tanto, al utilizar el proceso inventivo y el software, fue posible identificar que los respondedores experimentaron mejoras clínicamente significativas en sus síntomas de EM, y el tratamiento con fampridina aumentó significativamente las posibilidades de tal respuesta. Al hacerlo, se estableció una línea de base que mostraba la comparabilidad entre los grupos de análisis de respuesta, y luego se realizaron análisis sobre las variables demográficas de línea de base, las características neurológicas clave y las variables de eficacia relevantes en la línea de base. En general, los grupos de análisis de respondedores fueron comparables para todas las variables de características demográficas y de línea de base, con ciertas excepciones. [0035] As described in Example 5 in Appendix A, this response criterion was found with 8.5%, 35.3%, 36.0% and 38.6% of subjects on placebo, 10 mg , 15 mg, and 20 mg bid treatment groups, respectively, showing a highly significant and consistent difference between placebo and drug treatment groups. Since there was little difference in response between the three doses examined, more detailed analyzes were performed comparing the grouped Fampridine-SR treated groups with the placebo treated group. The full results of this study analysis are described in the following sections. These show that the response group thus identified experienced an average> 25% increase in walking speed during the treatment period and that this increase did not decrease during the treatment period. The response group also showed an increase in the Subject Global Impression score and an improvement in the MSWS-12 score. Therefore, using the inventive process and software, it was possible to identify that responders experienced clinically significant improvements in their MS symptoms, and treatment with fampridine significantly increased the chances of such a response. In doing so, a baseline was established showing comparability between response analysis groups, and then analyzes were performed on baseline demographic variables, key neurological characteristics, and relevant efficacy variables at baseline. In general, the respondent analysis groups were comparable for all variables of demographic characteristics and baseline, with certain exceptions.
[0036] Habiendo demostrado la utilidad clínica de mejores velocidades de marcha consistentemente durante el período doble ciego como criterio de la capacidad de respuesta, la cuestión de la magnitud del beneficio será de interés. Las diferencias observadas entre los respondedores de fampridina y el grupo placebo para las variables funcionales en este estudio son exactamente lo que esperaríamos ver en las variables funcionales en un estudio de enriquecimiento en el que después de un período inicial, solo se ingresan los respondedores de fampridina, seguidos de un lavado y aleatorización a placebo o fampridina. Los que no responden a la fampridina, aunque no brindan información de eficacia relevante, sí brindan información de seguridad con respecto a aquellas personas que reciben tratamiento con fampridina pero no muestran ningún beneficio clínico aparente. Como tal, se realizaron análisis de respuesta de estos grupos. [0036] Having consistently demonstrated the clinical utility of better walking speeds during the double-blind period as a criterion of responsiveness, the question of the magnitude of benefit will be of interest. The observed differences between fampridine responders and the placebo group for functional variables in this study are exactly what we would expect to see for functional variables in an enrichment study in which after an initial period only fampridin responders are entered. , followed by washing and randomization to placebo or fampridine. Those who do not respond to fampridine, although they do not provide relevant efficacy information, they do provide safety information regarding those who receive treatment with fampridine but show no apparent clinical benefit. As such, response analyzes of these groups were performed.
[0037] En un aspecto ejemplar adicional, un método de selección de individuos en base a la capacidad de respuesta a un tratamiento se deriva de la ejecución de una distribución de rango de disparidad y su aplicación en un entorno de ensayo clínico. En este aspecto, se utiliza una nueva distribución de "disparidad de rango" (RDD) para calcular la probabilidad de que un número dado de elementos (como pacientes) en un conjunto caiga fuera del rango, en una medida determinada, de todos los artículos (pacientes) en otro conjunto. La aplicación de esta distribución a la evaluación de datos de un ensayo clínico real se describe y demuestra una nueva forma eficiente de análisis de respuesta. Como apreciarán los expertos en la materia, se pueden desarrollar muchas aplicaciones adicionales de la distribución de rango en entornos clínicos y de otro tipo. [0037] In a further exemplary aspect, a method of selecting individuals based on responsiveness to treatment is derived from the execution of a disparity range distribution and its application in a clinical trial setting. In this regard, a new "range disparity" (RDD) distribution is used to calculate the probability that a given number of items (such as patients) in a set will fall outside the range, to a certain extent, of all items. (patients) in another set. The application of this distribution to the evaluation of data from a real clinical trial is described and demonstrates a new efficient form of response analysis. As will be appreciated by those skilled in the art, many additional applications of range distribution can be developed in clinical and other settings.
[0038] Los datos de ejemplo de la principio fundamental detrás de un rango de distribución se pueden describir de la siguiente manera rudimentaria. Supongamos que hay tres urnas; llámalos X, Y y Z. Supongamos que la urna Z contiene 10 pajitas de longitudes ligeramente diferentes. Un árbitro selecciona cinco popotes, los coloca en la urna X y coloca los cinco popotes restantes en la urna Y. ¿Cuál es la distribución de probabilidad de que un número dado de popotes en la urna Y sea más largo que la paja más larga en urna X? [0038] The example data of the fundamental principle behind a distribution range can be described in the following rudimentary way. Suppose there are three urns; Call them X, Y, and Z. Suppose the urn Z contains 10 straws of slightly different lengths. A referee selects five straws, places them in ballot box X, and places the remaining five straws in ballot box Y. What is the probability distribution that a given number of straws in ballot box Y is longer than the longest straw in urn X?
• La probabilidad es 5 de 10 para que la urna X proporcione la paja más larga. Del mismo modo, existe una probabilidad de 5/10 de que la urna Y no tenga pajitas más grandes que la paja más grande en la urna X.• The probability is 5 out of 10 for urn X to provide the longest straw. Similarly, there is a 5/10 probability that urn Y does not have straws larger than the largest straw in urn X.
• Para que la urna Y tenga exactamente una paja más grande que la paja más grande en la urna X:• For ballot box Y to have exactly one straw larger than straw largest in ballot box X:
+ la urna Y primero debe tener la pajita más grande (una probabilidad de 5/10);+ the urn AND must first have the largest straw (a probability of 5/10);
+ las 5 pajitas en la urna X deben ser las más grandes entre las 9 pajitas restantes (una probabilidad de 5/9).+ the 5 straws in urn X must be the largest among the remaining 9 straws (a probability of 5/9).
Entonces, la probabilidad de que la urna Y tenga exactamente una pajita más grande que la pajita más grande en la urna X es x 5/10 x 5/9. So the probability that urn Y has exactly one bigger straw than the largest straw in urn X is x 5/10 x 5/9.
• Para que la urna Y tenga exactamente dos pajitas más grandes que la pajita más grande en la urna X, la urna Y debe primero tener:• For Urn Y to have exactly two straws larger than the largest straw in Urn X, Urn Y must first have:
+ la pajita más grande para empezar (una probabilidad de 5/10);+ the biggest straw to start (a probability of 5/10);
+ la pajita segunda más grande entre las 9 restantes (una probabilidad de 4/9);+ the second largest straw among the remaining 9 (a probability of 4/9);
+ las 5 pajitas en la urna X deben ser las más grandes entre las 8 pajitas restantes (una probabilidad de 5/8).+ the 5 straws in urn X must be the largest among the remaining 8 straws (a probability of 5/8).
Así que la probabilidad de que la urna Y tenga exactamente dos pajitas más grande que la paja más grande en urna X es x 5/10 x 4/9 x 5/8 = 5 /10 x 5/9 x 4/8 So the probability that the urn Y is exactly two straws larger than the largest straw urn x 05.10 x X is 4/9 x 5/8 = 5/10 x 5/9 x 4/8
• Continuando esta lógica, si dejamos que la variable aleatoria T represente el número de popotes en la urna Y que son más grandes que la paja más grande en la urna X, obtenemos la siguiente distribución:• Continuing this logic, if we let the random variable T represent the number of straws in urn Y that are larger than the largest straw in urn X, we obtain the following distribution:

[0039] Como otro ejemplo, supongamos que la urna Z tiene 8 pajas de diferente longitud, 5 de los cuales se colocan en urna X y 3 en urna Y. ¿Cuál es la distribución de probabilidad de que un número dado de pajitas en urna Y son más largos que la paja mas larga en la urna X? Mediante la lógica equivalente descrita anteriormente, obtenemos la siguiente distribución: [0039] As another example, suppose urn Z has 8 straws of different length, 5 of which are placed in urn X and 3 in urn Y. What is the probability distribution that a given number of straws in urn And are they longer than the longest straw in urn X? Using the equivalent logic described above, we obtain the following distribution:

[0040] Mediante el uso de varias combinaciones de paja en urna X y urna Y, el problema se puede generalizar para que urna X contenga S-pajas y urna Y contenga T-pajas. Esto lleva a la siguiente definición. [0040] By using various combinations of straw in urn X and urn Y, the problem can be generalized so that urn X contains S-straws and urn Y contains T-straws. This leads to the following definition.
[0041] Definición 1 : Que N represente el conjunto de enteros positivos. Una variable aleatoria Y tiene la distribución, que nosotros llamaremos la distribución de disparidad de rango (RDD) cuando (para S y T e N y Y e O f l N d e modo que 0 < Y <T) [0041] Definition 1 : Let N represent the set of positive integers. A random variable Y has the distribution, which we will call the range disparity distribution (RDD) when (for S and T e N and Y e O fl N so that 0 <Y <T)

[0042] Esto conduce a la correspondiente función de distribución acumulativa F (y): [0042] This leads to the corresponding cumulative distribution function F (y):

[0043] Mientras que la discusión anterior proporciona la distribución de probabilidad para el número de casos en los que X excede del rango de los elementos de Y, las mismas consideraciones cubrirán el caso contrario: el número de casos en los que los elementos de X caigan por debajo de la gama de los elementos de Y. [0043] While the previous discussion provides the probability distribution for the number of cases in which X exceeds the range of the elements of Y, the same considerations will cover the opposite case: the number of cases in which the elements of X fall below the range of the Y elements.
[0044] Esta distribución tiene numerosas aplicaciones potenciales: por ejemplo, en un ensayo clínico donde las mediciones de un aspecto particular de la enfermedad muestran una variación esencialmente aleatoria con el tiempo. En tal caso, podemos estar obligados (por ejemplo, por los horarios de visitas a la clínica) para obtener solo una pequeña muestra de mediciones de cada paciente en el transcurso de un período de referencia y una pequeña muestra de mediciones durante un período de tratamiento. El RDD proporciona una forma simple y efectiva de identificar a las personas que muestran un cambio de rango inesperado en la dirección positiva o negativa, lo que indica un beneficio constante o un empeoramiento constante que se asocia temporalmente con el tratamiento. Además de hacer comparaciones entre grupos, podemos comparar la distribución de los cambios en el grupo placebo con el RDD esperado para identificar y medir cualquier cambio temporal debido a factores como los efectos placebo y la progresión o remisión de la enfermedad natural. [0044] This distribution has numerous potential applications: for example, in a clinical trial where measurements of a particular aspect of the disease show essentially random variation over time. In such a case, we may be required (for example, by clinic visit times) to obtain only a small sample of measurements from each patient over the course of a reference period and a small sample of measurements during a treatment period . RDD provides a simple and effective way to identify people who show an unexpected range change in the positive or negative direction, indicating a constant benefit or constant worsening that is temporarily associated with treatment. In addition to making comparisons between groups, we can compare the distribution of changes in the placebo group with the expected RDD to identify and measure any temporal changes due to factors such as placebo effects and progression or remission of natural disease.
[0045] Sería de esperar que la consistencia del beneficio del tratamiento sea una medida más eficaz de la respuesta (es decir, de la causalidad) que la simple limitación a examinar la magnitud del cambio entre la visita promedio de línea de base y la visita de tratamiento promedio. Esto se debe a que un beneficio significativo y consistente puede ser de magnitud pequeña y una gran desviación aleatoria, que ocurre durante cualquier medición individual, puede tener un efecto sustancial pero sin sentido en el valor promedio en un pequeño número de mediciones de muestra. [0045] Consistency of treatment benefit would be expected to be a more effective measure of response (ie, causality) than simply limiting to examine the magnitude of change between the average baseline visit and the visit. average treatment. This is because a significant and consistent benefit can be of small magnitude and a large random deviation, which occurs during any single measurement, can have a substantial but meaningless effect on the average value in a small number of sample measurements.
[0046] Ejemplo 1 - Base teórica: Suponiendo un ensayo clínico de tal manera que para cada paciente haya mediciones S sin medicamentos de una función afectada particular y mediciones T con medicamentos. Supongamos que Y representa el número de mediciones con medicamentos que son mejores (por ejemplo, más normales) que la mejor medición sin medicamentos. Suponga que Y sigue la distribución de disparidad de rango (RD). Por ejemplo, si hay S = 5 visitas sin medicamentos y T = 5 visitas con medicamentos, entonces la distribución de probabilidad de Y, es: [0046] Example 1 - Theoretical basis: Assuming a clinical trial such that for each patient there are drug-free S measurements of a particular affected function and drug T measurements. Suppose Y represents the number of measurements with medications that are better (for example, more normal) than the best measurement without medications. Suppose Y follows the range disparity distribution (RD). For example, if there are S = 5 visits without medication and T = 5 visits with medication, then the probability distribution of Y is:
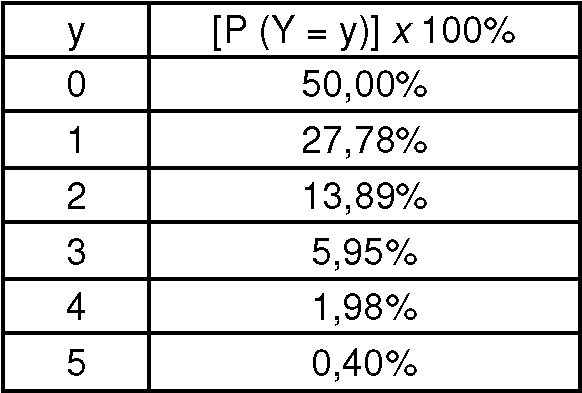
[0047] Esta distribución implica que, si el tratamiento activo no tiene ningún efecto esperaríamos que la proporción de pacientes que experimentan una mejora constante, reflejada por 4 o 5 mediciones de drogas mejor que la mejor medición de drogas, fuera de 2,5%. La hipótesis nula de que los grupos son iguales con respecto a la proporción de sujetos con una mejora constante puede probarse usando una prueba estándar como la prueba exacta de Fisher, una prueba de ji-cuadrado o para muestras estratificadas (por ejemplo, por centro de estudio) la prueba Cochran-Mantel-Haenszel. Las desviaciones significativas de esta frecuencia esperada en el grupo de tratamiento activo, pero no en el grupo de placebo, nos llevarían a concluir que el tratamiento y los grupos de placebo son diferentes. Las diferencias significativas entre las tres distribuciones (tratamiento activo, placebo y RD esperada) indicarían un efecto del tratamiento superpuesto a un cambio temporal debido a otros factores. [0047] This distribution implies that, if active treatment has no effect, we would expect the proportion of patients experiencing constant improvement, reflected by 4 or 5 drug measurements better than the best drug measurement, to be 2.5% . The null hypothesis that groups are equal with respect to the proportion of subjects with constant improvement can be tested using a standard test such as Fisher's exact test, a chi-square test, or for stratified samples (for example, by center of study) the Cochran-Mantel-Haenszel test. Significant deviations from this expected frequency in the active treatment group, but not in the placebo group, would lead us to conclude that the treatment and the placebo groups are different. Significant differences between the three distributions (active treatment, placebo, and expected RD) would indicate an effect of treatment superimposed on a temporal change due to other factors.
[0048] Por lo tanto, la identificación de una respuesta consistente como se representa por 4 o 5 de las mediciones con medicamentos como mejor que la mejor medición sin medicamentos proporciona un criterio particularmente claro para un análisis de respondedores. Un análisis tradicional de respondedores establecería un nivel arbitrario de cambio promedio (por ejemplo, 10%, 20%) por encima del cual un sujeto de prueba sería calificado como respondedor. En general, no existe una justificación clínica o estadística clara para tal criterio ni un método a priori para su estimación. Por otro lado, un criterio de consistencia basado en el RDD puede ser clínicamente significativo (basado en la relación consistente con el tratamiento a lo largo del tiempo), estadísticamente apropiado (basado en un umbral de probabilidad estadística, aquí aproximadamente 2,5% para un criterio unilateral) y se puede calcular a priori, dado el diseño del ensayo. [0048] Therefore, the identification of a consistent response as represented by 4 or 5 measurements with drugs such as better than the best measurement without drugs provides a particularly clear criterion for responder analysis. A traditional responder analysis would establish an arbitrary average level of change (eg, 10%, 20%) above which a test subject would be rated as a responder. In general, there is no clear clinical or statistical justification for such criteria or an a priori method for its estimation. On the other hand, a consistency criterion based on the RDD can be clinically significant (based on the consistent relationship with treatment over time), statistically appropriate (based on a threshold of statistical probability, here approximately 2.5% for unilateral criteria) and can be calculated a priori, given the trial design.
[0049] A continuación se muestra un breve resumen de un enfoque general para determinar los parámetros adecuados para un criterio de respuesta basado en el concepto de coherencia a través de mediciones. Un enfoque general para determinar un criterio de respuesta apropiado para un ensayo clínico podría derivarse de la siguiente manera: [0049] Below is a brief summary of a general approach to determine the appropriate parameters for a response criterion based on the concept of coherence through measurements. A general approach to determining an appropriate response criterion for a clinical trial could be derived as follows:
Dejar que,Let that
Xes (i = 1,2,,..., I y s = 1,2,... S) represente la sa medición sin medicamentos para el paciente i.X is (i = 1,2 ,, ..., I and s = 1,2, ... S) represents the measurement without medication for patient i.
Y it (i = 1,2,,..., I yt = 1,2,... T) represente ta medición del fármaco para el paciente i.And it (i = 1,2 ,, ..., I and t = 1,2, ... T) represents the measurement of the drug for patient i.
Suposiciones:Assumptions:
• Cada medición de X e Y aborda la misma variable de resultado: Z (usamos X e Y para diferenciar las mediciones durante diferentes períodos de tiempo: fuera del fármaco y dentro del fármaco).• Each measurement of X and Y addresses the same outcome variable: Z (we use X and Y to differentiate measurements over different time periods: off-drug and on-drug).
• Inicialmente, suponga que no hay efecto del tratamiento y que no hay un efecto longitudinal en la medida de resultado. Es decir que con el tiempo, en el mejor de los casos, existe una correlación insignificante dentro del paciente. Si existe tal efecto, se hará evidente en el análisis mismo.• Initially, assume that there is no treatment effect and that there is no longitudinal effect on the outcome measure. In other words, over time, at best, there is an insignificant correlation within the patient. If such an effect exists, it will become apparent in the analysis itself.
Establezca un criterio de consistencia C que sea una relación (p) entre las mediciones fuera del medicamento y cada medición dentro del medicamento de manera que: Establish a consistency criterion C that is a ratio (p) between measurements outside the medication and each measurement within the medication so that:

y calcule el número de visitas al medicamento que cumplen con el criterio c, = / i=c! „. elija un valor l < T de manera que el criterio de respuesta se defina como:and calculate the number of visits to the medication that meet criterion c, = / i = c! „. choose a value l <T so that the response criteria is defined as:

Para los ensayos clínicos, una buena regla general es elegir l de modo que la tasa de respuesta teórica no sea superior al 5%, es decir:For clinical trials, a good rule of thumb is to choose l so that the theoretical response rate does not exceed 5%, i.e .:

[0050] Ejemplo 2 - Experiencia práctica: Lo siguiente se basa en los datos de un ensayo clínico que examinó los efectos de un tratamiento novedoso para mejorar la velocidad de la marcha en pacientes diagnosticados con una enfermedad crónica y se diseñó con 5 medicamentos y 4 evaluaciones con medicamentos de la velocidad al caminar. Los sujetos fueron asignados al azar para recibir drogas activas o placebo en una proporción de 3:1. Para un paciente dado, si dejamos que Y represente el número de velocidades de caminata medidas con el medicamento que son más rápidas que la velocidad de marcha más rápida sin mediamentos y supongamos que Y sigue el RDD, tenemos: [0050] Example 2 - Practical experience: The following is based on data from a clinical trial examining the effects of a novel treatment to improve walking speed in patients diagnosed with chronic disease and designed with 5 drugs and 4 Medication evaluations of walking speed. Subjects were randomized to receive active drugs or placebo in a 3: 1 ratio. For a given patient, if we let Y represent the number of walking speeds measured with the drug that are faster than the fastest walking speed without mediations and suppose that Y follows the RDD, we have:
Tabla 1. Tabla que muestra la distribución teórica de las visitas al fármaco con velocidades de caminata más rápidas que la velocidad de caminata más rápida sin medicamentos usando el RDD.Table 1. Table showing the theoretical distribution of visits to the drug with faster walking speeds than the fastest walking speed without medication using the RDD.

[0051] La aplicación del enfoque general para determinar un criterio de respuesta apropiada, respuesta al tratamiento se definió como una velocidad de caminar más rápida en al menos 3 de los 4 visitas con medicamentos en comparación con la velocidad más rápida medida durante los 5 visitas sin medicamentos. Hubo 205 pacientes con intención de tratar incluidos en el análisis primario de eficacia (47 placebo y 158 tratamiento activo). La Tabla 2 a continuación resume el resultado clave del estudio. [0051] Applying the general approach to determine an appropriate response criterion, response to treatment was defined as a faster walking speed in at least 3 of the 4 visits with medication compared to the fastest speed measured during the 5 visits without medication. There were 205 intention-to-treat patients included in the primary efficacy analysis (47 placebo and 158 active treatment). Table 2 below summarizes the key result of the study.
Tabla 2. Tabla que muestra el porcentaje de respondedores, seleccionados para una mejora constante en la velocidad de la marcha en los grupos tratados con placebo y con el fármaco activo. Valor p calculado a partir de la prueba de Cochran-Mantel-Haenszel, que controla el centro de estudio.Table 2. Table showing the percentage of responders, selected for a constant improvement in walking speed in the groups treated with placebo and with the active drug. P-value calculated from the Cochran-Mantel-Haenszel test, which controls the study center.

[0052] Como se puede ver, la tasa de respuesta de placebo (8,5%) fue muy cerca de la tasa de respuesta teórica de aproximadamente 5%. De hecho, cuando examinamos la distribución de frecuencias para el grupo tratado con placebo en el Gráfico A, a continuación, vemos que la distribución observada de mejores mediciones en el fármaco fue similar a la esperada de la RDD, lo que sugiere efectos temporales o placebo insignificantes en este juicio. Por otro lado, la distribución de las mediciones en el grupo tratado activamente fue significativamente diferente de las distribuciones teóricas y de placebo. En particular, hubo grandes diferencias en la proporción de sujetos que no mostraron mediciones más rápidas que la medición más rápida sin medicamentos y que mostraron 3 o 4 visitas más rápidas. Esto indica que el tratamiento activo pero no el tratamiento con placebo se asocia con una mejoría más consistente de lo que se esperaría del RDD, y que nuestra selección del criterio de respuesta basado en la probabilidad estadística es razonable en la práctica. [0052] As can be seen, the placebo response rate (8.5%) was very close to the theoretical response rate of approximately 5%. In fact, when we examine the frequency distribution for the placebo-treated group in Figure A, below, we see that the observed distribution of better measurements on the drug was similar to that expected from RDD, suggesting temporal or placebo effects. insignificant in this trial. On the other hand, the distribution of the measurements in the actively treated group was significantly different from the theoretical and placebo distributions. In particular, there were large differences in the proportion of subjects who did not show faster measurements than the fastest drug-free measurement and who showed 3-4 faster visits. This indicates that active treatment but not placebo treatment is associated with more consistent improvement than would be expected from RDD, and that our selection of response criteria based on statistical probability is reasonable in practice.
[0053] La figura 4 (a): Histograma que muestra la proporción de sujetos en los dos grupos de tratamiento que experimentaron un número dado de las evaluaciones de caminar durante el tratamiento que eran más rápidos que la velocidad más rápida medida durante el período sin tratamiento. Estas distribuciones se comparan con la distribución de probabilidad RD esperada. [0053] Figure 4 (a): Histogram showing the proportion of subjects in the two treatment groups who underwent a given number of evaluations of walking during treatment that were faster than the fastest speed measured during the period without treatment. These distributions are compared with the expected RD probability distribution.
[0054] La utilidad de esta forma de análisis de la respuesta se muestra tanto por la diferenciación de los grupos de tratamiento y control y por la capacidad de demostrar que, en ausencia de tratamiento activo, no hubo cambio significativo independiente en el grupo de placebo que indicaría cambios independientes del tratamiento relacionados con el tiempo o con los efectos placebo. [0054] The utility of this form of response analysis is shown both by the differentiation of the treatment and control groups and by the ability to demonstrate that, in the absence of active treatment, there was no independent significant change in the placebo group. indicating independent treatment changes related to time or placebo effects.
[0055] La aplicación de este criterio para "análisis de la respuesta consistente" permite un muestreo muy eficiente. Esto se muestra al comparar tres formas de análisis de los datos de este estudio en las Figuras 4 (b) - (d). Simplemente al examinar la distribución de los cambios medios entre la línea de base y los períodos de tratamiento en una comparación cuantitativa tradicional (en la Figura 4 (c)) vemos una tendencia a mejorar en el grupo tratado con el fármaco, y esperaríamos que dicha diferencia se resuelva con significación estadística en un estudio mucho más amplio). Sin embargo, en este estudio la diferencia no fue significativa por ANOVA. Un análisis de respuesta tradicional, que establece un umbral de mejora del 15% (Figura 4 (c)) muestra nuevamente una clara tendencia favorable, con muchos más "respondedores" en el grupo activo, pero esto no es estadísticamente significativo con el tamaño de muestra disponible (utilizando la prueba de Cochran-Mantel Haenszel). Se obtienen resultados similares con otros umbrales de respuesta arbitrarios, por ejemplo, 10% o 20%. Aplicando el criterio de "respuesta consistente", vemos una respuesta altamente estadísticamente significativa con el tamaño de muestra disponible (Figura 4 (d), Tabla 2). El análisis general no solo se vuelve más sensible por el criterio de respuesta consistente, sino que este enfoque, a diferencia de los otros dos, también nos permite: a) mostrar que la tasa de respuesta al placebo no es significativamente diferente de la esperada por la variabilidad aleatoria (Figura 4 (a), Tabla 2); y b) saber antes del ensayo que la tasa de falsos positivos esperados para el criterio es aproximadamente del 5% (Tabla 1) en función de la distribución de probabilidad RD. [0055] The application of this criterion for "consistent response analysis" allows very efficient sampling. This is shown by comparing three forms of data analysis from this study in Figures 4 (b) - (d). Simply by examining the distribution of mean changes between baseline and treatment periods in a traditional quantitative comparison (in Figure 4 (c)) we see a trend for improvement in the drug-treated group, and we would expect that such difference is resolved with statistical significance in a much larger study). However, in this study the difference was not significant by ANOVA. A traditional response analysis, which establishes a 15% improvement threshold (Figure 4 (c)) shows again a clear favorable trend, with many more "responders" in the active group, but this is not statistically significant with the size of Sample available (using the Cochran-Mantel Haenszel test). Similar results are obtained with other arbitrary response thresholds, for example, 10% or 20%. Applying the "consistent response" criterion, we see a highly statistically significant response with the available sample size (Figure 4 (d), Table 2). The general analysis is not only made more sensitive by the consistent response criterion, but this approach, unlike the other two, also allows us to: a) show that the placebo response rate is not significantly different from that expected by the random variability (Figure 4 (a), Table 2); and b) know before the test that the expected false positive rate for the criterion is approximately 5% (Table 1) based on the RD probability distribution.
[0056] La figura 4(b): Distribución de los cambios en la velocidad media a pie entre la línea de base, el período de pre tratamiento y el periodo de tratamiento doble ciego para los pacientes asignados al azar a placebo o tratamiento activo. Aunque parece haber una diferencia en los cambios medios entre los grupos de tratamiento, esto no fue estadísticamente significativo según ANOVA. [0056] Figure 4 (b): Distribution of changes in mean walking speed between baseline, pretreatment period and double-blind treatment period for patients randomized to placebo or active treatment. Although there appears to be a difference in mean changes between treatment groups, this was not statistically significant according to ANOVA.
[0057] La figura 4 (c): La aplicación de un análisis de respuesta tradicional a los datos en la Figura 4 (b), con un umbral para "respuesta" fijado en la mejora >15%. Esto muestra que la distribución de los cambios entre los que no respondieron en el grupo tratado con medicamentos es muy diferente de la del grupo placebo, lo que indica la presencia de un número significativo de falsos negativos entre los que no respondieron y los falsos positivos entre los que respondieron. Un total de 7 pacientes tratados con placebo se registraron como respondedores, para una tasa de falsos positivos del 14,8% en ese grupo. La tasa de respuesta en el grupo tratado con medicamentos fue de 44,2%. El diferencial de respuesta fármaco-placebo fue, por lo tanto, del 29,4%, pero esto no fue estadísticamente significativo. Claramente, el umbral elegido para la definición de respuesta afectará el número de respondedores en ambos grupos de tratamiento, pero no cambiaría la naturaleza arbitraria de la división entre respondedores y no respondedores. [0057] Figure 4 (c): The application of a traditional response analysis to the data in Figure 4 (b), with a threshold for "response" set at improvement> 15%. This shows that the distribution of changes among the non-responders in the drug-treated group is very different from that in the placebo group, indicating the presence of a significant number of false negatives among non-responders and false positives among those who responded. A total of 7 placebo-treated patients were registered as responders, for a false-positive rate of 14.8% in that group. The response rate in the drug-treated group was 44.2%. The drug-placebo response differential was therefore 29.4%, but this was not statistically significant. Clearly, the threshold chosen for the definition of response will affect the number of responders in both treatment groups, but would not change the arbitrary nature of the division between responders and nonresponders.
[0058] La figura 4 (d): La aplicación del análisis de respuesta consistente (medidas repetidas) a los mismos datos de la figura 4 (b) selecciona una población no respondedora que está cerca del grupo tratado con placebo en su distribución. Solo 4 sujetos en el grupo placebo se registraron como respondedores, para una tasa de falsos positivos del 8,5%. La tasa de respuesta en el grupo tratado con drogas fue del 37,2%. El diferencial de respuesta fármacoplacebo fue, por lo tanto, del 28,7%, similar al 29,3% visto con el enfoque tradicional de análisis de respuesta que se muestra en la Figura 4 (b). Sin embargo, en este caso hubo una menor frecuencia de falsos positivos en el grupo placebo, y la diferencia entre las tasas de respuesta del grupo de tratamiento fue estadísticamente significativa (p <0,001, Tabla 1). [0058] Figure 4 (d): Applying consistent response analysis (repeated measures) to the same data as Figure 4 (b) selects a non-responding population that is close to the placebo-treated group in its distribution. Only 4 subjects in the placebo group were registered as responders, for a false positive rate of 8.5%. The response rate in the drug-treated group was 37.2%. The pharmacoplacebo response differential was therefore 28.7%, similar to the 29.3% seen with the traditional response analysis approach shown in Figure 4 (b). However, in this case there was a lower frequency of false positives in the placebo group, and the difference between response rates in the treatment group was statistically significant (p <0.001, Table 1).
[0059] Ejemplo 3: La aplicación de esta distribución es particularmente poderosa en el contexto de un análisis de respuesta de medidas repetidas del tipo proporcionado por el Ejemplo 2. Sin embargo, puede ser útil en varias situaciones más simples, por ejemplo, en un caso de muestreo industrial de productos. Podría sospecharse que la planta A está produciendo artículos con una resistencia a la rotura inferior a los de la planta B. Para la prueba destructiva de los artículos de las dos plantas, es probable que deseemos minimizar el tamaño de la muestra. Si tomamos muestras de 5 de cada 100 artículos de la próxima ejecución de producción en cada planta y determinamos que la resistencia a la rotura de más de 2 de estos artículos de la planta A cae por debajo del rango de los 5 probados de la planta B, tendríamos apoyo para la sospecha respecto a una diferencia entre las plantas. Más específicamente, sabríamos que hay menos de un 2,5% de probabilidad, sobre la base de la variabilidad aleatoria (Ejemplo 1), de que 4 o 5 de las muestras de A caigan por debajo del rango de falla para las de la planta B. [0059] Example 3: The application of this distribution is particularly powerful in the context of a repeated measures response analysis of the type provided by Example 2. However, it may be useful in several simpler situations, for example, in a case of industrial sampling of products. Plant A might be suspected of producing articles with a lower breaking strength than plant B. For destructive testing of the articles from the two plants, we likely want to minimize the sample size. If we take samples of 5 out of 100 items from the next production run in each plant and determine that the breaking strength of more than 2 of these items in plant A falls below the range of 5 tested in plant B , we would have support for suspicion regarding a difference between plants. More specifically, we would know that there is less than a 2.5% probability, based on random variability (Example 1), that 4 or 5 of the samples from A fall below the failure range for those from plant B.
[0060] La distribución de disparidad de rango, por lo tanto, describe el comportamiento esperado de dos pequeñas muestras de una población común. Específicamente, define la probabilidad de que cualquier número dado de valores en una muestra de esa población caiga fuera del rango de valores en la otra muestra, ya sea en la dirección positiva o negativa. Esta distribución se puede aplicar a formas novedosas de análisis estadístico de muestras pequeñas. Se describe un ejemplo de aplicación a un análisis de respuesta de medidas repetidas en un ensayo clínico. La definición de una respuesta consistente, basada en la distribución de disparidad del rango de muestra, mejora la sensibilidad, así como el significado estadístico y clínico de dicho análisis. [0060] The range disparity distribution, therefore, describes the expected behavior of two small samples from a common population. Specifically, it defines the probability that any given number of values in one sample from that population will fall outside the range of values in the other sample, either in the positive or negative direction. This distribution can be applied to novel forms of statistical analysis of small samples. An example of application to a repeated measures response analysis in a clinical trial is described. The definition of a consistent response, based on the disparity distribution of the sample range, improves the sensitivity, as well as the statistical and clinical significance of said analysis.
[0061] Ejemplo 4: Además, el método, el sistema y el software de la presente invención se utilizaron en las pruebas de Fampridina-SR sobre la caminata de personas con esclerosis múltiple (EM) durante un ensayo de fase 3, cuyos resultados se anunciaron el 25 de septiembre de 2006. En particular, este ensayo clínico de fase 3 de Fampridina-SR para caminar en personas con esclerosis múltiple (EM) fue una confirmación de la pertinencia del enfoque inventivo. Al utilizar el método, sistema y software de la presente invención, se logró significación estadística en los tres criterios de eficacia definidos en la Evaluación de Protocolo Especial (SPA) por la Administración de Alimentos y Medicamentos (FDA). Como resultado de la utilización de las técnicas inventivas, una proporción significativamente mayor de personas que tomaron Fampridina-SR tuvieron una mejora constante en la velocidad de la caminata, el resultado primario del estudio, en comparación con las personas que tomaron placebo (34,8 por ciento frente a 8,3 por ciento) según lo medido por Caminata Cronometrada de 25 pies (p menor que 0,001). Además, el efecto se mantuvo en este estudio durante todo el período de tratamiento de 14 semanas (p menor que 0,001) y hubo una mejoría estadísticamente significativa en la Escala de caminata EM de 12 ítems (MSWS-12) para respondedores de caminata frente a los no respondedores (p menor que 0,001). El aumento promedio en la velocidad de la caminata durante el período de tratamiento en comparación con el valor inicial fue del 25,2 por ciento para el grupo que respondió al medicamento frente al 4,7 por ciento para el grupo placebo. Se observó una mayor tasa de respuesta en la caminata cronometrada de 25 pies en los cuatro tipos principales de EM. Además, se observaron aumentos estadísticamente significativos en la fuerza de las piernas tanto en los respondedores Fampridina-SR caminata cronometrada (p menos de 0,001) como en los no respondedores Fampridina-SR caminata cronometrada (p = 0,046) en comparación con el placebo. [0061] Example 4: In addition, the method, system and software of the present invention were used in the Fampridine-SR tests on walking of people with multiple sclerosis (MS) during a phase 3 trial, the results of which were announced on September 25, 2006. In particular, this phase 3 clinical trial of Fampridine-SR for walking in people with multiple sclerosis (MS) was confirmation of the relevance of the inventive approach. By using the method, system and software of the present invention, statistical significance was achieved in the three efficacy criteria defined in the Special Protocol Assessment (SPA) by the Food and Drug Administration (FDA). As a result of using inventive techniques, a significantly higher proportion of people taking Fampridine-SR had a constant improvement in walking speed, the primary outcome of the study, compared to people taking placebo (34.8 percent vs. 8.3 percent) as measured by the 25-foot Timed Walk (p less than 0.001). Furthermore, the effect was maintained in this study throughout the 14-week treatment period (p less than 0.001) and there was a statistically significant improvement in the 12-item MS Walk Scale (MSWS-12) for walk-versus-walk responders. non-responders (p less than 0.001). The average increase in walking speed during the treatment period compared to baseline was 25.2 percent for the group that responded to the medication versus 4.7 percent for the placebo group. A higher response rate was observed on the 25-foot timed walk in the four main types of MS. In addition, statistically significant increases in leg strength were observed in both timed walk Fampridine-SR responders (p less than 0.001) and timed walk Fampridine-SR non-responders (p = 0.046) compared to placebo.
[0062] Aunque la presente invención ha sido descrita en considerable detalle con referencia a ciertas realizaciones preferidas de la misma, son posibles otras versiones. Por lo tanto, el alcance de las reivindicaciones adjuntas no debe limitarse a la descripción y las versiones preferidas contenidas dentro de esta especificación. [0062] Although the present invention has been described in considerable detail with reference to certain preferred embodiments thereof, other versions are possible. Therefore, the scope of the appended claims should not be limited to the description and preferred versions contained within this specification.
Apéndice AAppendix a
[0063] El texto a continuación se reproduce simplemente con fines ilustrativos, es un extracto de la patente de la Solicitud de Estados Unidos n° 11/102.559, cuya totalidad se incorpora a la presente como referencia. [0063] The text below is reproduced for illustrative purposes only, is an excerpt from US Patent Application No. 11 / 102,559, the entirety of which is incorporated herein by reference.
EJEMPLO 5EXAMPLE 5
[0064] Este ejemplo proporciona una realización de un método de tratamiento de sujetos con una formulación de liberación sostenida de fampridina y un análisis de respondedores de la presente invención. Este fue un estudio de tratamiento de fase 2, doble ciego, controlado con placebo, de grupo paralelo, de 20 semanas en 206 sujetos diagnosticados con esclerosis múltiple. Este estudio fue diseñado para investigar la seguridad y la eficacia de tres niveles de dosis de Fampridina-SR, 10 mg bid, 15 mg b.i.d. y 20 mg b.i.d.en sujetos con EM clínicamente definida. El criterio de valoración principal de eficacia fue un aumento, en relación con la línea de base, en la velocidad de caminata, en la caminata cronometrada de 25 pies. Las medidas de eficacia secundarias incluyeron pruebas manuales de los músculos de las extremidades inferiores en cuatro grupos de músculos de las extremidades inferiores (flexores de cadera, flexores de rodilla, extensores de rodilla y dorsiflexores de tobillo); la prueba de clavija de 9 hoyos y la prueba de adición auditiva en serie estimulada (PASAT 3”); la puntuación de Ashworth para espasticidad; puntuaciones de frecuencia/gravedad de espasmos; así como las impresiones globales de un clínico (CGI) y de sujeto (SGI), la impresión global de un sujeto (SGI), el Inventario de calidad de vida de esclerosis múltiple (MSQLI) y la Escala de caminata EM de 12 elementos (Ms Ws -12). [0064] This example provides an embodiment of a method of treating subjects with a sustained release formulation of fampridine and a responder analysis of the present invention. This was a 20-week, parallel group, double-blind, placebo-controlled phase 2 treatment study in 206 subjects diagnosed with multiple sclerosis. This study was designed to investigate the safety and efficacy of three dose levels of Fampridine-SR, 10 mg bid, 15 mg bid and 20 mg biden subjects with clinically defined MS. The primary efficacy endpoint was an increase, relative to baseline, in walking speed, in the 25-foot timed walk. Secondary measures of efficacy included manual testing of the lower limb muscles in four groups of lower limb muscles (hip flexors, knee flexors, knee extensors, and ankle dorsiflexors); the 9-hole plug test and the stimulated serial auditory addition test (PASAT 3 ”); the Ashworth score for spasticity; spasm frequency / severity scores; as well as the global impressions of a clinician (CGI) and of the subject (SGI), the global impression of a subject (SGI), the Multiple Sclerosis Quality of Life Inventory (MSQLI) and the 12-element MS Walking Scale ( Ms Ws -12).
[0065] En la primera visita (Visita 0) los sujetos habrían que entrar en un período de dos semanas con placebo, simple ciego, el periodo de experimentación con el propósito de establecer los niveles de referencia de la función. En la visita 2, los sujetos debían asignarse al azar a uno de los cuatro grupos de tratamiento (Placebo o Fampridina-SR 10 mg, 15 mg, 20 mg) y comenzar dos semanas de aumento de la dosis doble ciego en los grupos de tratamiento farmacológico activo (B, C y D). El grupo A debía recibir placebo durante todo el estudio. Los sujetos en el grupo de 10 mg (Grupo B) del estudio tomaron una dosis de 10 mg aproximadamente cada 12 horas durante las dos semanas de la fase de escalada. Los sujetos con dosis de 15 mg (Grupo C) y 20 mg (Grupo D) tomaron una dosis de 10 mg aproximadamente cada 12 horas durante la primera semana de la fase de escalado y se titularon hasta 15 mg dos veces en la segunda semana. Los sujetos debían recibir instrucciones de cumplir con un horario de dosificación "cada 12 horas". Se aconsejó a cada sujeto que tomara el medicamento aproximadamente a la misma hora cada día durante todo el estudio; sin embargo, diferentes sujetos tenían diferentes horarios de medicación (p. ej., 7:00 y 19:00, o 9:00 y 21:00). Después de dos semanas, los sujetos debían regresar a la clínica en la Visita 3 para comenzar el período de tratamiento de dosis estable. La primera dosis de la fase de tratamiento doble ciego en la dosis diana final (oferta de placebo para el Grupo A, oferta de 10 mg para el Grupo B, oferta de 15 mg para el Grupo C y oferta de 20 mg para el Grupo D) por la noche después de la visita de estudio 4. Los sujetos debían ser evaluados cinco veces durante el período de tratamiento de 12 semanas. Después de la fase de tratamiento de 12 semanas, debía haber una titulación descendente de una semana a partir de la Visita 9. Durante este período de titulación descendente, el grupo B debía permanecer estable a 10 mg dos veces y el Grupo C debía titularse a 10 mg dos veces., mientras que el grupo D tenía un cambio en el nivel de dosis durante la semana (15 mg b.i.d. durante los primeros tres días y 10 mg b.i.d. durante los últimos cuatro días). Al final del período de titulación descendente en la Visita 10, los sujetos debían ingresar a un período de lavado de dos semanas en el que no recibieron ningún medicamento del estudio. La última visita (Visita 11) debía programarse dos semanas después del último día de dosificación (fin de la valoración descendente). Las muestras de plasma se recogieron en cada sitio de estudio que no sea Visita de Estudio 0. [0065] At the first visit (Visit 0) the subjects would have to enter a two-week period with placebo, single blind, the period of experimentation in order to establish the reference levels of the function. At visit 2, subjects were to be randomized to one of the four treatment groups (Placebo or Fampridine-SR 10 mg, 15 mg, 20 mg) and to start two weeks of double-blind dose increase in the treatment groups. pharmacological active (B, C and D). Group A was to receive placebo throughout the study. Subjects in the 10 mg group (Group B) of the study took a 10 mg dose approximately every 12 hours during the two weeks of the escalation phase. Subjects with 15 mg (Group C) and 20 mg (Group D) doses took a 10 mg dose approximately every 12 hours during the first week of the escalation phase and were titrated up to 15 mg twice in the second week. Subjects were to be instructed to adhere to a dosing schedule "every 12 hours." Each subject was advised to take the medication at approximately the same time each day throughout the study; however, different subjects had different medication schedules (eg, 7:00 a.m. and 7:00 p.m., or 9:00 a.m. and 21:00). After two weeks, subjects were to return to the clinic at Visit 3 to begin the stable dose treatment period. The first dose of the double-blind treatment phase in the final target dose (placebo offer for Group A, 10 mg offer for Group B, 15 mg offer for Group C and 20 mg offer for Group D ) in the evening after the study visit 4. Subjects had to be evaluated five times during the 12-week treatment period. After the 12-week treatment phase, there should be a one-week descending titration from Visit 9. During this descending titration period, Group B should remain stable at 10 mg twice and Group C should be titrated to 10 mg twice., While group D had a change in dose level during the week (15 mg bid during the first three days and 10 mg bid during the last four days). At the end of the descending titration period at Visit 10, subjects were required to enter a two-week washout period in which they received no study medication. The last visit (Visit 11) had to be scheduled two weeks after the last day of dosing (end of down titration). Plasma samples were collected at each study site other than Study Visit 0.
[0066] La medida principal de eficacia fue la mejora en la velocidad media a pie, en relación con el período de referencia (con placebo), utilizando la caminata a pie programada 25 de la puntuación compuesta funcional de la esclerosis múltiple (MSFC). Esta es una medida cuantitativa de la función de las extremidades inferiores. Se instruyó a los sujetos para que usaran las ayudas de deambulación que normalmente usan y que caminen lo más rápido posible de un extremo al otro de un curso de 25 pies claramente marcado. Otras medidas de eficacia incluyeron el LEMMT, para estimar la fuerza muscular bilateralmente en cuatro grupos de músculos: flexores de cadera, flexores de rodilla, extensores de rodilla y dorsiflexores de tobillo. La prueba se realizó en la visita de selección y en las visitas de estudio 1,2, 4, 7, 8, 9 y 11. La fuerza de cada grupo muscular se calificó en la escala BMRC modificada: 5 = fuerza muscular normal; 4,5 = movimiento voluntario contra resistencia mayor aplicado por el examinador, pero no normal; 4 = movimiento voluntario contra resistencia moderada aplicado por el examinador; 3,5 = movimiento voluntario contra resistencia leve aplicada por el examinador; 3 = movimiento voluntario contra la gravedad pero no resistencia; 2 = movimiento voluntario presente pero no capaz de vencer la gravedad; 1 = contracción muscular visible o palpable pero sin movimiento de extremidades; y 0 = ausencia de cualquier contracción voluntaria. La espasticidad en cada sujeto se evaluó utilizando la Puntuación de Espasticidad de Ashworth. El examen de espasticidad de Ashworth se realizó y registró en la visita de selección y en las visitas de estudio 1, 2, 4, 7, 8, 9 y 11. [0066] The main measure of efficacy was improvement in mean walking speed, relative to the reference period (with placebo), using the 25 scheduled walking walk of the Multiple Sclerosis Functional Composite Score (MSFC). This is a quantitative measure of the function of the lower extremities. Subjects were instructed to use the walking aids they normally use and to walk as quickly as possible from one end to the other of a clearly marked 25-foot course. Other measures of efficacy included the LEMMT, to estimate muscle strength bilaterally in four muscle groups: hip flexors, knee flexors, knee extensors, and ankle dorsiflexors. The test was performed at the screening visit and study visits 1,2, 4, 7, 8, 9 and 11. The strength of each muscle group was rated on the modified BMRC scale: 5 = normal muscle strength; 4.5 = voluntary movement against increased resistance applied by the examiner, but not normal; 4 = voluntary movement against moderate resistance applied by the examiner; 3.5 = voluntary movement against light resistance applied by the examiner; 3 = voluntary movement against gravity but not resistance; 2 = voluntary movement present but not able to overcome gravity; 1 = visible or palpable muscle contraction but no limb movement; and 0 = absence of any voluntary contraction. Spasticity in each subject was evaluated using the Ashworth Spasticity Score. Ashworth's spasticity examination was performed and recorded at the screening visit and study visits 1, 2, 4, 7, 8, 9, and 11.
[0067] Análisis de respondedor de protocolo especificado. Para complementar el análisis primario, también se realizó un análisis categórico de "respondedor". La respuesta exitosa se definió para cada sujeto como una mejora en la velocidad de caminata (cambio porcentual desde el inicio) de al menos 20%. Los sujetos que abandonaron antes del período de dosis estable se consideraron no respondedores. Las proporciones de los respondedores especificados por el protocolo se compararon entre los grupos de tratamiento mediante la prueba de Cochran-Mantel-Haenszel, que controla el centro. [0067] Respondent analysis of specified protocol. To complement the primary analysis, a categorical "responder" analysis was also performed. The successful response was defined for each subject as an improvement in walking speed (percentage change from baseline) of at least 20%. Subjects who dropped out before the stable dose period were considered non-responders. The proportions of the responders specified by the protocol were compared between the treatment groups using the Cochran-Mantel-Haenszel test, which controls the center.
[0068] El análisis post hoc de este estudio sugiere que un criterio relativamente muy selectivo para un respondedor de tratamiento probablemente sería un sujeto con una velocidad de caminar más rápido durante al menos tres visitas durante el período de tratamiento doble ciego, en comparación con el valor máximo entre un conjunto de cinco visitas sin tratamiento (cuatro antes del tratamiento y uno después de la interrupción del tratamiento). Las cuatro visitas antes del inicio del tratamiento doble ciego proporcionaron una línea de base inicial contra la cual medir la consistencia de la respuesta durante las cuatro visitas de tratamiento doble ciego. La inclusión de la visita de seguimiento como un componente adicional de la comparación fue útil principalmente para excluir a aquellos sujetos que pueden ser falsos positivos, es decir, no mostraron la pérdida esperada de mejoría después de dejar el medicamento. Las diferencias de tratamiento en la proporción de estas respuestas post hoc se analizaron mediante la prueba de Cochran-Mantel-Haenszel (CMH), controlando el centro. [0068] The post hoc analysis of this study suggests that a relatively highly selective criterion for a treatment responder would likely be a subject with a faster walking speed for at least three visits during the double-blind treatment period, compared to maximum value between a set of five visits without treatment (four before treatment and one after treatment interruption). The four visits before the start of the double-blind treatment provided an initial baseline against which to measure the consistency of the response during the four visits of the double-blind treatment. The inclusion of the follow-up visit as an additional component of the comparison was useful mainly to exclude those subjects who may be false positives, that is, they did not show the expected loss of improvement after stopping the medication. Treatment differences in the proportion of these post hoc responses were analyzed using the Cochran-Mantel-Haenszel (CMH) test, controlling for the center.
[0069] Para validar el significado clínico de la variable de respondedor post hoc, se compararon (post hoc) respondedores con los no respondedores (post hoc), en las variables subjetivas: (i) Cambio desde el inicio en MSWS-12 sobre el doble ciego; (ii) SGI sobre el doble ciego; y (iii) Cambio desde la línea de base en el CGI sobre el doble ciego; para determinar si los sujetos con velocidades de caminata consistentemente mejoradas durante el doble ciego podrían percibir una mejora en relación con aquellos sujetos que no tuvieron velocidades de caminata consistentemente mejoradas. Para las variables subjetivas, las diferencias entre la clasificación del estado del respondedor (respondedor o no respondedor) se compararon utilizando un modelo ANOVA con efectos para el estado del respondedor y el centro. [0069] To validate the clinical significance of the post hoc responder variable, responders were compared (post hoc) with non-responders (post hoc), in the subjective variables: (i) Change from baseline in MSWS-12 on the double-blind; (ii) SGI on double blind; and (iii) change from the baseline in the CGI on the double blind; to determine whether subjects with consistently improved walking speeds during double-blind could perceive an improvement relative to those subjects who did not have consistently improved walking speeds. For subjective variables, the differences between the responder status classification (responder or non-responder) were compared using an ANOVA model with effects for responder and center status.
[0070] Resultados. Un total de 206 sujetos fueron asignados al azar al estudio: 47 fueron asignados a placebo, 52 a 10 mg dos veces al día Fampridina-SR (10 mg dos veces al día), 50 a 15 mg dos veces al día Fampridina-SR (15 mg dos veces al día) y 57 a 20 mg Fampridina-SR (20 mg b.i.d.). La disposición de los sujetos se presenta en la Tabla 5 a continuación. [0070] Results. A total of 206 subjects were randomized to the study: 47 were assigned to placebo, 52-10 mg twice daily Fampridine-SR (10 mg twice daily), 50-15 mg twice daily Fampridine-SR ( 15 mg twice a day) and 57 to 20 mg Fampridine-SR (20 mg bid). The disposition of the subjects is presented in Table 5 below.
Tabla 5 Resumen de la disposición del sujeto (toda la población aleatorizada)Table 5 Summary of the subject's disposition (the entire randomized population)

[0071] Todos los 206 sujetos asignados al azar tomaron al menos una dosis de la medicación del estudio y fueron incluidos en la población de seguridad. Un sujeto (sujeto n° 010/07 grupo bid de 10 mg) fue excluido de la población de ITT (perdido durante el seguimiento después de 8 días de placebo). Un total de 11 sujetos abandonaron el estudio. [0071] All 206 randomized subjects took at least one dose of study medication and were included in the safety population. One subject (subject # 010/07 10 mg bid group) was excluded from the ITT population (lost to follow up after 8 days of placebo). A total of 11 subjects dropped out of the study.
[0072] La población estuvo constituida por 63,6% mujeres y 36,4% varones. La mayoría de los sujetos eran caucásicos (92,2%), seguidos de negros (4,9%), hispanos (1,5%), los clasificados como “otros” (1,0%) e isleños de Asia/Pacífico (0,5%). La edad, el peso y la estatura promedio de los sujetos fueron 49,8 años (intervalo: 28-69 años), 74,44 kilogramos (rango: 41,4-145,5 kilogramos) y 168,84 centímetros (rango: 137,2-200,7 centímetros), respectivamente. La mayoría de los sujetos (52,4%) tenían un tipo de diagnóstico secundario progresivo con cantidades aproximadamente iguales de remitente recurrente (22,8%) y primario progresivo (24,8%). La duración media de la enfermedad fue de 12,00 años (intervalo: 0,1-37,5 años), mientras que la escala de estado de discapacidad expandida (EDSS) en el cribado fue de 5,77 unidades (intervalo: 2,5-6,5 unidades). Los grupos de tratamiento fueron comparables con respecto a todas las variables demográficas basales y características de la enfermedad. [0072] The population consisted of 63.6% women and 36.4% men. The majority of the subjects were Caucasian (92.2%), followed by Blacks (4.9%), Hispanics (1.5%), those classified as “other” (1.0%) and Asia / Pacific Islanders. (0.5%). The subjects' average age, weight, and height were 49.8 years (range: 28-69 years), 74.44 kilograms (range: 41.4-145.5 kilograms), and 168.84 centimeters (range: 137.2-200.7 centimeters), respectively. Most of the subjects (52.4%) had a type of progressive secondary diagnosis with approximately equal amounts of recurrent (22.8%) and progressive primary (24.8%). The average duration of the disease was 12.00 years (range: 0.1-37.5 years), while the expanded disability status scale (EDSS) at screening was 5.77 units (range: 2 , 5-6.5 units). Treatment groups were comparable with respect to all baseline demographic variables and disease characteristics.
[0073] Los resultados para las variables clave de eficacia al inicio del estudio para la población de ITT se resumen adicionalmente en la Tabla 6 a continuación. [0073] The results for the key efficacy variables at the start of the study for the ITT population are further summarized in Table 6 below.
Tabla 6 Resumen de variables clave de eficacia al inicio del estudio (población ITT)Table 6 Summary of key efficacy variables at baseline (ITT population)

[0074] Con respecto a los 205 sujetos en la población ITT, los valores medios de la velocidad de marcha de línea de base, LEEMT, SGI, y MSWS-12 fueron aproximadamente 2 pies por segundo, 4 unidades, 4,5 unidades y 76 unidades, respectivamente. Los grupos de tratamiento fueron comparables con respecto a estas variables, así como a todas las demás variables de eficacia al inicio del estudio. [0074] Regarding the 205 subjects in the ITT population, the mean values of the baseline walking speed, LEEMT, SGI, and MSWS-12 were approximately 2 feet per second, 4 units, 4.5 units and 76 units, respectively. The treatment groups were comparable with respect to these variables, as well as to all other efficacy variables at the start of the study.
[0075] Las estadísticas descriptivas para la velocidad de caminata promedio (pies/seg) por día de estudio basado en la caminata cronometrada de 25 pies se presentan en la Tabla 7 y la Figura 2. La caminata cronometrada de 25 pies mostró una tendencia hacia una mayor velocidad durante el período de dosis estable para los tres grupos de dosis, aunque la mejora promedio disminuyó durante el período de tratamiento. [0075] Descriptive statistics for average walking speed (feet / sec) per study day based on 25-foot timed walk are presented in Table 7 and Figure 2. The 25-foot timed walk showed a trend toward greater speed during the stable dose period for all three dose groups, although the average improvement decreased during the treatment period.
Tab la 7 Velocidades promedio de caminata (pies/seg) por día de estudio (casos observados, población ITT)Tab la 7 Average walking speeds (feet / sec) per study day (observed cases, ITT population)

Durante el tratamiento doble ciego, todos los grupos de Fampridina-SR exhibieron velocidades de caminata promedio entre 2,00 y 2,26 pies por segundo, mientras que el valor promedio en el grupo placebo fue consistentemente de aproximadamente 1.90 pies por segundo. Se debe tener en cuenta que, en la tercera visita de dosis estable, tanto el grupo de 10 mg de oferta como el de 20 mg significan un abandono de lo que se esperaría bajo el supuesto de que el beneficio del tratamiento es consistente con el tiempo. Esto puede o no haber sido debido al azar; Los estudios adicionales deben proporcionar evidencia adicional para cualquier caso. Después de suspender la medicación doble ciego, todos los grupos de tratamiento convergieron aproximadamente al mismo valor medio en el seguimiento.During the double-blind treatment, all Fampridine-SR groups exhibited average walking speeds between 2.00 and 2.26 feet per second, while the average value in the placebo group was consistently approximately 1.90 feet per second. It should be noted that, on the third stable dose visit, both the 10 mg supply and 20 mg groups signify an abandonment of what would be expected under the assumption that the benefit of treatment is consistent over time. . This may or may not have been due to chance; Additional studies should provide additional evidence for any case. After stopping the double-blind medication, all treatment groups converged at approximately the same mean value at follow-up.
[0076] Los resultados para la variable de eficacia primaria (cambio porcentual en la velocidad de caminata promedio durante el período de dosis estable de 12 semanas en relación con la línea base basada en la caminata de 25 pies) se resumen en la Figura 3. La caminata cronometrada de 25 pies mostró una tendencia hacia aumento de la velocidad durante el período de dosis estable para los tres grupos de dosis, aunque la mejoría promedio disminuyó durante el período de tratamiento, como se muestra en la Figura 3. El porcentaje promedio cambia en la velocidad promedio de caminata durante el período de dosis estable de 12 semanas (basado en el ajuste geométrico el cambio medio de las velocidades de caminata transformadas logarítmicamente) fue de 2,5%, 5,5%, 8,4% y 5,8% para los grupos de placebo, 10 mg b.i.d., 15 mg de oferta y 20 mg b.i.d., respectivamente. No hubo diferencias estadísticas entre los grupos Fampridina-SR y el grupo placebo. [0076] The results for the primary efficacy variable (percentage change in average walking speed during the 12-week stable dose period relative to the baseline based on the 25-foot walk) are summarized in Figure 3. The 25-foot timed walk showed a trend toward increased speed during the stable dose period for all three dose groups, although the average improvement decreased during the treatment period, as shown in Figure 3. The average percentage changes in the mean walking speed during the 12-week stable dose period (based on the geometric fit the mean change in logarithmically transformed walking speeds) was 2.5%, 5.5%, 8.4% and 5 , 8% for the placebo groups, 10 mg bid, 15 mg bid and 20 mg bid, respectively. There were no statistical differences between the Fampridine-SR groups and the placebo group.
[0077] Los resultados para el análisis del respondedor especificado por protocolo (sujetos con cambios promedio en la velocidad de caminata durante las 12 semanas de tratamiento doble ciego estable de al menos 20%) se resumen en la Figura 4. Los porcentajes de sujetos con cambios promedio en la velocidad de caminata durante el período de dosis estable de 12 semanas de al menos 20% (respondedores predefinidos) fueron 12,8%, 23,5%, 26,5% y 16,1% para los grupos de placebo, 10 mg dos veces, 15 mg dos veces y 20 mg dos veces, respectivamente. No hubo diferencias estadísticamente significativas entre ninguno de los grupos Fampridina-SR y el grupo placebo. [0077] The results for the protocol-specified responder analysis (subjects with average changes in walking speed during the 12 weeks of stable double-blind treatment of at least 20%) are summarized in Figure 4. The percentages of subjects with Average changes in walking speed during the 12-week stable dose period of at least 20% (predefined responders) were 12.8%, 23.5%, 26.5%, and 16.1% for the placebo groups. , 10 mg twice, 15 mg twice and 20 mg twice, respectively. There was no statistically significant difference between any of the Fampridine-SR groups and the placebo group.
[0078] Las estadísticas descriptivas para la Prueba Muscular Manual de Extremidad Inferior general promedio (LEMMT) por día de estudio se presentan en la Tabla 8 y en la Figura 5. [0078] Descriptive statistics for the Average General Lower Extremity Manual Muscle Test (LEMMT) per study day are presented in Table 8 and Figure 5.
Tabla 8. LEMMT promedio global por día de estudioTable 8. Overall Average LEMMT per Study Day
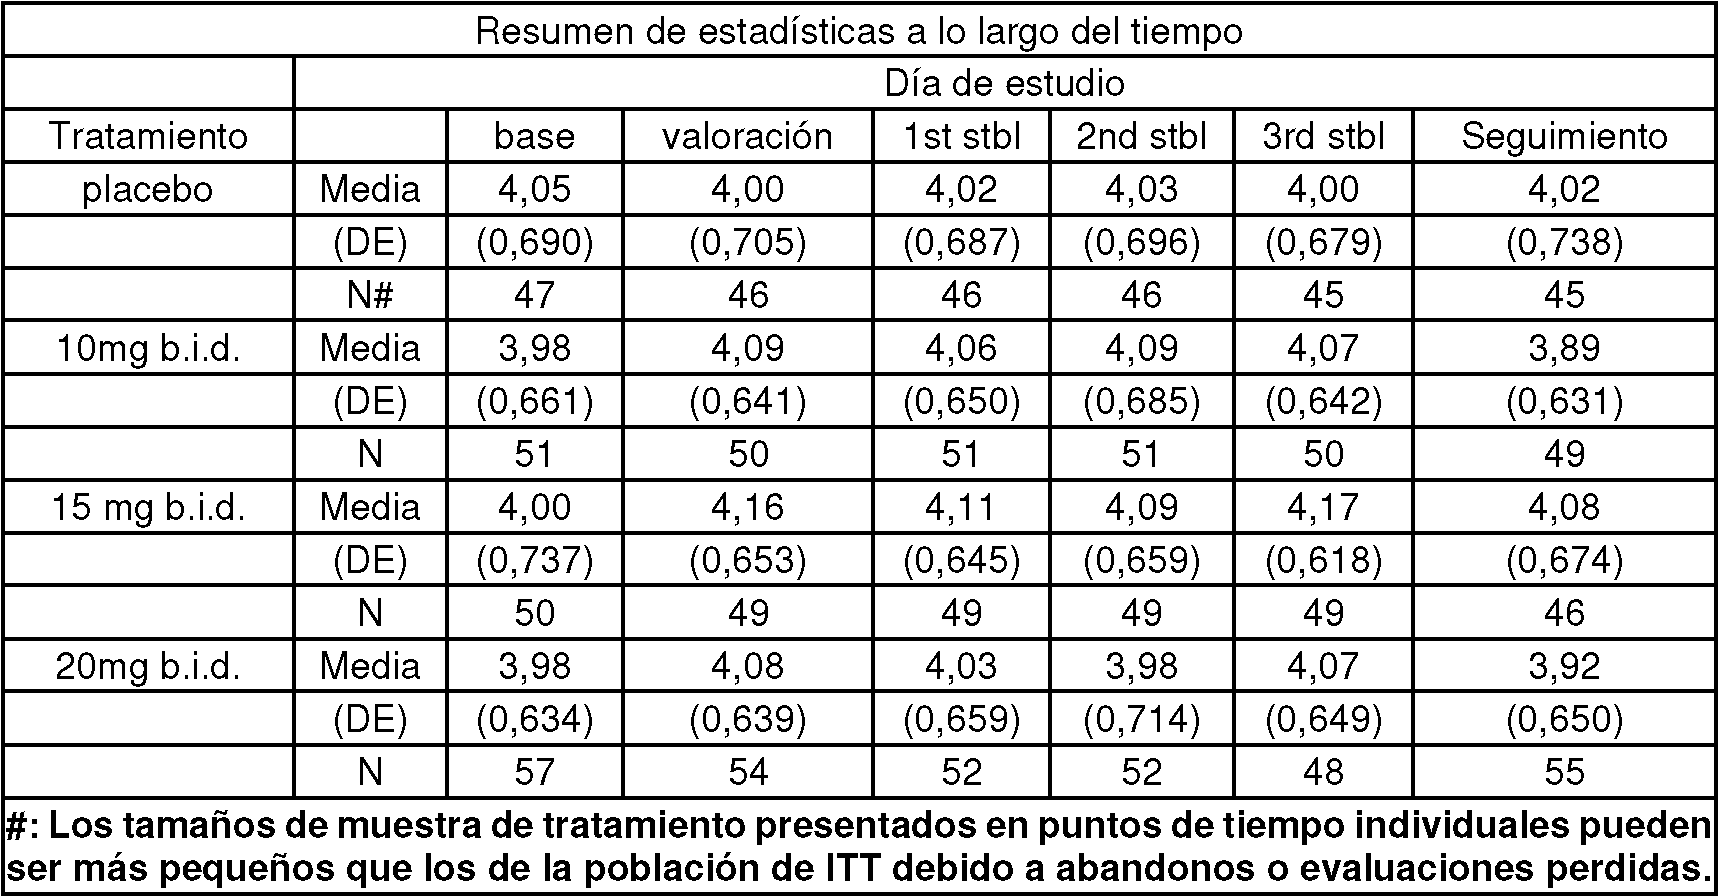
[0079] Durante el tratamiento de doble ciego, todos los grupos de fampridina-SR mostraron un patrón numérico de las puntuaciones de LEMMT medias más grandes que el placebo (excepto el grupo de 20 mg b.i.d. en la 2a visita de dosis estable). Después de suspender la medicación doble ciego, con la excepción del grupo de 15 mg b.i.d., todos los medios del grupo fueron más bajos de lo que eran al inicio del estudio. [0079] During double-blind treatment, all fampridine-SR groups showed a numerical pattern of mean LEMMT scores larger than placebo (except the 20 mg bid group at the 2nd stable dose visit). After stopping the double-blind medication, with the exception of the 15 mg bid group, all media in the group were lower than they were at the start of the study.
[0080] Los resultados para el cambio promedio en LEMMT durante el período de dosis estable de 12 semanas con respecto al valor basal se resumen en la Figura 6. Los cambios medios en LEMMT general durante el período de dosis estable de 12 semanas fueron -0,05 unidades, 0,10 unidades, 0,13 unidades y 0,05 unidades para los grupos placebo, 10 mg b.i.d., 15 mg b.i.d.y 20 mg b.i.d., respectivamente. Las mejoras en LEMMT fueron significativamente mayores en los grupos de 10 mg y 15 mg en comparación con el grupo placebo; no hubo diferencias significativas entre el grupo de 20 mg b.i.d. y el grupo placebo. [0080] The results for the mean change in LEMMT during the 12-week stable dose period from baseline are summarized in Figure 6. The mean changes in overall LEMMT during the 12-week stable dose period were -0 , 05 units, 0.10 units, 0.13 units and 0.05 units for the placebo groups, 10 mg bid, 15 mg bid and 20 mg bid, respectively. The improvements in LEMMT were significantly greater in the 10 mg and 15 mg groups compared to the placebo group; there was no significant difference between the 20 mg bid group and the placebo group.
[0081] No se detectaron diferencias estadísticamente significativas entre el grupo de tratamiento basado en cualquiera de las otras variables secundarias de eficacia, como se muestra en la Tabla 9. [0081] No statistically significant difference was detected between the treatment group based on any of the other secondary efficacy variables, as shown in Table 9.
Tabla 9. Cambios desde el inicio durante el período de dosis estable de 12 semanas en variables de eficacia secundaria seleccionadas (casos observados, población ITT)Table 9. Changes from baseline during the 12-week stable dose period in selected secondary efficacy variables (observed cases, ITT population)

(continúa)(keep going)

[0082] Mientras que los análisis pre-planificados de la variable principal de eficacia proporcionaron pruebas suficientes de los beneficios del tratamiento para ninguna de las dosis Fampridina-SR, el análisis posterior reveló la existencia de un subconjunto de sujetos que respondieron al fármaco con utilidad clínica. Estos sujetos exhibieron velocidades de caminata mientras tomaban drogas que eran consistentemente mejores que las velocidades de caminata más rápidas medidas cuando los sujetos no tomaban drogas activas. [0082] While pre-planned analyzes of the primary efficacy endpoint provided sufficient evidence of treatment benefits for none of the Fampridine-SR doses, subsequent analysis revealed the existence of a subset of subjects who responded to the drug with utility. clinic. These subjects exhibited walking speeds while taking drugs that were consistently better than the fastest walking speeds measured when the subjects were not taking active drugs.
[0083] Las tasas de respuesta post hoc basadas en la consistencia de la mejora de velocidades de marcha fueron significativamente mayores en los tres grupos de dosis activas (35, 36 y 39%) en comparación con placebo (9%; p<0,006 para cada grupo de dosis, ajustando para múltiples comparaciones) como se muestra en la Figura 7. [0083] Post hoc response rates based on consistency of gait improvement were significantly higher in all three active dose groups (35, 36, and 39%) compared to placebo (9%; p <0.006 for each dose group, adjusting for multiple comparisons) as shown in Figure 7.
[0084] Dado que hubo poca diferencia en la capacidad de respuesta entre las tres dosis examinadas, se realizaron análisis más detallados comparando los grupos tratados Fampridina-SR agrupados contra el grupo tratado con placebo. La Figura 8 resume, para el grupo placebo y el grupo Fampridina-SR agrupado, el porcentaje de respondedores post hoc. El número de sujetos que cumplieron con el criterio de respuesta post hoc en el grupo agrupado tratado con Fampridina-SR fue 58 (36,7%) en comparación con 4 (8,5%) en el grupo tratado con placebo, y esta diferencia fue estadísticamente significativa (p <0,001). [0084] Since there was little difference in responsiveness between the three doses examined, more detailed analyzes were performed comparing the Fampridine-SR treated groups pooled against the placebo treated group. Figure 8 summarizes, for the placebo group and the grouped Fampridine-SR group, the percentage of post hoc responders. The number of subjects who met the post hoc response criteria in the grouped group treated with Fampridine-SR was 58 (36.7%) compared to 4 (8.5%) in the group treated with placebo, and this difference it was statistically significant (p <0.001).
[0085] Para validar el significado clínico de la variable de respondedor post hoc, los 62 respondedores (58 fampridina y 4 placebo) fueron comparados contra los 143 no respondedores (100 fampridina y 43 placebo) en las variables subjetivas para determinar si los sujetos con velocidades de caminata consistentemente mejoradas durante el doble ciego podrían percibir un beneficio en relación con aquellos sujetos que no tenían velocidades de caminata consistentemente mejoradas. Los resultados se resumen en la Figura 9 e indican que la consistencia en la velocidad de la caminata tuvo significación clínica para los sujetos en este estudio ya que los respondedores tuvieron (durante el período doble ciego) cambios significativamente mejores desde el inicio en el MSWS-12 y puntajes globales subjetivos significativamente mejores. Además, los respondedores fueron calificados marginalmente mejor que los no respondedores por los médicos durante el doble ciego. Por lo tanto, los respondedores experimentaron mejoras clínicamente significativas en sus síntomas de EM, y el tratamiento con fampridina aumentó significativamente las posibilidades de tal respuesta. [0085] To validate the clinical significance of the post hoc responder variable, the 62 responders (58 fampridine and 4 placebo) were compared against the 143 nonresponders (100 fampridine and 43 placebo) on the subjective variables to determine whether subjects with Consistently improved walking speeds during double-blind could perceive a benefit relative to those subjects who did not have consistently improved walking speeds. The results are summarized in Figure 9 and indicate that the consistency in the walking speed had clinical significance for the subjects in this study since the responders had (during the double-blind period) significantly better changes from baseline in the MSWS- 12 and significantly better subjective overall scores. Furthermore, responders were rated marginally better than non-responders by clinicians during double-blind. Thus, responders experienced clinically significant improvements in their MS symptoms, and treatment with fampridine significantly increased the chances of such a response.
[0086] Para establecer la comparabilidad inicial entre los grupos de análisis de respuesta, los análisis se realizaron sobre las variables demográficas basales, características neurológicas clave y las variables de eficacia relevantes en la línea base. En general, los grupos de análisis de respuesta fueron comparables para todas las variables de características demográficas y basales. [0086] To establish baseline comparability between response analysis groups, analyzes were performed on baseline demographic variables, key neurological characteristics, and relevant efficacy variables at baseline. In general, the response analysis groups were comparable for all the variables of demographic and baseline characteristics.
[0087] Habiendo demostrado la utilidad clínica de mejores velocidades de marcha consistentemente durante el doble ciego como criterio de la capacidad de respuesta, la cuestión de la magnitud del beneficio es de interés. Las diferencias observadas entre los respondedores de fampridina y el grupo placebo para las variables funcionales en este estudio son exactamente lo que esperaríamos ver en las variables funcionales en un estudio de enriquecimiento en el que después de un período inicial, solo se ingresan los respondedores de fampridina, seguidos de un lavado y aleatorización a placebo o fampridina. Los no respondedores de fampridina, aunque no brindan información de eficacia relevante, sí brindan información de seguridad con respecto a aquellas personas que reciben tratamiento con fampridina pero no muestran ningún beneficio clínico aparente. Como tal, se realizaron análisis de respuesta de estos grupos. [0087] Having consistently demonstrated the clinical utility of better walking speeds during double blind as a criterion of responsiveness, the question of the magnitude of benefit is of interest. The observed differences between fampridine responders and the placebo group for functional variables in this study are exactly what we would expect to see for functional variables in an enrichment study in which after an initial period only fampridin responders are entered. , followed by washing and randomization to placebo or fampridine. Fampridine non-responders, although they do not provide relevant efficacy information, they do provide safety information regarding those who receive fampridine treatment but show no apparent clinical benefit. As such, response analyzes of these groups.
[0088] Con respecto a la magnitud del beneficio, la Figura 10 y la Tabla 12 a continuación resume los cambios porcentuales en la velocidad de marcha en cada visita de doble ciego por análisis de agrupación de respondedores. La mejoría media para los respondedores de fampridina durante el doble ciego a lo largo de 14 semanas de tratamiento varió de 24,6% a 29,0% en comparación con 1,7% a 3,7% para el grupo placebo; esto fue altamente significativo (p <0,001) en cada visita. Aunque no proporcionan información relevante sobre la eficacia, los resultados para los no respondedores de fampridina también se ilustran y muestran que hubo, y podría haber, un empeoramiento en las velocidades de caminata después de 12 semanas cuando un no respondedor es tratado con fampridina. La mejoría fue estable (+ 3%) a lo largo de 14 semanas de tratamiento, y se asoció con una mejoría en dos medidas globales (escala de caminata de impresión global de sujetos y escala de esclerosis múltiple-12). Los cuatro respondedores al placebo mostraron una mejora del 19% en la velocidad de la caminata, pero había muy pocos sujetos en este grupo para una comparación estadística significativa. El estado de respuesta no se relacionó significativamente con la demografía de referencia, incluido el tipo o la gravedad de la EM. Los eventos adversos y las medidas de seguridad fueron consistentes con la experiencia previa de este medicamento. [0088] With respect to the magnitude of the benefit, Figure 10 and Table 12 below summarize the percentage changes in walking speed at each double-blind visit by responder cluster analysis. The mean improvement for fampridine responders during double-blind over 14 weeks of treatment ranged from 24.6% to 29.0% compared to 1.7% to 3.7% for the placebo group; this was highly significant (p <0.001) at each visit. Although they do not provide relevant information on efficacy, the results for fampridine non-responders are also illustrated and show that there was, and could be, a worsening in walking speeds after 12 weeks when a non-responder is treated with fampridine. Improvement was stable (+ 3%) over 14 weeks of treatment, and was associated with improvement on two global measures (Subject Global Impression Walk Scale and Multiple Sclerosis Scale-12). All four placebo responders showed a 19% improvement in walking speed, but there were too few subjects in this group for a meaningful statistical comparison. Response status was not significantly related to baseline demographics, including the type or severity of MS. Adverse events and safety measures were consistent with previous experience of this medication.
Tabla 12. Resumen del cambio porcentual en la velocidad de caminata en cada visita doble ciego por agrupación de análisis de respondedores.Table 12. Summary of the percentage change in walking speed at each double-blind visit by group of respondent analyzes.

[0089] La Figura 11 y la Tabla 13 resumen los cambios en LEMMT en cada visita doble ciego por agrupación de análisis de respondedores. La mejoría media para los respondedores de fampridina durante el doble ciego varió de 0,09 a 0,18 unidades en comparación con -0,04 unidades en cada visita para el grupo placebo; esto fue significativo en cada visita, excepto en la segunda visita de dosis estable (p = 0,106). Aunque no proporciona información de eficacia relevante, los resultados para los no respondedores de fampridina también se ilustran y muestran que hubo, y podría haber, una mejora significativa en la fuerza de las piernas cuando los no respondedores se tratan con fampridina. Esto sugiere que aunque una respuesta clínicamente significativa se puede vincular con aproximadamente el 37% de los sujetos tratados con Fampridina-SR, los sujetos adicionales pueden tener mejoras funcionales en otras variables además de la velocidad al caminar. [0089] Figure 11 and Table 13 summarize the changes in LEMMT at each double-blind visit by cluster of responder analyzes. The mean improvement for fampridine responders during double-blind ranged from 0.09 to 0.18 units compared to -0.04 units at each visit for the placebo group; this was significant at each visit, except at the second stable dose visit (p = 0.106). Although it does not provide relevant efficacy information, the results for fampridine non-responders are also illustrated and show that there was, and could be, a significant improvement in leg strength when non-responders are treated with fampridine. This suggests that although a clinically significant response may be linked to approximately 37% of Fampridine-SR treated subjects, additional subjects may have functional improvements in other variables in addition to walking speed.
Tabla 13. Resumen del cambio porcentual en LEMMT en cada visita doble ciego por grupo de análisis de respondedores.Table 13. Summary of the percentage change in LEMMT at each double-blind visit by group of respondent analyzes.

[0090] La Figura 12 y la Tabla 14, a continuación, resumen los cambios en la puntuación general de Ashworth en cada visita doble ciego por agrupación de análisis de respondedores. La reducción media desde el inicio (indicativo de mejoría) para las respuestas de fampridina durante el doble ciego varió de -0,18 a - 0,11 unidades en comparación con -0,11 a -0,06 para el grupo placebo. Los respondedores de fampridina fueron numéricamente superiores al placebo, pero no hubo pruebas suficientes para detectar diferencias significativas. Aunque parece proporcionar poca información relevante sobre la eficacia, también se ilustran los resultados para los no respondedores de fampridina. [0090] Figure 12 and Table 14, below, summarize the changes in the overall Ashworth score at each double-blind visit by pool of responder analyzes. The mean reduction from baseline (indicative of improvement) for fampridine responses during double-blind ranged from -0.18 to -0.11 units compared to -0.11 to -0.06 for the placebo group. Fampridine responders were numerically superior to placebo, but there was insufficient evidence to detect significant differences. Although it appears to provide little relevant information on efficacy, the results for fampridine non-responders are also illustrated.
Tabla 14. Resumen del cambio en la puntuación general de Ashworth en cada visita doble ciego por grupo de análisis de respondedores.Table 14. Summary of change in overall Ashworth score at each double-blind visit by responder analysis group.

(continúa)(keep going)

[0091] Los eventos adversos reportados más comúnmente antes del tratamiento eran lesión accidental, reportados por 12 (5,8%) sujetos, náuseas, reportados por 9 (4,4%) sujetos, y astenia, diarrea, y parestesia, cada una reportada por 8 (3,9% ) sujetos. Seis (2,9%) sujetos también informaron dolor de cabeza, ansiedad, mareos, diarrea y edema periférico. Estos eventos adversos son indicativos de las condiciones médicas que afectan a las personas con EM. [0091] The most commonly reported adverse events before treatment were accidental injury, reported by 12 (5.8%) subjects, nausea, reported by 9 (4.4%) subjects, and asthenia, diarrhea, and paresthesia, each reported by 8 (3.9%) subjects. Six (2.9%) subjects also reported headache, anxiety, dizziness, diarrhea, and peripheral edema. These adverse events are indicative of the medical conditions affecting people with MS.
[0092] Conclusiones. Los datos no parecen respaldar una serie de informes anecdóticos o expectativas de la farmacología preclínica de que las dosis superiores a aproximadamente 10 a 15 mg dos veces al día, e incluso aproximadamente 10 mg dos veces al día, deberían asociarse con una mayor eficacia. Los datos presentados a continuación en la Tabla 15 respaldan esto, en base a la nueva metodología de análisis de respondedores. [0092] Conclusions. The data does not appear to support a number of anecdotal reports or expectations from preclinical pharmacology that doses greater than about 10 to 15 mg twice a day, and even about 10 mg twice a day, should be associated with increased efficacy. The data presented in Table 15 below supports this, based on the new responder analysis methodology.
Tabla 15. Comparación de 10 mg frente a 15 mg entre los respondedoresTable 15. Comparison of 10 mg vs. 15 mg among responders.

[0093] Un análisis de respondedor basado en la consistencia de la mejora proporciona un enfoque sensible, significativo a efectos de medición en la caminata cronometrada de 25 pies y puede ser utilizado como un criterio principal de valoración para ensayos futuros. Estos datos sugieren que para los sujetos sensibles (aproximadamente el 37%), el tratamiento con fampridina a dosis de 10-20 mg dos veces al día produce una mejora sustancial y persistente en la marcha. [0093] A responder analysis based on the consistency of improvement provides a sensitive, meaningful approach to measurement purposes at the 25-foot timed walk and can be used as a primary endpoint for future trials. These data suggest that for sensitive subjects (approximately 37%), treatment with fampridine at a dose of 10-20 mg twice a day produces a substantial and persistent improvement in gait.
[0094] Eficacia. No hay diferencias notables entre 10 mg bid y 15 mg bid entre los sujetos que responden al medicamento. De hecho, la mayor diferencia favorece el grupo de 10 mg bid (ver resultado MSWS-12). [0094] Efficacy. There are no noticeable differences between 10 mg bid and 15 mg bid between subjects who respond to the medication. In fact, the largest difference favors the 10 mg bid group (see MSWS-12 result).
[0095] Seguridad. Con respecto a la seguridad, hay tres consideraciones: Hubo una disminución aparente por debajo de la velocidad de marcha inicial en la última visita al medicamento en los no respondedores de fampridina en los grupos de 10 mg y 20 mg, pero no en el grupo de 15 mg. Esto puede o no ser significativo, pero no está claramente relacionado con la dosis. Hubo un aparente efecto de rebote, con una velocidad de caminata que cayó por debajo del valor inicial, entre los sujetos tratados con fampridina en la visita de seguimiento de dos semanas; esto ocurrió en el grupo de 15 y 20 mg b.i.d. pero no en el de 10 mg. Los EA graves fueron más frecuentes en los grupos de 15 mg y 20 mg dos veces al 10% y las tasas de 12% frente a la tasa de 0% en los grupos de 10 mg y 4% en los grupos de placebo. Esto puede o no ser significativo, pero el riesgo de SAE potencialmente relacionados, particularmente las incautaciones parece estar relacionado con la dosis de todos los datos disponibles y se basa en el mecanismo de acción. Según estos datos, parece que se prefiere una dosis de 10 mg por dosis debido a su relación favorable de riesgo a beneficio en comparación con las dosis de 15 y 20 mg. [0095] Security. Regarding safety, there are three considerations: There was an apparent decrease below the initial walking speed at the last visit to the drug in the non-responders of fampridine in the 10 mg and 20 mg groups, but not in the 15 mg This may or may not be significant, but is not clearly dose related. There was an apparent rebound effect, with walking speed falling below baseline, among subjects treated with fampridine at the two-week follow-up visit; this occurred in the 15 and 20 mg bid group but not in the 10 mg group. Serious AEs were more frequent in the 15 mg and 20 mg groups twice at 10% and the 12% rates versus the 0% rate in the 10 mg and 4% groups in the placebo groups. This may or may not be significant, but the risk of potentially related SAE, particularly seizures, appears to be dose related from all available data and is based on mechanism of action. Based on these data, a dose of 10 mg per dose appears to be preferred due to its favorable risk-to-benefit ratio compared to the 15 and 20 mg doses.
Apéndice BAppendix b
[0096][0096]

Fig. 1 Fig. 1
ĊĊ

Fig.2 Fig. 2


Porcenta es de tratam ientoPercentage is treatment
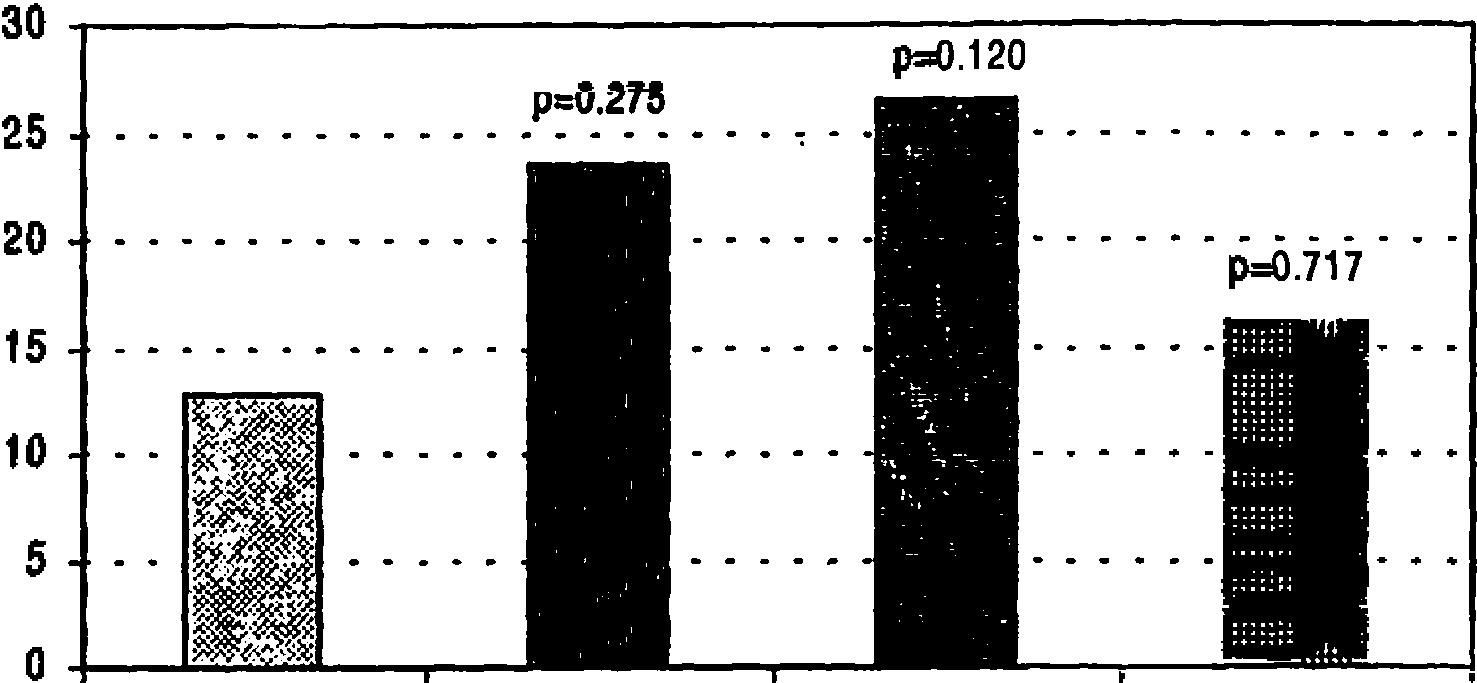
placebo (N=47) 10mg bid (N=51) 15mg bid (N=49) 20mg bid (N=56)placebo (N = 47) 10mg bid (N = 51) 15mg bid (N = 49) 20mg bid (N = 56)
Fig.4 Fig. 4
ĊĊ

Fig. 5 Fig. 5


Placebo (N=47) 10mg bid (N=51) 15mg bid (N=50) 20mg bid (N=57)Placebo (N = 47) 10mg bid (N = 51) 15mg bid (N = 50) 20mg bid (N = 57)
F ig .7 F ig .7


Cambios de línea de base en MSW-12 sobre doble ciegoBaseline changes in MSW-12 on double blind **
Medios de estado de respondedor y barras de error estándarTransponder status media and standard error bars
No respondedores (N = 136) Respondedores N = 62Non-responders (N = 136) Responders N = 62

SGI sobre doble ciegoSGI on double blind
Medios de estado de respondedor y barras de error estándarTransponder status media and standard error bars

No respondedores (N= 141) Respondedores (N=62)Non-responders (N = 141) Responders (N = 62)
Cambio de línea de base en CGI sobre doble ciegoDouble-blind CGI baseline change
Medios de estado de respondedor y barras de error estándarTransponder status media and standard error bars
No respondedores (N = 136) Respondedores (N = 62 )Non-responders (N = 136) Responders (N = 62)

Mediciones doble ciegos en las primeras y ultimas visitas de dosis estable solo.Double-blind measurements at the first and last stable dose visits alone.
NNota: Para los cambios desde la línea de base, un puntaje negativo es indicativo de un beneficio clínico.NNote: For changes from baseline, a negative score is indicative of clinical benefit.
NNota: Algunos no respondedores no tenían datos de post línea de base para una variable particular; por lo que los tamaños de muestra para los no respondedores (con respecto a esa variable) pueden ser menores que el número real de no respondedores.NNote: Some non-responders did not have post baseline data for a particular variable; therefore, the sample sizes for the non-responders (with respect to this variable) may be less than the actual number of non-responders.
NNota: Los valores p que comparan respondedores y no respondedores son de modelos ANOVA con efectos para estado respondedor y centro.NNote: p-values comparing responders and non-responders are from ANOVA models with effects for responder and center status.
Ffuente: I:\Compounds\Fampridine-SR\MS\MS-F202\Stat\Tables\Efficacy\Post hoc\Validation of Responder Variable.sasSource: I: \ Compounds \ Fampridine-SR \ MS \ MS-F202 \ Stat \ Tables \ Efficacy \ Post hoc \ Validation of Responder Variable.sas
Fig. 9 Fig. 9
Medios de tratamiento a lo largo del tiempoMeans of treatment over time

valoración 1o Est 2o Est 3o Estvaluation 1st Est 2nd Est 3rd Est
: Significativamente mejor que no respondedores de placebo y fampridina (p<0,001 para cada uno) *: Significativamente mejor que no respondedores de fampridina: Significantly better than non-responders of placebo and fampridine (p <0.001 for each) *: Significantly better than non-responders of fampridine
Fig. 10 Fig. 10

@ Significativamente mejor que placebo (p < 0,001).@ Significantly better than placebo (p <0.001).
Significativamente mejor que placebo (p < 0,05).Significantly better than placebo (p <0.05).
Fig. 11 Fig. 11

Fig. 12Fig. 12
APÉNDICE CAPPENDIX C
Significado clínico de la mejora constante en la caminata cronometrada de 25 pies (TW25) durante el tratamiento con fampridinaClinical significance of constant improvement in 25-foot timed walk (TW25) during treatment with fampridine
[0097] Andrew Goodman1, Ron Cohen2, Lawrence Marinucci2, Andrew Tizón2, y el Grupo de Estudio Fampridina-SR [0097] Andrew Goodman1, Ron Cohen2, Lawrence Marinucci2, Andrew Tizón2, and the Fampridina-SR Study Group
departamento de Neurología de la University of Rochester Medical Center, Rochester, NY;Department of Neurology, University of Rochester Medical Center, Rochester, NY;
2Acorda Therapeutics Inc., Hawthorne, Nueva York2Acorda Therapeutics Inc., Hawthorne, New York
RESUMENSUMMARY
[0098] Las mejoras en la velocidad de la marcha en la TW25 se han visto en ensayos controlados de fampridina (4-aminopiridina). El presente estudio examinó la relación entre los cambios en TW25, una Impresión global del sujeto (SGI) y la Escala de caminata MS de 12 ítems (MSWS12). Un total de 206 sujetos con EM, con TW25 veces de 8-60 segundos, se inscribieron en un ensayo de 24 centros, doble ciego, controlado con placebo y aleatorizados a uno de los cuatro grupos de tratamiento: Fampridina (liberación sostenida) 10, 15, 20mg b.i.d. o placebo, durante un período de tratamiento de 14 semanas. En el análisis post-hoc, una respuesta positiva en el TW-25 se definió como una velocidad de caminata durante al menos 3 de 4 visitas durante el tratamiento que fue más rápida que la velocidad máxima durante las cinco visitas sin drogas. La tasa de respuesta fue mayor en todos los grupos de fampridina (35, 36 y 39%) en comparación con el placebo (9%, p <0,002). Los respondedores mostraron una mejora significativamente mayor en las puntuaciones de MSWS-12 y las puntuaciones de SGI durante el tratamiento en comparación con los que no respondieron. Por lo tanto, el criterio de respuesta identifica un cambio significativo que afecta las impresiones de los sujetos sobre su discapacidad ambulatoria. Los eventos adversos y las medidas de seguridad fueron consistentes con la experiencia previa. [0098] Improvements in gait speed in TW25 have been seen in controlled trials of fampridine (4-aminopyridine). The present study examined the relationship between changes in TW25, a Global Subject Impression (SGI) and the 12-item MS Walk Scale (MSWS12). A total of 206 MS subjects, with TW25 times 8-60 seconds, were enrolled in a 24-center, double-blind, placebo-controlled trial randomized to one of four treatment groups: Fampridine (sustained release) 10, 15, 20mg bid or placebo, over a 14-week treatment period. In the post-hoc analysis, a positive response in TW-25 was defined as a walking speed for at least 3 of 4 visits during treatment that was faster than the maximum speed during the five drug-free visits. The response rate was higher in all fampridine groups (35, 36, and 39%) compared to placebo (9%, p <0.002). Responders showed significantly improved higher in MSWS-12 scores and SGI scores during treatment compared to non-responders. Therefore, the response criterion identifies a significant change that affects the subjects' impressions of their ambulatory disability. Adverse events and safety measures were consistent with previous experience.
INTRODUCCIÓNINTRODUCTION
[0099] La fampridina (4-aminopiridina o 4-AP) es una terapia experimental para la EM con un mecanismo de acción único. A concentraciones de 1-2 pM o menos, la fampridina parece ser un bloqueador específico de los canales de potasio neuronales dependientes del voltaje que afectan la conducción en los axones desmielinizados. Puede restaurar la conducción del potencial de acción en las fibras nerviosas dañadas y mal mielinizadas, y también puede mejorar directamente la transmisión sinóptica. 12 Fampridina-SR es una formulación de liberación sostenida del medicamento. En ensayos clínicos previos, el tratamiento con fampridina se ha asociado con una variedad de beneficios neurológicos en personas con EM, que incluyen caminar más rápido y aumentar la fuerza 3-5. [0099] Fampridine (4-aminopyridine or 4-AP) is an experimental therapy for MS with a unique mechanism of action. At concentrations of 1-2 pM or less, fampridine appears to be a specific blocker of voltage-dependent neuronal potassium channels that affect conduction in demyelinated axons. It can restore conduction of action potential to damaged and poorly myelinated nerve fibers, and can also directly improve synoptic transmission. 12 Fampridine-SR is a sustained release formulation of the drug. In previous clinical trials, fampridine treatment has been associated with a variety of neurological benefits in people with MS, including walking faster and increasing strength 3-5.
[0100] Solo se esperaría que una proporción de personas con EM sea susceptible a estos efectos farmacológicos, dada una patología muy variable. Actualmente, no hay una comprensión suficiente para permitir la selección previa al juicio de las personas que probablemente respondan. Hemos desarrollado una nueva metodología estadística que se basa en la hipótesis de que la respuesta al tratamiento debe reflejarse en una mejora constante en la velocidad de la marcha. Aquí abordamos si la respuesta a este criterio es un resultado clínicamente significativo y si el tratamiento con fampridina aumenta significativamente la probabilidad de tal respuesta. [0100] Only a proportion of people with MS would be expected to be susceptible to these pharmacological effects, given a highly variable pathology. Currently, there is insufficient understanding to allow pre-trial selection of those who are likely to respond. We have developed a new statistical methodology that is based on the hypothesis that the response to treatment should be reflected in a constant improvement in walking speed. Here we address whether the response to this criterion is a clinically significant result and whether treatment with fampridine significantly increases the likelihood of such a response.
MÉTODOSMETHODS
[0101][0101]

[0102] Un total de 206 sujetos se inscribieron en un ensayo de 24 centros, doble ciego, controlado con placebo y aleatorizados a uno de los cuatro grupos de tratamiento: Fampridina (formulación de liberación sostenida) 10, 15, 20 mg BID o placebo. A la fase inicial del placebo (2 semanas) le siguió el aumento de la dosis (2 semanas), el período de tratamiento estable (12 semanas), la titulación descendente (1 semana) y la evaluación de seguimiento (2 semanas). [0102] A total of 206 subjects were enrolled in a 24-center, double-blind, placebo-controlled trial randomized to one of four treatment groups: Fampridine (sustained release formulation) 10, 15, 20 mg BID, or placebo . The initial placebo phase (2 weeks) was followed by dose increase (2 weeks), stable treatment period (12 weeks), descending titration (1 week), and follow-up evaluation (2 weeks).
Criterios de inclusión Inclusion criteria
[0103] 18-70 años con EM definida (según lo definido por McDonald6), con función cognitiva adecuada y capaz de realizar los procedimientos de estudio requeridos, incluyendo una caminata cronometrada de 25 pies dos veces (rango requerido para completar la prueba en la detección: 8 a 60 segundos). [0103] 18-70 years with defined MS (as defined by McDonald6), with adequate cognitive function, and capable of performing the required study procedures, including a timed 25-foot walk twice (range required to complete the test in the detection: 8 to 60 seconds).
Medidas de resultadoOutcome measures
[0104] Compuesto Funcional de EM: [0104] EM Functional Compound:
Prueba cronometrada de 25 pies25-foot timed test
Prueba de clavija de 9 agujeros9-hole plug test
Prueba de adición auditiva en serie (PASAT)-3"Serial Auditory Addition Test (PASAT) -3 "
Pruebas musculares manuales de la extremidad inferior (LEMMT)Manual lower extremity muscle testing (LEMMT)
Puntaje AshworthAshworth score
Impresión global clínica (CGI)Clinical Global Impression (CGI)
Impresión global de sujeto (SGI)Global Subject Impression (SGI)
Inventario de Calidad de Vida de Esclerosis Múltiple (MSQL)Multiple Sclerosis Quality of Life Inventory (MSQL)
Escala para caminar de esclerosis múltiple de 12 ítems (MSWS-12)7.12-item Multiple Sclerosis Walking Scale (MSWS-12) 7.
Criterio de respuesta para la consistencia de la mejoraResponse criteria for improvement consistency
[0105] La consistencia de la mejora en la velocidad de caminata se definió (post hoc) como lograr la velocidad de caminata durante al menos tres (es decir, la mayoría) de las cuatro visitas "con drogas" que fue más rápida que la velocidad máxima medida durante las cinco visitas sin medicamentos (cuatro previas, una de seguimiento). La selección de este criterio fue apoyada por la observación de la distribución de visitas más rápidas "al medicamento" entre los grupos tratados con fampridina y placebo (Figura 2). [0105] Consistency of improvement in walking speed was defined (post hoc) as achieving walking speed for at least three (ie, most) of the four "drug" visits that were faster than maximum speed measured during the five visits without medication (four prior, one follow-up). The selection of this criterion was supported by observation of the distribution of faster visits "to the drug" between the groups treated with fampridine and placebo (Figure 2).

Figura 2. Histograma para mostrar la proporción de sujetos con un número dado de “visitas con medicamento” en las que logran una velocidad de caminata más rápida que la más rápida de sus cinco visitas “sin medicamento”. Sujetos tratados con fampridina mostraron más casos en los que hubieron 3 o 4 visitas con medicamento más rápidas y menos casos sin visitas más rápidas. La distribución de visitas para el grupo tratado con placebo está cerca a la predicha para el muestreo de variabilidad aleatoria de visita a visita. Figure 2. Histogram to show the proportion of subjects with a given number of “medication visits” in which they achieve a faster walking speed than the fastest of their five “no medication” visits. Subjects treated with fampridine showed more cases in which there were 3 or 4 visits with faster medication and fewer cases without faster visits. The distribution of visits for the placebo-treated group is close to that predicted for sampling of random variability from visit to visit.
A n á lis is es ta d ís tic o Statistic analysis
[0106] Para determinar si los sujetos con velocidades de caminata consistentemente mejoradas experimentaron mejoras significativas, se realizaron análisis estadísticos en dos variables subjetivas (SGI promedio durante el doble ciego y el cambio promedio desde el inicio en MSWS-12 sobre el doble ciego). Las diferencias entre las clasificaciones de respuesta (respondedores, frente a no respondedores) se compararon utilizando un modelo ANOVA con efectos para la clasificación de respuesta y el centro. [0106] To determine whether subjects with consistently improved walking speeds experienced significant improvements, statistical analyzes were performed on two subjective variables (average SGI during double-blind and mean change from baseline in MSWS-12 over double-blind). Differences between response classifications (responders vs. non-responders) were compared using an ANOVA model with effects for response and center classification.
[0107] La proporción de sujetos con mejoras consistentes en la velocidad de caminata (basada en la definición retrospectiva) se analizó mediante la prueba de Cochran-Mantel-Haenszel (CMH), controlando el centro. Para cada grupo de dosis, los valores de p (frente a placebo) se ajustaron con Bonferroni. [0107] The proportion of subjects with consistent improvements in walking speed (based on retrospective definition) was analyzed using the Cochran-Mantel-Haenszel (CMH) test, controlling for center. For each dose group, p values (versus placebo) were adjusted with Bonferroni.
RESULTADOSRESULTS
[0108][0108]
Tabla 1. Disposición del sujetoTable 1. Disposition of the subject
Placebo 10 mg 15 mg 20 mgPlacebo 10 mg 15 mg 20 mg
Aleatorizado 47 52 50 57 Randomized 47 52 50 57
Completado 45 50 49 51 Completed 45 50 49 51
Discontinuado 2 2 1 6 Discontinued 2 2 1 6
Evento adverso 1 0 1 5Adverse event 1 0 1 5
No conforme 0 0 0 1Non-compliant 0 0 0 1
Retiró el consentimiento 0 1 0 0Withdrawn consent 0 1 0 0
Perdido en el seguimiento 1 1 0 0Lost to follow up 1 1 0 0
Datos demográficos basalesBaseline demographics
[0109] No hubo diferencias significativas en los datos demográficos basales (edad, sexo, raza) o características de la EM (tipo diagnóstico, puntaje EDSS, duración de la enfermedad). [0109] There were no significant differences in baseline demographics (age, sex, race) or MS characteristics (type of diagnosis, EDSS score, duration of disease).
Seguridad y tolerabilidadSafety and tolerability
[0110][0110]
• EA ocurrieron en el 81% de los sujetos tratados con placebo y en el 91% de los sujetos tratados con fampridina. La mayoría fueron de intensidad leve a moderada y transitorios.• AE occurred in 81% of subjects treated with placebo and in 91% of subjects treated with fampridine. Most were mild to moderate in intensity and transient.
• Los efectos adversos más frecuentes en los grupos de tratamiento con fampridina fueron paratesia (10%), insomnio (8%), astenia (7%), mareos (7%) y náuseas (6%).• The most frequent adverse effects in the fampridine treatment groups were paraesthesia (10%), insomnia (8%), asthenia (7%), dizziness (7%) and nausea (6%).
• Eventos adversos graves, juzgados posiblemente o probablemente relacionados con el tratamiento, ocurrieron en 3 sujetos• Serious adverse events, possibly or probably judged related to treatment, occurred in 3 subjects
- 20 mg b.i.d. de fampridina: dos sujetos experimentaron convulsiones durante el ensayo, ambos casos después de una sobredosis accidental (dosis de 40 mg).- 20 mg b.i.d. Fampridine: Two subjects experienced seizures during the trial, both cases following an accidental overdose (40 mg dose).
- 15 mg b.i.d. de fampridina: un sujeto con estado mental alterado después de una sobredosis.- 15 mg b.i.d. of fampridine: a subject with altered mental state after an overdose.
Análisis de respuestaResponse analysis
[0111] Un subconjunto de pacientes en cada grupo de tratamiento mostró una velocidad de marcha mejorada constantemente mientras tomaba el fármaco: 8,5%, 35,3%, 36,0% y 38,6% de los sujetos en el placebo, 10 mg, 15 mg y 20 mg b.i.d. de grupos de tratamiento dos veces al día, respectivamente, como se muestra en la Figura 3. [0111] A subset of patients in each treatment group showed consistently improved walking speed while taking the drug: 8.5%, 35.3%, 36.0%, and 38.6% of subjects on placebo, 10 mg, 15 mg, and 20 mg bid of treatment groups twice daily, respectively, as shown in Figure 3.
Figura 3 Porcentaje de sujetos (población ITT) con mejora consistente en velocidad de caminata (respondedores)Figure 3 Percentage of subjects (ITT population) with consistent improvement in walking speed (responders)

Nota: Los valores p (frente a placebo) están ajustados por Bonferroni. Los valores no ajustados eran <0,002 para cada grupo.Note: p-values (vs. placebo) are adjusted by Bonferroni. Unadjusted values were <0.002 for each group.
[0112] Dado que había poca diferencia en la capacidad de respuesta entre las tres dosis examinadas, los análisis más detallados compararon los grupos tratados con fampridina frente al grupo tratado con placebo. Estos análisis mostraron que los sujetos con velocidades de caminata mejoradas constantemente promediaron una mejora neta de >20% en la velocidad de caminata, durante el período de tratamiento y mantuvieron un nivel promedio estable de mejora en la velocidad de caminata en cada visita, durante el curso completo del tratamiento, como se muestra en la figura 4. [0112] Since there was little difference in responsiveness between the three doses examined, the more detailed analyzes compared the groups treated with fampridine versus the group treated with placebo. These analyzes showed that subjects with consistently improved walking speeds averaged a net improvement of> 20% in walking speed during the treatment period and maintained a stable average level of improvement in walking speed at each visit during the full course of treatment, as shown in figure 4.
FIGURA 4. Cambio porcentual en velocidad de caminata en cada visita de tratamiento, por agrupación de análisis de respuesta (casos observados, población ITT)FIGURE 4. Percentage change in walking speed at each treatment visit, by grouping of response analyzes (observed cases, ITT population)

**: Significativamente mejor que placebo (p < 0,001 en cada punto de tiempo).**: Significantly better than placebo (p <0.001 at each time point).
#: Los tamaños de muestra de tratamiento en la leyenda de figura representa el número de sujetos de ITT. Los tamaños de muestra en puntos de tiempo individuales pueden ser más pequeños debido a abandonos o evaluaciones perdidas. #: The treatment sample sizes in the figure legend represent the number of ITT subjects. Sample sizes at individual time points may be smaller due to dropouts or missed evaluations.
Correlatos subjetivos de caminar mejoradoSubjective correlates of improved walking
[0113] Entre los 205 sujetos de ITT, 62 experimentaron mejoras consistentes en la velocidad de marcha, en base a la definición post-hoc, mientras que 143 no. El análisis de la importancia clínica de las mejoras consistentes en la velocidad de la caminata indica que la consistencia en las mejoras de la velocidad de la caminata tuvo significado clínico para los sujetos en este estudio, ya que estos sujetos tuvieron puntajes de SGI significativamente mejores (más altos) y cambios (reducciones) significativamente mejores en el puntajes de discapacidad percibidos MSWS-12 que aquellos que no lo hicieron (Figura 5). [0113] Among the 205 ITT subjects, 62 experienced consistent improvements in walking speed, based on the post-hoc definition, while 143 did not. Analysis of the clinical importance of consistent improvements in walking speed indicates that consistency in improvements in walking speed had clinical significance for the subjects in this study, as these subjects had significantly better SGI scores ( higher) and significantly better changes (reductions) in perceived disability scores MSWS-12 than those who did not (Figure 5).
Figura 5 Análisis del significado clínica de mejoras consistentes en la velocidad de caminata (casos observados, población ITT)Figure 5 Analysis of the clinical significance of consistent improvements in walking speed (observed cases, ITT population)

*: Mediciones de doble ciego en primeras y últimas visitas de dosis solo. Para los cambios desde la línea de base, un puntaje negativo es indicativo de un beneficio clínico.*: Double-blind measurements on first and last dose-only visits. For changes from baseline, a negative score is indicative of clinical benefit.
Nota: Algunos de los sujetos con mejoras aleatorias no tenían datos post línea de base para la variable particular; por lo que los tamaños de muestra para es menor que el número real de sujetos con mejoras aleatorias en la velocidad de caminata (N=143).Note: Some of the subjects with random improvements did not have post baseline data for the particular variable; therefore the sample sizes for is less than the actual number of subjects with random improvements in walking speed (N = 143).
CONCLUSIONESCONCLUSIONS
[0114 ] E stos an á lis is po s t-h o c m ostra ro n : [0114] These analyzes are by th o m ostra ro n:
• la presencia de un subconjunto más grande (x4) de sujetos que respondieron a Fampridina-SR con una mejora constante en la velocidad de caminata en todos los grupos tratados con fampridina, en comparación con el grupo placebo.• the presence of a larger subset (x4) of subjects who responded to Fampridine-SR with a constant improvement in walking speed in all fampridine-treated groups, compared to the placebo group.
• La mejora constante en la velocidad de caminata se asoció significativamente con mejores puntajes de Impresión Global del Sujeto y puntajes MSWS-12, lo que indica que la mejora constante en la velocidad de caminata en la Caminata Programada, asociada con este tratamiento, es clínicamente significativa para el sujeto.• Constant improvement in walking speed was significantly associated with better Subject Global Impression scores and MSWS-12 scores, indicating that the steady improvement in walking speed in Programmed Walking, associated with this treatment, is clinically meaningful to the subject.
[0115] Estos resultados apoyan la investigación continua de Fampridina-SR para la mejora de la función ambulatoria en la EM a través de la identificación prospectiva de un subconjunto de sujetos que responden en la prueba de caminata cronometrada. [0115] These results support the continued investigation of Fampridine-SR for the improvement of ambulatory function in MS through the prospective identification of a subset of subjects who respond in the timed walking test.
REFERENCIASREFERENCES
[0116][0116]
1. Blight, A. R. (1989) Effect of 4-aminopyridine on axonal conduction block in chronic spinal cord injury. Brain Res1. Blight, A. R. (1989) Effect of 4-aminopyridine on axonal conduction block in chronic spinal cord injury. Brain Res
Bull 22: 47-52.Bull 22: 47-52.
2. Waxman SG. (1993) Aminopyridines and the treatment of spinal cord injury. J Neurotrauma 10: 19-24.2. Waxman SG. (1993) Aminopyridines and the treatment of spinal cord injury. J Neurotrauma 10: 19-24.
3. Davis, F.A., D. Stefoski, and J. Rush (1990) Orally administered 4-aminopyridine improves clinical signs in multiple3. Davis, F.A., D. Stefoski, and J. Rush (1990) Orally administered 4-aminopyridine improves clinical signs in multiple
sclerosis. Ann Neurol 27: 186-192.sclerosis. Ann Neurol 27: 186-192.
4. Van Diemen, H.A.M. et al., (1992) The effect of 4-aminopyridine on clinical signs in multiple sclerosis: a randomized, placebo-controlled, double-blind, crossover study. Ann Neurol 32: 123-130.4. Van Diemen, H.A.M. et al., (1992) The effect of 4-aminopyridine on clinical signs in multiple sclerosis: a randomized, placebo-controlled, double-blind, crossover study. Ann Neurol 32: 123-130.
5. Schwid, S.R., et al., (1997) Quantitative assessment of sustained-release 4-aminopyridine for symptomatic treatment of multiple sclerosis. Neurology 48: 817-821.5. Schwid, S.R., et al., (1997) Quantitative assessment of sustained-release 4-aminopyridine for symptomatic treatment of multiple sclerosis. Neurology 48: 817-821.
6. McDonald, W.I., et al. (2001) Recommended Diagnostic Criteria for Multiple Sclerosis: Guidelines from the International Panel on the Diagnosis of Multiple Sclerosis. Ann Neurol 50: 121-127.6. McDonald, W.I., et al. (2001) Recommended Diagnostic Criteria for Multiple Sclerosis: Guidelines from the International Panel on the Diagnosis of Multiple Sclerosis. Ann Neurol 50: 121-127.
7. Hobart J, Riazi A, Lampling D, Fitzpatrick R, Thompson A. (2003) Measuring the Impact of MS on Walking Ability.7. Hobart J, Riazi A, Lampling D, Fitzpatrick R, Thompson A. (2003) Measuring the Impact of MS on Walking Ability.
J Neurol 60:31-36.J Neurol 60: 31-36.
El grupo de estudio MS-F202 Fampridina-SR:The MS-F202 Fampridine-SR study group:
[0117][0117]
Barry Arnason, University of Chicago, Chicago, ILBarry Arnason, University of Chicago, Chicago, IL
Francois Bethoux, Cleveland Clinic Foundation, Cleveland, OHFrancois Bethoux, Cleveland Clinic Foundation, Cleveland, OH
Christopher Bever, University of Maryland at Baltimore, Baltimore, MDChristopher Bever, University of Maryland at Baltimore, Baltimore, MD
James Bowen, University of Washington Medical Center, Seattle, WAJames Bowen, University of Washington Medical Center, Seattle, WA
Anne Cross, Washington University-Barnes Jewish Hospital, St. Louis, MOAnne Cross, Washington University-Barnes Jewish Hospital, St. Louis, MO
Corey Ford, University of New Mexico, Albuquerque, NMCorey Ford, University of New Mexico, Albuquerque, NM
Norman Kachuck, USC School of Medicine, Los Ángeles, CANorman Kachuck, USC School of Medicine, Los Angeles, CA
Michael Kaufman, Carolinas Medical Center MS Clinic, Charlotte, NCMichael Kaufman, Carolinas Medical Center MS Clinic, Charlotte, NC
Lauren Krupp, SUNY Stony Brook, Stony Brook, NYLauren Krupp, SUNY Stony Brook, Stony Brook, NY
Thomas Leist, Thomas Jefferson University, Filadelfia, PAThomas Leist, Thomas Jefferson University, Philadelphia, PA
John Lindsey, University of Texas-Houston, Houston, TXJohn Lindsey, University of Texas-Houston, Houston, TX
Fred Lublin, Mt. Sinai School of Medicine - MS Center, Nueva York, NYFred Lublin, Mt. Sinai School of Medicine - MS Center, New York, NY
Michelle Mass, Oregon Health Sciences University - MS Center, Portland, ORMichelle Mass, Oregon Health Sciences University - MS Center, Portland, OR
Luanne Metz, Foothills Medical Centre, Calgary, AbLuanne Metz, Foothills Medical Center, Calgary, Ab
Aaron Miller, Maimonides Medical Center, Brooklyn, NYAaron Miller, Maimonides Medical Center, Brooklyn, NY
Paul O’Connor, St. Michael’s Hospital, Toronto, ONPaul O’Connor, St. Michael’s Hospital, Toronto, ON
Mary Ann Picone, Gimbel MS Center, Teaneck, NJMary Ann Picone, Gimbel MS Center, Teaneck, NJ
Kottil Rammohan, Ohio State University, Columbus, OHKottil Rammohan, Ohio State University, Columbus, OH
Marco Rizzo, Yale New Haven Hospital, New Haven, CTMarco Rizzo, Yale New Haven Hospital, New Haven, CT
Randall Schapiro, Fairview MS Center, Minneapolis, MNRandall Schapiro, Fairview MS Center, Minneapolis, MN
Steven Schwid, University of Rochester, Rochester, NYSteven Schwid, University of Rochester, Rochester, NY
Craig Smith, Swedish Medical MS Center, Seattle, WACraig Smith, Swedish Medical MS Center, Seattle, WA
Ben Thrower, MS Center at Shepherd Center, Atlanta, GABen Thrower, MS Center at Shepherd Center, Atlanta, GA
((Pie de página abajo a la izquierda))((Footer bottom left))
[0118] Presentado en la 130a Reunión Anual de la Asociación Americana de Neurología San Diego, California, 25-28 de septiembre de 2005. [0118] Presented at the 130th Annual Meeting of the American Neurological Association San Diego, California, 25-28 September 2005.
((Pie de página abajo a la derecha))((Footer bottom right))
[0119] El Dr. Andrew D. Goodman es consultor de Acorda Therapeutics, Inc. El apoyo financiero para este estudio fue proporcionado por Acorda Therapeutics, Inc. [0119] Dr. Andrew D. Goodman is a consultant to Acorda Therapeutics, Inc. Financial support for this study was provided by Acorda Therapeutics, Inc.
APÉNDICE D APPENDIX D
ANÁLISIS DEL RESPONDEDOR RESPONDER ANALYSIS
INTRODUCCIÓNINTRODUCTION
[0120] Acorda Therapeutics ha patrocinado dos ensayos clínicos de fase 2, prospectivos, aleatorizados, controlados con placebo para evaluar los efectos de Fampridina-SR sobre la función motora de las extremidades inferiores en personas con esclerosis múltiple (EM). Ambos ensayos demostraron una mejora estadísticamente significativa en la fuerza de las piernas, medida con la prueba muscular manual estándar (LEMMT). Ambas pruebas mostraron mejoras en la velocidad de caminata basadas en la caminata cronometrada de 25 pies (TW25) que fueron estadísticamente significativas en base a análisis post-hoc. El aumento de la debilidad muscular y los déficits ambulatorios son dos de los aspectos clínicamente más significativos de esta enfermedad progresiva. Fampridina es el primer y único fármaco hasta la fecha que ha demostrado efectos beneficiosos directos sobre los déficits funcionales de la marcha y la debilidad en la Em (a diferencia de los fármacos antiinflamatorios utilizados para promover la recuperación de una recaída aguda). [0120] Acorda Therapeutics has sponsored two prospective, randomized, placebo-controlled phase 2 clinical trials to assess the effects of Fampridine-SR on motor function of the lower extremities in people with multiple sclerosis (MS). Both trials demonstrated a statistically significant improvement in leg strength, measured with the standard manual muscle test (LEMMT). Both tests showed improvements in walking speed based on the 25-foot timed walk (TW25) that were statistically significant based on post-hoc analysis. Increased muscle weakness and outpatient deficits are two of the most clinically significant aspects of this progressive disease. Fampridine is the first and only drug to date that has shown direct beneficial effects on functional gait deficits and weakness in Em (unlike anti-inflammatory drugs used to promote recovery from acute relapse).
[0121] Los representantes de Acorda Therapeutics se reunieron con la División el 1 de julio de 2004 para discutir el potencial de proceder a los estudios de Fase 3 a la luz de los resultados del ensayo más reciente, MS-F202, un estudio de comparación de dosis de 211 pacientes. En esta reunión, la División presentó la opinión de que los datos de MS-F202 demostraron solo un efecto relativamente pequeño y transitorio del medicamento sobre la velocidad de la marcha y que se requeriría alguna medida adicional de "significado clínico" de tales cambios en el TW25. Se sugirió que una medida global de sujeto o clínico podría proporcionar este papel. También se propuso que este rol podría ser cumplido por la Escala de Caminata de Esclerosis Múltiple-12 (MSWS-12), un cuestionario de doce ítems recientemente desarrollado que aborda la función de caminar, y que se utilizó de forma exploratoria en el estudio MS-F202. La División también dejó claro la necesidad de demostrar el mantenimiento del efecto durante un período de tratamiento de 12 semanas. [0121] Acorda Therapeutics representatives met with the Division on July 1, 2004 to discuss the potential for proceeding to Phase 3 studies in light of the results of the most recent trial, MS-F202, a comparison study dose of 211 patients. At this meeting, the Division expressed the view that the MS-F202 data demonstrated only a relatively small and transient effect of the drug on walking speed and that some additional measure of "clinical significance" of such changes in performance would be required. TW25. It was suggested that a global measure of subject or clinician could provide this role. It was also proposed that this role could be fulfilled by the Multiple Sclerosis Walk Scale-12 (MSWS-12), a newly developed twelve-item questionnaire that addresses the function of walking, and which was exploratoryly used in the MS study. -F202. The Division also made clear the need to demonstrate maintenance of effect over a 12-week treatment period.
[0122] Acorda Therapeutics ha tenido en cuenta estas recomendaciones y ha revisado su plan de desarrollo para abordar los problemas planteados por la División. Acorda ahora propone realizar un estudio controlado con placebo, aleatorizado, doble ciego y con potencia adecuada para comparar los efectos de 10 mg de Fampridina-SR en comparación con el placebo al caminar en pacientes con EM. El diseño general de este estudio será similar al del estudio MS-F202, a excepción del aspecto de comparación de dosis del ensayo anterior, e incluirá un período de tratamiento de 14 semanas. Como se describe en la sinopsis del protocolo adjunto, y con respecto a la apertura expresada de la División para considerar dicho enfoque, este estudio empleará un análisis de respuesta como criterio de valoración primario. Esta forma de análisis facilitará la evaluación de la importancia clínica del beneficio y el mantenimiento del efecto en aquellos sujetos que responden al medicamento. Lo siguiente explicará en primer lugar la justificación de la elección del criterio de respuesta y luego ilustrará en detalle la aplicación del análisis propuesto mediante un análisis post-hoc del estudio MS-F202. [0122] Acorda Therapeutics has considered these recommendations and has revised its development plan to address the issues raised by the Division. Acorda is now proposing to conduct an adequate power, randomized, double-blind, placebo-controlled study to compare the effects of Fampridine-SR 10 mg compared to placebo when walking in MS patients. The overall design of this study will be similar to that of the MS-F202 study, except for the dose comparison aspect of the previous trial, and will include a treatment period of 14 weeks. As described in the synopsis of the attached protocol, and with respect to the Division's openness to consider such an approach, this study will use response analysis as the primary endpoint. This form of analysis will facilitate the evaluation of the clinical importance of the benefit and the maintenance of the effect in those subjects who respond to the medication. The following will first explain the rationale for choosing the response criteria and then illustrate in detail the application of the proposed analysis using a post-hoc analysis of the MS-F202 study.
[0123] La intención de este estudio y su plan de análisis será mostrar que hay un subconjunto significativo de sujetos con déficits ambulatorios debido a EM que responden a Fampridina-SR con un aumento significativo en la velocidad de la caminata. [0123] The intention of this study and its analysis plan will be to show that there is a significant subset of subjects with ambulatory deficits due to MS that respond to Fampridine-SR with a significant increase in walking speed.
RAZÓN FUNDAMENTALFUNDAMENTAL REASON
[0124] Los médicos que recetan regularmente fampridina compuesta para la EM han informado que solo una proporción de sus pacientes parece responder con claros beneficios clínicos, y que, a su juicio, esta proporción puede ser de alrededor de un tercio (comunicación personal con Acorda Therapeutics). Este grado de respuesta puede estar relacionado con el mecanismo de acción propuesto, que es la restauración de la conducción en axones desmielinizados a través del bloqueo de los canales de potasio dependientes de voltaje. Se espera que solo una proporción de pacientes con EM posea axones de relevancia funcional apropiada que sean susceptibles a estos efectos farmacológicos, dada la patología altamente variable de la enfermedad. Actualmente, no hay una comprensión suficiente de la enfermedad para permitir la selección previa al juicio de pacientes potencialmente sensibles. Sin embargo, la existencia de un subconjunto de pacientes que responden consistentemente al medicamento puede ser respaldada por observaciones cuantitativas en los estudios MS-F201 y MS-F202. [0124] Doctors who regularly prescribe compound fampridine for MS have reported that only a proportion of their patients appear to respond with clear clinical benefits, and that this ratio may be around one-third in their view (personal communication with Acorda Therapeutics). This degree of response may be related to the proposed mechanism of action, which is the restoration of conduction in demyelinated axons through the blocking of voltage-dependent potassium channels. Only a proportion of MS patients are expected to have axons of appropriate functional relevance that are susceptible to these pharmacological effects, given the highly variable disease pathology. Currently, there is insufficient understanding of the disease to allow for pre-trial selection of potentially sensitive patients. However, the existence of a subset of patients who consistently respond to the drug can be supported by quantitative observations in the MS-F201 and MS-F202 studies.
[0125] Antes del tratamiento, los sujetos en estos dos ensayos exhibieron velocidades de caminata promedio en la medida TW25 de aproximadamente 2 pies por segundo (pies/seg). Este es un déficit significativo, ya que la velocidad de caminata esperada para un individuo no afectado es de 5-6 pies/seg. Los sujetos en MS-F202 fueron seleccionados para el tiempo de caminata TW-25 en el examen de 8-60, que es equivalente a un rango de velocidad de 0,42-3,1 pies/seg. La variabilidad del estado funcional es una característica inherente de la EM, y esto se puede ver en la medición repetida de la velocidad al caminar en el transcurso de semanas o meses. En cualquiera de las tres visitas durante el período de tratamiento estable, el 15-20% de los sujetos tratados con placebo mostraron una mejora >20% con respecto a la velocidad inicial de la caminata, un umbral elegido como uno que indica un verdadero cambio en la velocidad de la caminata sobre las fluctuaciones de fondo. Una proporción mayor de los sujetos tratados con Fampridina-SR mostró tales mejoras, pero esta diferencia no fue estadísticamente significativa, dado el tamaño de la muestra y la tasa de respuesta al placebo. [0125] Before treatment, subjects in these two trials exhibited average walking speeds at the TW25 measure of approximately 2 feet per second (feet / sec). This is a significant deficit, since the speed expected walk for an unaffected individual is 5-6 ft / sec. Subjects in MS-F202 were selected for walk time TW-25 on exam 8-60, which is equivalent to a speed range of 0.42-3.1 ft / sec. Variability of functional status is an inherent feature of MS, and this can be seen in repeated measurement of walking speed over the course of weeks or months. At any of the three visits during the stable treatment period, 15-20% of the placebo-treated subjects showed> 20% improvement over baseline walking speed, a threshold chosen as one that indicates true change in the speed of the walk on the background fluctuations. A greater proportion of subjects treated with Fampridine-SR showed such improvements, but this difference was not statistically significant, given the sample size and the response rate to placebo.
[0126] Dadas las variaciones a menudo grandes en la función experimentada por las personas con EM, es difícil para el sujeto o un observador capacitado separar una mejora relacionada con el tratamiento de una mejora relacionada con la enfermedad sin el elemento de consistencia en el tiempo. Por lo tanto, se podría esperar que la consistencia del beneficio sea una medida más selectiva del verdadero efecto del tratamiento que la magnitud del cambio. Sobre la base de esta justificación, se examinaron las respuestas de los sujetos individuales en el ensayo MS-F202 para determinar el grado en que su velocidad de marcha mostró una mejoría durante el período de tratamiento doble ciego y volvieron a los valores previos al tratamiento después de que se retiraron del medicamento en el seguimiento Este examen sujeto por sujeto arrojó un subgrupo de sujetos cuyo patrón de velocidad de marcha a lo largo del tiempo parecía ser consistente con una respuesta al fármaco. Esto condujo al análisis ilustrado en la Figura 1. Esto compara los grupos tratados con placebo y Fampridina-SR con respecto al número de visitas durante el período de tratamiento doble ciego en el que la velocidad de caminata en el TW25 fue más rápida que la velocidad máxima de las cinco visitas sin tratamiento (cuatro visitas antes de la aleatorización y una visita de seguimiento después del período de tratamiento farmacológico). [0126] Given the often large variations in function experienced by people with MS, it is difficult for the subject or a trained observer to separate a treatment-related improvement from a disease-related improvement without the element of consistency over time . Therefore, consistency of benefit could be expected to be a more selective measure of the true effect of treatment than the magnitude of change. Based on this justification, the responses of individual subjects in the MS-F202 trial were examined to determine the extent to which their walking speed showed improvement during the double-blind treatment period and returned to pretreatment values after of drug withdrawal at follow-up This subject-by-subject examination yielded a subset of subjects whose walking speed pattern over time appeared to be consistent with a response to the drug. This led to the analysis illustrated in Figure 1. This compares the groups treated with placebo and Fampridine-SR with respect to the number of visits during the double-blind treatment period in which the walking speed in TW25 was faster than the speed. maximum of five visits without treatment (four visits before randomization and one follow-up visit after the drug treatment period).
[0127] El grupo tratado con placebo mostró un patrón claro de disminución exponencial en el número de sujetos con un mayor número de visitas "positivas". Esto es lo que se esperaría de un proceso aleatorio de variabilidad (una simple simulación por computadora del proceso de muestreo aleatorio involucrado muestra el mismo patrón de respuesta: [0127] The placebo group showed a clear pattern of exponential decrease in the number of subjects with the highest number of "positive" visits. This is what would be expected from a random variability process (a simple computer simulation of the involved random sampling process shows the same pattern of response:
Fig. A1 en las Tablas y Figuras Suplementarias). En contraste, el patrón de respuesta en el grupo tratado con Fampridina-SR divergió fuertemente de esta distribución; un número mucho mayor de sujetos tratados con Fampridina-SR mostró tres o cuatro visitas con velocidades de caminata más altas que la velocidad máxima de las cinco visitas sin tratamiento y menos de la mitad de la proporción esperada no tuvo visitas con velocidades más altas. Estos resultados indican que hubo una subpoblación de sujetos en el grupo tratado con Fampridina-SR que experimentó un aumento constante en la velocidad de caminata relacionada con el tratamiento. Fig. A1 in the Supplementary Tables and Figures). In contrast, the response pattern in the Fampridine-SR treated group diverged strongly from this distribution; a much larger number of subjects treated with Fampridine-SR showed three or four visits with walking speeds higher than the maximum speed of the five visits without treatment and less than half of the expected proportion had no visits with higher speeds. These results indicate that there was a subpopulation of subjects in the Fampridine-SR treated group that experienced a steady increase in treatment-related walking speed.

Fig. 1 Histograma para mostrar el número de visitas de tratamiento en las que los sujetos mostraron una velocidad de caminata más rápida durante la marcha de 25 pies cronometrada que todas las cinco visitas sin tratamiento. Fig. 1 Histogram to show the number of treatment visits at which subjects showed a faster walking speed during the timed 25-foot walk than all five visits without treatment.
[0128 ] Este an á lis is sug ie re q u e un c rite rio re la tiva m e n te a lta m e n te se le c tivo pa ra un p ro b a b le re sp o n d e d o r al tratamiento sería: un sujeto con una velocidad de caminata más rápida durante al menos tres (es decir, tres o cuatro) de las cuatro visitas durante el período de tratamiento doble ciego en comparación con el valor máximo para las cinco visitas sin tratamiento. Las cuatro visitas antes del inicio del tratamiento doble ciego proporcionan una línea de base inicial contra la cual medir la consistencia de la respuesta durante las cuatro visitas de tratamiento. La inclusión de la visita de seguimiento como un componente adicional de la comparación se consideró valiosa principalmente al excluir a aquellos sujetos que no mostraron la pérdida esperada de mejoría después de dejar el medicamento. Es probable que se trate de sujetos que por casualidad mejoraron sus síntomas de EM en el momento del inicio del tratamiento, pero cuya mejora no se revirtió con la interrupción del medicamento porque en realidad no estaba relacionado con el medicamento. Por lo tanto, la incorporación de la visita de seguimiento como parte del criterio puede ayudar a excluir los falsos positivos, si la velocidad TW25 sigue siendo alta en el seguimiento. [0128] This analysis suggests that a criterion re la tiva men tively l e men ted to a pr ro bab le re sp ondedor al Treatment would be: a subject with a faster walking speed for at least three (i.e., three or four) of the four visits during the double-blind treatment period compared to the maximum value for the five visits without treatment. The four visits before the start of double-blind treatment provide an initial baseline against which to measure the consistency of response during the four treatment visits. The inclusion of the follow-up visit as an additional component of the comparison was considered valuable mainly in excluding those subjects who did not show the expected loss of improvement after stopping the medication. It is likely that these were subjects who incidentally improved their MS symptoms at the time of initiation of treatment, but whose improvement was not reversed with discontinuation of the drug because it was not actually related to the drug. Therefore, the incorporation of the follow-up visit as part of the criterion can help to exclude false positives, if the TW25 speed remains high at follow-up.
[0129] En el estudio MS-F202, este criterio de respuesta se cumplió en un 8,5%, 35,3%, 36,0% y 38,6% de los sujetos en grupos de tratamiento con placebo, 10 mg, 15 mg y 20 mg dos veces al día, respectivamente, que muestran una diferencia altamente significativa y consistente entre los grupos de tratamiento con placebo y medicamentos. Dado que había poca diferencia en la capacidad de respuesta entre las tres dosis examinadas, se realizaron análisis más detallados comparando los grupos tratados con Fampridina-SR agrupados con el grupo tratado con placebo. Los resultados completos de este análisis para el estudio MS-F202 se describen en las siguientes secciones. Estos muestran que el grupo de respuesta así identificado experimentó un aumento promedio >25% en la velocidad de caminata durante el período de tratamiento y que este aumento no disminuyó durante el período de tratamiento. El grupo de respuesta también mostró un aumento en el puntaje de Impresión Global del Sujeto y una mejora en el puntaje en el MSWS-12. Si este mismo patrón de mejora en los puntos finales secundarios se confirma en los estudios diseñados prospectivamente, se apoyará el significado clínico de la definición de respuesta. [0129] In study MS-F202, this response criterion was met in 8.5%, 35.3%, 36.0%, and 38.6% of subjects in placebo treatment groups, 10 mg, 15 mg and 20 mg twice daily, respectively, showing a highly significant and consistent difference between the placebo and drug treatment groups. Since there was little difference in responsiveness between the three doses examined, more detailed analyzes were performed comparing the Fampridine-SR treated groups pooled with the placebo treated group. The full results of this analysis for the MS-F202 study are described in the following sections. These show that the response group thus identified experienced an average> 25% increase in walking speed during the treatment period and that this increase did not decrease during the treatment period. The response group also showed an increase in the Subject Global Impression score and an improvement in the MSWS-12 score. If this same pattern of improvement in secondary endpoints is confirmed in prospectively designed studies, the clinical significance of the definition of response will be supported.
[0130] Es importante tener en cuenta que este criterio de respuesta selecciona sujetos que muestran un patrón de cambio que es consistente con una respuesta al tratamiento, pero no define las características completas de esa respuesta. El criterio en sí mismo no especifica la cantidad de mejora ni especifica que la mejora debe ser estable en el tiempo. Por ejemplo, una disminución progresiva en el efecto durante el transcurso del período de estudio, incluso una que resulte en velocidades más lentas que el valor máximo sin tratamiento, no sería excluida por el criterio; Como ejemplo específico, los cambios desde el valor máximo sin tratamiento de, respectivamente, 20%, 5%, 1% y -30% durante el período de tratamiento doble ciego calificarían como una respuesta bajo el criterio, pero en realidad muestran un cambio promedio neto negativo para todo el período, poca estabilidad y un punto final negativo. Los análisis post-hoc de los estudios MS-F202 y MS-F201 indican que podemos esperar que los respondedores definidos por la consistencia del efecto también demuestren una mayor magnitud y estabilidad del beneficio, pero esto debe determinarse en un ensayo bien controlado en el que este criterio de respuesta está predefinido. [0130] It is important to note that this response criterion selects subjects who show a pattern of change that is consistent with a response to treatment, but does not define the full characteristics of that response. The criterion itself does not specify the amount of improvement nor does it specify that the improvement must be stable over time. For example, a progressive decrease in effect over the course of the study period, even one that results in velocities slower than the maximum value without treatment, would not be excluded by the criterion; As a specific example, changes from the maximum untreated value of respectively 20%, 5%, 1%, and -30% during the double-blind treatment period would qualify as a response under the criterion, but actually show an average change Net negative for the entire period, little stability and a negative end point. Post-hoc analyzes of the MS-F202 and MS-F201 studies indicate that we can expect responders defined by consistency of effect to also demonstrate greater magnitude and stability of benefit, but this should be determined in a well-controlled trial in which This response criterion is predefined.
ANÁLISIS DE RESPONDEDOR APLICADO AL ESTUDIO MS-F202RESPONDER ANALYSIS APPLIED TO STUDY MS-F202
[0131] Dado que había poca diferencia en la capacidad de respuesta entre las tres dosis de fármaco examinadas en el Estudio MS-F202 (ver Tabla A1 en las Tablas y Figuras Suplementarias), el siguiente análisis compara principalmente los grupos tratados con Fampridina-SR agrupados frente al grupo tratado con placebo. [0131] Since there was little difference in responsiveness between the three drug doses examined in Study MS-F202 (see Table A1 in the Supplementary Tables and Figures), the following analysis mainly compares the groups treated with Fampridine-SR grouped against the placebo group.
[0132] El número de sujetos que cumplieron el criterio de respuesta en el grupo tratado con Fampridina-SR agrupado fue 58 (36,7%) en comparación con 4 (8,5%) en el grupo tratado con placebo, y esta diferencia fue estadísticamente significativa (p <0,001 ) como se muestra en la Tabla 1. La Fig. A2 (ver Tablas y Figuras Suplementarias) ilustra los cambios medios de velocidad de caminata por visita para estos dos grupos. [0132] The number of subjects meeting the response criteria in the pooled Fampridine-SR treated group was 58 (36.7%) compared to 4 (8.5%) in the placebo treated group, and this difference it was statistically significant (p <0.001) as shown in Table 1. Fig. A2 (see Supplementary Tables and Figures) illustrates the mean changes in walking speed per visit for these two groups.

[0133] Esto indica que las posibilidades de un resultado más favorable, basado en la consistencia de la mejora en la velocidad de la marcha, es mucho mayor en el grupo tratado con Fampridina-SR que en el grupo tratado con placebo. [0133] This indicates that the chances of a more favorable outcome, based on the consistency of improvement in gait speed, is much greater in the Fampridine-SR group than in the placebo group.
[0134] La Figura 2 compara los cambios en la velocidad de la marcha para los grupos de respondedores y no respondedores entre los grupos tratados con Fampridina-SR y tratados con placebo. El grupo de respondedores Fampridina-SR mostró un aumento promedio en la velocidad de 0,49 pies/seg en comparación con 0,01 pies/seg en los dos grupos de no respondedores. Los cuatro sujetos que respondieron al placebo mostraron un cambio promedio intermedio en la velocidad de caminata (0,33 pies/seg) pero había muy pocos sujetos en este grupo para una comparación significativa. No hubo diferencias entre los grupos al inicio del estudio en cuanto a la velocidad de la marcha al inicio, los datos demográficos o las características neurológicas (ver Tabla A2, A3 y A4 en las Tablas y Figuras Suplementarias). [0134] Figure 2 compares the changes in gait speed for the responder and non-responder groups between the Fampridine-SR treated and placebo treated groups. The Fampridine-SR responder group showed an average increase in speed of 0.49 ft / sec compared to 0.01 ft / sec in the two groups of non-responders. All four subjects who responded to placebo showed an intermediate mean change in walking speed (0.33 ft / sec) but there were very few subjects in this group for a meaningful comparison. There were no differences between groups at baseline in terms of gait speed at baseline, demographics, or neurological characteristics (see Table A2, A3, and A4 in the Supplemental Tables and Figures).

No respondedores No respondedores Respondedores Respondedores de de placebo (N=43) de fampridina (N 98) de placebo (N=4) fampridina (N=58) FUENTE 11VCea ôwfcMrwafWMttt-SRVMSVVB-RQJtttoAExjtonKcvyV1» * ^ Dcvdor .rKcrJJbof>OJWevÍKd Bauliao AvjCFD ln \VS l*y Revender Status.» Non-responders Non-responders Responders Responders for placebo (N = 43) for fampridine (N 98) for placebo (N = 4) fampridin (N = 58) SOURCE 11VCea ôwfcMrwafWMttt-SRVMSVVB-RQJtttoAExjtonKcvyV1 »^ Dcvdor. ln \ VS l * and Resell Status. »
Fig. 2. Cambio promedio en velocidad de caminata durante el período de tratamiento doble ciego, en comparación con el valor de pre-aleatorización promedio, por clasificación de respondedor. Fig. 2. Average change in walking speed during the double-blind treatment period, compared to the average pre-randomization value, by responder classification.
[0135] El porcentaje de mejora promedio desde el inicio en la velocidad de la marcha durante el período de doble ciego fue del 27% para los grupos de respondedores Fampridina-SR, en comparación con el 1 y el 2% en los no respondedores Placebo y Fampridina-SR, respectivamente, como se muestra en Figura 3. [0135] The average improvement rate from baseline in gait speed during the double-blind period was 27% for Fampridine-SR responder groups, compared to 1% and 2% for Placebo non-responders and Fampridine-SR, respectively, as shown in Figure 3.

Fig. 3 o porcentual promedio en velocidad de caminata durante el período de tratamiento doble ciego, en comparación con el valor de pre-aleatorización promedio, por clasificación de respondedor. Fig. 3 o average percentage in walking speed during the double-blind treatment period, compared to the average pre-randomization value, by responder classification.
[0136] No solo la magnitud del efecto sobre la velocidad promedio de caminata fue sustancial en el grupo de respondedor de Fampridina-SR, sino que el efecto fue estable y los intervalos de confianza bien separados de los grupos no respondedores durante el período completo de tratamiento de 14 semanas, como se muestra en la Figura 4. [0136] Not only was the magnitude of the effect on average walking speed substantial in the Fampridine-SR responder group, but the effect was stable and the confidence intervals well separated from the nonresponder groups during the entire period of 14-week treatment, as shown in Figure 4.

Nota 1: Los tamaños de muestra de tratamiento presentados en la leyenda de figura representan el número de sujetos de ITT. Los tamaños de muestra en puntos de tiempo individuales pueden ser más pequeños debido a abandonos o evaluaciones perdidas.Note 1: The treatment sample sizes presented in the figure legend represent the number of ITT subjects. Sample sizes at individual time points may be smaller due to dropouts or missed evaluations.
Fig. 4 Cambio porcentual en la velocidad de caminata, en comparación a los valores de pre-aleotorización promedio, por clasificación de respondedor en cada visita de estudio durante el período de tratamiento de doble ciego. Para claridad, el gráfico superior muestra solo el grupo de respondedor de Fampridina-SR y los no respondedores de Fampridina-SR y placebo. El gráfico inferior incluye los respondedores de placebo, mostrando los intervalos de confianza grandes que de otro modo esconderían los intervalos de confianza para los otros grupos. Fig. 4 Percentage change in walking speed, compared to mean pre-aleotorization values, by responder classification at each study visit during the double-blind treatment period. For clarity, the graph above shows only the Fampridine-SR responder group and the Fampridine-SR and placebo non-responders. The bottom graph includes the placebo responders, showing the large confidence intervals that would otherwise hide the confidence intervals for the other groups.
[0137] El criterio de respuesta también nos permite explorar los efectos beneficiosos de este cambio según lo informado por los sujetos en dos medidas globales, la Impresión Global del Sujeto (SGI) y la Escala Waling de Esclerosis Múltiple-12 (MSWS-12), como se ha ilustrado en las Figuras 5 y 6, a continuación. Los respondedores mostraron un puntaje promedio más alto en el SGI durante el período de tratamiento doble ciego. Estos datos de SGI indican que los Respondedores pudieron distinguir un beneficio positivo asociado con su mejora en la velocidad de caminata. Se requeriría una muestra más grande para confirmar esta diferencia estadísticamente dada la naturaleza altamente variable de las respuestas en estas variables (ver Fig. A3 y A4 en las Tablas y Figuras Suplementarias). [0137] The response criterion also allows us to explore the beneficial effects of this change as reported by subjects on two global measures, the Global Subject Impression (SGI) and the Waling Scale for Multiple Sclerosis-12 (MSWS-12). , as illustrated in Figures 5 and 6, below. Respondents showed a higher average SGI score during the double-blind treatment period. These SGI data indicate that Responders were able to distinguish a positive benefit associated with their improvement in walking speed. A larger sample would be required to confirm this difference statistically given the nature highly variable responses in these variables (see Fig. A3 and A4 in the Supplementary Tables and Figures).

Fig. 5 Puntaje de impresión global de sujeto promedio por clasificación de respondedor durante el período de tratamiento de doble ciego. Un puntaje de 4 es una respuesta de “neutral/mixta” en una escala terrible (1) a feliz (7) de 7 puntos.Fig. 5 Overall impression score of average subject per responder classification during the double-blind treatment period. A score of 4 is a “neutral / mixed” response on a terrible scale (1) to happy (7) of 7 points.
[0138] El significado clínico del criterio del respondedor también está respaldado por el hecho de que los respondedores mostraron una mayor mejora en el cuestionario MSWS-12, como se muestra en la Figura 6 , a continuación. Tenga en cuenta que el MSWS-12 solo se aplicó en la Visita 0 (antes del placebo) y en la primera y última visita a dosis estables en el estudio MS-F202. [0138] The clinical significance of the respondent criterion is also supported by the fact that responders showed further improvement in the MSWS-12 questionnaire, as shown in Figure 6 , below. Note that MSWS-12 was only applied at Visit 0 (before placebo) and at the first and last stable dose visits in Study MS-F202.

Fig. 6 Cambio promedio desde la línea de base (Visita 0) en el puntaje de MSWS-12 durante el período de tratamiento de doble ciego, por clasificación de respondedor. El puntaje de MSWS-12 tiene un valor máximo de 100 para el impacto más severo de EM con función ambulatoria en funciones de la vida diaria.Fig. 6 Average change from baseline (Visit 0) in the MSWS-12 score during the double-blind treatment period, by responder classification. The MSWS-12 score has a maximum value of 100 for the most severe impact of MS with ambulatory function on functions of daily life.
[0139] En resumen, este análisis de respuesta ilumina características de la respuesta que no están claras a partir del análisis de toda la población de tratamiento. El beneficio de caminar en Respondedores parece ser sustancial, con una mejora promedio de más del 25%, y cuantitativamente consistente durante el período de 3 meses del tratamiento. Además, los Respondedores parecen registrar sus impresiones de beneficio clínico tanto en el SGI como en el MSWS-12. [0139] In summary, this response analysis illuminates response characteristics that are unclear from the analysis of the entire treatment population. The benefit of walking in Responders appears to be substantial, with an average improvement of over 25%, and quantitatively consistent over the 3-month treatment period. Furthermore, Responders appear to record their impressions of clinical benefit in both the SGI and the MSWS-12.
PROPUESTA PARA EL PRÓXIMO ESTUDIO DE FASE 2PROPOSAL FOR THE NEXT PHASE 2 STUDY
[0140] Con el beneficio de estos análisis aplicados retrospectivamente para estudiar MS-F202 y también para estudiar MS-F201 (ver Tabla A5 en las Tablas y Figuras Suplementarias) Acorda Therapeutics propone realizar un nuevo estudio prospectivo, basado estrechamente en el diseño de MS-F202. Se eligió una dosis de 10 mg dos veces, ya que había poca evidencia de un aumento de la respuesta relacionado con la dosis. Por lo tanto, se eligió la dosis más baja para minimizar los eventos adversos, incluido, con suerte, el riesgo de convulsiones. [0140] With the benefit of these analyzes applied retrospectively to study MS-F202 and also to study MS-F201 (see Table A5 in the Supplementary Tables and Figures) Acorda Therapeutics proposes to carry out a new prospective study, closely based on the design of MS -F202. A 10 mg dose was chosen twice, as there was little evidence of a dose-related increase in response. Therefore, the lowest dose was chosen to minimize adverse events, including, hopefully, the risk of seizures.
[0141] Como se describe en la sinopsis del protocolo adjunto, este estudio declarará un punto final primario de respuesta en el análisis de respuesta predefinido. Además, como parte de los análisis secundarios, la importancia clínica de estas mejoras se evaluará por la magnitud de la mejora en la velocidad en el TW-25 y con los instrumentos globales SGI y MSWS-12. Se evaluará el beneficio clínico adicional mediante el uso de LEMMT para medir la fuerza muscular de las extremidades inferiores. [0141] As described in the attached protocol synopsis, this study will declare a primary response endpoint in the predefined response analysis. Furthermore, as part of the secondary analyzes, the clinical significance of these improvements will be assessed by the magnitude of the improvement in speed on the TW-25 and with the global SGI and MSWS-12 instruments. Additional clinical benefit will be assessed by using LEMMT to measure muscle strength in the lower extremities.
[0142] Se espera que este nuevo estudio demuestre importancia en el análisis del respondedor, basado en la consistencia de la respuesta a lo largo del tiempo. También se espera que demuestre un aumento sostenido en la velocidad de la marcha en respondedores en comparación con los no respondedores. El estudio también puede demostrar una mejora en los Respondedores en las medidas globales (SGI y MSWS-12). En el caso de que el estudio no pueda demostrar una separación clara de los Respondedores en estas medidas globales, se espera que proporcione información adicional sobre la variabilidad y la sensibilidad de los instrumentos a los cambios en la velocidad de la marcha. Esto será útil para evaluar más a fondo la validez potencial de estas medidas en este contexto y puede permitir cálculos de potencia apropiados para estudios posteriores. [0142] This new study is expected to demonstrate importance in respondent analysis, based on consistency of response over time. It is also expected to demonstrate a sustained increase in gait speed in responders compared to non-responders. The study may also demonstrate an improvement in Responders on global measures (SGI and MSWS-12). In the event that the study cannot demonstrate a clear separation of the Responders in these global measures, it is expected that it will provide additional information on the variability and sensitivity of the instruments to changes in gait speed. This will be useful to further assess the potential validity of these measurements in this context and may allow for appropriate power calculations for further studies.
TABLAS Y CIFRAS SUPLEMENTARIAS SUPPLEMENTARY TABLES AND FIGURES
Tasa de respuesta para grupos de dosis individuales (MS-F202)Response rate for individual dose groups (MS-F202)
[0143] La tasa de respuesta de los sujetos tratados con Fampridina-SR observados en el análisis agrupado fue consistente dentro de los tres grupos de fármacos, como se muestra en la Tabla A1. Del mismo modo, los análisis de grupos de dosis individuales de la magnitud del efecto, el mantenimiento del efecto y los efectos globales relacionados son ampliamente consistentes, aunque los tamaños de muestra pequeños limitan la importancia de los efectos observados. [0143] The response rate of subjects treated with Fampridine-SR observed in the pooled analysis was consistent across the three drug groups, as shown in Table A1. Similarly, analyzes of individual dose groups of effect magnitude, effect maintenance, and related global effects are largely consistent, although small sample sizes limit the significance of the observed effects.

Características basales de los grupos de respuesta (MS-F202)Baseline Characteristics of Response Groups (MS-F202)
[0144] No hubo diferencias significativas entre los grupos de respuesta, no respuesta y placebo en términos de características basales o demográficas, como se muestra en las siguientes tablas (A2-A4). [0144] There were no significant differences between the response, non-response, and placebo groups in terms of baseline or demographic characteristics, as shown in the following tables (A2-A4).


(continúa)(keep going)

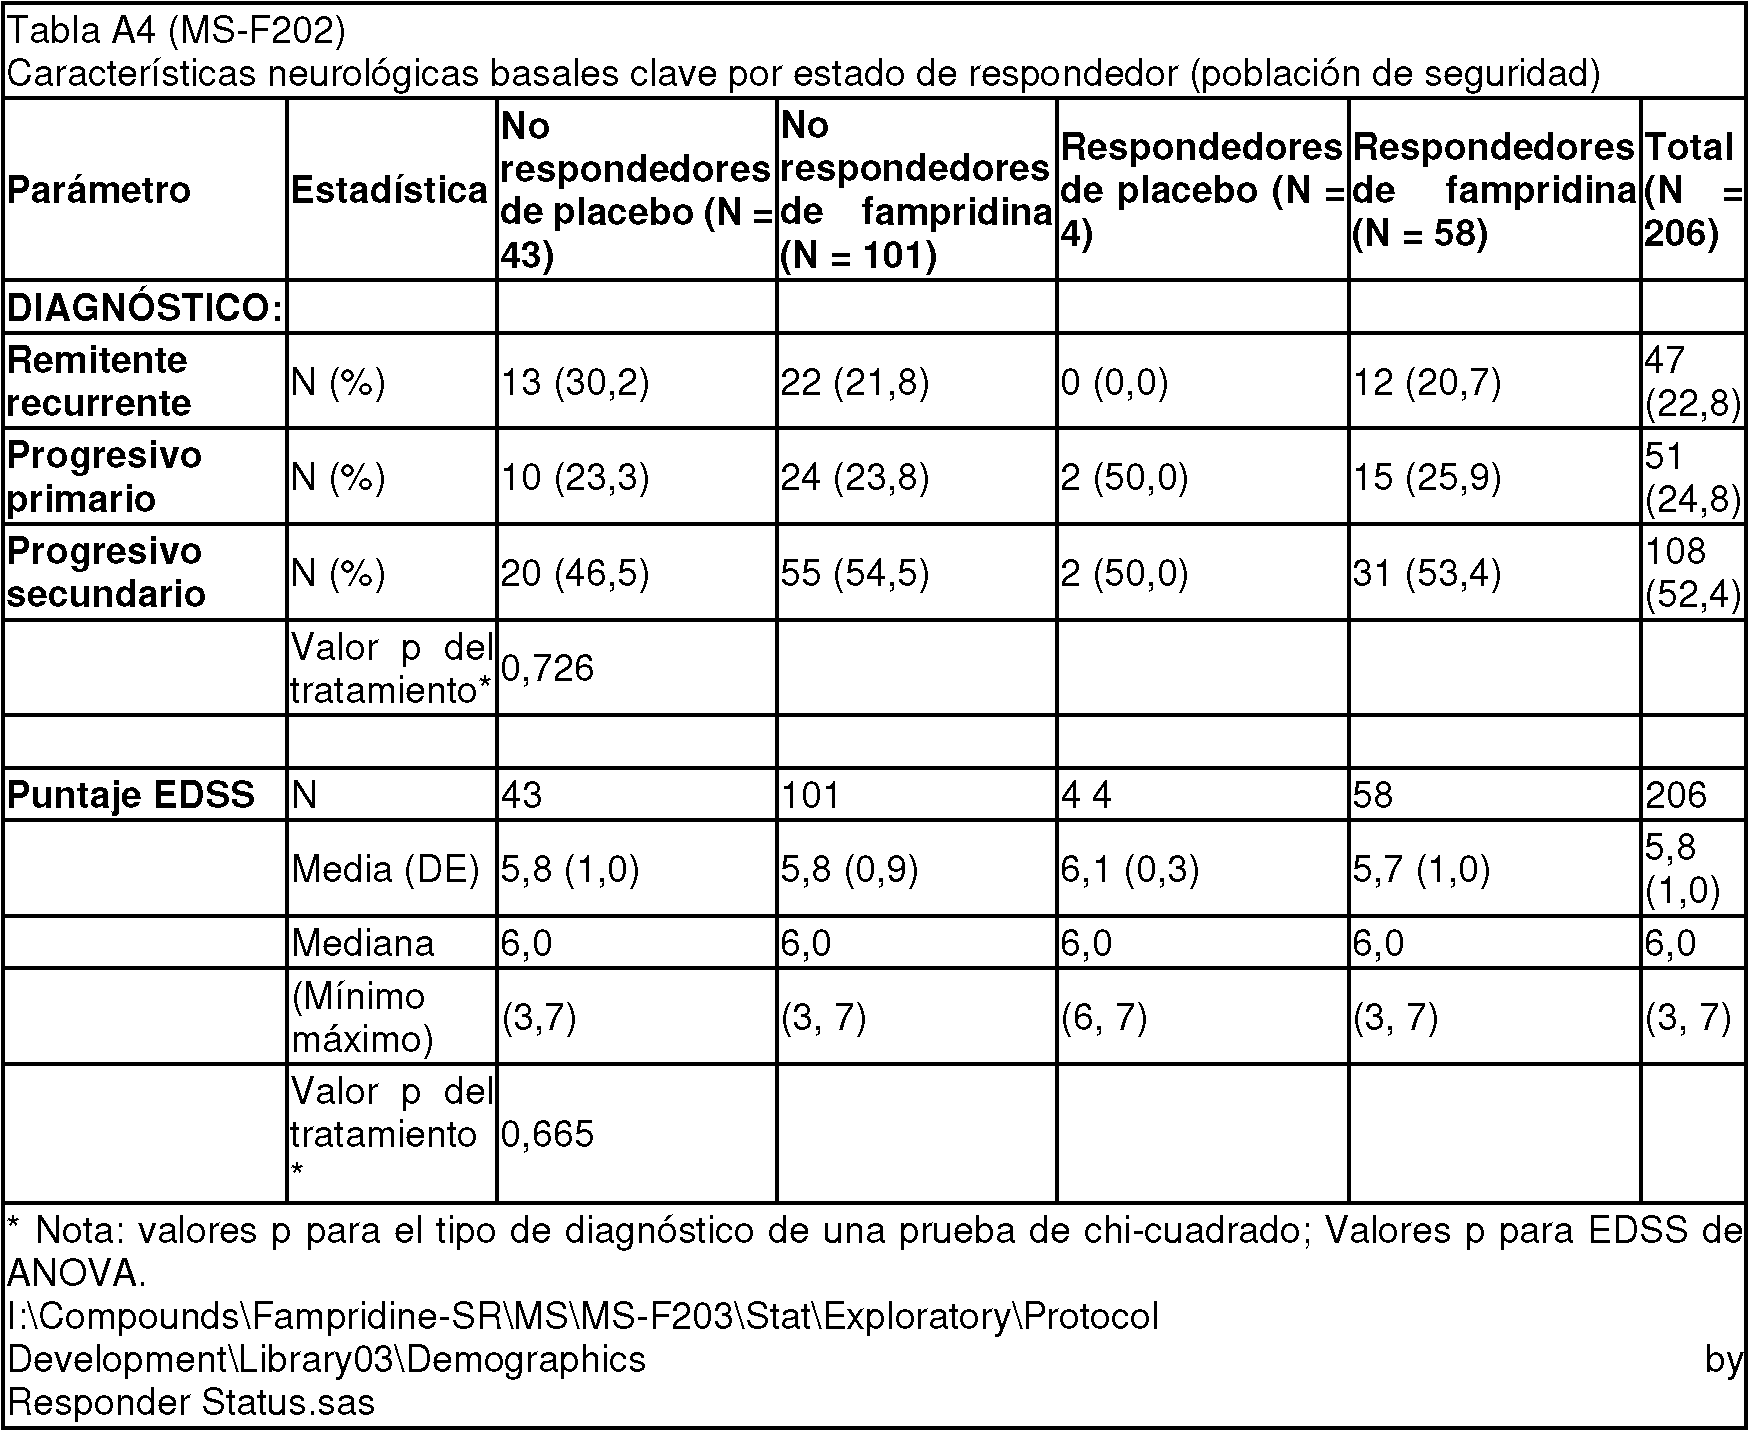
Análisis de respuesta equivalente en el estudio MS-F201Equivalent response analysis in study MS-F201
[0145] En este análisis, los datos del Estudio MS-F201 se trataron de una manera aproximadamente equivalente al enfoque para MS-F202, utilizando las primeras cuatro visitas al fármaco (una visita por semana, con un aumento de dosis semanal hasta 10, 15, 20 y 25 mg b.i.d.) y en comparación con 5 visitas "sin medicamentos" antes de la aleatorización. Este fue un estudio más pequeño, con un grupo placebo muy pequeño, pero los resultados del análisis de respuesta fueron en gran medida consistentes con el Estudio MS-F202, particularmente con respecto al porcentaje de frecuencia de respuesta en los grupos tratados con Fampridina-SR y tratados con placebo. La medida MSWS-12 no se utilizó en este estudio. [0145] In this analysis, data from Study MS-F201 was treated in a manner roughly equivalent to the approach for MS-F202, using the first four visits to the drug (one visit per week, with a weekly dose increase to 10, 15, 20 and 25 mg bid) and compared to 5 "no drug" visits before randomization. This was a smaller study, with a very small placebo group, but the results of the response analysis were largely consistent with the MS-F202 Study, particularly with respect to the percentage of response frequency in the Fampridine-SR treated groups. and treated with placebo. The MSWS-12 measure was not used in this study.

(continúa)(keep going)

Probabilidad de visitas de tratamiento con velocidad de caminata más rápida (MS-F202)Probability of treatment visits with faster walking speed (MS-F202)
[0146][0146]

Fig. A1. Histograma para comparar la frecuencia observada de velocidad de caminata más rápida durante visitas de tratamiento en el grupo de placebo (como se muestra en la Figura 1) comparado con la simulación de modelo de ordenador del procedimiento de muestreo subyacente. La simulación implicó la generación por ordenador de 100.000 trenes de 9 números elegidos al azar y ensayar la frecuencia con la que los números 5-8 eran más grandes que el máximo de los números 1-4 y 9 en cada tren. El model predice un declive exponencial en la probabilidad de números más grandes de visitas positivas, y los valores observados eran cerca de esta distribución. Los valores observados ligeramente más altos pueden estar relacionados con esta tendencia para un aumento en la velocidad de caminata media a lo largo del ensayo en el grupo de placebo (ver Fig. A2).Fig. A1. Histogram to compare the observed frequency of faster walking speed during treatment visits in the placebo group (as shown in Figure 1) compared to the computer model simulation of the underlying sampling procedure. The simulation involved computer generation of 100,000 trains of 9 randomly chosen numbers and testing the frequency with which numbers 5-8 were larger than the maximum of numbers 1-4 and 9 on each train. The model predicts an exponential decline in the probability of larger numbers of positive visits, and the observed values were close to this distribution. Slightly higher observed values may be related to this trend for an increase in mean walking speed throughout the trial in the placebo group (see Fig. A2 ).
Cambio en la velocidad de marcha con el tiempo de tratamiento - Fampridina agrupada-Grupo SR (MS-F202)Change in walking speed with treatment time - Grouped Fampridine-Group SR (MS-F202)
[0147] [0147]

Fig. A2. Traza y tabla para comparar el cambio medio en velocidad de caminata en cada tratamiento para el grupo agrupado de Fampridina-SR con el cambio en el grupo de placebo. Los ca en este análisis original se midieron de la media durante las visitas de placebo. Este análisis da la impresión de una mejora inicial en velocidad que disminuye a lo largo del tiempo, perdiendo significado antes de la última visita de estudio. El análisis de respondedor (como en la Fig. 4 , anteriormente) muestra que el declive aparente en la mejora se debía a una mejora transitoria temprana y una caída subsiguiente en la última visita en el grupo de no respondedor de fambridina-SR. Los sujetos de respondedor de fampridina-SR, con una mejora consistente a lo largo del tratamiento eran responsables de la mayoría del efecto general de tratamiento. Por lo tanto, la variabilidad temporal vista aquí en el análisis de medios parece ser bastante distinta de la mejora marcada relacionada con el tratamiento en velocidad. Fig. A2. Plot and table to compare the mean change in walking speed at each treatment for the Fampridine-SR group group with the change in the placebo group. The ac's in this original analysis were measured from the mean during the placebo visits. This analysis gives the impression of an initial improvement in speed that decreases over time, losing meaning before the last study visit. The responder analysis (as in Fig. 4 , above) shows that the apparent decline in improvement was due to an early transient improvement and a subsequent decline at the last visit in the fambridine-SR non-responder group. Fampridine-SR responder subjects, with consistent improvement throughout treatment, were responsible for most of the overall treatment effect. Therefore, the temporal variability seen here in the media analysis appears to be quite different from the marked improvement related to speed treatment.
Variabilidad de las medidas globales (MS-F202)Variability of global measures (MS-F202)
[0148] Los datos de estudio MS-F202 proporcionan solo información limitada sobre las dos medidas globales sujeto (SGI y TSM-12), pero suficiente para ilustrar la naturaleza muy variable de las respuestas en estos instrumentos. Incluso en el grupo tratado con placebo, tanto SGI como MSWS-12 mostraron un rango mucho más alto de variabilidad espontánea entre las visitas de estudio que el TW25 o la fuerza de la extremidad inferior, que son medidas de función más directas y objetivas (ver Figura A3 a continuación). [0148] The MS-F202 study data provides only limited information on the two global subject measures (SGI and TSM-12), but sufficient to illustrate the highly variable nature of the responses in these instruments. Even in the placebo group, both SGI and MSWS-12 showed a much higher range of spontaneous variability between study visits than TW25 or lower limb strength, which are more direct and objective measures of function (see Figure A3 below).

Fig. A3. Diagramas mostrando la variabilidad de cuatro mediciones diferentes de función de extremidad inferior entre las mediciones de línea de base y las mediciones después de 6 semanas en el estudio de doble ciego (Estudio Día 45) para el grupo tratado con placebo en el Estudio MS-F202. Tanto SGI como MSWS-12 muestran más variabilidad (difusión) y menos estabilidad general (pendiente) con respecto a la línea de base que la velocidad de caminata en el TW25 y fuerza de pierna en la escala LEMMT. Ten en cuenta que SGI está restringida a los valores enteros, y el diagrama indica el intervalo de valores y la frecuencia por número en puntos con frecuencia >1. Fig. A3. Diagrams showing the variability of four different measurements of lower limb function between baseline measurements and measurements after 6 weeks in the double-blind study (Study Day 45) for the group treated with placebo in Study MS-F202 . Both SGI and MSWS-12 show more variability (diffusion) and less overall stability (slope) relative to baseline than walking speed on TW25 and leg strength on the LEMMT scale. Note that SGI is restricted to integer values, and the diagram indicates the range of values and the frequency per number in points with frequency> 1.
[0149] En la Figura A4 se proporciona un análisis adicional de las puntuaciones de MSWS-12 en sujetos tratados con placebo. Esto muestra que la evaluación individual del impacto de los déficits ambulatorios en la función cotidiana es notablemente variable para un nivel dado de déficit diana, según lo definido por la caminata cronometrada. Es probable que esto refleje grandes disparidades en la expectativa de los sujetos y los estilos de vida adoptados, lo que puede permitir que un sujeto se sienta severamente discapacitado por una disminución relativamente pequeña de la función motora, mientras que otro puede adaptar el estilo de vida y las expectativas a un déficit ambulatorio severo y persistente, y podría por lo tanto, tome un tiempo considerable para readaptarse o incluso reconocer un nuevo nivel de función. [0149] Further analysis of MSWS-12 scores in subjects treated with placebo is provided in Figure A4 . This shows that the individual assessment of the impact of outpatient deficits on daily function is remarkably variable for a given level of target deficit, as defined by timed walking. This is likely to reflect large disparities in subject expectation and adopted lifestyles, which may allow one subject to feel severely disabled by a relatively small decline in motor function, while another may adapt lifestyle. and expectations for a severe and persistent outpatient deficit, and could therefore take considerable time to re-adjust or even recognize a new level of function.
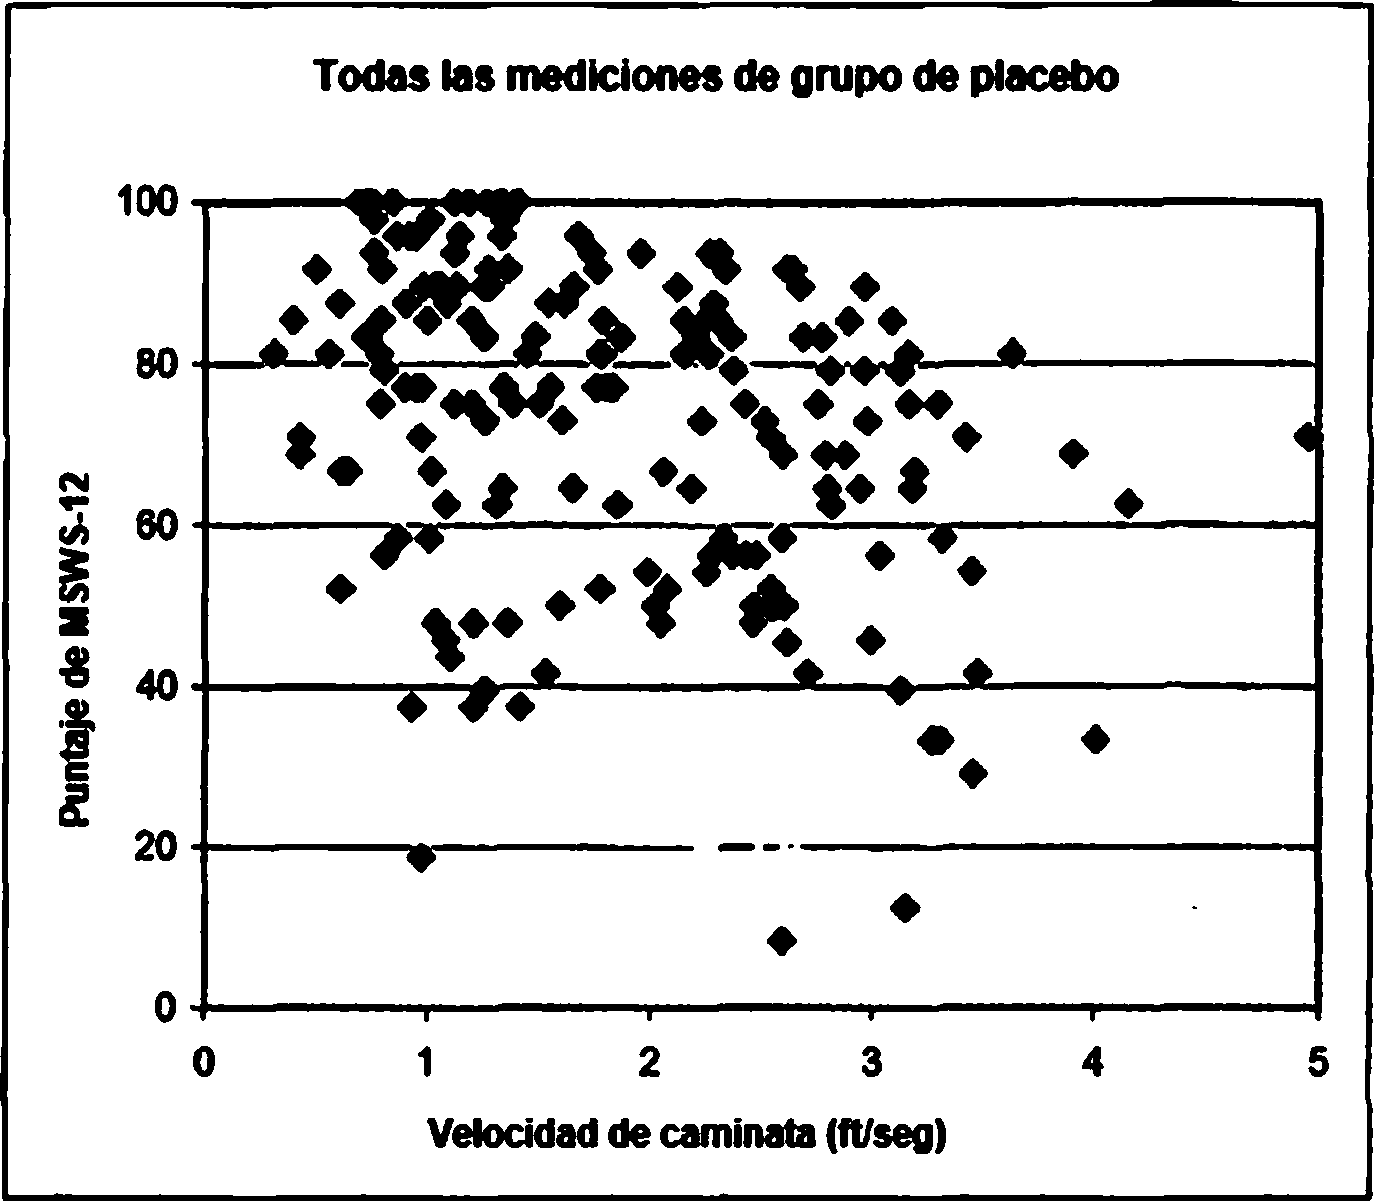
Fig. A4 Gráfico para mostrar la relación entre el puntaje de MSWS-12 y la velocidad de caminata, medida con el TW25 para todo el grupo tratado con placeblo durante las cuatro visitas de estudio en las que se utilizó el instrumento. El puntaje de MSWS-12 muestra una severidad creciente de impacto en la velocidad de caminata con números más altos. Una velocidad de caminata normal es 5,5-6 ft/seg.Fig. A4 Graph to show the relationship between the MSWS-12 score and the walking speed, measured with the TW25 for the entire group treated with placeblo during the four study visits in which the instrument was used. The MSWS-12 score shows increasing severity of impact on walking speed with higher numbers. A normal walking speed is 5.5-6 ft / sec.
Apéndice EAppendix e
[0150] [0150]

Claims (14)
Applications Claiming Priority (2)
| Application Number | Priority Date | Filing Date | Title |
|---|---|---|---|
| US71989605P | 2005-09-23 | 2005-09-23 | |
| PCT/US2006/037387 WO2007035958A2 (en) | 2005-09-23 | 2006-09-25 | Method, apparatus and software for identifying responders in a clinical environment |
Publications (1)
| Publication Number | Publication Date |
|---|---|
| ES2746121T3 true ES2746121T3 (en) | 2020-03-04 |
Family
ID=37889582
Family Applications (1)
| Application Number | Title | Priority Date | Filing Date |
|---|---|---|---|
| ES06815414T Active ES2746121T3 (en) | 2005-09-23 | 2006-09-25 | Method, apparatus and software for the identification of responders in a clinical setting |
Country Status (7)
| Country | Link |
|---|---|
| US (2) | US20090150180A1 (en) |
| EP (1) | EP1940285B1 (en) |
| AU (1) | AU2006292064A1 (en) |
| CA (1) | CA2623955C (en) |
| ES (1) | ES2746121T3 (en) |
| MX (1) | MX2008004015A (en) |
| WO (1) | WO2007035958A2 (en) |
Families Citing this family (16)
| Publication number | Priority date | Publication date | Assignee | Title |
|---|---|---|---|---|
| US8007826B2 (en) | 2003-12-11 | 2011-08-30 | Acorda Therapeutics, Inc. | Sustained release aminopyridine composition |
| US8354437B2 (en) | 2004-04-09 | 2013-01-15 | Acorda Therapeutics, Inc. | Method of using sustained release aminopyridine compositions |
| WO2007022020A2 (en) * | 2005-08-12 | 2007-02-22 | Archimedes, Inc. | Dynamic healthcare modeling |
| WO2009049276A1 (en) | 2007-10-12 | 2009-04-16 | Patientslikeme, Inc. | Personalized management and monitoring of medical conditions |
| AU2009291781A1 (en) * | 2008-09-10 | 2010-03-18 | Acorda Therapeutics, Inc. | Methods of using sustained release aminopyridine compositions |
| US8694300B2 (en) * | 2008-10-31 | 2014-04-08 | Archimedes, Inc. | Individualized ranking of risk of health outcomes |
| WO2010090730A1 (en) * | 2009-02-03 | 2010-08-12 | Acorda Therapeutics, Inc. | Method, apparatus and software for identifying responders in a clinical environment |
| EP2430574A1 (en) | 2009-04-30 | 2012-03-21 | Patientslikeme, Inc. | Systems and methods for encouragement of data submission in online communities |
| WO2010138640A2 (en) * | 2009-05-27 | 2010-12-02 | Archimedes, Inc. | Healthcare quality measurement |
| US20110105852A1 (en) * | 2009-11-03 | 2011-05-05 | Macdonald Morris | Using data imputation to determine and rank of risks of health outcomes |
| US20120209081A1 (en) * | 2011-02-11 | 2012-08-16 | Abbas Sadeghian | Method of preventing patient injury |
| WO2015077708A1 (en) * | 2013-11-22 | 2015-05-28 | Cambridge Social Science Decision Lab Inc. | Methods, systems, and articles of manufacture for the management and identification of causal knowledge |
| WO2019055879A2 (en) | 2017-09-15 | 2019-03-21 | PatientsLikeMe Inc. | Systems and methods for collecting and analyzing comprehensive medical information |
| US11894139B1 (en) | 2018-12-03 | 2024-02-06 | Patientslikeme Llc | Disease spectrum classification |
| CN112732165B (en) * | 2019-10-28 | 2024-07-16 | 北京沃东天骏信息技术有限公司 | Offset management method, device and storage medium |
| CN114283908A (en) * | 2021-12-23 | 2022-04-05 | 康奥生物科技(天津)股份有限公司 | Subject data management method and system and electronic equipment |
Family Cites Families (9)
| Publication number | Priority date | Publication date | Assignee | Title |
|---|---|---|---|---|
| US20020010552A1 (en) * | 2000-05-26 | 2002-01-24 | Hugh Rienhoff | System for genetically characterizing an individual for evaluation using genetic and phenotypic variation over a wide area network |
| AU2002239664A1 (en) * | 2000-12-26 | 2002-07-08 | Robert E. Becker | Method for drug development using individual patient response |
| WO2003057011A2 (en) * | 2002-01-04 | 2003-07-17 | Canswers Llc | Systems and methods for predicting disease behavior |
| US20030143548A1 (en) * | 2002-01-28 | 2003-07-31 | Camilleri Michael L. | Predicting patient responsiveness to serotonergic therapy |
| US20030088365A1 (en) * | 2002-08-01 | 2003-05-08 | Robert Becker | System and method of drug development for selective drug use with individual, treatment responsive patients, and applications of the method in medical care |
| US7970550B2 (en) * | 2002-09-16 | 2011-06-28 | Optimata, Ltd | Interactive technique for optimizing drug development from the pre-clinical phases through phase-IV |
| US20040172447A1 (en) * | 2003-01-14 | 2004-09-02 | Miller Dale Christopher | Systems and methods for managing data |
| US7347818B2 (en) * | 2003-02-24 | 2008-03-25 | Neurotrax Corporation | Standardized medical cognitive assessment tool |
| US20050075832A1 (en) | 2003-09-22 | 2005-04-07 | Ikeguchi Edward F. | System and method for continuous data analysis of an ongoing clinical trial |
-
2006
- 2006-09-25 ES ES06815414T patent/ES2746121T3/en active Active
- 2006-09-25 CA CA2623955A patent/CA2623955C/en active Active
- 2006-09-25 MX MX2008004015A patent/MX2008004015A/en not_active Application Discontinuation
- 2006-09-25 AU AU2006292064A patent/AU2006292064A1/en not_active Abandoned
- 2006-09-25 EP EP06815414.5A patent/EP1940285B1/en not_active Not-in-force
- 2006-09-25 WO PCT/US2006/037387 patent/WO2007035958A2/en not_active Ceased
- 2006-09-25 US US11/659,456 patent/US20090150180A1/en not_active Abandoned
-
2018
- 2018-06-01 US US15/996,338 patent/US20180277256A1/en not_active Abandoned
Also Published As
| Publication number | Publication date |
|---|---|
| EP1940285B1 (en) | 2019-05-29 |
| AU2006292064A1 (en) | 2007-03-29 |
| WO2007035958A3 (en) | 2007-07-19 |
| EP1940285A4 (en) | 2010-11-24 |
| CA2623955C (en) | 2019-12-17 |
| US20090150180A1 (en) | 2009-06-11 |
| EP1940285A2 (en) | 2008-07-09 |
| MX2008004015A (en) | 2008-11-26 |
| CA2623955A1 (en) | 2007-03-29 |
| WO2007035958A2 (en) | 2007-03-29 |
| US20180277256A1 (en) | 2018-09-27 |
Similar Documents
| Publication | Publication Date | Title |
|---|---|---|
| ES2746121T3 (en) | Method, apparatus and software for the identification of responders in a clinical setting | |
| Barclay et al. | A clinical trial of cranial electrotherapy stimulation for anxiety and comorbid depression | |
| George et al. | Daily left prefrontal transcranial magnetic stimulation therapy for major depressive disorder: a sham-controlled randomized trial | |
| Cohen et al. | Epidural steroid injections compared with gabapentin for lumbosacral radicular pain: multicenter randomized double blind comparative efficacy study | |
| Kang et al. | Effectiveness of multimodal pain management after bipolar hemiarthroplasty for hip fracture: a randomized, controlled study | |
| Campbell et al. | Persistent pain and depression: a biopsychosocial perspective | |
| Stanmore et al. | Risk factors for falls in adults with rheumatoid arthritis: a prospective study | |
| Sanderson et al. | Placebo and nocebo effects in randomized controlled trials: the implications for research and practice | |
| Zucker et al. | Lessons learned combining N-of-1 trials to assess fibromyalgia therapies. | |
| Cook et al. | Randomized clinical trial assessing whether additional massage treatments for chronic neck pain improve 12-and 26-week outcomes | |
| Ogunniran et al. | Effects of kinesiology taping and core stability exercise on clinical variables in patients with non-specific chronic low back pain: a randomized controlled trial | |
| Silberstein et al. | Defining the pharmacologically intractable headache for clinical trials and clinical practice | |
| van Eijs et al. | Spinal cord stimulation in complex regional pain syndrome type I of less than 12-month duration | |
| Matangila et al. | Efficacy and safety of intermittent preventive treatment in schoolchildren with sulfadoxine/pyrimethamine (SP) and SP plus piperaquine in Democratic Republic of the Congo: a randomised controlled trial | |
| Bounes et al. | Treatment of acute renal colic in US and French EDs: simulated cases and real cases in acute pain management | |
| Mikkelsen et al. | Engaging the older cancer patient; Patient Activation through Counseling, Exercise and Mobilization–Pancreatic, Biliary tract and Lung cancer (PACE-Mobil-PBL)-study protocol of a randomized controlled trial | |
| Aggarwal et al. | Implementation of biopsychosocial supported self‐management for chronic primary oro‐facial pain including temporomandibular disorders: A theory, person and evidence‐based approach | |
| Beaucage-Charron et al. | A randomized double-blind feasibility study comparing cetirizine and diphenhydramine in the prevention of paclitaxel-associated infusion-related reactions: the PREMED-F1 study | |
| White et al. | Interventions for fatigue in peripheral neuropathy | |
| Oh et al. | Nurse-led computerized cognitive training for mild cognitive impairment: a preliminary study | |
| Burton | Autoregulated heavy slow resistance training combined with radial shockwave therapy for plantar heel pain: Protocol for a mixed‐methods pilot randomised controlled trial | |
| He et al. | Quantitative sensory testing of mandibular somatosensory function following orthognathic surgery—A pilot study in Chinese with class III malocclusion | |
| Koyuncu et al. | Acetaminophen reduces acute and persistent incisional pain after hysterectomy | |
| Essick et al. | Sensory retraining following orthognathic surgery: effect on threshold measures of sensory function | |
| Koog et al. | Barriers to participant retention in knee osteoarthritis clinical trials: a systematic review |