ES2835175T3 - Method for counting and segmentation of viral particles in an image - Google Patents
Method for counting and segmentation of viral particles in an image Download PDFInfo
- Publication number
- ES2835175T3 ES2835175T3 ES08746847T ES08746847T ES2835175T3 ES 2835175 T3 ES2835175 T3 ES 2835175T3 ES 08746847 T ES08746847 T ES 08746847T ES 08746847 T ES08746847 T ES 08746847T ES 2835175 T3 ES2835175 T3 ES 2835175T3
- Authority
- ES
- Spain
- Prior art keywords
- viral particles
- objects
- viral
- cluster
- images
- Prior art date
- Legal status (The legal status is an assumption and is not a legal conclusion. Google has not performed a legal analysis and makes no representation as to the accuracy of the status listed.)
- Active
Links
Classifications
-
- G—PHYSICS
- G06—COMPUTING OR CALCULATING; COUNTING
- G06V—IMAGE OR VIDEO RECOGNITION OR UNDERSTANDING
- G06V20/00—Scenes; Scene-specific elements
- G06V20/60—Type of objects
- G06V20/69—Microscopic objects, e.g. biological cells or cellular parts
- G06V20/695—Preprocessing, e.g. image segmentation
-
- G—PHYSICS
- G01—MEASURING; TESTING
- G01N—INVESTIGATING OR ANALYSING MATERIALS BY DETERMINING THEIR CHEMICAL OR PHYSICAL PROPERTIES
- G01N21/00—Investigating or analysing materials by the use of optical means, i.e. using sub-millimetre waves, infrared, visible or ultraviolet light
-
- G—PHYSICS
- G06—COMPUTING OR CALCULATING; COUNTING
- G06T—IMAGE DATA PROCESSING OR GENERATION, IN GENERAL
- G06T1/00—General purpose image data processing
- G06T1/20—Processor architectures; Processor configuration, e.g. pipelining
Landscapes
- Engineering & Computer Science (AREA)
- General Physics & Mathematics (AREA)
- Physics & Mathematics (AREA)
- Life Sciences & Earth Sciences (AREA)
- Theoretical Computer Science (AREA)
- General Health & Medical Sciences (AREA)
- Health & Medical Sciences (AREA)
- Multimedia (AREA)
- Molecular Biology (AREA)
- Biomedical Technology (AREA)
- Chemical & Material Sciences (AREA)
- Analytical Chemistry (AREA)
- Biochemistry (AREA)
- Immunology (AREA)
- Pathology (AREA)
- Investigating Or Analysing Biological Materials (AREA)
- Measuring Or Testing Involving Enzymes Or Micro-Organisms (AREA)
- Analysing Materials By The Use Of Radiation (AREA)
Abstract
Un método para la identificación de partículas virales mediante conteo intracelular y segmentación de partículas virales en una imagen, que comprende: proporcionar imágenes de microscopio electrónico de transmisión (TEM), adquiridas con un microscopio electrónico, que tienen una pluralidad de objetos representados en ellos, los objetos relacionados con partículas virales y otras partículas que tienen formas elípticas y las imágenes que muestran células infectadas con partículas virales y tratadas con diferentes tratamientos de ARNip; las imágenes, examinadas en el microscopio electrónico de transmisión, fueron capturadas por una cámara digital como imágenes digitales; definir un radio máximo y un radio mínimo de objetos elípticos como un intervalo de radio permitido en la imagen; encontrar objetos elípticos en la imagen y determinar un radio máximo y mínimo de los objetos elípticos; descartar objetos con intervalos radiales fuera del intervalo radial permitido; segmentar cada objeto en la imagen aplicando un análisis invariante de rotación e invariante angular calculando un perfil de densidad radial desde el centro de cada objeto y eliminando la intensidad media para compensar los diferentes niveles de brillo en las diferentes imágenes; trazar los perfiles de densidad radial de las partículas virales en un espacio vectorial lineal (LVS) de modo que se muestren una primera agrupación y una segunda agrupación de partículas virales, representando la primera agrupación envolturas virales vacías y representando la segunda agrupación partículas virales maduras; contar individualmente partículas virales representadas en la etapa anterior; representar los perfiles de densidad radial media para los tipos de partículas virales tratadas con ARNip en la primera agrupación; representar los perfiles de densidad radial media para los mismos tipos de partículas virales tratadas con ARNip en la segunda agrupación; y analizar los cambios morfológicos/estructurales de las partículas virales en las agrupaciones representadas en el LVS para discriminar las diferencias estructurales entre las partículas virales tratadas con ARNip cuando se exponen a los tratamientos de ARNip.A method for the identification of viral particles by intracellular counting and segmentation of viral particles in an image, comprising: providing transmission electron microscope (TEM) images, acquired with an electron microscope, that have a plurality of objects represented on them, objects related to viral particles and other particles having elliptical shapes and images showing cells infected with viral particles and treated with different siRNA treatments; the images, examined in the transmission electron microscope, were captured by a digital camera as digital images; define a maximum radius and a minimum radius of elliptical objects as a radius range allowed in the image; find elliptical objects in the image and determine a maximum and minimum radius of the elliptical objects; discard objects with radial intervals outside the allowed radial interval; segmenting each object in the image applying a rotation invariant and angle invariant analysis calculating a radial density profile from the center of each object and eliminating the average intensity to compensate for the different brightness levels in the different images; plotting the radial density profiles of the viral particles in a linear vector space (LVS) such that a first cluster and a second cluster of viral particles are shown, the first cluster representing empty viral envelopes and the second cluster representing mature viral particles; individually counting viral particles represented in the previous step; plotting the mean radial density profiles for the siRNA-treated viral particle types in the first cluster; plotting the mean radial density profiles for the same types of siRNA-treated viral particles in the second cluster; and analyzing the morphological / structural changes of the viral particles in the clusters represented in the LVS to discriminate the structural differences between the siRNA-treated viral particles when exposed to siRNA treatments.
Description
DESCRIPCIÓNDESCRIPTION
Método para el conteo y segmentación de partículas virales en una imagenMethod for counting and segmentation of viral particles in an image
Campo técnicoTechnical field
El método se refiere al conteo, segmentación e identificación de objetos tales como partículas virales representadas en una imagen tales como imágenes de microscopía electrónica.The method refers to the counting, segmentation and identification of objects such as viral particles represented in an image such as electron microscopy images.
Antecedentes de la invenciónBackground of the invention
Se han realizado muchos esfuerzos en el pasado para clasificar y analizar las estructuras celulares que incluyen virus y otros componentes. Se han desarrollado varios métodos de análisis de imágenes para describir, segmentar y clasificar virus utilizando tecnologías de obtención de imágenes disponibles. Por ejemplo, se ha utilizado la criomicroscopía electrónica, pero las estructuras de las células y las partículas virales no se muestran muy bien. También ha sido difícil describir de forma objetiva, repetida y fiable los componentes celulares para determinar con precisión las fases de madurez de los componentes celulares.Many efforts have been made in the past to classify and analyze cell structures that include viruses and other components. Various image analysis methods have been developed to describe, segment, and classify viruses using available imaging technologies. For example, electron cryomicroscopy has been used, but the structures of cells and viral particles are not shown very well. It has also been difficult to objectively, repeatedly, and reliably describe cellular components to accurately determine the stages of maturity of cellular components.
Más particularmente, el ensamblaje del virus es un proceso complejo y un objeto de investigación intensiva. Los virus utilizan una célula anfitriona para producir partículas virales de su progenie mediante un complejo proceso de maduración y transporte intracelular. Este proceso se puede verificar con gran aumento utilizando microscopía electrónica (EM), que permite la identificación visual de diferentes tipos de partículas virales en diferentes compartimentos celulares. Los problemas importantes que quedan por resolver incluyen la identidad de las proteínas virales que participan en cada etapa de este proceso de ensamblaje del virus, así como el mecanismo de la translocación intracelular subyacente y la localización de diferentes tipos de partículas virales durante la maduración del virus. Los aspectos estructurales de la maduración del virus son generalmente difíciles de abordar, aunque las técnicas de visualización tales como la tomografía y la crio-EM han contribuido a la información disponible sobre las estructuras del virus. Estas técnicas se pueden utilizar para proporcionar información sobre partículas virales maduras estables. Hay herramientas genéticas disponibles para producir mutantes de componentes proteicos virales clave. La EM se puede utilizar para visualizar los efectos estructurales. Sin embargo, no existen herramientas adecuadas para caracterizar los efectos estructurales, especialmente las formas de partículas intermedias y oscuras, y para cuantificarlas adecuadamente de manera objetiva.More particularly, virus assembly is a complex process and an intensive research object. Viruses use a host cell to produce viral particles from their progeny through a complex process of maturation and intracellular transport. This process can be verified under high magnification using electron microscopy (EM), which allows visual identification of different types of viral particles in different cell compartments. Important issues that remain to be resolved include the identity of the viral proteins involved in each stage of this virus assembly process, as well as the underlying intracellular translocation mechanism and localization of different types of viral particles during virus maturation. . The structural aspects of virus maturation are generally difficult to address, although visualization techniques such as tomography and cryo-EM have contributed to the available information on virus structures. These techniques can be used to provide information on stable mature viral particles. Genetic tools are available to produce mutants of key viral protein components. EM can be used to visualize structural effects. However, there are no adequate tools to characterize the structural effects, especially the intermediate and dark particle shapes, and to objectively quantify them properly.
Esto explica en parte por qué los métodos de análisis anteriores no han sido muy eficaces y existe la necesidad de métodos más eficaces para analizar las estructuras de partículas virales y celulares. Existe una necesidad de herramientas de análisis de imágenes para caracterizar y cuantificar la maduración de partículas virales y el transporte intracelular para facilitar estudios objetivos de diferentes ensamblajes del virus. También existe la necesidad de un método eficaz para identificar y cuantificar las partículas virales representadas en una imagen.This partly explains why previous analysis methods have not been very efficient and there is a need for more efficient methods to analyze cellular and viral particle structures. There is a need for image analysis tools to characterize and quantify viral particle maturation and intracellular transport to facilitate objective studies of different virus assemblages. There is also a need for an efficient method to identify and quantify viral particles represented in an image.
Compendio de la invenciónCompendium of the invention
El método de la presente invención proporciona una solución a los problemas descritos anteriormente. El método se puede utilizar para el conteo intracelular y la segmentación de partículas virales en imágenes tales como imágenes de microscopía electrónica. Se proporciona una imagen que tiene una pluralidad de objetos/elementos en su interior. Se identifican todos los objetos redondos y elípticos de la imagen. Los objetos redondos y elípticos se clasifican en grupos. Se determina un perfil de densidad radial de las partículas virales redondas. También se determinan los elementos elípticos que se pueden formar a partir del perfil de densidad radial de partículas virales redondas. Las partículas virales se identifican entre los grupos de objetos redondos y elípticos clasificados analizando los perfiles de densidad radial de los objetos de un grupo seleccionado. Por ejemplo, el método se puede utilizar para el conteo intracelular y la segmentación de partículas citomegalovirales humanas tratadas con ARNip en imágenes TEM.The method of the present invention provides a solution to the problems described above. The method can be used for intracellular counting and segmentation of viral particles in images such as electron microscopy images. An image is provided having a plurality of objects / items within it. All round and elliptical objects in the image are identified. Round and elliptical objects are classified into groups. A radial density profile of the round viral particles is determined. The elliptical elements that can be formed are also determined from the radial density profile of round viral particles. Viral particles are identified among the classified round and elliptical groups of objects by analyzing the radial density profiles of the objects in a selected group. For example, the method can be used for intracellular counting and segmentation of siRNA-treated human cytomegaloviral particles on TEM imaging.
Breve Descripción de los DibujosBrief Description of Drawings
La Figura 1A es un ejemplo esquemático de una imagen invariante de rotación (A);Figure 1A is a schematic example of a rotation invariant image (A);
La Figura 1B es un ejemplo esquemático de una imagen invariante angular (B);Figure 1B is a schematic example of an angle invariant image (B);
La Figura 2 es una ilustración gráfica de medidas de densidad para cinco conjuntos de imágenes;Figure 2 is a graphical illustration of density measurements for five sets of images;
La Figura 3 es una vista esquemática de los perfiles de densidad radial de todos los conjuntos de imágenes colocados en un LVS;Figure 3 is a schematic view of the radial density profiles of all image sets placed on an LVS;
La Figura 4 es una vista esquemática de perfiles radiales medios con desviación típica en líneas de trazos y puntos alrededor de la media del subconjunto A;Figure 4 is a schematic view of mean radial profiles with standard deviation in dashed and dotted lines around the mean of subset A;
La Figura 5 es una vista esquemática de los perfiles radiales medios con desviación típica en líneas de trazos y puntos alrededor de la media para el subconjunto B; y Figure 5 is a schematic view of the mean radial profiles with standard deviation in dashed lines and dots around the mean for subset B; Y
La Figura 6 es una vista esquemática en primer plano de la Figura 5 en radios entre 30 y 40 nm.Figure 6 is a close-up schematic view of Figure 5 at radii between 30 and 40 nm.
Descripción DetalladaDetailed description
El método de la presente invención se puede utilizar para buscar, segmentar e identificar partículas/objetos en imágenes, tales como objetos representados en imágenes de microscopía electrónica de transmisión (TEM). Los objetos identificados en las imágenes se pueden relacionar con partículas virales y otras partículas que tienen formas redondas y elípticas. Las formas elípticas se pueden definir por tener un radio máximo y un radio mínimo, mientras que las formas perfectamente redondas tienen un radio cada una. Preferiblemente, el método determina qué elementos de forma elíptica se pueden formar a partir del intervalo de radio de las partículas virales que se van a analizar. Por ejemplo, si la partícula viral tiene un radio de 100 unidades, en ese caso el radio máximo y el radio mínimo de las formas elípticas pueden ser, por ejemplo, un 20% mayores (o 120 unidades) y un 20% menores (o 80 unidades) que el radio de la partícula viral cuando la partícula viral es redonda. Si el radio máximo o el radio mínimo están fuera del intervalo de radio permitido, el elemento se considera inaceptable y no se identificará como una partícula viral. A continuación, las formas redondas y elípticas se ordenan y agrupan para que los intervalos radiales similares se agrupen. Después, las partículas virales se identifican y cuantifican en las formas agrupadas de los elementos. También es posible identificar las partículas virales que se encuentran entre dos fases de madurez diferentes, es decir, que están en una fase de madurez que está entre dos grupos de madurez diferentes. Las partículas virales pueden tener un perfil de densidad radial predeterminado y se puede utilizar una ecuación matemática, tal como la transformación de Fourier, para determinar qué objetos de forma elíptica, basados en el perfil de densidad radial predeterminado que es típico de las partículas virales, son partículas virales. Preferiblemente, no es necesario utilizar folletos que muestren perfiles de densidad radial de partículas virales en determinadas fases de madurez, ya que pueden no encontrarse partículas virales dañadas o partículas virales que se encuentren entre dos fases de madurez diferentes de los folletos utilizando los folletos.The method of the present invention can be used to search, segment and identify particles / objects in images, such as objects represented in transmission electron microscopy (TEM) images. The objects identified in the images can be related to viral particles and other particles that have round and elliptical shapes. Elliptical shapes can be defined as having a maximum radius and a minimum radius, while perfectly round shapes each have a radius. Preferably, the method determines which elliptically shaped elements can be formed from the radius range of the viral particles to be analyzed. For example, if the viral particle has a radius of 100 units, then the maximum radius and the minimum radius of the elliptical shapes can be, for example, 20% larger (or 120 units) and 20% smaller (or 80 units) than the radius of the viral particle when the viral particle is round. If the maximum radius or the minimum radius is outside the allowed radius range, the element is considered unacceptable and will not be identified as a viral particle. The round and elliptical shapes are then arranged and grouped so that similar radial intervals are grouped together. The viral particles are then identified and quantified in the clustered forms of the elements. It is also possible to identify viral particles that are between two different maturity stages, that is, they are in a maturity phase that is between two different maturity groups. Viral particles can have a predetermined radial density profile and a mathematical equation, such as Fourier transform, can be used to determine which elliptically shaped objects, based on the predetermined radial density profile that is typical of viral particles, they are viral particles. Preferably, it is not necessary to use leaflets showing radial density profiles of viral particles at certain stages of maturity, since damaged viral particles or viral particles that fall between two different stages of leaflet maturity may not be found using the leaflets.
Puede ser posible determinar la distribución de los intervalos radiales o perfiles de densidad radial en agrupaciones, como se muestra en la Figura 3 y se describe en detalle a continuación. También, como se describe a continuación, las partículas virales pueden exponerse a una sustancia química, tal como un fármaco, y las etapas del método de la presente invención se pueden ejecutar de nuevo basándose en la imagen modificada para determinar cómo cambian la distribución de los tamaños de las partículas o los perfiles de densidad radial como resultado de la exposición a la sustancia química o al tratamiento médico. De esta manera, puede ser posible determinar la eficacia del tratamiento con sustancias químicas sobre las partículas virales.It may be possible to determine the distribution of radial intervals or radial density profiles in clusters, as shown in Figure 3 and described in detail below. Also, as described below, the viral particles can be exposed to a chemical, such as a drug, and the steps of the method of the present invention can be rerun based on the modified image to determine how they change the distribution of the viruses. particle sizes or radial density profiles as a result of chemical exposure or medical treatment. In this way, it may be possible to determine the effectiveness of the chemical treatment on the viral particles.
También puede ser posible utilizar técnicas de ARNip para bloquear ciertos elementos básicos, por ejemplo, eligiendo como diana proteínas pp150 y bloqueando la producción de partículas de cmv, dentro de las partículas virales. Después de tales tratamientos con ARNip, se puede analizar el efecto sobre las partículas virales y los cambios morfológicos/estructurales de las partículas virales. Además, también se puede estudiar el número o la cantidad de partículas virales afectadas.It may also be possible to use siRNA techniques to block certain building blocks, for example by targeting pp150 proteins and blocking the production of cmv particles, within the viral particles. After such siRNA treatments, the effect on the viral particles and the morphological / structural changes of the viral particles can be analyzed. In addition, the number or quantity of viral particles affected can also be studied.
También puede ser posible utilizar el método de la presente invención para identificar partículas virales analizando los perfiles de densidad radial para decidir qué partículas virales se representan en una imagen. Después de encontrar todos los objetos redondos y elípticos en una imagen y clasificar los objetos en grupos según las características radiales, la siguiente etapa puede consistir en la identificación de la característica radial de una partícula viral en particular. De este modo, se puede utilizar cualquier agrupación de objetos que tenga una característica radial dentro del intervalo radial predeterminado de la partícula viral, tal como dentro de un intervalo radial de 80 /- 3 unidades, para identificar las partículas virales. También se pueden incluir partículas deformadas o elípticas utilizando un intervalo de características radiales. Las partículas con intervalos radiales fuera de este intervalo aceptable se descartan y clasifican como partículas no virales. Si hay muchos tipos de partículas virales dentro del intervalo radial deseado, es posible tratar las partículas virales clínicamente o químicamente y a continuación ejecutar el método nuevamente para determinar cómo reaccionan las partículas virales al tratamiento. Basándose esta reacción, es posible identificar qué es la partícula viral. Por ejemplo, puede ser posible amplificar el ADN, por ejemplo, mediante el uso de técnicas de PCR, que crea un folleto de referencia que puede utilizarse para identificar la partícula viral. De esta manera, la prueba adicional se puede utilizar para verificar o confirmar la partícula viral identificada.It may also be possible to use the method of the present invention to identify viral particles by analyzing radial density profiles to decide which viral particles are represented in an image. After finding all the round and elliptical objects in an image and classifying the objects into groups based on radial characteristics, the next step may be to identify the radial characteristic of a particular viral particle. Thus, any grouping of objects having a radial characteristic within the predetermined radial range of the viral particle, such as within a radial range of 80 / -3 units, can be used to identify the viral particles. Deformed or elliptical particles can also be included using a range of radial characteristics. Particles with radial ranges outside this acceptable range are discarded and classified as non-viral particles. If there are many types of viral particles within the desired radial range, it is possible to treat the viral particles clinically or chemically and then run the method again to determine how the viral particles react to the treatment. Based on this reaction, it is possible to identify what the viral particle is. For example, it may be possible to amplify the DNA, for example by using PCR techniques, which creates a reference booklet that can be used to identify the viral particle. In this way, additional testing can be used to verify or confirm the identified viral particle.
Por tanto, el método de la presente invención se puede utilizar para buscar, segmentar e identificar partículas virales en imágenes TEM como se describe en detalle a continuación. Las cápsides de las partículas virales son objetos aproximadamente circulares con la misma densidad de proteína en radios fijos desde el centro, los llamados objetos invariantes de rotación, como se muestra mejor en la Figura 1A. Para crear una medida de invarianza rotacional, se necesita una propiedad "opuesta" a la que se pueda medir la invarianza rotacional. Se puede utilizar un objeto invariante angular para este propósito, ya que tiene la misma densidad de proteína en ángulos fijos desde el centro, como se muestra mejor en la Figura 1B.Thus, the method of the present invention can be used to search, segment and identify viral particles in TEM images as described in detail below. The capsids of the viral particles are approximately circular objects with the same protein density at fixed radii from the center, the so-called rotation invariant objects, as best shown in Figure 1A. To create a rotational invariance measure, you need an "opposite" property to which rotational invariance can be measured. An angular invariant object can be used for this purpose, as it has the same protein density at fixed angles from the center, as best shown in Figure 1B.
El espectro de Fourier de una función (f) cuyos valores están determinados por el radio r, con la frecuencia de Fourier correspondiente (wr), desde el centro y un ángulo (t), con la frecuencia de Fourier correspondiente (wt), tomados desde cualquier dirección fijada fuera del centro se puede utilizar para ilustrar un objeto invariante de rotación y un objeto invariante angular. Una función invariante de rotación perfecta tiene toda su energía donde wt=0, y un objeto invariante angular perfecto tiene toda su energía donde wr=0 y todos los objetos intermedios tienen energía en ambas bandas de frecuencia. Por tanto, una medida razonablemente buena es comparar la diferencia de estas energías, dando una medida a priori con el nivel umbral de la medida como la única constante desconocida, que puede ser dada por un control negativo.The Fourier spectrum of a function (f) whose values are determined by the radius r, with the corresponding Fourier frequency (wr), from the center and an angle (t), with the corresponding Fourier frequency (wt), taken from any direction set off-center can be used to illustrate a rotation invariant object and an angular invariant object. An invariant function of perfect rotation has all its energy where wt = 0, and a perfect angular invariant object has all its energy where wr = 0 and all intermediate objects have energy in both bands of frequency. Therefore, a reasonably good measure is to compare the difference of these energies, giving an a priori measure with the threshold level of the measure as the only unknown constant, which can be given by a negative control.
A continuación se describe una medida de densidad de estructuras virales en imágenes TEM. Se introduce una medida de densidad para comparar el número de estructuras virales en diferentes imágenes como un determinado número de objetos (n) por unidad de área A en una imagen.A measure of the density of viral structures in TEM images is described below. A density measure is introduced to compare the number of viral structures in different images as a given number of objects (n) per unit area A in an image.

La segmentación de diferentes estructuras virales se describe a continuación. El perfil de densidad radial de cada objeto o elemento/partícula encontrado sirve como una buena aproximación de la estructura viral. La configuración de los perfiles en un espacio vectorial lineal (LVS) con una base establecida en los ejes principales de los perfiles, calculados con una descomposición en valores singulares (SVD), proporciona una comprensión visual del comportamiento de las agrupaciones de las diferentes estructuras virales. Con esta información es posible extraer diferentes agrupaciones y contar individualmente, y discriminar diferencias estructurales al aplicar fármacos clínicos calculando la estructura media de cada conjunto de imágenes.The segmentation of different viral structures is described below. The radial density profile of each object or element / particle found serves as a good approximation of the viral structure. The configuration of the profiles in a linear vector space (LVS) with a base established in the main axes of the profiles, calculated with a singular value decomposition (SVD), provides a visual understanding of the behavior of the clusters of the different viral structures . With this information it is possible to extract different groupings and count individually, and to discriminate structural differences when applying clinical drugs by calculating the mean structure of each set of images.
Como se muestra en la Tabla 1 a continuación, se adquirieron aproximadamente 500 MB de imágenes de células infectadas con cuatro ARNip aplicados de maneras diferentes con microscopio electrónico a una resolución de 3,3 nm/píxel. Las imágenes se procesaron con la medida de invarianza de rotación. El radio de control de la invarianza de rotación se estableció en 15 píxeles (aproximadamente 50 nm) y los objetos en las imágenes se adquirieron en los máximos radiales locales de 15 píxeles donde la medida de la invarianza radial excedió el nivel de 15. Al adquirir los perfiles de densidad radial, la media de cada perfil se eliminó para compensar los diferentes niveles de brillo en las diferentes imágenes. La media se tomó en un radio de 100 píxeles, aproximadamente 330 nm.As shown in Table 1 below, approximately 500 MB images of infected cells were acquired with four siRNAs applied in different ways by electron microscope at 3.3 nm / pixel resolution. The images were processed with the measure of rotation invariance. The control radius of the rotation invariance was set at 15 pixels (approximately 50 nm) and the objects in the images were acquired at the local radial maxima of 15 pixels where the measure of the radial invariance exceeded the level of 15. Upon acquiring the radial density profiles, the mean of each profile was removed to compensate for the different levels of brightness in the different images. The average was taken at a radius of 100 pixels, approximately 330 nm.
Tabla 1Table 1
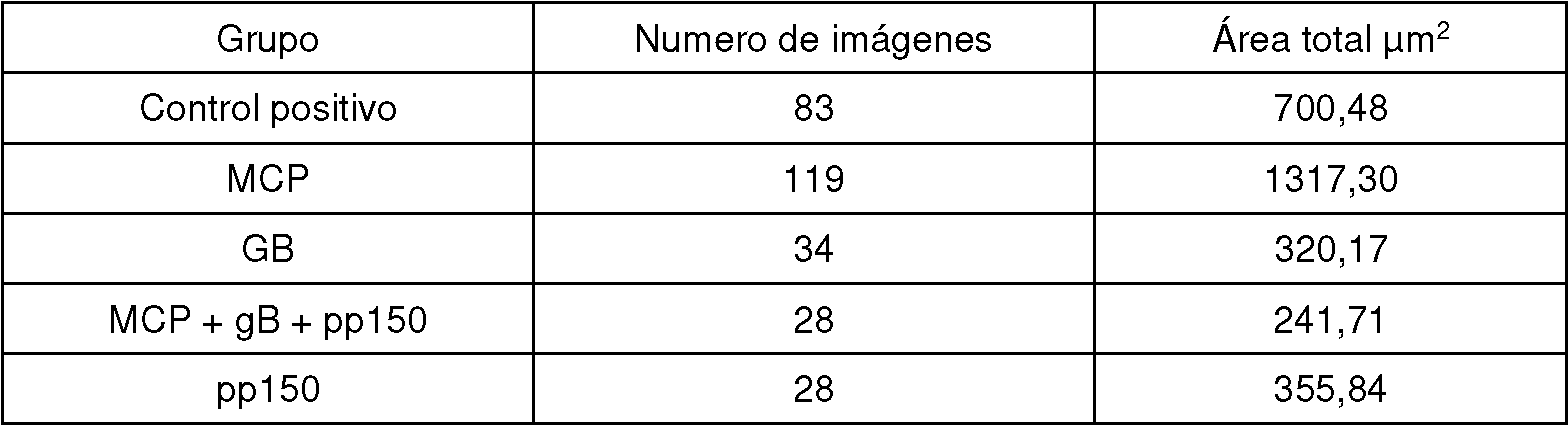
La Tabla 2 describe la desviación media y la típica de la media de las densidades calculadas. Al comparar los resultados de las imágenes de pp150 y MCP con el control positivo con una prueba t de Student, se proporcionan valores p de 7,21 *10-13 y 2,19*10-11 respectivamente para rechazar la hipótesis de que las densidades proceden de distribuciones con igual media.Table 2 describes the mean and standard deviation of the mean of the calculated densities. When comparing the results of the pp150 and MCP images with the positive control with a Student's t-test, p-values of 7.21 * 10-13 and 2.19 * 10-11 respectively are provided to reject the hypothesis that the densities come from distributions with equal mean.
Tabla 2Table 2

La Figura 2 es una ilustración gráfica de medidas de densidad para cinco conjuntos de imágenes (Control positivo, MCP, gB, MCP+gB+pp150 y pp150) con desviación típica 1. MCP y pp150 muestran densidades significativamente menores que el control positivo.Figure 2 is a graphical illustration of density measurements for five sets of images (Positive Control, MCP, gB, MCP + gB + pp150 and pp150) with standard deviation 1. MCP and pp150 show significantly lower densities than the positive control.
La segmentación de las estructuras virales se describe a continuación. Los perfiles de densidad radial se trazaron en un LVS, como se muestra mejor en la Figura 3, donde se muestra la información de los dos ejes principales más grandes. La Figura 3 muestra los perfiles de densidad radial de todos los conjuntos de imágenes colocadas en un LVS. La imagen muestra dos agrupaciones bien separadas marcadas como A y B que se describen con más detalle a continuación. Una característica importante es que también se muestran las partículas entre dos agrupaciones. Por ejemplo, esas partículas pueden estar en fases de madurez que se encuentran entre las fases de madurez representadas por las agrupaciones. A menudo es particularmente importante estudiar las partículas entre agrupaciones o grupos de partículas cuando las partículas virales se han expuesto a un fármaco para poder determinar los efectos del fármaco.The segmentation of viral structures is described below. Radial density profiles were plotted on an LVS, as best shown in Figure 3, where the information for the two largest principal axes is shown. Figure 3 shows the radial density profiles of all image sets placed on an LVS. The image shows two well separated clusters marked A and B which are described in more detail below. An important feature is that the particles between two clusters are also displayed. By For example, those particles may be in stages of maturity that fall between the stages of maturity represented by the clusters. It is often particularly important to study the particles between clusters or groups of particles when viral particles have been exposed to a drug in order to determine the effects of the drug.
Los perfiles de densidad radial media para cada conjunto (control positivo, MCP, pp150, gB y MCP+gB+pp150) para la agrupación A se muestran en la Figura 4. Esto revela la clasificación comúnmente conocida A (envolturas virales vacías) de los intermedio de maduración del HCMV. Debido al hecho de que el número de objetos encontrados de este tipo es pequeño, los objetos tienen energías radiales y angulares pequeñas, y la existencia de muchas otras estructuras no virales en el conjunto, no se puede extraer información significativa además de la información de que la pared de la cápside está situada a aproximadamente 40 nm del centro.The mean radial density profiles for each set (positive control, MCP, pp150, gB and MCP + gB + pp150) for cluster A are shown in Figure 4. This reveals the commonly known classification A (empty viral envelopes) of the intermediate maturation of HCMV. Due to the fact that the number of objects found of this type is small, the objects have small radial and angular energies, and the existence of many other non-viral structures in the ensemble, no significant information can be extracted in addition to the information that the capsid wall is located approximately 40 nm from the center.
Los perfiles de densidad radial media para cada conjunto (control positivo, MCP, pp150, gB y MCP+gB+pp150) para la agrupación B se muestran en la Figura 5. Esto revela las clasificaciones de los intermedios de maduración de1HCMV comúnmente conocidas como B (cápsides con núcleo translúcido) y C (cápsides maduras con núcleo denso). Los conjuntos de control positivo y gB difieren de los conjuntos MCP, pp150 y MCP+gB+pp150 en radios entre 30 y 40 nm, como se muestra mejor en el primer plano de la Figura 6, y en el centro.The mean radial density profiles for each set (positive control, MCP, pp150, gB, and MCP + gB + pp150) for cluster B are shown in Figure 5. This reveals the classifications of 1HCMV maturation intermediates commonly known as B (capsids with a translucent nucleus) and C (mature capsids with a dense nucleus). The positive control and gB sets differ from the MCP, pp150, and MCP + gB + pp150 sets by radii between 30 and 40 nm, as best shown in the foreground of Figure 6, and in the center.
Como resultado, se puede desarrollar un modelo de partículas virales en imágenes TEM. El uso de la característica invariante angular como medida para comparar con la característica invariante de rotación puede intercambiarse por una fracción de la energía de la función que se puede describir mediante un objeto invariante de rotación y la energía total. Sin embargo, si la energía total es muy pequeña, la fracción se puede volver numéricamente inestable para calcular.As a result, a model of viral particles can be developed on TEM images. Using the angular invariant characteristic as a measure to compare with the rotational invariant characteristic can be exchanged for a fraction of the energy of the function that can be described by a rotational invariant object and the total energy. However, if the total energy is very small, the fraction can become numerically unstable to calculate.
Para resolver esto, se puede utilizar un nivel de umbral. El uso de un nivel de umbral establecido es una fuente de subjetividad. Sin embargo, en este nivel se contaron muy pocas estructuras falsas. No obstante, un grupo de control negativo podría servir para establecer el nivel de umbral y también para observar el impacto de las moléculas de ARNip.To solve this, a threshold level can be used. Using a set threshold level is a source of subjectivity. However, very few false structures were counted at this level. However, a negative control group could serve to establish the threshold level and also to observe the impact of siRNA molecules.
Cualquier transformación ortonormal de los perfiles de densidad, incluidos los ejes principales, conserva la distancia y el producto interior en el L2-LVS. Por consiguiente, la agrupación de diferentes subestructuras es independiente con respecto a la elección de la base.Any orthonormal transformation of the density profiles, including the principal axes, preserves the distance and the inner product in the L2-LVS. Consequently, the grouping of different substructures is independent with respect to the choice of the base.
EjemploExample
A continuación se describe un ejemplo de materiales y métodos que se pueden utilizar. Los fibroblastos de pulmón embrionario humano (HF) se mantuvieron en un medio esencial mínimo sin bicarbonato con sales de Hank (GIBCO BRL) con un suplemento de HEPES 25 mM [ácido 4-(2hidroxietil)-1 -piperazina etanosulfónico], suero de ternera fetal inactivado por calor al 10%, L-glutamina (2 mM), penicilina (100 U/ml) y estreptomicina (100 mg/ml) (GIBCO BRL, Grand Island, NY, EE.UU.). Las células se cultivaron en matraces de cultivo de tejidos de 175 cm2 (Corning, Nueva York, EE.UU.) y se utilizaron hasta el pase 17. Las células se infectaron con HCMV a una multiplicidad de infección (MOI) de 1. El sobrenadante de virus se recogió 7 o 10 días después de la infección (pi). A continuación, se eliminó el sobrenadante del virus de los restos celulares mediante centrifugación a baja velocidad y se congeló a -70°C hasta su uso. Se infectaron monocapas de células HF cultivadas en placas de 96 pocillos o en portaobjetos de cámara con HCMV AD169, a una multiplicidad de infección (MOI) de 1.An example of materials and methods that can be used is described below. Human embryonic lung (HF) fibroblasts were maintained in a minimal essential medium without bicarbonate with Hank's salts (GIBCO BRL) supplemented with 25 mM HEPES [4- (2-hydroxyethyl) -1 -piperazine ethanesulfonic acid], calf serum. 10% heat inactivated fetal, L-glutamine (2 mM), penicillin (100 U / ml) and streptomycin (100 mg / ml) (GIBCO BRL, Grand Island, NY, USA). Cells were grown in 175 cm2 tissue culture flasks (Corning, New York, USA) and used until passage 17. Cells were infected with HCMV at a multiplicity of infection (MOI) of 1. The cells were infected with HCMV. Virus supernatant was collected 7 or 10 days after infection (pi). The virus supernatant was then removed from cell debris by low speed centrifugation and frozen at -70 ° C until use. HF cell monolayers grown in 96-well plates or chamber slides were infected with HCMV AD169, at a multiplicity of infection (MOI) of 1.
Las células endoteliales de arteria pulmonar humana (HPAEC) se obtuvieron de Clonetics, CA, EE. UU. Las células se mantuvieron en EBM-2 (Clonetics, CA, EE. UU.) con factores de crecimiento a 37°C y 5% de CO2. Una hora antes de la infección, el medio se cambió a EBM con suero de ternera fetal al 5% y se cultivó en este medio durante el proceso de infección. Las células se cultivaron en matraces de cultivo de tejidos de 175 cm2 (Falcon) recubiertos con gelatina al 0,2% o portaobjetos de cámara de 8 pocillos (Nalge Nunc International) y se utilizaron hasta el pase 8 en los experimentos.Human pulmonary artery endothelial cells (HPAEC) were obtained from Clonetics, CA, USA Cells were maintained in EBM-2 (Clonetics, CA, USA) with growth factors at 37 ° C and 5% of CO2. One hour before infection, the medium was changed to EBM with 5% fetal calf serum and cultured in this medium during the infection process. Cells were grown in 0.2% gelatin coated 175 cm2 tissue culture flasks (Falcon) or 8-well chamber slides (Nalge Nunc International) and used up to passage 8 in the experiments.
Se cultivaron células endoteliales de vena umbilical humana (HUVEC) en medio EGM (Clonetics, CA, EE. UU.). Una hora antes de la infección, el medio se cambió a EBM con suero de ternera fetal al 5% y se cultivó en este medio durante el proceso de infección. Las células se cultivaron en matraces de cultivo de tejidos de 175 cm2 (Falcon) y portaobjetos de cámara de 8 pocillos (Nalge Nunc internacional) y se utilizaron para experimentos antes del pase 8. Las células se infectaron una cepa adaptada endotelial TB40 a una MOI de 1.Human umbilical vein endothelial cells (HUVEC) were cultured in EGM medium (Clonetics, CA, USA). One hour before infection, the medium was changed to EBM with 5% fetal calf serum and cultured in this medium during the infection process. Cells were grown in 175 cm2 tissue culture flasks (Falcon) and 8-well chamber slides (Nalge Nunc International) and used for experiments prior to passage 8. Cells were infected with an endothelial adapted strain TB40 at an MOI of 1.
Se aislaron células de músculo liso de injertos aórticos obtenidos de pacientes sometidos a cirugía de aneurisma aórtico con inserción de injertos aórticos o bien de injerto aórtico o injerto de vasos iliacos de donantes de trasplante. Las células se aislaron retirando primero las células endoteliales mediante raspado celular con un instrumento afilado. A continuación, el vaso se dividió en dos capas diferentes, la capa más interna (correspondiente a la íntima del vaso) y la capa más externa (correspondiente al medio del vaso), mediante la separación suave de las dos capas con un par de pinzas. El injerto aórtico se cortó en trozos pequeños de 1 mm y se cultivó en placas de cultivo celular en medio SMGM 2 (Clonetics) con la adición de SmGM-2 Single Quotes (hEGF 0,5 pg/ml, 0,5 ml; Insulina 5 mg/ml, 0,5 ml; hFGF-b 1 pg/ml, 1 ml; FBS 25 ml; GA-1000, 0,5 ml) durante aproximadamente 2 semanas, hasta que hubo una migración de células SMC desde los explantes. Las células se cultivaron en matraces de cultivo celular de 175 cm2 (Falcon). Para determinar la pureza de los cultivos de SMC, las células se hicieron crecer en portaobjetos de cámara y se fijaron en formaldehído al 3% durante 45 minutos a 4°C y se permeabilizaron con Triton X al 0,3% durante 5 minutos. Después de la fijación, las células se tiñeron para antiactina conjugada con FITC específica de células de músculo liso (SIGMA) y se evaluaron con microscopía de fluorescencia. Las células se fijaron con metanol:acetona (1:1) a 4°C durante 5 minutos y se tiñeron con anti-factor de von Willebrand (Anti-vWF) conjugado con FITC y factor von Willebrand específico de células endoteliales y se evaluaron con microscopía de fluorescencia. En los experimentos se utilizaron controles de isotipo para los anticuerpos. Los cultivos fueron 100% positivos para anti-aactina y negativos para el factor de von Willebrand.Smooth muscle cells were isolated from aortic grafts obtained from patients undergoing surgery for aortic aneurysm with insertion of aortic grafts or either aortic graft or iliac graft from transplant donors. Cells were isolated by first removing endothelial cells by cell scraping with a sharp instrument. The vessel was then divided into two different layers, the innermost layer (corresponding to the intima of the vessel) and the outermost layer (corresponding to the middle of the vessel), by gently separating the two layers with a pair of forceps. . The aortic graft was cut into small 1 mm pieces and cultured in cell culture plates in SMGM 2 medium (Clonetics) with the addition of SmGM-2 Single Quotes (hEGF 0.5 pg / ml, 0.5 ml; Insulin 5 mg / ml, 0.5 ml; hFGF-b 1 pg / ml, 1 ml; FBS 25 ml; GA-1000, 0.5 ml) for approximately 2 weeks, until there was a migration of SMC cells from the explants . Cells were grown in 175 ml cell culture flasks. cm2 (Falcon). To determine the purity of the SMC cultures, cells were grown on chamber slides and fixed in 3% formaldehyde for 45 minutes at 4 ° C and permeabilized with 0.3% Triton X for 5 minutes. After fixation, cells were stained for smooth muscle cell-specific FITC-conjugated antiactin (SIGMA) and evaluated under fluorescence microscopy. Cells were fixed with methanol: acetone (1: 1) at 4 ° C for 5 minutes and stained with FITC-conjugated anti-von Willebrand factor (Anti-vWF) and endothelial cell-specific von Willebrand factor and evaluated with fluorescence microscopy. Isotype controls for antibodies were used in the experiments. The cultures were 100% positive for anti-aactin and negative for von Willebrand factor.
Para examinar las células infectadas con virus por microscopía electrónica, se recolectaron células no infectadas e infectadas con HCMV (MOI de 1) a 3, 5, 7 y 10 dpi, y se fijaron en glutaraldehído al 2% en tampón de cacodilato de sodio 0,1 M que contenía sacarosa 0,1 M y CaCl23 mM, pH 7,4 a temperatura ambiente durante 30 min. Las células se rasparon con un palo de madera y se transfirieron a un tubo Eppendorf y adicionalmente se fijaron durante la noche en el refrigerador. Después de la fijación, las células se enjuagaron en tampón de cacodilato de sodio 0,15 M que contenía CaCl23 mM, pH 7,4 y se centrifugaron. Los sedimentos se fijaron posteriormente en tetróxido de osmio al 2% en tampón de cacodilato de sodio 0,07 M que contenía CaCl21,5 mM, pH 7,4 a 4°C durante 2 horas, se deshidrataron en etanol seguido de acetona y se incluyeron en LX-112 (Ladd, Burlington, Vermont, EE. UU.). Las secciones se contrastaron con acetato de uranilo seguido de citrato de plomo y se examinaron en un microscopio electrónico de transmisión Tecnai 10 (FEI, Países Bajos) a 80 kV. Las imágenes digitales fueron capturadas por una cámara digital Mega View II (Soft Imaging System, GmbH, Münster, Alemania).To examine virus-infected cells by electron microscopy, uninfected and HCMV-infected cells (MOI of 1) were harvested at 3, 5, 7, and 10 dpi, and fixed in 2% glutaraldehyde in 0 sodium cacodylate buffer. , 1 M containing 0.1 M sucrose and 23 mM CaCl, pH 7.4 at room temperature for 30 min. The cells were scraped off with a wooden stick and transferred to an Eppendorf tube and additionally fixed overnight in the refrigerator. After fixation, cells were rinsed in 0.15 M sodium cacodylate buffer containing 23 mM CaCl, pH 7.4 and centrifuged. The pellets were subsequently fixed in 2% osmium tetroxide in 0.07 M sodium cacodylate buffer containing 21.5 mM CaCl, pH 7.4 at 4 ° C for 2 hours, dehydrated in ethanol followed by acetone, and included in LX-112 (Ladd, Burlington, Vermont, USA). The sections were contrasted with uranyl acetate followed by lead citrate and examined in a Tecnai 10 transmission electron microscope (FEI, The Netherlands) at 80 kV. Digital images were captured by a Mega View II digital camera (Soft Imaging System, GmbH, Münster, Germany).
El procesamiento de la micrografía electrónica se describe a continuación. Las secciones se contrastaron con acetato de uranilo seguido de citrato de plomo y se examinaron en un microscopio electrónico de transmisión Tecnai 10 (FEI, Países Bajos) a 80 kV. Las imágenes digitales se capturaron con una cámara digital Mega View II (Soft Imaging System GmbH, Münster, Alemania) o se capturaron, desarrollaron y escanearon micrografías electrónicas para su digitalización. Las micrografías se digitalizaron a imágenes de 8 bits en un escáner de superficie plana HP ScanJet 6200C a tamaños de píxeles que representan 2x2 nm o 3x3 nm, lo que proporciona radios de cápsides de aproximadamente 25 o 17 píxeles respectivamente, en las micrografías digitalizadas. Cada imagen digital tiene un tamaño de aproximadamente 1000x1000 píxeles (1 Mbite). La resolución fue satisfactoria para distinguir entre las tres clases de cápsides investigadas aquí, pero el fondo fuertemente texturizado provoca que la tarea de identificación de la cápside sea muy difícil. Se utilizó una estación de trabajo personal 433 DEC alfa que ejecutaba Hp Tru64 UNIX para el desarrollo y evaluación del método de la presente invención. La implementación y las pruebas se realizaron utilizando Matlab 7.0.1 (MathWorks, Inc., Natick, MA). Las figuras de perfil de niveles de gris generadas se procesaron en Corel Draw 10 (Corel Corporation, Ottawa, Canadá) y Photoshop C s (Adobe Systems Inc, San José, CAL, EE.UU.). Electron micrograph processing is described below. The sections were contrasted with uranyl acetate followed by lead citrate and examined in a Tecnai 10 transmission electron microscope (FEI, The Netherlands) at 80 kV. Digital images were captured with a Mega View II digital camera (Soft Imaging System GmbH, Münster, Germany) or electron micrographs were captured, developed and scanned for digitization. The micrographs were digitized to 8-bit images on an HP ScanJet 6200C flatbed scanner at pixel sizes representing 2x2 nm or 3x3 nm, providing capsid radii of approximately 25 or 17 pixels, respectively, in digitized micrographs. Each digital image is approximately 1000x1000 pixels (1 Mbit) in size. The resolution was successful in distinguishing between the three classes of capsids investigated here, but the heavily textured background makes the capsid identification task very difficult. A 433 DEC alpha personal workstation running Hp Tru64 UNIX was used for the development and evaluation of the method of the present invention. Implementation and testing were done using Matlab 7.0.1 (MathWorks, Inc., Natick, MA). The generated gray level profile figures were processed in Corel Draw 10 (Corel Corporation, Ottawa, Canada) and Photoshop CS (Adobe Systems Inc, San Jose, CAL, USA).
Claims (5)
Applications Claiming Priority (2)
| Application Number | Priority Date | Filing Date | Title |
|---|---|---|---|
| US94087007P | 2007-05-30 | 2007-05-30 | |
| PCT/US2008/061499 WO2008150588A1 (en) | 2007-05-30 | 2008-04-25 | A method for counting and segmenting viral particles in an image |
Publications (1)
| Publication Number | Publication Date |
|---|---|
| ES2835175T3 true ES2835175T3 (en) | 2021-06-22 |
Family
ID=40094049
Family Applications (1)
| Application Number | Title | Priority Date | Filing Date |
|---|---|---|---|
| ES08746847T Active ES2835175T3 (en) | 2007-05-30 | 2008-04-25 | Method for counting and segmentation of viral particles in an image |
Country Status (18)
| Country | Link |
|---|---|
| US (1) | US8224059B2 (en) |
| EP (1) | EP2149105B1 (en) |
| JP (1) | JP5243535B2 (en) |
| KR (1) | KR101343749B1 (en) |
| CN (1) | CN101681427B (en) |
| AU (1) | AU2008260410B2 (en) |
| BR (1) | BRPI0811951A2 (en) |
| CA (1) | CA2688153C (en) |
| DK (1) | DK2149105T3 (en) |
| ES (1) | ES2835175T3 (en) |
| HU (1) | HUE052662T2 (en) |
| MX (1) | MX2009012265A (en) |
| MY (1) | MY153016A (en) |
| PL (1) | PL2149105T3 (en) |
| PT (1) | PT2149105T (en) |
| RU (1) | RU2461063C2 (en) |
| WO (1) | WO2008150588A1 (en) |
| ZA (1) | ZA200907666B (en) |
Families Citing this family (13)
| Publication number | Priority date | Publication date | Assignee | Title |
|---|---|---|---|---|
| JP2611948B2 (en) | 1995-03-20 | 1997-05-21 | 公男 松林 | Centrifugal snow melting system using high-pressure hot water |
| SG161215A1 (en) * | 2005-04-15 | 2010-05-27 | Intelligent Virus Imaging Inc | Method of analyzing cell structures and their components |
| US8712140B2 (en) * | 2005-04-15 | 2014-04-29 | Intelligent Virus Imaging Inc. | Method of analyzing cell structures and their components |
| US8712141B2 (en) * | 2007-05-30 | 2014-04-29 | Intelligent Virus Imagaing Inc. | Method for counting and segmenting viral particles in an image |
| JPWO2012077280A1 (en) | 2010-12-09 | 2014-05-19 | パナソニック株式会社 | Design support apparatus and design support method for three-dimensional integrated circuit |
| CN103514481A (en) * | 2012-06-20 | 2014-01-15 | 天津三星电机有限公司 | Image-based product number fast measuring method and device |
| NZ733989A (en) * | 2015-12-18 | 2019-03-29 | Intelligent Virus Imaging Inc | High precision quantification of sub-visible particles |
| RU2626145C1 (en) * | 2016-01-27 | 2017-07-21 | Государственное бюджетное образовательное учреждение высшего профессионального образования "Оренбургский государственный медицинский университет" Министерства здравоохранения Российской Федерации (ГБОУ ВПО ОрГМУ Минздрава России) | Method for intercellular matrix proteins estimation content in regenerating tissues at analysis of digital images of immunohistochemical micropreparates in adobe® photoshop® |
| KR102176815B1 (en) * | 2016-09-30 | 2020-11-10 | 인텔리전트 바이러스 이미징 아이엔씨. | Method for quantifying the purity of microscopic particle samples |
| MA44418B1 (en) * | 2017-03-02 | 2021-11-30 | Intelligent Virus Imaging Inc | Method for quantitative measurement of particulate content using hydrated state imaging |
| RU2750591C1 (en) * | 2020-05-12 | 2021-06-29 | Федеральное государственное бюджетное образовательное учреждение высшего образования "Ижевская государственная медицинская академия" | Method for determining the degree of staining of endothelial cells |
| CN111795986A (en) * | 2020-05-20 | 2020-10-20 | 万秋花 | Virus clinical examination detection platform applying shape search |
| CN112288684B (en) * | 2020-07-15 | 2021-06-25 | 华北理工大学 | Pathogenic judgment system and method applying density analysis |
Family Cites Families (7)
| Publication number | Priority date | Publication date | Assignee | Title |
|---|---|---|---|---|
| JP2001527249A (en) * | 1997-12-18 | 2001-12-25 | インフィネオン テクノロジース アクチエンゲゼルシャフト | Image detection device |
| JP4069545B2 (en) * | 1999-05-19 | 2008-04-02 | 株式会社日立製作所 | Electron microscope method, electron microscope array biological sample inspection method and biological inspection apparatus using the same |
| RU2168206C1 (en) * | 2000-06-30 | 2001-05-27 | Зайцев Павел Анатольевич | Method and device for scanning pattern of skin lines |
| JP4012813B2 (en) * | 2002-11-27 | 2007-11-21 | 株式会社日立ハイテクノロジーズ | Transmission electron microscope and sample observation method |
| JP4154300B2 (en) * | 2003-09-08 | 2008-09-24 | 株式会社日立ハイテクノロジーズ | Transmission electron microscope system and inspection method using the same |
| US20070099276A1 (en) * | 2003-10-25 | 2007-05-03 | David Ott | Retrovirus-like particles and retroviral vaccines |
| BRPI0617610A2 (en) * | 2005-10-12 | 2011-07-26 | Intelligent Virus Imaging Inc | identification and classification of virus particles in textured electron micrographs |
-
2008
- 2008-04-25 DK DK08746847.6T patent/DK2149105T3/en active
- 2008-04-25 MX MX2009012265A patent/MX2009012265A/en unknown
- 2008-04-25 PT PT87468476T patent/PT2149105T/en unknown
- 2008-04-25 JP JP2010510391A patent/JP5243535B2/en not_active Expired - Fee Related
- 2008-04-25 WO PCT/US2008/061499 patent/WO2008150588A1/en not_active Ceased
- 2008-04-25 RU RU2009149093/08A patent/RU2461063C2/en active
- 2008-04-25 AU AU2008260410A patent/AU2008260410B2/en not_active Ceased
- 2008-04-25 CA CA2688153A patent/CA2688153C/en active Active
- 2008-04-25 CN CN2008800179936A patent/CN101681427B/en not_active Expired - Fee Related
- 2008-04-25 US US12/600,623 patent/US8224059B2/en active Active
- 2008-04-25 EP EP08746847.6A patent/EP2149105B1/en active Active
- 2008-04-25 KR KR1020097027393A patent/KR101343749B1/en not_active Expired - Fee Related
- 2008-04-25 ES ES08746847T patent/ES2835175T3/en active Active
- 2008-04-25 PL PL08746847T patent/PL2149105T3/en unknown
- 2008-04-25 HU HUE08746847A patent/HUE052662T2/en unknown
- 2008-04-25 MY MYPI20094764 patent/MY153016A/en unknown
- 2008-04-25 BR BRPI0811951A patent/BRPI0811951A2/en not_active Application Discontinuation
-
2009
- 2009-11-02 ZA ZA200907666A patent/ZA200907666B/en unknown
Also Published As
| Publication number | Publication date |
|---|---|
| CN101681427A (en) | 2010-03-24 |
| EP2149105A4 (en) | 2013-09-25 |
| RU2461063C2 (en) | 2012-09-10 |
| EP2149105A1 (en) | 2010-02-03 |
| RU2009149093A (en) | 2011-07-10 |
| CA2688153C (en) | 2015-03-31 |
| JP5243535B2 (en) | 2013-07-24 |
| CA2688153A1 (en) | 2008-12-11 |
| WO2008150588A1 (en) | 2008-12-11 |
| HUE052662T2 (en) | 2021-05-28 |
| AU2008260410B2 (en) | 2012-05-03 |
| BRPI0811951A2 (en) | 2016-10-04 |
| US8224059B2 (en) | 2012-07-17 |
| HK1137254A1 (en) | 2010-07-23 |
| MY153016A (en) | 2014-12-31 |
| US20100151446A1 (en) | 2010-06-17 |
| KR101343749B1 (en) | 2013-12-19 |
| AU2008260410A1 (en) | 2008-12-11 |
| KR20100025545A (en) | 2010-03-09 |
| PL2149105T3 (en) | 2021-05-17 |
| CN101681427B (en) | 2012-12-05 |
| EP2149105B1 (en) | 2020-11-18 |
| JP2010529428A (en) | 2010-08-26 |
| DK2149105T3 (en) | 2021-02-01 |
| ZA200907666B (en) | 2010-07-28 |
| PT2149105T (en) | 2020-12-15 |
| MX2009012265A (en) | 2009-12-01 |
Similar Documents
| Publication | Publication Date | Title |
|---|---|---|
| KR101343749B1 (en) | A method for counting and segmenting viral particles in an image | |
| US8077958B2 (en) | Computer-aided pathological diagnosis system | |
| Devan et al. | Detection of herpesvirus capsids in transmission electron microscopy images using transfer learning | |
| CN110739027A (en) | cancer tissue positioning method and system based on chromatin region coverage depth | |
| Hobson et al. | Classifying anti-nuclear antibodies HEp-2 images: A benchmarking platform | |
| CN108960322A (en) | A kind of coronary calcification patch automatic testing method based on cardiac CT image | |
| Abdullah et al. | A comparative study of image segmentation technique applied for lung cancer detection | |
| Gopinath et al. | R-LSTM-CNN framework based lung cancer detection and classification from chest CT images | |
| Wiese et al. | Detection of sclerotic bone metastases in the spine using watershed algorithm and graph cut | |
| WO2005008215A2 (en) | Methods and apparatus for characterising cells and treatments | |
| US8712141B2 (en) | Method for counting and segmenting viral particles in an image | |
| Gamarra et al. | MC-Kmeans: An approach to cell image segmentation using clustering algorithms | |
| Myasnikova et al. | Spatio-temporal registration of the expression patterns of Drosophila segmentation genes. | |
| Xu et al. | Extraction and analysis of actin networks based on open active contour models | |
| Les et al. | Automatic evaluation system of FISH images in breast cancer | |
| EP2607898B1 (en) | Method for evaluating graft | |
| Syed et al. | Ultrastructure analysis of cardiomyocytes and their nuclei | |
| Parvaze et al. | Extraction of multiple cellular objects in HEp-2 images using LS segmentation | |
| HK1137254B (en) | A method for counting and segmenting viral particles in an image | |
| Roszkowiak et al. | Improvements to segmentation method of stained lymphoma tissue section images | |
| RAM et al. | Performance evaluation of CAD system for Lung Cancer Detection. | |
| Noordmans et al. | Randomness of spatial distributions of two proteins in the cell nucleus involved in mRNA synthesis and their relationship | |
| Gebauer et al. | View Tomo: Context-aware targeting and analysis in electron cryo-tomography | |
| Jiang et al. | Benchmarking Detectors for the RIVA Cervical Cytology Challenge | |
| Yotsukura | MS17. 05 Controversies in Pathologic Staging |