JP2004125478A - Thermal lens analytical equipment - Google Patents
Thermal lens analytical equipment Download PDFInfo
- Publication number
- JP2004125478A JP2004125478A JP2002286929A JP2002286929A JP2004125478A JP 2004125478 A JP2004125478 A JP 2004125478A JP 2002286929 A JP2002286929 A JP 2002286929A JP 2002286929 A JP2002286929 A JP 2002286929A JP 2004125478 A JP2004125478 A JP 2004125478A
- Authority
- JP
- Japan
- Prior art keywords
- thermal lens
- lens
- refractive index
- sample solution
- light
- Prior art date
- Legal status (The legal status is an assumption and is not a legal conclusion. Google has not performed a legal analysis and makes no representation as to the accuracy of the status listed.)
- Pending
Links
Images


Landscapes
- Investigating Or Analyzing Materials Using Thermal Means (AREA)
- Investigating Or Analysing Materials By Optical Means (AREA)
Abstract
Description
【0001】
【発明の属する技術分野】
本発明は、熱レンズ分析装置に関する。
【0002】
【従来の技術】
従来から、化学反応を微小空間で行うための集積化技術が、化学反応の高速性や微少量での反応、オンサイト分析等の観点から注目されており、そのための研究が、世界的に精力的に進められている。
【0003】
化学反応の集積化技術の1つとして微細な流路の中で試料溶液の混合、反応、分離、抽出、検出等を行う所謂マイクロ化学システムがある。このマイクロ化学システムで行われるものとしては反応の例として、ジアゾ化反応、ニトロ化反応、抗原抗体反応などがあり、抽出、分離の例として溶媒抽出、電気泳動分離、カラム分離などがある。マイクロ化学システムは、分離だけを目的としたような単一の機能のみで用いられても良く、また複合的に用いられても良い。
【0004】
これらのマイクロ化学システムでは試料溶液が極微量であるので、高感度な検出方法が必須である。このような方法として、微細な流路内の試料溶液に励起光を照射する前後の検出光の信号強度の差を照射する前の検出光の信号強度で割った値(以下「TLM出力」という。)を検出する熱レンズ分析法が確立され、これによりマイクロ化学システムの実用化の道が開かれている。
【0005】
試料溶液に光を集光照射すると試料溶液中の溶質が光を吸収すると共に熱エネルギーが放出される。この熱エネルギーによって溶媒が局所的に温度上昇すると、屈折率が変化して熱レンズが形成される(熱レンズ効果)。熱レンズ分析法はこの熱レンズ効果を利用するものである。
【0006】
熱レンズ分析法は、熱の拡散、即ち屈折率の変化をTLM出力として観察するものであるので、極微小試料の濃度を検出するのに適している。
【0007】
従来の熱レンズ分析装置においては、マイクロ化学システム用チップが顕微鏡の対物レンズの下方に配置されており、励起光源から出力された所定波長の励起光が顕微鏡に入射して、この顕微鏡の対物レンズによりマイクロ化学システム用チップの流路内の試料に集光照射される。これにより、集光照射位置を中心として試料に熱レンズが形成される。
【0008】
このような熱レンズ分析は流路内の試料溶液の定量的な制御を行なう必要があり、その点で、マイクロ化学システム用チップの流路としては、平面上に存在し、適度な圧力損失を有するキャピラリを用いるのが適している(例えば、特許文献1参照)。
【0009】
また、高い分解能による熱レンズ分析を行なうには、対物レンズとして、検出光と励起光の焦点距離の差(以下「色収差」という。)のあるレンズを用いるとよく(例えば、特許文献2参照)、特に、このようなレンズとしてロッドレンズを用いることが有効であることが知られている(例えば、特許文献3参照)。
【0010】
【特許文献1】
特開2001−165939号公報
【特許文献2】
特開2001−356611号公報
【特許文献3】
特開2002−165939号公報
【0011】
【発明が解決しようとする課題】
しかしながら、平面上に存在し、適度な圧力損失を有するキャピラリを流路として用いると、流路内の試料溶液の定量的な制御を行なうことはできるが、それのみでは試料溶液の濃度測定を高い分解能で行なうことはできない。
【0012】
また、色収差があるレンズを用いると熱レンズ分析により、試料溶液の濃度測定を高い分解能で行なうことができるが、具体的に、どのような色収差の範囲にあるレンズを用いると安定した測定を行なうことができるのかを開示する従来技術はない。
【0013】
本発明の目的は、熱レンズ分析を安定して行うことができる熱レンズ分析装置を提供することにある。
【0014】
【課題を解決するための手段】
上記目的を達成するために、請求項1記載の熱レンズ分析装置は、内部に試料溶液を流す流路を有するマイクロ化学システム用チップと、前記試料溶液に熱レンズを生成するための励起光と前記熱レンズを検出するための検出光とをレンズを介して前記試料溶液に照射する光源と、前記試料溶液の熱レンズ分析を行なうべく前記検出光のTLM出力を検出する検出手段とを備える熱レンズ分析装置において、前記試料溶液のうち前記熱レンズが生成される部分と生成されない部分との屈折率差は、1.0×10⁻⁵〜1.0×10⁻¹⁰であることを特徴とする。
【0015】
請求項1記載の熱レンズ分析装置によれば、流路を流れる試料溶液のうち熱レンズが生成される部分と生成されない部分との屈折率差は、1.0×10⁻⁵以下であるので、検出光の信号強度に外乱が生じるのを防ぐことができ、また、この屈折率差は1.0×10⁻¹⁰以上であるので、TLM出力の検出をすることができ、以って熱レンズ分析を安定して行うことができる。
【0016】
請求項2記載の熱レンズ分析装置は、請求項1記載の熱レンズ分析装置において、前記レンズの開口数NAと、前記励起光及び前記検出光の色収差df(mm)との関係は、0.15<NA<0.60、0<NA×df<24×10−3を満たすことを特徴とする。
【0017】
請求項2記載の熱レンズ分析装置によれば、レンズの開口数NAと、励起光及び検出光の色収差dfとの関係は、0.15<NA<0.60、0<NA×df<24×10−3を満たすので、TLM出力を確実に検出することができ、定性分析を行なうことができる。
【0018】
請求項3記載の熱レンズ分析装置は、請求項1又は2記載の熱レンズ分析装置において、前記屈折率差は1.0×10⁻⁶〜1.0×10⁻⁸であることを特徴とする。
【0019】
請求項3記載の熱レンズ分析装置によれば、屈折率差は1.0×10⁻⁶以下であるので、屈折率差とTLM出力との間に比例関係が生じ、定量分析を行なうことができ、また、この屈折率差は1.0×10⁻⁸以上であるので、TLM出力を確実に検出することができる。
【0020】
請求項4記載の熱レンズ分析装置は、請求項3記載の熱レンズ分析装置において、前記開口数NAと前記色収差dfとの関係は、0.15<NA<0.60、4.5×10⁻³<NA×df<9×10⁻³を満たすことを特徴とする。
【0021】
請求項4記載の熱レンズ分析装置によれば、開口数NAと色収差dfとの関係は、0.15<NA<0.60、4.5×10⁻³<NA×df<9×10⁻³を満たすので、屈折率差とTLM出力との間の比例関係が確実に維持することができ、安定した定量分析を行なうことができる。
【0022】
請求項5記載の熱レンズ分析装置は、請求項3又は4記載の熱レンズ分析装置において、前記開口数NAと前記検出手段の規格化されたPD距離Loとの関係は、0.15<NA<0.60、2.8125<NA×Lo<5.625を満たすことを特徴とする。
【0023】
請求項5記載の熱レンズ分析装置によれば、開口数NAと検出手段の規格化されたPD距離Loとの関係は、0.15<NA<0.60、2.8125<NA×Lo<5.625を満たすので、屈折率差とTLM出力との間の比例関係が確実に維持しつつ、TLM出力を大きくすることができ、より安定した定量分析を行なうことができる。
【0024】
【発明の実施の形態】
以下、本発明の実施の形態に係る熱レンズ分析装置により生成される熱レンズを図面を参照しながら詳細に説明する。
【0025】
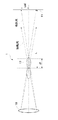
図1は、本発明の実施の形態に係る熱レンズ分析装置を示す図である。
【0026】
図1において、本発明の実施の形態に係る熱レンズ分析装置1は、不図示のマイクロ化学システム用チップ内に形成された流路中の試料溶液に励起光及び検出光を同軸で照射するロッドレンズ10と、マイクロ化学システム用チップを通過した励起光及び検出光のうち検出光の信号強度のみを不図示のフィルタ等で濾波して検出するPD11とから成る。
【0027】
励起光は検出光より短い波長の光であり、ロッドレンズ10は、試料溶液中で励起光及び検出光が焦点を結ぶように光軸合わせを行ない、また、励起光と検出光の焦点距離には差(以下「色収差」という。)dfがある。
【0028】
また、励起光が試料溶液に照射されると、その焦点位置を中心として熱レンズ12が形成される。
【0029】
PD11は、励起光の焦点位置からの距離(以下「PD距離」という。)Lに光軸と垂直に設置されるものであり、開口半径radの光軸と同心円状の検出部からなるものである。ここでPD11のPD距離Lと開口半径radは可変である。
【0030】
また、PD11は、試料溶液に励起光を照射する前に試料溶液に照射した検出光の信号強度(Io)と、励起光を照射した後に試料溶液に照射した検出光の信号強度(I)を検出する。その後、不図示のコンピュータにより(I−Io)/Ioの値(以下「TLM出力」という。)を算出することで、熱レンズ分析が行われる。
【0031】
次に、図1の熱レンズ12の形状のシミュレーションを行なう。このシミュレーションの前提条件を以下のように設定する。
1.計算を容易にするため、ロッドレンズ10のNAと励起光及び検出光のNAは同一、ロッドレンズ10からPD11までの空間はすべて水中であり、伝播媒質屈折率nは1.332とする。
2.励起光の焦点位置周辺の励起ビーム伝播強度I(r,z)は、式(1)に示すガウス分布である。
【0032】
【数1】
3.熱レンズ12の形状は、後述する図3の屈折率差dnを変数とするSNS積層光学系であると近似する。
4.励起光の焦点位置近傍の屈折率分布は励起ビーム伝播強度に応じたものである。
5.色収差dfを変数とする検出光を熱レンズ12に照射すると、検出光の光線は熱レンズ12の屈折率に応じて広がるように曲げられる。
【0034】
さらに、ロッドレンズ10、PD11、励起光、及び検出光の条件を以下の表1に示す。
【0035】
【表1】
以上の条件で、図1のロッドレンズ10から照射された励起光の焦点位置周辺の励起ビーム伝播強度についてシミュレーションを行なう。
【0037】
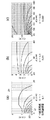
図2は、図1のロッドレンズ10から照射された励起光の焦点位置周辺の励起ビーム伝播強度を示す図であり、(a)はz軸座標が0〜20μm、rが0〜2μmの範囲を示し、(b)はz軸座標が20〜40μm、rが0〜5μmの範囲を示し、(c)はz軸座標が40〜100μm、rが0〜20μmの範囲を示す。
【0038】
図2では、横軸は励起光の焦点位置を0とし、光の伝播方向を正とするz軸座標を示し、縦軸は励起光の光軸からの距離rを示す。
【0039】
励起ビーム伝播強度は、励起光の焦点位置に近い位置にあるもの程強くなり、励起光の焦点位置から離れた位置にあるもの程弱くなる。
【0040】
例えば、図2(a)では、励起光の焦点位置に最も近い位置にある範囲21のビーム伝播強度は1.0、その次に近い位置にある範囲22のビーム伝播強度は等高線間隔が0.1であるので0.9(=1.0−0.1)、最も離れた位置にある範囲23のビーム伝播強度は0.0となる。
【0041】
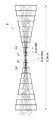
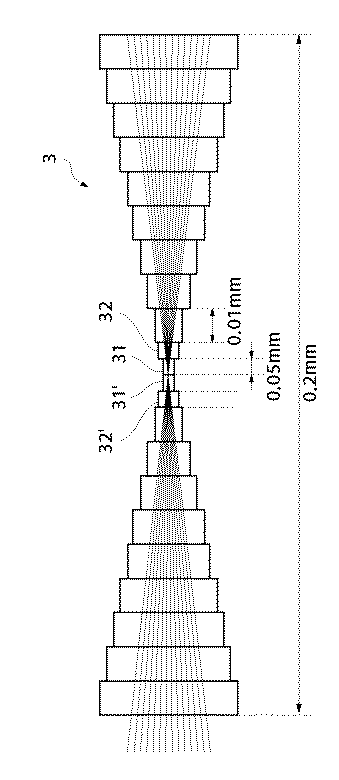
図3は、図1の熱レンズ12の形状をSNS積層光学系で近似した図を示す。
【0042】
図3において、SNS積層光学系3は、22個のSNSレンズから成り、合計厚みは0.2mm、各SNSレンズの厚さtは、励起光焦点位置に隣接するSNSレンズ31,31’及びSNSレンズ31,31’に隣接するSNSレンズ32,32’を0.005mmとし、その他の18枚のSNSレンズを0.01mmとする。
【0043】
また、SNS積層光学系3が形成された部分はそれ以外の部分より屈折率が低く、その屈折率差dnは−1.0×10⁻⁵〜−1.0×10⁻⁸の間で可変とする。
【0044】
さらに、前提条件4より、屈折率分布n(r,z)と励起ビーム伝播強度I(r,z)とは、式(2)に示す関係が成立する。
【0045】
【数2】
n(r,z)=(dn/I0)×I(r,z)・・・(2)
また、SNS積層光学系3の屈折率分布は、式(3)から式(5)に示す近似式が成立することが知られている。
【0046】
【数3】
従って、式(2)を用いて、式(3)の係数(n0,nz1〜nz4,nr1〜nr4,sva,svp,svf)をカーブフィッティングにより求めると、図3のSNS積層光学系3中の屈折率分布についてシミュレーションを行なうことができる。
【0048】
以上の条件で、dn=1.0×10⁻⁵のときの図3のSNS積層光学系3中の屈折率分布を各SNSレンズの範囲でカーブフィッティングを行なった結果を表2に示す。
【0049】
【表2】
また、式(3)から式(5)により、係数n0,nz1〜nz4,nr1〜nr4はdnの値に比例するが、係数sva,svp,svfはdnの値に関係なく一定であることがわかる。
【0051】
以上の結果から、図2の励起ビーム伝播強度に応じて形成された熱レンズ12の屈折率分布についてシミュレーションを行なう。
【0052】
図4は、図1の熱レンズ12が屈折率差dnが1.0×10⁻⁵であるときの屈折率分布を示す図であり、(a)はz軸座標が0〜20μm、rが0〜2μmの範囲を示し、(b)はz軸座標が20〜40μm、rが0〜5μmの範囲を示し、(c)はz軸座標が40〜100μm、rが0〜20μmの範囲を示す。
【0053】
屈折率は、励起光の焦点位置に近い位置にあるもの程低くなり、励起光の焦点位置から離れた位置にあるもの程高くなる。
【0054】
例えば、図4(a)では、励起光の焦点位置に最も近い位置にある範囲41の屈折率は−1.0×10⁻⁵、その次に近い位置にある範囲42の屈折率は等高線間隔が1.0×10⁻⁶であるので、−0.9×10⁻⁶(=−1.0×10⁻⁵+1.0×10⁻⁶)、最も離れた位置にある範囲43の屈折率は0.0となる。
【0055】
次に、図4の熱レンズ12が試料溶液中に形成されると近似し、実光線追跡によりTLM出力についてシミュレーションを行なう。
【0056】
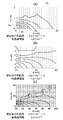
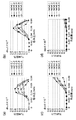
図5は、図1のPD距離Lを10mmとして、屈折率差dn及び開口半径radを変化させたときのTLM出力と色収差dfの関係を示すグラフであり、(a)は屈折率差dnが1.0×10⁻⁵の場合を示し、(b)は屈折率差dnが1.0×10⁻⁶の場合を示し、(c)は屈折率差dnが1.0×10⁻⁷の場合を示し、(d)は屈折率差dnが1.0×10⁻⁸の場合を示す。
【0057】
図5に示すように、開口半径radの値に関係なく、屈折率差dnの値が小さくなるほどTLM出力の値は小さくなり、不図示ではあるが屈折率差dnが1.0×10⁻¹⁰以下ではTLM出力の値が微小となり過ぎ、PD11では検出ができない。PD11で確実にTLM出力を検出するには、屈折率差dnは1.0×10⁻¹⁰、より好ましくは1.0×10⁻⁸以上であることを要する。
【0058】
また、屈折率差dnが1.0×10⁻⁵以下の範囲でTLM出力と色収差dfの関係を求めたのは、熱レンズ12が生成されている部分と生成されていない部分とでは、その温度差が1度以上となり、励起光を試料溶液に照射するのを止めても熱レンズ12が無くなるまでに時間を要し、検出光の信号強度に外乱が生じるためである。
【0059】
以上の結果から、屈折率差dnは、1.0×10⁻⁵〜1.0×10⁻¹⁰、好ましくは1.0×10⁻⁸以上である必要がある。
【0060】
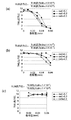
図6は、図5のTLM出力間のTLM出力比と色収差dfの関係を示すグラフであり、(a)は屈折率差dnが1.0×10⁻⁵のTLM出力を1.0×10⁻⁶のときのTLM出力で割った場合を示し、(b)は屈折率差dnが1.0×10⁻⁶のTLM出力を1.0×10⁻⁷のときのTLM出力で割った場合を示し、(c)は屈折率差dnが1.0×10⁻⁷のTLM出力を1.0×10⁻⁸のときのTLM出力で割った場合を示す。
【0061】
屈折率差の値とTLM出力の値とが比例関係にあるとき、熱レンズ分析を定量的に行なうことができる。従って、屈折率差の比は10である図6(a)〜図6(c)において、TLM出力比が10である色収差dfの範囲があるか否かを判別することが、現在の条件で定量的な熱レンズ分析を行なうことができるかを判別することになる。
【0062】
TLM出力比が10である色収差dfの範囲は、開口半径radの値に関係なく、図6(a)の場合はほとんど無く、図6(b)の場合、図6(c)の場合になるにつれて広くなることが判る。従って、定量的な熱レンズ分析を行なうには、dnが1.0×10⁻⁶以下とすることが好ましい。
【0063】
次に、PD距離Lを一定としたときの開口半径radとTLM出力の関係について説明する。
【0064】
図7は、図1のPD距離Lを20mmとしたときの開口半径radとTLM出力の関係を示すグラフであり、(a)は色収差dfが0.03mmの場合を示し、(b)は色収差dfが0.04mmの場合を示す。
【0065】
図7(a)のTLM出力が、図7(b)のTLM出力の1/10のスケールとなっていることからわかるように、色収差dfの値が小さいと同じ屈折率差dnであってもTLM出力の値は小さくなることがわかる。
【0066】
また、開口半径radが変化したとき、図7(a)のTLM出力は大きく変動するのに対し、図7(b)のTLM出力は大きな変動がないことがわかる。
【0067】
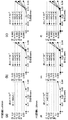
図8は、図1のPD距離Lと開口半径radの関係を示すグラフであり、(a)はPD距離Lが10mm、屈折率差dnが1.0×10⁻⁶の場合を示し、(b)はPD距離Lが10mm、屈折率差dnが1.0×10⁻⁷の場合を示し、(c)はPD距離Lが10mm、屈折率差dnが1.0×10⁻⁸の場合を示し、(d)はPD距離Lが20mm、屈折率差dnが1.0×10⁻⁶の場合を示し、(e)はPD距離Lが20mm、屈折率差dnが1.0×10⁻⁷の場合を示し、(f)はPD距離Lが20mm、屈折率差dnが1.0×10⁻⁸の場合を示す。
【0068】
図8より、PD距離Lを2倍としても開口半径radも2倍とすると同一となることがわかる。よって、以降、PD距離Lについては開口半径radが0.5mm(即ち、PD11の直径が1.0mm)で規格化されたPD距離Loを用いる。
【0069】
以上の結果に基づき、より現実に即した結果を導き出すため、前提条件1の条件を変更する。
【0070】
具体的には、ロッドレンズ10のNAは、励起光及び検出光の開口数NAの1.5倍とする。これは、励起光及び検出光をガウス分布を維持して伝播させるには、そのビーム径(ビーム中心強度の13.5%の強度の直径)の1.5倍以上の有効径をもつ光学系でないと、ガウスビームの裾野にケラレが生じるのを防止することができないからである。また、PD11は水中でなく空気中にあるため、励起光及び検出光の開口数NA、色収差df、PD距離Lを空気換算する。
【0071】
励起光及び検出光の開口数NA(=0.15)を空気換算した値は0.2であるため、ロッドレンズ10の開口数NAはこの値を1.5倍した0.3となる。
【0072】
まず、ロッドレンズ10の開口数NAと色収差dfの関係について説明する。
【0073】
図5から、TLM出力は色収差dfが0.080mm以下であれば検出できることがわかるが、その出力が0以下となる場合もあり(図5(a))、さらに、不図示ではあるが、色収差dfが0.10mm以上となると屈折率差dnが1×10⁻⁵のとき、及び1×10⁻⁶のときにTLM出力は全く検出できない。よって、色収差dfは水中で0.10mm以下、空気換算すると0.080mm以下であることを要する。一方、図5のロッドレンズ10の開口数NAは上述したように0.3である。
【0074】
以上より、ロッドレンズ10の開口数NAと色収差dfの関係が0<NA×df<24×10−3を満たすことがわかる。
【0075】
また、ロッドレンズ10の開口数NAが0.15以下とするとPD距離Lが大きくなる結果、TLM出力が弱くなったり、装置が大型化するため好ましくなく、開口数NAが0.60以上とすると焦点距離が短くなり、ロッドレンズ10が不図示のマイクロ化学システム用チップに当たる可能性がある。従って、ロッドレンズ10の開口数NAは、0.15<NA<0.60であることが好ましいことがわかる。
【0076】
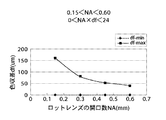
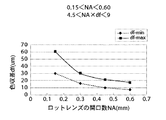
即ち、ロッドレンズ10の開口数NAと色収差dfの関係が、0.15<NA<0.60であり、且つ、0<NA×df<24×10−3を満たすものであるとき、TLM出力を確実に検出することができ、定性分析を行なうことができる(図9)。
【0077】
また、図6(b),図6(c)から、屈折率差dnが1.0×10⁻⁶であって、色収差dfが0.02mmより大きく、0.04mmより小さいとき、屈折率差dnとTLM出力とを確実に比例関係とすることができる。また、図6の色収差dfは水中における値であるため、空気換算すると色収差dfは0.015mmより大きく、0.030mmより小さいことになる。
【0078】
従って、ロッドレンズ10の開口数NAと色収差dfの関係が、0.15<NA<0.60であり、且つ、4.5×10⁻³<NA×df<9×10⁻³を満たすとき、屈折率差とTLM出力との間の比例関係が確実に維持することができ、安定した定量分析を行なうことがわかる(図10)。
【0079】
次に、ロッドレンズ10の開口数NAと図8で前述した規格化されたPD距離Loの関係について説明する。
【0080】
図7から、PD11の開口半径radは、0.4〜0.8mmの範囲にあるとき、TLM出力と屈折率差dnの比例関係が維持できる。PD距離Lは、水中で20mmとしていたため、空気換算すると15mmとなる。
【0081】
従って、NAが0.3(空気換算値)のとき、規格化されたPD距離Loの最小値(Lo−min)は、9.375mm(=15×0.5/0.8)であり、最大値(Lo−max)は、18.75mm(=15×0.5/0.4)となる。
【0082】
従って、ロッドレンズ10の開口数NAと規格化されたPD距離Loの関係が、2.8125(=Lo−min×NA)<Lo×NA<5.625(=Lo−max×NA)を満たすとき、屈折率差とTLM出力との間の比例関係が確実に維持しつつ、TLM出力を大きくすることができ、より安定した定量分析を行なうことができることがわかる(図11)。
【0083】
【発明の効果】
以上詳細に説明したように、請求項1記載の熱レンズ分析装置によれば、流路を流れる試料溶液のうち熱レンズが生成される部分と生成されない部分との屈折率差は、1.0×10⁻⁵以下であるので、検出光の信号強度に外乱が生じるのを防ぐことができ、また、この屈折率差は1.0×10⁻¹⁰以上であるので、TLM出力の検出をすることができ、以って熱レンズ分析を安定して行うことができる。
【0084】
請求項2記載の熱レンズ分析装置によれば、レンズの開口数NAと、励起光及び検出光の色収差df(mm)との関係は、0.15<NA<0.60、0<NA×df<24×10−3を満たすので、TLM出力を確実に検出することができ、定性分析を行なうことができる。
【0085】
請求項3記載の熱レンズ分析装置によれば、屈折率差は1.0×10⁻⁶以下であるので、屈折率差とTLM出力との間に比例関係が生じ、定量分析を行なうことができ、また、この屈折率差は1.0×10⁻⁸以上であるので、TLM出力を確実に検出することができる。
【0086】
請求項4記載の熱レンズ分析装置によれば、開口数NAと色収差dfとの関係は、0.15<NA<0.60、4.5×10⁻³<NA×df<9×10⁻³を満たすので、屈折率差とTLM出力との間の比例関係が確実に維持することができ、安定した定量分析を行なうことができる。
【0087】
請求項5記載の熱レンズ分析装置によれば、開口数NAと検出手段の規格化されたPD距離Loとの関係は、0.15<NA<0.60、2.8125<NA×Lo<5.625を満たすので、屈折率差とTLM出力との間の比例関係が確実に維持しつつ、TLM出力を大きくすることができ、より安定した定量分析を行なうことができる。
【図面の簡単な説明】
【図1】本発明の実施の形態に係る熱レンズ分析装置を示す図である。
【図2】図1のロッドレンズ10から照射された励起光の焦点位置周辺の励起ビーム伝播強度を示す図であり、(a)はz軸座標が0〜20μm、rが0〜2μmの範囲を示し、(b)はz軸座標が20〜40μm、rが0〜5μmの範囲を示し、(c)はz軸座標が40〜100μm、rが0〜20μmの範囲を示す。
【図3】図1の熱レンズ12の形状をSNS積層光学系で近似した図を示す。
【図4】図1の熱レンズ12が屈折率差dnが1.0×10⁻⁵であるときの屈折率分布を示す図であり、(a)はz軸座標が0〜20μm、rが0〜2μmの範囲を示し、(b)はz軸座標が20〜40μm、rが0〜5μmの範囲を示し、(c)はz軸座標が40〜100μm、rが0〜20μmの範囲を示す。
【図5】図1のPD距離Lを10mmとして開口半径radを変化させたときのTLM出力と色収差dfの関係を示すグラフであり、(a)は屈折率差dnが1.0×10⁻⁵の場合を示し、(b)は屈折率差dnが1.0×10⁻⁶の場合を示し、(c)は屈折率差dnが1.0×10⁻⁷の場合を示し、(d)は屈折率差dnが1.0×10⁻⁸の場合を示す。
【図6】図5のTLM出力間のTLM出力比と色収差dfの関係を示すグラフであり、(a)は屈折率差dnが1.0×10⁻⁵のTLM出力を1.0×10⁻⁶のときのTLM出力で割った場合を示し、(b)は屈折率差dnが1.0×10⁻⁶のTLM出力を1.0×10⁻⁷のときのTLM出力で割った場合を示し、(c)は屈折率差dnが1.0×10⁻⁷のTLM出力を1.0×10⁻⁸のときのTLM出力で割った場合を示す。
【図7】図1のPD距離Lを20mmとしたときの開口半径radとTLM出力の関係を示すグラフであり、(a)は色収差dfが0.03mmの場合を示し、(b)は色収差dfが0.04mmの場合を示す。
【図8】図1のPD距離Lと開口半径radの関係を示すグラフであり、(a)はPD距離Lが10mm、屈折率差dnが1.0×10⁻⁶の場合を示し、(b)はPD距離Lが10mm、屈折率差dnが1.0×10⁻⁷の場合を示し、(c)はPD距離Lが10mm、屈折率差dnが1.0×10⁻⁸の場合を示し、(d)はPD距離Lが20mm、屈折率差dnが1.0×10⁻⁶の場合を示し、(e)はPD距離Lが20mm、屈折率差dnが1.0×10⁻⁷の場合を示し、(f)はPD距離Lが20mm、屈折率差dnが1.0×10⁻⁸の場合を示す。
【図9】図1のロッドレンズ10で定性分析ができるロッドレンズ10の開口数NAと色収差dfの関係を示すグラフである。
【図10】図1のロッドレンズ10で安定した定量分析ができるロッドレンズ10の開口数NAと色収差dfの関係を示すグラフである。
【図11】図1のロッドレンズ10でより安定した定量分析ができるロッドレンズ10の開口数NAと規格化されたPD距離Loの関係を示すグラフである。
【符号の説明】
1 熱レンズ分析装置
10 ロッドレンズ
11 PD
12 熱レンズ
3 SNS積層光学系
31,31’,32,32’ SNSレンズ[0001]
TECHNICAL FIELD OF THE INVENTION
The present invention relates to a thermal lens analyzer.
[0002]
[Prior art]
In the past, integrated technologies for performing chemical reactions in a minute space have attracted attention from the viewpoints of high-speed chemical reactions, reactions in minute amounts, and on-site analysis. It is being advanced.
[0003]
As one of the techniques for integrating chemical reactions, there is a so-called microchemical system that performs mixing, reaction, separation, extraction, detection, and the like of a sample solution in a fine channel. Examples of reactions performed in this microchemical system include diazotization reactions, nitration reactions, antigen-antibody reactions, and the like. Examples of extraction and separation include solvent extraction, electrophoretic separation, and column separation. Microchemical systems may be used with only a single function, such as for separation only, or may be used in combination.
[0004]
In these microchemical systems, since the amount of the sample solution is extremely small, a highly sensitive detection method is essential. As such a method, a value obtained by dividing the difference between the signal intensities of the detection light before and after irradiating the sample solution in the fine channel with the excitation light by the signal intensity of the detection light before the irradiation (hereinafter referred to as “TLM output”). ) Has been established, and this has opened the way for the practical use of microchemical systems.
[0005]
When light is focused and irradiated on the sample solution, the solute in the sample solution absorbs light and emits thermal energy. When the temperature of the solvent locally rises due to this thermal energy, the refractive index changes and a thermal lens is formed (thermal lens effect). Thermal lens analysis utilizes this thermal lens effect.
[0006]
Since the thermal lens analysis method observes the diffusion of heat, that is, the change in the refractive index as a TLM output, it is suitable for detecting the concentration of an extremely small sample.
[0007]
In a conventional thermal lens analyzer, a chip for a microchemical system is arranged below an objective lens of a microscope, and excitation light of a predetermined wavelength output from an excitation light source enters the microscope, and the objective lens of the microscope is Thus, the sample in the flow channel of the microchemical system chip is focused and irradiated. As a result, a thermal lens is formed on the sample around the focused irradiation position.
[0008]
In such a thermal lens analysis, it is necessary to perform quantitative control of the sample solution in the flow path. In this respect, the flow path of the chip for a microchemical system exists on a flat surface, and an appropriate pressure loss is generated. It is suitable to use a capillary having the same (for example, see Patent Document 1).
[0009]
In order to perform thermal lens analysis with high resolution, a lens having a difference in focal length between detection light and excitation light (hereinafter referred to as “chromatic aberration”) may be used as the objective lens (for example, see Patent Document 2). In particular, it is known that it is effective to use a rod lens as such a lens (for example, see Patent Document 3).
[0010]
[Patent Document 1]
JP 2001-165939 A
[Patent Document 2]
JP 2001-356611 A
[Patent Document 3]
JP-A-2002-165939
[0011]
[Problems to be solved by the invention]
However, when a capillary that is present on a flat surface and has an appropriate pressure loss is used as a flow path, quantitative control of the sample solution in the flow path can be performed. It cannot be done with resolution.
[0012]
In addition, when a lens having chromatic aberration is used, the concentration of the sample solution can be measured with a high resolution by thermal lens analysis, but specifically, when a lens having a range of chromatic aberration is used, stable measurement is performed. There is no prior art disclosing what can be done.
[0013]
An object of the present invention is to provide a thermal lens analyzer capable of performing stable thermal lens analysis.
[0014]
[Means for Solving the Problems]
In order to achieve the above object, the thermal lens analyzer according to
[0015]
According to the thermal lens analyzer of the first aspect, the difference in refractive index between the portion where the thermal lens is generated and the portion where the thermal lens is not generated in the sample solution flowing through the flow path is 1.0 × 10 4. -5 Therefore, disturbance in the signal intensity of the detection light can be prevented, and the difference in the refractive index is 1.0 × 10 -10 As described above, the TLM output can be detected, and the thermal lens analysis can be stably performed.
[0016]
The thermal lens analyzer according to
[0017]
According to the thermal lens analyzer of the second aspect, the relationship between the numerical aperture NA of the lens and the chromatic aberration df of the excitation light and the detection light is 0.15 <NA <0.60, 0 <NA × df <24. × 10 -3 Is satisfied, the TLM output can be reliably detected, and qualitative analysis can be performed.
[0018]
The thermal lens analyzer according to
[0019]
According to the thermal lens analyzer of
[0020]
The thermal lens analyzer according to
[0021]
According to the thermal lens analyzer of the fourth aspect, the relationship between the numerical aperture NA and the chromatic aberration df is 0.15 <NA <0.60, 4.5 × 10 -3 <NA × df <9 × 10 -3 Is satisfied, the proportional relationship between the refractive index difference and the TLM output can be reliably maintained, and stable quantitative analysis can be performed.
[0022]
The thermal lens analyzer according to
[0023]
According to the thermal lens analyzer of the fifth aspect, the relationship between the numerical aperture NA and the standardized PD distance Lo of the detecting means is 0.15 <NA <0.60, 2.8125 <NA × Lo <. Since 5.625 is satisfied, the TLM output can be increased while reliably maintaining the proportional relationship between the refractive index difference and the TLM output, and more stable quantitative analysis can be performed.
[0024]
BEST MODE FOR CARRYING OUT THE INVENTION
Hereinafter, a thermal lens generated by the thermal lens analyzer according to the embodiment of the present invention will be described in detail with reference to the drawings.
[0025]
FIG. 1 is a diagram showing a thermal lens analyzer according to an embodiment of the present invention.
[0026]
In FIG. 1, a
[0027]
The excitation light is light having a shorter wavelength than the detection light, and the
[0028]
When the excitation light is applied to the sample solution, a
[0029]
The
[0030]
Further, the
[0031]
Next, a simulation of the shape of the
1. To facilitate the calculation, the NA of the
2. The excitation beam propagation intensity I (r, z) around the focus position of the excitation light has a Gaussian distribution shown in Expression (1).
[0032]
(Equation 1)
3. The shape of the
4. The refractive index distribution near the focal position of the excitation light depends on the intensity of the excitation beam propagation.
5. When the detection light having the chromatic aberration df as a variable is applied to the
[0034]
Table 1 shows the conditions of the
[0035]
[Table 1]
Under the above conditions, a simulation is performed on the excitation beam propagation intensity around the focal position of the excitation light emitted from the
[0037]
FIGS. 2A and 2B are diagrams showing the excitation beam propagation intensity around the focal position of the excitation light emitted from the
[0038]
In FIG. 2, the horizontal axis indicates the z-axis coordinate where the focus position of the excitation light is 0 and the light propagation direction is positive, and the vertical axis indicates the distance r of the excitation light from the optical axis.
[0039]
Excitation beam propagation intensity is higher at a position closer to the focal position of the excitation light, and is lower at a position farther from the focal position of the excitation light.
[0040]
For example, in FIG. 2A, the beam propagation intensity of the
[0041]
FIG. 3 is a diagram in which the shape of the
[0042]
In FIG. 3, the SNS laminated
[0043]
Further, the portion where the SNS laminated
[0044]
Further, from the
[0045]
(Equation 2)
n (r, z) = (dn / I0) × I (r, z) (2)
It is known that the approximate expression expressed by Expression (3) to Expression (5) holds for the refractive index distribution of the SNS laminated
[0046]
[Equation 3]
Therefore, when the coefficients (n0, nz1 to nz4, nr1 to nr4, sva, svp, svf) of the equation (3) are obtained by curve fitting using the equation (2), the coefficients in the SNS multilayer
[0048]
Under the above conditions, dn = 1.0 × 10 -5 Table 2 shows the result of curve fitting of the refractive index distribution in the SNS laminated
[0049]
[Table 2]
Also, according to Equations (3) to (5), the coefficients n0, nz1 to nz4, nr1 to nr4 are proportional to the value of dn, but the coefficients sva, svp, and svf may be constant regardless of the value of dn. Understand.
[0051]
From the above results, a simulation is performed on the refractive index distribution of the
[0052]
FIG. 4 shows that the
[0053]
The refractive index is lower at a position closer to the focal position of the excitation light, and is higher at a position farther from the focal position of the excitation light.
[0054]
For example, in FIG. 4A, the refractive index of the
[0055]
Next, it is approximated that the
[0056]
FIG. 5 is a graph showing the relationship between the TLM output and the chromatic aberration df when the PD distance L in FIG. 1 is set to 10 mm and the refractive index difference dn and the aperture radius rad are changed. 1.0 × 10 -5 (B) shows a refractive index difference dn of 1.0 × 10 -6 And (c) shows a refractive index difference dn of 1.0 × 10 -7 (D) shows a case where the refractive index difference dn is 1.0 × 10 -8 The case of is shown.
[0057]
As shown in FIG. 5, regardless of the value of the aperture radius rad, the smaller the value of the refractive index difference dn, the smaller the value of the TLM output. Although not shown, the refractive index difference dn is 1.0 × 10 -10 Below, the value of the TLM output becomes too small, and the
[0058]
Further, the refractive index difference dn is 1.0 × 10 -5 The relationship between the TLM output and the chromatic aberration df in the following range was determined because the temperature difference between the portion where the
[0059]
From the above results, the refractive index difference dn is 1.0 × 10 -5 ~ 1.0 × 10 -10 , Preferably 1.0 × 10 -8 It is necessary to be above.
[0060]
FIG. 6 is a graph showing the relationship between the TLM output ratio between the TLM outputs in FIG. 5 and the chromatic aberration df, and (a) shows a refractive index difference dn of 1.0 × 10 -5 TLM output of 1.0 × 10 -6 (B) shows a case where the refractive index difference dn is 1.0 × 10 -6 TLM output of 1.0 × 10 -7 (C) shows a case where the refractive index difference dn is 1.0 × 10 -7 TLM output of 1.0 × 10 -8 The case of dividing by the TLM output at the time of is shown.
[0061]
When the value of the refractive index difference is proportional to the value of the TLM output, the thermal lens analysis can be performed quantitatively. Therefore, in FIG. 6A to FIG. 6C in which the ratio of the refractive index difference is 10, it is determined under the current conditions that it is determined whether or not there is a range of the chromatic aberration df in which the TLM output ratio is 10. It is determined whether quantitative thermal lens analysis can be performed.
[0062]
The range of the chromatic aberration df in which the TLM output ratio is 10 is almost irrespective of the value of the aperture radius rad in the case of FIG. 6A, and in the case of FIG. It turns out that it becomes wider as it goes. Therefore, to perform a quantitative thermal lens analysis, dn is 1.0 × 10 -6 It is preferable to set the following.
[0063]
Next, the relationship between the opening radius rad and the TLM output when the PD distance L is constant will be described.
[0064]
7A and 7B are graphs showing the relationship between the opening radius rad and the TLM output when the PD distance L in FIG. 1 is set to 20 mm. FIG. 7A shows the case where the chromatic aberration df is 0.03 mm, and FIG. The case where df is 0.04 mm is shown.
[0065]
As can be seen from the fact that the TLM output of FIG. 7A is 1/10 of the scale of the TLM output of FIG. 7B, even if the value of the chromatic aberration df is small, the refractive index difference dn is the same. It can be seen that the value of the TLM output becomes smaller.
[0066]
When the opening radius rad changes, the TLM output in FIG. 7A fluctuates greatly, whereas the TLM output in FIG. 7B does not fluctuate greatly.
[0067]
FIG. 8 is a graph showing the relationship between the PD distance L and the opening radius rad of FIG. 1. FIG. 8A shows a PD distance L of 10 mm and a refractive index difference dn of 1.0 × 10. -6 (B), PD distance L is 10 mm, refractive index difference dn is 1.0 × 10 -7 (C), PD distance L is 10 mm, refractive index difference dn is 1.0 × 10 -8 (D), PD distance L is 20 mm, refractive index difference dn is 1.0 × 10 -6 (E), PD distance L is 20 mm, refractive index difference dn is 1.0 × 10 -7 (F), PD distance L is 20 mm, refractive index difference dn is 1.0 × 10 -8 The case of is shown.
[0068]
From FIG. 8, it can be seen that the same applies when the PD radius L is doubled and the opening radius rad is also doubled. Therefore, hereinafter, as the PD distance L, the PD distance Lo standardized by the opening radius rad of 0.5 mm (that is, the diameter of the
[0069]
Based on the above results, the condition of
[0070]
Specifically, the NA of the
[0071]
Since the value obtained by converting the numerical aperture NA (= 0.15) of the excitation light and the detection light into air is 0.2, the numerical aperture NA of the
[0072]
First, the relationship between the numerical aperture NA of the
[0073]
From FIG. 5, it can be seen that the TLM output can be detected if the chromatic aberration df is 0.080 mm or less, but the output may be 0 or less (FIG. 5 (a)). When df is 0.10 mm or more, the refractive index difference dn is 1 × 10 -5 , And 1 × 10 -6 At this time, no TLM output can be detected. Therefore, the chromatic aberration df needs to be 0.10 mm or less in water and 0.080 mm or less in air conversion. On the other hand, the numerical aperture NA of the
[0074]
As described above, the relationship between the numerical aperture NA of the
[0075]
If the numerical aperture NA of the
[0076]
That is, the relationship between the numerical aperture NA of the
[0077]
6 (b) and 6 (c) that the refractive index difference dn is 1.0 × 10 -6 When the chromatic aberration df is larger than 0.02 mm and smaller than 0.04 mm, the refractive index difference dn and the TLM output can be surely in a proportional relationship. Since the chromatic aberration df in FIG. 6 is a value in water, the chromatic aberration df in air conversion is larger than 0.015 mm and smaller than 0.030 mm.
[0078]
Therefore, the relationship between the numerical aperture NA of the
[0079]
Next, the relationship between the numerical aperture NA of the
[0080]
From FIG. 7, when the opening radius rad of the
[0081]
Therefore, when NA is 0.3 (air conversion value), the minimum value (Lo-min) of the normalized PD distance Lo is 9.375 mm (= 15 × 0.5 / 0.8), The maximum value (Lo-max) is 18.75 mm (= 15 × 0.5 / 0.4).
[0082]
Therefore, the relationship between the numerical aperture NA of the
[0083]
【The invention's effect】
As described above in detail, according to the thermal lens analyzer of
[0084]
According to the thermal lens analyzer of the second aspect, the relationship between the numerical aperture NA of the lens and the chromatic aberration df (mm) of the excitation light and the detection light is 0.15 <NA <0.60, 0 <NA × df <24 × 10 -3 Is satisfied, the TLM output can be reliably detected, and qualitative analysis can be performed.
[0085]
According to the thermal lens analyzer of
[0086]
According to the thermal lens analyzer of the fourth aspect, the relationship between the numerical aperture NA and the chromatic aberration df is 0.15 <NA <0.60, 4.5 × 10 -3 <NA × df <9 × 10 -3 Is satisfied, the proportional relationship between the refractive index difference and the TLM output can be reliably maintained, and stable quantitative analysis can be performed.
[0087]
According to the thermal lens analyzer of the fifth aspect, the relationship between the numerical aperture NA and the standardized PD distance Lo of the detecting means is 0.15 <NA <0.60, 2.8125 <NA × Lo <. Since 5.625 is satisfied, the TLM output can be increased while reliably maintaining the proportional relationship between the refractive index difference and the TLM output, and more stable quantitative analysis can be performed.
[Brief description of the drawings]
FIG. 1 is a diagram showing a thermal lens analyzer according to an embodiment of the present invention.
2A and 2B are diagrams showing an excitation beam propagation intensity around a focal position of an excitation light emitted from a
FIG. 3 is a diagram in which the shape of the
FIG. 4 shows a
FIG. 5 is a graph showing the relationship between the TLM output and the chromatic aberration df when the PD radius L in FIG. 1 is set to 10 mm and the opening radius rad is changed. -5 (B) shows a refractive index difference dn of 1.0 × 10 -6 And (c) shows a refractive index difference dn of 1.0 × 10 -7 (D) shows a case where the refractive index difference dn is 1.0 × 10 -8 The case of is shown.
6 is a graph showing the relationship between the TLM output ratio between TLM outputs and the chromatic aberration df in FIG. 5; FIG. 6A shows a refractive index difference dn of 1.0 × 10; -5 TLM output of 1.0 × 10 -6 (B) shows a case where the refractive index difference dn is 1.0 × 10 -6 TLM output of 1.0 × 10 -7 (C) shows a case where the refractive index difference dn is 1.0 × 10 -7 TLM output of 1.0 × 10 -8 The case of dividing by the TLM output at the time of is shown.
FIGS. 7A and 7B are graphs showing a relationship between an opening radius rad and a TLM output when the PD distance L in FIG. 1 is set to 20 mm, where FIG. The case where df is 0.04 mm is shown.
8 is a graph showing the relationship between the PD distance L and the opening radius rad in FIG. 1; FIG. 8A shows a PD distance L of 10 mm and a refractive index difference dn of 1.0 × 10; -6 (B), PD distance L is 10 mm, refractive index difference dn is 1.0 × 10 -7 (C), PD distance L is 10 mm, refractive index difference dn is 1.0 × 10 -8 (D), PD distance L is 20 mm, refractive index difference dn is 1.0 × 10 -6 (E), PD distance L is 20 mm, refractive index difference dn is 1.0 × 10 -7 (F), PD distance L is 20 mm, refractive index difference dn is 1.0 × 10 -8 The case of is shown.
9 is a graph showing a relationship between a numerical aperture NA of the
10 is a graph showing the relationship between the numerical aperture NA and chromatic aberration df of the
11 is a graph showing the relationship between the numerical aperture NA of the
[Explanation of symbols]
1 Thermal lens analyzer
10 Rod lens
11 PD
12 Thermal lens
3 SNS laminated optical system
31,31 ', 32,32' SNS lens
Claims (5)
前記試料溶液のうち前記熱レンズが生成されている部分と生成されていない部分との屈折率差は、1.0×10⁻⁵〜1.0×10⁻¹⁰であることを特徴とする熱レンズ分析装置。A chip for a microchemical system having a flow path for flowing a sample solution therein, and an excitation light for generating a thermal lens in the sample solution and a detection light for detecting the thermal lens in the sample solution through a lens. A thermal lens analyzer comprising: a light source that irradiates the sample solution; and a detecting unit that detects a TLM output of the detection light so as to perform a thermal lens analysis of the sample solution.
A difference in refractive index between a part where the thermal lens is generated and a part where the thermal lens is not generated in the sample solution is 1.0 × 10 −5 to 1.0 × 10 −10. Lens analyzer.
0.15<NA<0.60
0<NA×df<24×10−3
を満たすことを特徴とする請求項1記載の熱レンズ分析装置。The relationship between the numerical aperture NA of the lens and the chromatic aberration df (mm) of the excitation light and the detection light is:
0.15 <NA <0.60
0 <NA × df <24 × 10 −3
The thermal lens analyzer according to claim 1, wherein the following conditions are satisfied.
0.15<NA<0.60
4.5×10⁻³<NA×df<9×10⁻³
を満たすことを特徴とする請求項3記載の熱レンズ分析装置。The relationship between the numerical aperture NA and the chromatic aberration df is
0.15 <NA <0.60
4.5 × 10 −3 <NA × df <9 × 10 −3
4. The thermal lens analyzer according to claim 3, wherein the following conditions are satisfied.
0.15<NA<0.60
2.8125<NA×Lo<5.625
を満たすことを特徴とする請求項3又は4記載の熱レンズ分析装置。The relationship between the numerical aperture NA and the standardized PD distance Lo of the detection means is:
0.15 <NA <0.60
2.8125 <NA × Lo <5.625
The thermal lens analyzer according to claim 3 or 4, wherein the following conditions are satisfied.
Priority Applications (1)
| Application Number | Priority Date | Filing Date | Title |
|---|---|---|---|
| JP2002286929A JP2004125478A (en) | 2002-09-30 | 2002-09-30 | Thermal lens analytical equipment |
Applications Claiming Priority (1)
| Application Number | Priority Date | Filing Date | Title |
|---|---|---|---|
| JP2002286929A JP2004125478A (en) | 2002-09-30 | 2002-09-30 | Thermal lens analytical equipment |
Publications (1)
| Publication Number | Publication Date |
|---|---|
| JP2004125478A true JP2004125478A (en) | 2004-04-22 |
Family
ID=32279877
Family Applications (1)
| Application Number | Title | Priority Date | Filing Date |
|---|---|---|---|
| JP2002286929A Pending JP2004125478A (en) | 2002-09-30 | 2002-09-30 | Thermal lens analytical equipment |
Country Status (1)
| Country | Link |
|---|---|
| JP (1) | JP2004125478A (en) |
Cited By (1)
| Publication number | Priority date | Publication date | Assignee | Title |
|---|---|---|---|---|
| WO2006123468A1 (en) * | 2005-05-20 | 2006-11-23 | Nippon Sheet Glass Company, Limited | Microchemical system and its tlm output calculating method |
-
2002
- 2002-09-30 JP JP2002286929A patent/JP2004125478A/en active Pending
Cited By (1)
| Publication number | Priority date | Publication date | Assignee | Title |
|---|---|---|---|---|
| WO2006123468A1 (en) * | 2005-05-20 | 2006-11-23 | Nippon Sheet Glass Company, Limited | Microchemical system and its tlm output calculating method |
Similar Documents
| Publication | Publication Date | Title |
|---|---|---|
| CN103033497B (en) | Microfluidic chip analyzer applying raman spectrum for detection | |
| JP5990185B2 (en) | Equipment for photometric or spectroscopic inspection of liquid samples | |
| CN108351304A (en) | Water Test Kits | |
| KR101749994B1 (en) | Biological particle detection apparatus for measuring fluorescence and scattering | |
| JPH05340865A (en) | measuring device | |
| CN101135657A (en) | X-ray analysis equipment | |
| JP7429643B2 (en) | Optical flow cytometer for epifluorescence measurements | |
| US9594011B2 (en) | Method and instrumentation for determining a physical property of a particle | |
| JP2015519575A (en) | Method and flow cell for characterizing particles with non-Gaussian temporal signals | |
| CN102116729A (en) | Light path system for continuous laser particle analyzer | |
| WO2017067971A1 (en) | Measurement cell for saxs measurements and for dls measurements | |
| JP5662742B2 (en) | Particle size measuring apparatus and particle size measuring method | |
| CN101995399A (en) | Fluorescence detector | |
| JP4086173B2 (en) | Photothermal lens type sample analyzer | |
| JP2004125478A (en) | Thermal lens analytical equipment | |
| JP2017125747A (en) | Probe-type elemental analysis device, and elemental analysis method | |
| JPH046465A (en) | Sample processing method, sample measurement method, and sample measurement device | |
| JP7555732B2 (en) | Cell measuring method and cell measuring device | |
| JPH0486546A (en) | Specimen inspection device | |
| JPH0783819A (en) | Particle measuring device | |
| JPH0277636A (en) | Particle measuring device | |
| JP2004309430A (en) | Thermal lens analyzer | |
| JP2001004523A (en) | Apparatus and method for measuring particle in liquid | |
| Dannhauser et al. | Small angle light scattering characterization of single micrometric particles in microfluidic flows | |
| JPS6129738A (en) | Particle analysis device and particle analysis method |
Legal Events
| Date | Code | Title | Description |
|---|---|---|---|
| A621 | Written request for application examination |
Free format text: JAPANESE INTERMEDIATE CODE: A621 Effective date: 20050307 |
|
| A977 | Report on retrieval |
Free format text: JAPANESE INTERMEDIATE CODE: A971007 Effective date: 20060417 |
|
| RD03 | Notification of appointment of power of attorney |
Effective date: 20060427 Free format text: JAPANESE INTERMEDIATE CODE: A7423 |
|
| A131 | Notification of reasons for refusal |
Free format text: JAPANESE INTERMEDIATE CODE: A131 Effective date: 20060509 |
|
| A521 | Written amendment |
Effective date: 20060706 Free format text: JAPANESE INTERMEDIATE CODE: A523 |
|
| A02 | Decision of refusal |
Free format text: JAPANESE INTERMEDIATE CODE: A02 Effective date: 20070424 |