JP2016009352A - Plant abnormality sign diagnosis device and method - Google Patents
Plant abnormality sign diagnosis device and method Download PDFInfo
- Publication number
- JP2016009352A JP2016009352A JP2014129955A JP2014129955A JP2016009352A JP 2016009352 A JP2016009352 A JP 2016009352A JP 2014129955 A JP2014129955 A JP 2014129955A JP 2014129955 A JP2014129955 A JP 2014129955A JP 2016009352 A JP2016009352 A JP 2016009352A
- Authority
- JP
- Japan
- Prior art keywords
- plant
- operation data
- variable factor
- variable
- value
- Prior art date
- Legal status (The legal status is an assumption and is not a legal conclusion. Google has not performed a legal analysis and makes no representation as to the accuracy of the status listed.)
- Pending
Links
Images




Landscapes
- Testing And Monitoring For Control Systems (AREA)
Abstract
Description
本発明は、プラントの運転データに基づいてプラントの異常事象を診断するプラントの異常予兆診断装置及び方法に関する。 The present invention relates to a plant abnormality sign diagnosis apparatus and method for diagnosing plant abnormal events based on plant operation data.
従来、発電所や機械設備などのプラントにおいて、プラントの各種運転データに基づいてプラントを監視、診断する方法が種々提案、実用化されている。これらは、プラントの各部位に設置されたセンサによりプラントの運転データを収集し、この運転データに基づいて、プラントの制御室にいる運転員がプラントの各種データを直接監視し、またはこれらの短期から長期に渡るデータを分析することでプラントの監視、診断を実施するものである。 2. Description of the Related Art Conventionally, various methods for monitoring and diagnosing plants based on various types of plant operation data have been proposed and put into practical use in plants such as power plants and machinery facilities. They collect plant operation data by sensors installed in each part of the plant, and based on this operation data, operators in the plant control room directly monitor various plant data, or these short-term The plant is monitored and diagnosed by analyzing long-term data.
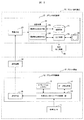
図1にプラント診断装置21の典型的な一例を示す。この図において12はプラントが設置される現地10に備えられたプラント監視装置であり、21は一般的にはプラント現地10から遠隔の地(プラント診断拠点)20に設けられたプラント診断装置である。プラント監視装置12は、制御コントローラ・データ収集手段13、データ管理手段14、オペレーションシステム15、通信手段16などで構成されており、要するにプラント設置現場10に設置された各種のセンサが検知したプラント情報を、送信手段16、通信回線30を介してプラント監視装置21内の受信手段27に送っている。
FIG. 1 shows a typical example of the plant diagnostic apparatus 21. In this figure, 12 is a plant monitoring device provided at the
プラントの診断装置21では、プラントの各種センサ11で測定された複数の運転データに基づいて、プラントの劣化を診断する。このためプラント診断装置21は、複数の運転データに対して設定されたしきい値を診断データベース(診断DB)25内に保持している。そしてプラント診断装置21の演算手段22は、受信手段27から得た複数の運転データと、これらの運転データに対応する診断データベース(診断DB)25内のしきい値とをそれぞれ比較して、運転データがしきい値を超える場合にその運転データを異常有りと判定する異常予兆判定手段23と、異常有りと判定された運転データが2以上存在するとき、異常有りと判定された運転データの組み合わせに基づいて異常が発生した部位を特定する異常部位特定手段24を備えている。
The plant diagnosis device 21 diagnoses the deterioration of the plant based on a plurality of operation data measured by the various sensors 11 of the plant. For this reason, the plant diagnosis apparatus 21 holds threshold values set for a plurality of operation data in a diagnosis database (diagnosis DB) 25. Then, the calculation means 22 of the plant diagnosis device 21 compares the plurality of operation data obtained from the reception means 27 with the threshold values in the diagnosis database (diagnostic DB) 25 corresponding to these operation data, respectively. A combination of the abnormality sign determination means 23 for determining that the operation data is abnormal when the data exceeds the threshold value, and the operation data determined to be abnormal when there are two or more operation data determined to be abnormal Is provided with an abnormal
特許文献1には運転データに対応するしきい値を、運転負荷に対応して変動するように設定しているプラント診断装置が示されている。
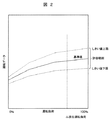
特許文献1によれば、しきい値は運転負荷に応じて可変の値とされており、この一例が図2に示されている。ここでは基準値が運転負荷に対して可変に設定されており、基準値に対して所定の許容範囲を示すしきい値の上下限が範囲として設定されている。従って、運転データの値がその時の運転負荷で定まる上下限しきい値の範囲内であれば正常、範囲外であれば異常とされる。
According to
係る設定手法を採用する場合(つまり図2に示すような運転データが運転負荷に対して一義的な関係式で関係付けられる場合)は、正確な異常予兆判定が可能であるが、運転データが環境条件等により大きく左右されるプラントに対しては運転負荷により運転データに対するしきい値を変動させるだけでは正確な異常予兆判定が出来なくなる。 When such a setting method is adopted (that is, when the operation data as shown in FIG. 2 is related to the operation load with a unique relational expression), an accurate abnormality sign can be determined. For plants that are greatly affected by environmental conditions and the like, it is not possible to accurately determine an abnormal sign simply by changing the threshold value for the operation data depending on the operation load.
複数の可変要因の影響を受ける運転データの具体的な事例として、例えばコンバインド発電プラントの場合、運転負荷は、ガスタービン負荷と排熱回収ボイラから発生する蒸気で発電する蒸気タービン負荷の合計である。このうち運転負荷の一方の負荷であるガスタービン負荷は、大気温度(吸気温度)の変化に応じて変化する関係にある。具体的には、大気温度が低くなるとガスタービン効率が向上し、ガスタービン負荷が増加するという関係にある。そしてこの結果、運転負荷のバランスとしてガスタービン負荷が増加すると、蒸気タービン負荷が減少するような動作になる。最終的に合計の運転負荷は、増加したガスタービン負荷と減少した蒸気タービン負荷の和として定まる。 As a specific example of operation data affected by multiple variable factors, for example, in the case of a combined power plant, the operation load is the sum of the gas turbine load and the steam turbine load that generates power from the steam generated from the exhaust heat recovery boiler. . Of these, the gas turbine load, which is one of the operating loads, has a relationship of changing according to changes in the atmospheric temperature (intake air temperature). Specifically, the gas turbine efficiency is improved and the gas turbine load is increased when the atmospheric temperature is lowered. As a result, when the gas turbine load increases as the balance of the operation load, the steam turbine load decreases. Ultimately, the total operating load is determined as the sum of the increased gas turbine load and the reduced steam turbine load.
このため特に蒸気タービンの各種運転データが、運転負荷に対して一定の特性になりにくく、大気温度の変化に対するガスタービン負荷増分を吸収するように蒸気タービン負荷が減少する特性となるため、運転負荷と蒸気タービンの各種運転データ基準値は、運転負荷と大気温度の2つのパラメータで決定しないと合わなくなる。この事例では、運転データの値が2種類の可変要因の影響を受け、第1の可変要因が運転負荷であり、第2の可変要因が環境条件としての大気温度である。 For this reason, in particular, various operating data of the steam turbine are less likely to have a constant characteristic with respect to the operating load, and the steam turbine load decreases to absorb the gas turbine load increment with respect to changes in the atmospheric temperature. The various operational data reference values for the steam turbine will not match unless determined by the two parameters of the operational load and the atmospheric temperature. In this case, the value of the operation data is affected by two types of variable factors, the first variable factor is the operation load, and the second variable factor is the atmospheric temperature as the environmental condition.
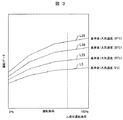
図3に運転データ(縦軸)が運転負荷(横軸)に対して一義的な関係式で関係付けられないプラントの、運転負荷と、大気温度、運転データ基準値の関係例を示す。ここでは基準値自体が運転負荷に対応した可変の値であり、かつ大気温度をパラメータとして複数の基準値L5,L25,L30,L35が設定される必要がある。図示の例では、運転データ基準値が大気温度5℃、25℃、30℃、35℃のように、大気温度毎に設定されている。このように運転データ特性が熱平衡線図(ヒートバランス)により運転負荷に対して、運転データ基準値を関係付けることで表現することが出来る。 FIG. 3 shows an example of the relationship between the operation load, the atmospheric temperature, and the operation data reference value for a plant in which the operation data (vertical axis) is not related to the operation load (horizontal axis) by a unique relational expression. Here, the reference value itself is a variable value corresponding to the operating load, and a plurality of reference values L5, L25, L30, and L35 need to be set using the atmospheric temperature as a parameter. In the illustrated example, the operation data reference value is set for each atmospheric temperature such that the atmospheric temperature is 5 ° C, 25 ° C, 30 ° C, and 35 ° C. As described above, the operation data characteristic can be expressed by relating the operation data reference value to the operation load by the heat balance diagram (heat balance).
このようなプラントに対して運転データ基準値Lに対するしきい値上限LU、しきい値下限LLを設定した例を図4に示す。図4の例では、最も小さい基準値L5(大気温度が5℃)に対するしきい値下限値LL5から、最も大きい基準値L35(大気温度が35℃)に対するしきい値上限値LU35までの温度範囲内が許容範囲ということになってしまう。 FIG. 4 shows an example in which a threshold upper limit LU and a threshold lower limit LL for the operation data reference value L are set for such a plant. In the example of FIG. 4, the temperature range from the threshold lower limit value LL5 for the smallest reference value L5 (atmospheric temperature is 5 ° C.) to the threshold upper limit value LU35 for the largest reference value L35 (atmospheric temperature is 35 ° C.). The inside is the allowable range.
以上、運転データ基準値に運転負荷のみならず、大気温度が大きく影響する場合は、図4に示したように、しきい値上限LUを設定するには、大気温度を加味した運転データ基準値の最大上限側より大きく、しきい値下限LLを設定するには、大気温度を加味した運転データ基準値の基準値下限側より小さく設定するようにし、しきい値上限としきい値下限の幅を広く設定しないと誤った異常を検知してしまうことになる。 As described above, when not only the operation load but also the atmospheric temperature has a great influence on the operation data reference value, as shown in FIG. 4, the operation data reference value with the atmospheric temperature taken into account is set in order to set the threshold upper limit LU. In order to set the threshold lower limit LL that is larger than the maximum upper limit side, set it to be smaller than the reference value lower limit side of the operation data reference value in consideration of the atmospheric temperature, and set the width of the threshold upper limit and threshold lower limit. If it is not set widely, an erroneous abnormality will be detected.
このため、運転負荷と大気温度からみて本来は異常と判定する運転データであっても、異常と判定することが出来ずに、未然に防止することができたプラント効率の低下やプラント設備の故障等のトラブル発生を防止することができず、経済的な損失をこうむることが想定される。 For this reason, even if the operation data is originally determined to be abnormal from the viewpoint of the operating load and the atmospheric temperature, it cannot be determined as abnormal, and the plant efficiency can be prevented and the plant equipment has failed. It is assumed that troubles such as the above cannot be prevented and an economic loss is incurred.
以上のことから本発明においては、かかる従来技術の問題に鑑み、運転データが運転負荷に対して一義的な関係式で関係付けられないプラントの異常事象を正確に把握でき、トラブルを未然に防止することができるプラントの異常予兆診断装置及び方法を提供することを目的とする。 From the above, in the present invention, in view of the problems of the prior art, it is possible to accurately grasp an abnormal event of the plant in which the operation data is not related to the operation load with a unique relational expression, and prevent troubles. It is an object of the present invention to provide a plant abnormality sign diagnosis apparatus and method that can be used.
上記課題を解決するために、本発明に係るプラントの診断装置は、プラントの運転状況を示す運転データが第1と第2の可変要因の影響を受けて変動する運転データに基づいて、プラントの劣化を診断するプラントの異常予兆診断装置であって、
プラントから運転データと第1と第2の可変要因を入力する入力手段と、第2の可変要因が一定値であるという前提での運転データと第1の可変要因の関係を基準特性として、複数の第2の可変要因ごとに準備し記憶する記憶手段と、演算手段とを備え、
演算手段は、入力した第2の可変要因の値から記憶手段を参照し、複数の基準特性のうち入力した第2の可変要因の値に近い2つの基準特性から、入力した第2の可変要因の値における基準特性を算出し、算出した基準特性に対して上下限のしきい値を設定し、上下限のしきい値と前記運転データと第1の可変要因の値とから、運転データを評価する。
In order to solve the above-described problem, a plant diagnosis apparatus according to the present invention is based on operation data in which operation data indicating the operation status of the plant fluctuates due to the influence of the first and second variable factors. An abnormality sign diagnosis device for a plant that diagnoses deterioration,
The input means for inputting the operation data and the first and second variable factors from the plant, and the relationship between the operation data and the first variable factor on the premise that the second variable factor is a constant value, are used as a reference characteristic. Storage means for preparing and storing each second variable factor, and an arithmetic means,
The computing means refers to the storage means from the value of the input second variable factor, and inputs the second variable factor input from two reference characteristics close to the value of the input second variable factor among the plurality of reference characteristics. The reference characteristic at the value is calculated, upper and lower threshold values are set for the calculated reference characteristic, and the operation data is calculated from the upper and lower threshold values, the operation data, and the value of the first variable factor. evaluate.
以上記載のように本発明によれば、運転データが環境条件等により大きく左右されるプラントに対して、運転負荷と大気温度等の環境条件を用いて各運転データ基準値に対応するしきい値を可変に設定することで、許容範囲を狭く設定することが可能となり、異常予兆判定の精度向上が可能である。 As described above, according to the present invention, the threshold value corresponding to each operation data reference value using the environmental conditions such as the operating load and the atmospheric temperature for the plant whose operating data is greatly influenced by the environmental conditions and the like. By variably setting the allowable range, it is possible to set the allowable range narrow and improve the accuracy of the abnormality sign determination.
以下、図面を参照して本発明の好適な実施例を例示的に詳しく説明する。但しこの実施例に記載されている構成部品の寸法、材質、形状、その相対的配置等は特に特定的な記載がない限りは、この発明の範囲をそれに限定する趣旨ではなく、単なる説明例に過ぎない。 Hereinafter, exemplary embodiments of the present invention will be described in detail with reference to the drawings. However, the dimensions, materials, shapes, relative arrangements, and the like of the components described in this embodiment are not intended to limit the scope of the present invention unless otherwise specified, but are merely illustrative examples. Not too much.
本発明では、図1の演算手段22に以下の処理を追加する。演算手段22は、異常予兆判定手段23を備えている。また、演算手段22には、複数の運転データに対応したしきい値がそれぞれ設定されている。例えば、図3に示すように、運転データ基準値が、運転負荷と大気温度により変動する場合は、運転負荷および大気温度に対応して複数設定された(図3の例では4つ)運転データ基準値曲線L5,L20,L30,L35を備えている。 In the present invention, the following processing is added to the calculation means 22 of FIG. The calculation means 22 includes an abnormality sign determination means 23. Further, threshold values corresponding to a plurality of operation data are respectively set in the calculation means 22. For example, as shown in FIG. 3, when the operation data reference value varies depending on the operation load and the atmospheric temperature, a plurality of operation data are set corresponding to the operation load and the atmospheric temperature (four in the example of FIG. 3). Reference value curves L5, L20, L30, and L35 are provided.
かつ本発明では、予め作成し、準備された基準温度(5度、20度、30度、35度)での運転データ基準値曲線L5,L20,L30,L35を、実際の大気温度を用いて補完する。具体的には、準備した運転データ基準値曲線L5,L20,L30,L35の中から、現在の大気温度にもっとも近い運転データ基準値曲線と2番目に近い運転データ基準値曲線を選択する。例えば現在の大気温度が31度であったとすると、現在の大気温度である31度にもっとも近い運転データ基準値曲線としてL30を選択し、2番目に近い運転データ基準値曲線としてL35を選択する。 In the present invention, the operation data reference value curves L5, L20, L30, and L35 at the reference temperatures (5 degrees, 20 degrees, 30 degrees, and 35 degrees) prepared and prepared in advance using the actual atmospheric temperature. Complement. Specifically, the operation data reference value curve closest to the current atmospheric temperature and the operation data reference value curve closest to the second are selected from the prepared operation data reference value curves L5, L20, L30, and L35. For example, if the current atmospheric temperature is 31 degrees, L30 is selected as the operation data reference value curve closest to the current atmospheric temperature of 31 degrees, and L35 is selected as the second operation data reference value curve.
そのうえで、L30とL35の特性から、31度の現在温度での特性L31を内挿計算により求め、現在の大気温度、運転負荷に対する運転データ基準値を算出する。図5に現在大気温度における運転データ基準値を算出した例を示す。現在の大気温度が31℃の場合は、現在の大気温度に最も近い運転データ基準値(大気温度:30℃)の曲線L30と、2番目に近い運転データ基準値(大気温度:35℃)の曲線L31を選択して、現在の大気温度31℃により、内挿計算を実施して現在の運転データ基準値L31を算出する。 Then, a characteristic L31 at a current temperature of 31 degrees is obtained from the characteristics of L30 and L35 by interpolation, and an operation data reference value for the current atmospheric temperature and operation load is calculated. FIG. 5 shows an example in which the operation data reference value at the current atmospheric temperature is calculated. When the current atmospheric temperature is 31 ° C., the curve L30 of the operation data reference value (atmospheric temperature: 30 ° C.) closest to the current atmospheric temperature and the second closest operation data reference value (atmosphere temperature: 35 ° C.) The curve L31 is selected, and the current operation data reference value L31 is calculated by performing interpolation calculation based on the current atmospheric temperature 31 ° C.
内挿計算を実施して算出した現在の運転データ基準値L31の例を図6に示す。この特性L31は現在温度に位置づけられた運転データと運転負荷の関係を示しており、運転データは唯一運転負荷のみを可変要因とする値として把握されている。従って、この温度状態での運転負荷に対する運転データの基準値が正しく反映されていることから、運転データ基準値に対してしきい値判定用許容偏差により、しきい値上限、しきい値下限を厳しく(狭い範囲で)設定することができる。図6の基準値L31に対する許容偏差は例えば1%であり、上限LU31,下限LL31は許容誤差の観点から運転負荷ごとに定めることができる。なお、運転負荷ごとの偏差値は、いずれの負荷帯でも一定としてもよく、1%の許容偏差を反映した形にしてもよい。 An example of the current operation data reference value L31 calculated by performing the interpolation calculation is shown in FIG. This characteristic L31 shows the relationship between the operation data positioned at the current temperature and the operation load, and the operation data is grasped as a value having only the operation load as a variable factor. Therefore, since the reference value of the operation data for the operation load in this temperature state is correctly reflected, the threshold value upper limit and the threshold lower limit are set according to the threshold value judgment allowable deviation with respect to the operation data reference value. It can be set strictly (in a narrow range). The allowable deviation with respect to the reference value L31 in FIG. 6 is, for example, 1%, and the upper limit LU31 and the lower limit LL31 can be determined for each operating load from the viewpoint of the allowable error. It should be noted that the deviation value for each operating load may be constant in any load band or may reflect a 1% allowable deviation.
運転データ基準値が環境条件等により大きく左右されるプラントに対して運転データのみに対応してしきい値を設定した場合は、しきい値上下限の許容偏差の幅を広げて設定して運用する以外に方法がなかったが、このように運転負荷と大気温度によってしきい値を可変する異常予兆判定手段23を備えることで、しきい値の許容偏差幅を可能な限り狭めることが可能となり、正確な異常予兆判定が可能となる。 If a threshold value is set corresponding to only the operation data for a plant whose operation data reference value is greatly affected by environmental conditions, etc., the threshold value upper and lower limit deviations are set wider and operated. Although there was no method other than to do this, it is possible to reduce the allowable deviation width of the threshold as much as possible by providing the abnormal sign determination means 23 that varies the threshold according to the operating load and the atmospheric temperature. This makes it possible to accurately determine an abnormal sign.
異常予兆判定手段23は、受信手段27で受信した運転データと、この運転データ、大気温度に対応したしきい値とを比較し、運転データがしきい値を超える場合にはこの運転データが異常有りと判定する。 The abnormality sign determination means 23 compares the operation data received by the reception means 27 with a threshold value corresponding to the operation data and the atmospheric temperature, and if the operation data exceeds the threshold value, the operation data is abnormal. Judge that there is.
図1において、異常部位特定手段24は、異常予兆判定手段23において異常有りと判定された運転データが2以上存在するとき、異常有りと判定された運転データの組み合わせに基づいて異常が発生した部位を特定する。
In FIG. 1, when there are two or more operation data determined to be abnormal by the abnormality
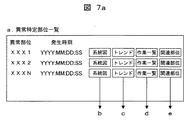
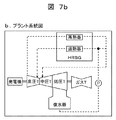
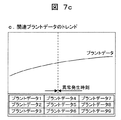
図7にプラントの異常部位を特定した際のプラント診断装置の画面出力の例を示す。図7aは、異常特定部位一覧画面の例であり、これが基準画面となって、以降の画面を選択表示している。図7aの異常特定部位一覧画面では、異常部位と発生時刻を表示し、併せて系統図、トレンド、作業一覧、関連部位を選択可能である。図7bは系統図表示画面例、図7cは関連プラントデータのトレンド表示画面例、図7dは異常発生時作業一覧示画面例、図7eは関連部位一覧表示画面例である。なお図7aの異常特定部位一覧からはプラント系統のどの部位が異常となったのかを色替え(正常:緑、異常:赤)で表示する画面、異常判定前後の異常判定に使用したプラントデータのトレンドをグラフ表示する画面、異常発生時に必要となる作業を表示する画面、異常発生した部位と関連のある部位の情報を表示する画面への遷移を可能とすることもできる。 FIG. 7 shows an example of the screen output of the plant diagnostic apparatus when an abnormal part of the plant is specified. FIG. 7A is an example of the abnormal specific part list screen. This is a reference screen, and the subsequent screens are selectively displayed. In the abnormal specific part list screen of FIG. 7a, the abnormal part and the occurrence time are displayed, and a system diagram, a trend, a work list, and a related part can be selected. 7b is an example of a system diagram display screen, FIG. 7c is an example of a trend display screen of related plant data, FIG. 7d is an example of a work list screen when an abnormality occurs, and FIG. 7e is an example of a related part list display screen. In addition, from the abnormality specific part list of FIG. 7a, a screen displaying which part of the plant system has become abnormal with a color change (normal: green, abnormality: red), the plant data used for the abnormality determination before and after the abnormality determination It is also possible to transition to a screen for displaying a trend graph, a screen for displaying work required when an abnormality occurs, and a screen for displaying information on a part related to the part where the abnormality has occurred.
出力手段26では、異常部位特定手段24で異常有りと特定した部位をプラント診断装置21のモニタ画面29に異常と特定した部位の一覧などを図7の事例のように表示し、かつプラント性能に関わる重要部位及び異常が人的被害を及ぼす可能性がある重要部位については音声出力装置28で異常発生音声を出力する。このような出力手段を有することで運転員に対する迅速な通知と異常発生時の分析・復旧作業をサポートすることが可能となる。
The output means 26 displays a list of the parts identified as abnormal on the
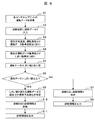
次に、図8を参照して、本発明の実施形態に係るプラント診断処理方法を説明する。図8の処理フローの最初の処理ステップS1では、プラント現地10において、各種センサ11で計測された運転データを制御コントローラ・データ収集手段13にて収集する。一例として、排熱回収ボイラ本体の蒸気流量、蒸気温度、蒸気圧力、排熱回収ボイラ出口ガス温度、ガスタービン本体の燃料流量、吸込空気温度、吸込空気流量、ガスタービン出口ガス温度、排ガス温度、蒸気タービンの主蒸気流量、主蒸気圧力、主蒸気温度、低温再熱蒸気流量、低温再熱蒸気圧力、低温再熱蒸気温度、高温再熱蒸気流量、高温再熱蒸気圧力、高温再熱蒸気温度、低圧主蒸気流量、低圧主蒸気圧力、低圧主蒸気温度、などを有する火力発電プラントの異常や長期劣化を診断する場合は、それぞれの機器に設置されたセンサ11により計測された運転データを制御コントローラ・データ収集手段13にて収集する。
Next, with reference to FIG. 8, a plant diagnosis processing method according to an embodiment of the present invention will be described. In the first processing step S1 of the processing flow of FIG. 8, the operation data measured by the various sensors 11 is collected by the controller / data collection means 13 in the
図1の制御コントローラ・データ収集手段13では、これらの運転データをデータ管理手段14に格納するとともに、オペレーションシステム15を介して運転員に提示する。また、制御コントローラ・データ収集手段13は、プラント診断装置21でプラントの異常診断に必要とされる複数の運転データを選択し、送信手段16により送信する。プラント診断拠点20では、プラント診断装置21の受信手段27にて、送信手段16で送信された複数の運転データを、通信回線30を介して受信し、演算手段22に入力する(処理ステップS2)。
The controller / data collection means 13 in FIG. 1 stores these operation data in the data management means 14 and presents them to the operator via the
処理ステップS3では、予め作成準備された複数の運転基準値L5,L29,L30,L35の中から、現在の大気温度に応じて最も温度が近い2つの運転データ基準値を算出する。先の事例では図5のL30とL35を選択する。さらに運転データ基準値L30とL35の内挿計算により、現在温度での運転データ基準値L31を作成する。ここまでの処理を反映した図が図5である。 In process step S3, two operation data reference values having the closest temperatures are calculated from a plurality of operation reference values L5, L29, L30, and L35 prepared and prepared in advance according to the current atmospheric temperature. In the previous case, L30 and L35 in FIG. 5 are selected. Further, the operation data reference value L31 at the current temperature is created by interpolation calculation of the operation data reference values L30 and L35. FIG. 5 is a diagram reflecting the processing so far.
処理ステップS4では、現在温度での運転データ基準値L31に対して、しきい値判定用許容偏差を適用し、しきい値上限LU31、しきい値下限LL31を設定する。ここまでの処理を反映した図が図6である。 In process step S4, the threshold value judgment allowable deviation is applied to the operation data reference value L31 at the current temperature, and the threshold value upper limit LU31 and the threshold value lower limit LL31 are set. FIG. 6 is a diagram reflecting the processing so far.
処理ステップS5では、演算手段22の異常予兆判定手段23にて、複数の運転データと、これらの運転データと大気温度に対応したしきい値とをそれぞれ比較し、処理ステップS6において運転データがしきい値を超えるか否かを判断し、しきい値を超える運転データを異常有りと判定する。 In processing step S5, the abnormality sign determination means 23 of the calculation means 22 compares the plurality of operation data with these operation data and a threshold value corresponding to the atmospheric temperature, and in operation step S6, the operation data is obtained. It is determined whether or not the threshold value is exceeded, and operation data that exceeds the threshold value is determined to be abnormal.
異常有りと判定された運転データが存在しないとき、又はその運転データが2未満であるときは、診断DB25に、異常予兆無しの診断情報を格納し(処理ステップS7)、出力手段26により診断情報を出力する(処理ステップS8)。
When there is no operation data determined to be abnormal, or when the operation data is less than 2, the
異常有りと判定された運転データが2以上存在するとき、異常有りと判定されたデータの組み合わせに基づいて異常部位を特定する(処理ステップS9)。そして、診断DB25に、異常部位とその状況を含む診断情報を格納し(処理ステップS10)、出力手段26により診断情報を出力する(処理ステップS11)。 When there are two or more operation data determined to be abnormal, an abnormal region is identified based on the combination of data determined to be abnormal (processing step S9). Then, diagnostic information including the abnormal part and its situation is stored in the diagnostic DB 25 (processing step S10), and the diagnostic information is output by the output means 26 (processing step S11).
例えば、上記したコンバインド発電プラントの場合、タービン主蒸気流量、温度、圧力などの運転データは、ガスタービン排熱により回収したエネルギーから発生させた蒸気により蒸気タービンを回転させ発電機出力を得るが、流量、温度、圧力のバランスがくずれた場合に、異常部位が排熱回収ボイラのある特定部位に発生したと診断し、この診断情報を出力する。なお、診断に用いられる運転データは、プラント内に配置された異なる2以上の装置又は設備(例えば、ボイラ本体と水系統装置など)から得られる運転データであってもよい。火力発電プラントを診断対象とした場合、複数の運転データを用いて診断することにより、例えばプラント全体の発電効率、ボイラ効率、タービン効率、又は排煙処理効率等の性能を診断することができる。 For example, in the case of the combined power plant described above, the operation data such as the turbine main steam flow rate, temperature, and pressure are obtained by rotating the steam turbine with the steam generated from the energy recovered by the gas turbine exhaust heat to obtain the generator output. When the balance of flow rate, temperature, and pressure is lost, it is diagnosed that an abnormal part has occurred in a specific part of the exhaust heat recovery boiler, and this diagnostic information is output. The operation data used for the diagnosis may be operation data obtained from two or more different devices or facilities (for example, a boiler body and a water system device) arranged in the plant. When a thermal power plant is targeted for diagnosis, performance such as power generation efficiency, boiler efficiency, turbine efficiency, or flue gas processing efficiency of the entire plant can be diagnosed by performing diagnosis using a plurality of operation data.
コンバインド発電プラントの場合、夏は冬に比べるとガスタービン入口の大気温度が高くなり、それに伴いガスタービン出口の排ガス温度が高くなる。ガスタービン出口排ガス温度には規制があるため、負荷が取れなくなってしまう。本発明は、コンバインド発電プラントの特徴としてガスタービン出力と蒸気タービン出力の合計が電気出力になるという関係が、大気温度によりバランスが大きく変化するという点についてフレキシビリテイを持たせた異常検知方法である。 In the case of a combined power plant, the atmospheric temperature at the gas turbine inlet is higher in summer than in winter, and accordingly, the exhaust gas temperature at the gas turbine outlet is higher. Since the exhaust gas temperature at the gas turbine outlet is regulated, the load cannot be taken. The present invention is an abnormality detection method having flexibility in that the relationship that the sum of the gas turbine output and the steam turbine output becomes an electric output as a feature of the combined power plant is a large change due to the atmospheric temperature. is there.
このように本実施形態によれば、大気温度と運転負荷により運転データ基準値を作成することで、しきい値をより精度の良い値にすることができ、許容偏差を小さくすることが可能となり、正確な異常予兆判定が可能となるため、技術者の熟練度に関わらず定量的でより正確な異常予兆判定が可能である。 As described above, according to the present embodiment, by creating the operation data reference value based on the atmospheric temperature and the operation load, the threshold value can be set to a more accurate value and the allowable deviation can be reduced. In addition, since it is possible to accurately determine an abnormal sign, quantitative and more accurate determination of an abnormal sign is possible regardless of the skill level of the engineer.
10:プラント現地
11:各種センサ
12:プラント監視装置
13:制御コントローラ・データ収集手段
14:データ管理手段
15:オペレーションシステム
16:送信手段
20:プラント診断拠点
21:プラント診断装置
22:演算手段
23:異常予兆判定手段
24:異常部位特定手段
25:診断データベース(診断DB)
26:出力手段
27:受信手段
28:音声出力装置
10: Plant site 11: Various sensors 12: Plant monitoring device 13: Control controller / data collection means 14: Data management means 15: Operation system 16: Transmission means 20: Plant diagnosis base 21: Plant diagnosis device 22: Calculation means 23: Abnormal sign determination means 24: abnormal part specifying means 25: diagnosis database (diagnosis DB)
26: output means 27: reception means 28: audio output device
Claims (4)
前記プラントから前記運転データと第1と第2の可変要因を入力する入力手段と、第2の可変要因が一定値であるという前提での前記運転データと第1の可変要因の関係を基準特性として、複数の第2の可変要因ごとに準備し記憶する記憶手段と、演算手段とを備え、
演算手段は、入力した第2の可変要因の値から前記記憶手段を参照し、前記複数の基準特性のうち前記入力した第2の可変要因の値に近い2つの基準特性から、前記入力した第2の可変要因の値における基準特性を算出し、算出した基準特性に対して上下限のしきい値を設定し、上下限のしきい値と前記運転データと第1の可変要因の値とから、運転データを評価するプラントの異常予兆診断装置。 A plant abnormality sign diagnosis device for diagnosing deterioration of the plant based on operation data in which operation data indicating the operation status of the plant fluctuates under the influence of the first and second variable factors,
The input means for inputting the operation data and the first and second variable factors from the plant, and the relationship between the operation data and the first variable factor on the premise that the second variable factor is a constant value is a reference characteristic. A storage means for preparing and storing for each of a plurality of second variable factors, and an arithmetic means,
The calculation means refers to the storage means from the value of the input second variable factor, and from the two reference characteristics close to the input value of the second variable factor among the plurality of reference characteristics, A reference characteristic is calculated for the two variable factor values, and upper and lower threshold values are set for the calculated reference characteristic. From the upper and lower threshold values, the operation data, and the first variable factor value, An abnormal sign diagnostic device for plant that evaluates operation data.
前記プラントはガスタービンとガスタービン排ガスにより駆動される蒸気タービンを備えたコンバインド発電プラントであって、
第1の可変要因は運転負荷であり、第2の可変要因は大気温度であることを特徴とするプラントの異常予兆診断装置。 A plant abnormality sign diagnosis device according to claim 1,
The plant is a combined power plant including a gas turbine and a steam turbine driven by gas turbine exhaust gas,
A plant abnormality sign diagnosis apparatus characterized in that a first variable factor is an operating load and a second variable factor is an atmospheric temperature.
前記プラントから前記運転データと第1と第2の可変要因を入力し、第2の可変要因が一定値であるという前提での前記運転データと第1の可変要因の関係を基準特性として、複数の第2の可変要因ごとに準備し、第2の可変要因の値に近い2つの基準特性から、入力した第2の可変要因の値における基準特性を算出し、算出した基準特性に対して上下限のしきい値を設定し、上下限のしきい値と前記運転データと第1の可変要因の値とから、運転データを評価することを特徴とするプラントの異常予兆診断方法。 A plant abnormality sign diagnosis method for diagnosing deterioration of the plant based on operation data in which operation data indicating the operation status of the plant fluctuates under the influence of the first and second variable factors,
The operation data and the first and second variable factors are input from the plant, and the relationship between the operation data and the first variable factor on the premise that the second variable factor is a constant value is used as a reference characteristic. Prepare for each second variable factor, calculate the reference characteristic at the input value of the second variable factor from the two reference characteristics close to the value of the second variable factor, and A plant abnormality sign diagnosis method characterized by setting a lower limit threshold value and evaluating the operation data from the upper and lower limit threshold values, the operation data, and the value of the first variable factor.
前記プラントはガスタービンとガスタービン排ガスにより駆動される蒸気タービンを備えたコンバインド発電プラントであって、
第1の可変要因は運転負荷であり、第2の可変要因は大気温度であることを特徴とするプラントの異常予兆診断方法。 A plant abnormality sign diagnosis method according to claim 3,
The plant is a combined power plant including a gas turbine and a steam turbine driven by gas turbine exhaust gas,
A plant abnormality sign diagnosis method, wherein the first variable factor is an operating load and the second variable factor is an atmospheric temperature.
Priority Applications (1)
| Application Number | Priority Date | Filing Date | Title |
|---|---|---|---|
| JP2014129955A JP2016009352A (en) | 2014-06-25 | 2014-06-25 | Plant abnormality sign diagnosis device and method |
Applications Claiming Priority (1)
| Application Number | Priority Date | Filing Date | Title |
|---|---|---|---|
| JP2014129955A JP2016009352A (en) | 2014-06-25 | 2014-06-25 | Plant abnormality sign diagnosis device and method |
Publications (1)
| Publication Number | Publication Date |
|---|---|
| JP2016009352A true JP2016009352A (en) | 2016-01-18 |
Family
ID=55226860
Family Applications (1)
| Application Number | Title | Priority Date | Filing Date |
|---|---|---|---|
| JP2014129955A Pending JP2016009352A (en) | 2014-06-25 | 2014-06-25 | Plant abnormality sign diagnosis device and method |
Country Status (1)
| Country | Link |
|---|---|
| JP (1) | JP2016009352A (en) |
Cited By (5)
| Publication number | Priority date | Publication date | Assignee | Title |
|---|---|---|---|---|
| EP3418502A1 (en) * | 2017-06-20 | 2018-12-26 | Siemens Aktiengesellschaft | Method for checking a fluid flow machine |
| JP2020098417A (en) * | 2018-12-17 | 2020-06-25 | 株式会社東芝 | Monitoring board device and control method |
| WO2020152741A1 (en) * | 2019-01-21 | 2020-07-30 | 三菱電機株式会社 | Abnormality cause estimation device, abnormality cause estimation method, and program |
| JP2021096492A (en) * | 2019-12-13 | 2021-06-24 | 三菱電機株式会社 | Diagnostic device, power generation facility, data creation method, and diagnostic program |
| JP2022118624A (en) * | 2021-02-02 | 2022-08-15 | 三菱電機株式会社 | Plant monitoring support system, plant monitoring support method, and plant monitoring support program |
-
2014
- 2014-06-25 JP JP2014129955A patent/JP2016009352A/en active Pending
Cited By (7)
| Publication number | Priority date | Publication date | Assignee | Title |
|---|---|---|---|---|
| EP3418502A1 (en) * | 2017-06-20 | 2018-12-26 | Siemens Aktiengesellschaft | Method for checking a fluid flow machine |
| WO2018233903A1 (en) * | 2017-06-20 | 2018-12-27 | Siemens Aktiengesellschaft | METHOD FOR CONTROLLING TURBOMACHINE |
| JP2020098417A (en) * | 2018-12-17 | 2020-06-25 | 株式会社東芝 | Monitoring board device and control method |
| WO2020152741A1 (en) * | 2019-01-21 | 2020-07-30 | 三菱電機株式会社 | Abnormality cause estimation device, abnormality cause estimation method, and program |
| JP2021096492A (en) * | 2019-12-13 | 2021-06-24 | 三菱電機株式会社 | Diagnostic device, power generation facility, data creation method, and diagnostic program |
| JP2022118624A (en) * | 2021-02-02 | 2022-08-15 | 三菱電機株式会社 | Plant monitoring support system, plant monitoring support method, and plant monitoring support program |
| JP7506001B2 (en) | 2021-02-02 | 2024-06-25 | 三菱電機株式会社 | PLANT MONITORING SUPPORT SYSTEM, PLANT MONITORING SUPPORT METHOD, AND PLANT MONITORING SUPPORT PROGRAM |
Similar Documents
| Publication | Publication Date | Title |
|---|---|---|
| CN108376298B (en) | A wind turbine engine temperature fault early warning diagnosis method | |
| EP2573390B1 (en) | System and method for predicting wind turbine component failures | |
| CN104272207B (en) | Method and system for real-time gas turbine performance reporting | |
| CN104200396B (en) | A kind of wind turbine component fault early warning method | |
| CN109580216B (en) | Intelligent fault early warning system of gear box lubrication cooling system, method and unit thereof | |
| JP5991329B2 (en) | Control device, management device, plant control system, and data processing method | |
| JP2016009352A (en) | Plant abnormality sign diagnosis device and method | |
| US9188021B2 (en) | Steam turbine blade vibration monitor backpressure limiting system and method | |
| JP2015114778A (en) | PLANT CONTROL SYSTEM, CONTROL DEVICE, MANAGEMENT DEVICE, AND PLANT INFORMATION PROCESSING METHOD | |
| CN103226651A (en) | Wind turbine state evaluation and early-warning method and system based on similarity statistics | |
| CN103471729A (en) | Device temperature early warning method and application thereof | |
| CN108710689A (en) | A wind farm meteorological data management system and method | |
| CN112001511A (en) | Equipment reliability and dynamic risk evaluation method, system and equipment based on data mining | |
| CN108318230B (en) | Fault diagnosis device and method for petrochemical rotating unit | |
| JP6924114B2 (en) | Methods and systems for detecting control sensor overrides | |
| JP2021076597A (en) | Detecting rotor anomalies by determining vibration trends during transient speed operation | |
| CN109240253B (en) | An online equipment diagnosis and preventive maintenance method and system | |
| CN104483993B (en) | Automatic Temperature Control System and Control Method for Alternating Thermal Load Specimen in Space Environment | |
| CN120316422A (en) | Online sensor data anomaly diagnosis method and system based on correlation analysis | |
| TWI647575B (en) | Fatigue deterioration diagnosis method of windmill and windmill, operation control method of windmill | |
| CN116447119A (en) | Control system for water pump anhydrous protection | |
| JPWO2015040683A1 (en) | Sensor soundness determination method and sensor soundness determination device | |
| JP4064735B2 (en) | Gas turbine monitoring device | |
| JPH02136713A (en) | Diagnostic system for plant facility | |
| JPS5857008A (en) | Diagnosis of anomaly of water feeding pump and driving turbine thereof |