JP4765005B2 - Compressed air leak diagnostic device - Google Patents
Compressed air leak diagnostic device Download PDFInfo
- Publication number
- JP4765005B2 JP4765005B2 JP2009180935A JP2009180935A JP4765005B2 JP 4765005 B2 JP4765005 B2 JP 4765005B2 JP 2009180935 A JP2009180935 A JP 2009180935A JP 2009180935 A JP2009180935 A JP 2009180935A JP 4765005 B2 JP4765005 B2 JP 4765005B2
- Authority
- JP
- Japan
- Prior art keywords
- compressed air
- leak
- location
- amount
- leakage
- Prior art date
- Legal status (The legal status is an assumption and is not a legal conclusion. Google has not performed a legal analysis and makes no representation as to the accuracy of the status listed.)
- Expired - Lifetime
Links
Images




Classifications
-
- Y—GENERAL TAGGING OF NEW TECHNOLOGICAL DEVELOPMENTS; GENERAL TAGGING OF CROSS-SECTIONAL TECHNOLOGIES SPANNING OVER SEVERAL SECTIONS OF THE IPC; TECHNICAL SUBJECTS COVERED BY FORMER USPC CROSS-REFERENCE ART COLLECTIONS [XRACs] AND DIGESTS
- Y02—TECHNOLOGIES OR APPLICATIONS FOR MITIGATION OR ADAPTATION AGAINST CLIMATE CHANGE
- Y02P—CLIMATE CHANGE MITIGATION TECHNOLOGIES IN THE PRODUCTION OR PROCESSING OF GOODS
- Y02P80/00—Climate change mitigation technologies for sector-wide applications
- Y02P80/10—Efficient use of energy, e.g. using compressed air or pressurized fluid as energy carrier
Landscapes
- Testing And Monitoring For Control Systems (AREA)
Description
本発明は、圧縮空気の供給装置、圧縮空気の配管網及び圧縮空気の消費装置をネットワークの構成機器として備えた圧縮空気プラントにおいて、圧縮空気の漏れ場所候補及びその場所における漏れ量をメタヒューリスティク最適化手法を利用して計算し出力する圧縮空気漏れ診断装置に関するものである。 The present invention relates to a compressed air plant equipped with a compressed air supply device, a compressed air piping network, and a compressed air consumption device as network components, and metaheuristics are used to identify potential leak locations of the compressed air and the amount of leak at those locations. those related to the compressed air leak diagnostic equipment for outputting calculated using an optimization method.
従来、コンプレッサ等の圧縮空気供給装置の制御方法に関し、後述する特許文献1に記載された生産ラインの圧縮空気供給制御装置及びこれを用いた生産ラインの圧縮空気供給制御システムや、特許文献2に記載された空気供給システムとその空気消費量計測方法及び空気消費量計測装置、並びに空気供給システムの制御方法等が公知となっている。
Conventionally, regarding a control method of a compressed air supply device such as a compressor, a compressed air supply control device for a production line described in
特許文献1記載の従来技術は、複数の生産ラインを有する生産工程において、休止中の生産ラインの生産装置からの空気漏れを防止し、コンプレッサの消費電力の無駄をなくして生産コストの削減、生産装置の誤作動防止を図り、作業の安全性を向上させるものである。
また、特許文献2記載の従来技術は、負荷が必要とする圧縮空気の供給を確保しながらコンプレッサを効率的に運転することにより、空気供給システムの省エネルギー化を図るものである。
しかしながら、これらの従来技術には、圧縮空気プラントにおける空気漏れの事実は指摘されているものの、配管の繋ぎ目などにおける空気漏れ自体を検出する手段や方法については何ら開示されていない。
コンプレッサ等の圧縮空気の供給装置や圧縮空気の配管網、圧縮空気の消費装置等をネットワークの構成機器として備えた圧縮空気プラントでは、配管部において空気漏れが生じてしまうことが多く、供給空気の3割程度が漏れる例もある。このような空気漏れを考慮して圧縮空気を供給すると、エネルギーの面でも大きな損失となり、エネルギー問題及び省エネという観点からは大きな問題である。
The conventional technology described in
The prior art described in
However, although these facts point out the fact of air leaks in compressed air plants, they do not disclose any means or method for detecting air leaks at pipe joints.
In a compressed air plant equipped with a compressed air supply device such as a compressor, a compressed air piping network, and a compressed air consuming device as a component device of the network, air leakage often occurs in the piping section. There is also an example where about 30% leaks. When compressed air is supplied in consideration of such air leakage, a large loss is caused in terms of energy, which is a big problem from the viewpoint of energy problems and energy saving.
そこで本発明は、このような圧縮空気プラントにおける空気漏れ場所候補とその漏れ量を検出して出力し、保守点検のために有益な情報を提供するようにした圧縮空気漏れ診断装置を提供しようとするものである。 The present invention, such air leakage location candidates in the compressed air plant and to detect the leak rate output, to provide a compressed air leak diagnostic equipment which is adapted to provide useful information for maintenance It is what.
上記課題を解決するために、請求項1に記載した圧縮空気漏れ診断装置は、圧縮空気の供給装置、圧縮空気の配管網及び圧縮空気の消費装置をネットワークの構成機器として備えた圧縮空気プラントにおける圧縮空気プラントシミュレータを用いた圧縮空気漏れ診断装置において、
前記構成機器の入出力関係をブランチとして表現する機器モデルを複数のノードにより接続し、前記ノードごとの入出力エネルギーが等しくなるように構成して前記ネットワークの入出力エネルギーを表現するネットワークモデルを備え、前記ネットワークの入出力エネルギーが与えられたときに、前記ノードごとの入出力エネルギーが等しくなる関係と前記機器モデルとに基づいて、前記ノード及び前記機器モデルにおけるある時間断面の空気流量や圧力を状態量として計算し、この状態量を前記ネットワークの状態量として出力する圧縮空気プラントシミュレータを備え、
オペレータにより入力された前記ネットワークにおける圧縮空気の漏れ場所候補を、圧縮空気の消費装置による消費として前記機器モデルにて表現して前記ネットワークモデルに組み込む機能と、
漏れ場所候補の漏れ場所数を1から予め定めた最大値まで変化させ、漏れ場所数ごとに漏れ場所候補を選択する全ての組み合わせを生成する機能と、
前記選択された漏れ場所候補の圧縮空気の漏れ量を状態変数として前記圧縮空気プラントシミュレータにより状態量を求め、前記ネットワークの入出力エネルギー及び前記ネットワークに設置された計測機器により測定された状態量を計測値とし、前記生成された漏れ場所候補を選択する全ての組み合わせについて、前記圧縮空気プラントシミュレータから出力される状態量と前記計測値とからなる所定の目的関数を用いて最適化問題を解くことにより、前記生成された漏れ場所候補を選択する全ての組み合わせにおける圧縮空気の漏れ量を計算する機能と、
前記生成された漏れ場所候補を選択する全ての組み合わせにおける各漏れ場所候補及び計算された圧縮空気の漏れ量を出力する機能と、を備えたものである。
In order to solve the above-mentioned problems, a compressed air leakage diagnosis device according to
A device model that expresses the input / output relationship of the component device as a branch is connected by a plurality of nodes, and a network model that expresses the input / output energy of the network by configuring the input / output energy of each node to be equal is provided. , When the input / output energy of the network is given, based on the relationship between the input / output energy of each node and the device model, the air flow rate and pressure of a certain time section in the node and the device model A compressed air plant simulator that calculates a state quantity and outputs the state quantity as a state quantity of the network ;
Leakage location candidates of the compressed air in the network input Ri by the operator, and expressed by the device model as consumption by consumer of the compressed air functions incorporated into the network model,
A function of changing the number of leak locations of the leak location candidates from 1 to a predetermined maximum value and generating all combinations for selecting the leak location candidates for each number of leak locations;
Using the compressed air plant simulator as a state variable, the amount of compressed air leakage of the selected leakage location candidate is obtained as a state variable, and the input / output energy of the network and the state amount measured by the measuring device installed in the network are obtained. Solving the optimization problem using a predetermined objective function consisting of the state quantity output from the compressed air plant simulator and the measured value for all combinations for selecting the generated leak location candidates as measured values The function of calculating the leak amount of compressed air in all combinations for selecting the generated leak location candidate,
A function of outputting each leak location candidate and the calculated compressed air leak amount in all combinations of selecting the generated leak location candidates.
請求項2に記載した発明は、請求項1において、圧縮空気の漏れ量を計算する機能を、遺伝的アルゴリズムまたはその改良手法を用いて実現したものである。
請求項3に記載した発明は、請求項1において、圧縮空気の漏れ量を計算する機能を、タブサーチまたはその改良手法を用いて実現したものである。
請求項4に記載した発明は、請求項1において、圧縮空気の漏れ量を計算する機能を、パーティクル スウォーム オプティマイゼーション(Particle Swarm Optimization)
またはその改良手法を用いて実現したものである。
According to a second aspect of the present invention, in the first aspect, the function of calculating the leakage amount of compressed air is realized by using a genetic algorithm or an improved technique thereof.
According to a third aspect of the present invention, in the first aspect, the function of calculating the leak amount of the compressed air is realized by using a tab search or an improved technique thereof.
The invention described in
Alternatively, it is realized by using the improved method .
本発明によれば、圧縮空気の漏れ場所及び漏れ量に関する確度の高い情報が得られるため、従来必要とされた定期的な点検を不要とし、Time-based maintenance(TBM)からCondition-based Maintenance(CBM)へ移行可能としてメンテナンスの効率化による省力化が期待できる。
また、圧縮空気の漏れ場所候補を特定できることにより、空気漏れへの迅速な対応による大事故への波及防止、省エネルギー化、資源の有効利用が可能である。
According to the present invention, highly accurate information on the location and amount of leakage of compressed air can be obtained, so that periodic inspections conventionally required are unnecessary, and from time-based maintenance (TBM) to condition-based maintenance (TBM). It is possible to shift to CBM), and labor saving can be expected by improving the efficiency of maintenance.
In addition, by identifying candidate locations for compressed air leaks, it is possible to prevent spillovers to major accidents by quickly responding to air leaks, save energy, and effectively use resources.
以下、図に沿って本発明の実施形態を説明する。
1.まず、圧縮空気の漏れ場所候補とその場所における圧縮空気の漏れ量等を入力することによってプラントの状態量を出力可能とした圧縮空気プラントシミュレータについて説明する。このプラントシミュレータは、後述する圧縮空気漏れ診断装置と協働して圧縮空気の漏れ場所候補及びその場所における圧縮空気漏れ量の計算に使用されるものである。
圧縮空気プラントシミュレータは、圧縮空気の漏れ場所候補とその場所における漏れ量とが入力された時に、圧縮空気のネットワークを構成する後述の機器モデル及びネットワークモデルの圧縮空気フローに関する方程式を解くことにより、ある時間断面におけるネットワーク全体の定常状態を計算する。
このネットワークシミュレータは、コンピュータ水理学入門(C.A. ブレビア、A.J.フェラント著、磯部雅彦訳、サイエンス社、1983年)等に管路網解析技術として記述されている。
圧縮空気のフロー方程式は、線形または非線形連立方程式として定式化され、ニュートン法等を用いることにより、ある時間断面におけるネットワークの定常状態を解として得ることができる。
(1)機器モデル
コンプレッサ等の圧縮空気の供給装置、配管網、圧縮空気の消費装置等の、圧縮空気プラントを構成する機器モデルは、ブランチとして表現され、その入力と出力との関係を、以下の数式1のような関数により表現する。
[数1]
yi=f(xi)
ここで、xi:i番目の入力状態量
yi:i番目の出力状態量
f:入力状態量と出力状態量との関係を表す関数
機器の運用ルールも、上記関数fの中で表現される。なお、入力状態量は、ブランチに対する入力エネルギーから計算可能であり、出力状態量を用いてブランチから出力される出力エネルギーを計算可能である。また、関数fは圧縮空気の配管の抵抗分を含み、これによりエネルギー損失が生じるブランチも、数式1により表現する。
(2)ネットワークモデル
ブランチである機器モデルを多数ノードにより接続したものがネットワークモデルとなる。各ノードにおいては、入力エネルギーと出力エネルギーとがバランスしている以下の関数によって表現することができる。
Hereinafter, embodiments of the present invention will be described with reference to the drawings.
1. First, a compressed air plant simulator capable of outputting a state quantity of a plant by inputting a compressed air leakage place candidate and a compressed air leakage amount at the place will be described. This plant simulator is used for calculating a compressed air leakage location candidate and a compressed air leakage amount at the location in cooperation with a compressed air leakage diagnosis device described later.
The compressed air plant simulator solves an equation relating to a compressed air flow of a device model and a network model, which will be described later, constituting a network of compressed air when a candidate compressed air leak location and a leak amount at that location are input, Calculate the steady state of the entire network in a time section.
This network simulator is described as a pipeline network analysis technique in the introduction to computer hydraulics (CA Brevia, written by AJ Ferrant, translated by Masahiko Isobe, Science, 1983).
The flow equation of compressed air is formulated as a linear or nonlinear simultaneous equation, and the steady state of the network in a certain time section can be obtained as a solution by using the Newton method or the like.
(1) Equipment model Equipment models that make up a compressed air plant, such as compressed air supply devices such as compressors, piping networks, and compressed air consumption devices, are expressed as branches. This is expressed by a function as shown in
[Equation 1]
y i = f (x i )
Where x i : i-th input state quantity
y i : i-th output state quantity
f: Function representing the relationship between the input state quantity and the output state quantity The operation rule of the device is also represented in the function f. The input state quantity can be calculated from the input energy for the branch, and the output energy output from the branch can be calculated using the output state quantity. Further, the function f includes a resistance component of the compressed air pipe, and a branch in which energy loss is caused by this is also expressed by
(2) Network model A network model is a device model which is a branch connected by a large number of nodes. Each node can be expressed by the following function in which input energy and output energy are balanced.

このようなノードにより、ネットワークに対するエネルギー供給源としての圧縮空気の供給装置(例えば、コンプレッサ等)や圧縮空気の配管網、及び圧縮空気の消費機器における分岐点等が表現可能である。
なお、このようなネットワークモデルは、基本的には、電気工学におけるキルヒホッフの第1、第2法則の概念により表現が可能である。例えば、圧縮空気の場合、ノードへの流入圧縮空気量と、ノードからの流出圧縮空気量と、ノードにおける消費圧縮空気量との和は等しいということが利用可能である。
(3)圧縮空気の漏れ場所候補とその場所における漏れ量
圧縮空気の漏れは、圧縮空気プラントシミュレータにおける圧縮空気の消費機器と同様に考えられるため、仮想的な圧縮空気消費機器によってもたらされるものと考える。また、圧縮空気の漏れ場所候補については、配管の繋ぎ目のように、事前に本発明の診断装置に入力情報としてオペレータが入力するものとする。その場所の漏れ量については、以下のような最適化の定式化の中で、システムからの出力の一つとして計算される。
(4)圧縮空気プラントシミュレータ
ネットワークのシミュレーションは、前述の数式1,2からなる非線形連立方程式に対し、ネットワークに対する入力エネルギー及び出力エネルギーを指定して方程式を解くことによって得られる。
Such a node can express a compressed air supply device (for example, a compressor or the like) as an energy supply source for a network, a compressed air piping network, and a branch point in a compressed air consuming device.
Such a network model can be basically expressed by the concept of Kirchhoff's first and second laws in electrical engineering. For example, in the case of compressed air, the sum of the amount of compressed air flowing into the node, the amount of compressed air flowing out from the node, and the amount of compressed air consumed at the node can be used.
(3) Compressed Air Leakage Location Candidate and Leakage Amount Compressed Air Leakage is considered to be caused by a virtual compressed air consuming device because it can be thought of as a compressed air consuming device in a compressed air plant simulator Think. In addition, the compressed air leak location candidate is input by the operator as input information to the diagnostic device of the present invention in advance, as in a pipe joint. The amount of leakage at that location is calculated as one of the outputs from the system in the following optimization formulation.
(4) Compressed air plant simulator The network simulation is obtained by solving the equations by specifying the input energy and the output energy for the network with respect to the nonlinear simultaneous equations consisting of the above-described
プラントシミュレータは、機器モデルやネットワークモデルを含むネットワーク内の圧縮空気フローに関する方程式を内部に有し、ネットワークへの入力エネルギー及び出力エネルギーを指定することにより、ある時間断面におけるネットワークの各部の空気流量や圧力等の状態量を計算して出力する。
2.次に、圧縮空気漏れ診断装置を用いた圧縮空気漏れ診断方法について説明する。
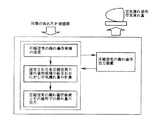
図1は、圧縮空気漏れ診断装置が有する機能の概要を示しており、圧縮空気の漏れ場所候補を指定する機能A1と、指定された漏れ場所候補の組合せに対して各漏れ場所の空気漏れ量を計算する機能A2と、最終的に圧縮空気の漏れ場所候補とその場所における漏れ量を決定して出力する機能A3とを有している。
以下、各機能について述べる。
(1)圧縮空気の漏れ場所候補の指定(A1)
圧縮空気の漏れ場所数は、確率的には少ない場合が高いと推定される。従って、入力された圧縮空気の漏れ場所候補の中から、以下のアルゴリズムにより圧縮空気の漏れ場所候補を所定数、指定する。ここで、漏れ場所数の最大指定数(nmax)は事前に決定する。・Step.1:n(漏れ場所数)=0とする。
・Step.2:n=n+1とする。
・Step.3:漏れ場所候補の中からn個を選び出す組合せを全て生成する。生成された組合せを全て格納する。
・Step.4:n=nmaxならばStep.5へ移り、そうでないならばStep.2へ戻る。
・Step.5:格納した漏れ場所の組合せを、次の機能A2へ出力する。
(2)指定された漏れ場所候補の組合せに対する空気漏れ量の計算(A2)
上記機能A1で指定された圧縮空気の各漏れ場所候補に対して、各場所における空気漏れ量は、以下のような最適化問題を解いて計算する。
(a)状態変数
状態変数としては、以下を考える。
・圧縮空気の漏れ場所候補における圧縮空気漏れ量
(b)計測値(計測変数)
以下の値が計測(測定)でき、本発明の診断装置に入力可能と仮定する。
・ネットワークの入力エネルギー:コンプレッサ等の圧縮空気供給装置への燃料入力、電気入力、または蒸気入力(連続値)
・ネットワークの出力エネルギー:圧縮空気消費機器の空気消費量
・ネットワークにおける限定されたノード及びブランチの状態量:ネットワークにおいて、計測機器が設置してあるノードの圧力値及びブランチの圧縮空気流量
(c)最適化問題としての定式化
以下に定式化を示す。以下に示す目的関数は、計測値と計測点における計算値のノルムの最小化とする。
The plant simulator internally contains equations related to compressed air flow in the network including equipment models and network models, and by specifying the input energy and output energy to the network, the air flow rate of each part of the network in a certain time section Calculates and outputs state quantities such as pressure.
2. Next, a compressed air leakage diagnosis method using the compressed air leakage diagnosis apparatus will be described.
FIG. 1 shows an overview of the functions of the compressed air leakage diagnosis apparatus. The amount of air leakage at each leakage location with respect to a combination of a function A1 for specifying a compressed air leakage location candidate and the specified leakage location candidate. And a function A3 that finally determines and outputs a compressed air leak location candidate and a leak amount at that location.
Each function will be described below.
(1) Designation of compressed air leak location candidates (A1)
The number of places where compressed air leaks is estimated to be high in terms of probability. Therefore, a predetermined number of compressed air leak location candidates are designated from the input compressed air leak location candidates by the following algorithm. Here, the maximum designated number (n max ) of the number of leak locations is determined in advance.・ Step.1: Set n (number of leaked locations) to 0.
Step.2: n = n + 1.
-Step.3: Generate all combinations that select n from the leak location candidates. Store all generated combinations.
Step 4: If n = n max , go to
Step.5: Output the stored combination of leak locations to the next function A2.
(2) Calculation of the amount of air leakage for the specified combination of leakage location candidates (A2)
For each compressed air leakage location candidate designated by the function A1, the air leakage amount at each location is calculated by solving the following optimization problem.
(a) State variables The following are considered as state variables.
・ Compressed air leakage amount at candidate locations for compressed air leakage
(b) Measurement value (measurement variable)
It is assumed that the following values can be measured (measured) and can be input to the diagnostic apparatus of the present invention.
・ Network input energy: Fuel input, electric input, or steam input (continuous value) to compressed air supply equipment such as compressors
-Network output energy: Air consumption of compressed air consuming equipment-State quantities of limited nodes and branches in the network: Pressure values of nodes in the network where measurement equipment is installed and compressed air flow rates of branches
(c) Formulation as an optimization problem Formulation is shown below. The objective function shown below is to minimize the norm of the measured value and the calculated value at the measurement point.
[数4]
0≦xj≦xj,max
なお、数式3,4において、
NumMea:計測値点数
x:状態変数(指定された漏れ場所の圧縮空気漏れ量)
wmi:i番目の計測変数の重み係数
zi:i番目の計測変数の計測値
hi:i番目の計測変数の状態方程式(プラントシミュレータにより計算)
p:ノルムの次数
xj,max:j番目の状態変数の最大値
である。
本機能A2では、指定された空気漏れ場所候補の組合せに対し、上記の最適化により求められた各空気漏れ場所の漏れ量と目的関数値とを格納する。それぞれの組合せに対し、格納するデータは以下のとおりとする。
・指定された空気漏れ場所候補
・各空気漏れ場所候補の漏れ量(最適化の結果得られた状態変数の値)
・最適化の結果得られた目的関数値
ここで、数式3における重み係数wmiの決定方法について述べる。
[Equation 4]
0 ≦ x j ≦ x j, max
In
NumMea: Number of measured values
x: State variable (amount of compressed air leak at the specified leak location)
w mi : weighting factor of the i-th measurement variable
z i : Measurement value of the i-th measurement variable
h i : State equation of i-th measurement variable (calculated by plant simulator)
p: the order of the norm
x j, max is the maximum value of the jth state variable.
In this function A2, the leakage amount and the objective function value of each air leak location obtained by the above optimization are stored for the specified combination of air leak location candidates. The data stored for each combination is as follows.
・ Specified air leak location candidates ・ Leakage amount of each air leak location candidate (value of state variable obtained as a result of optimization)
Objective function value obtained as a result of optimization Here, a method for determining the weighting factor w mi in Equation 3 will be described.
wmiは、計測変数の確からしさに対する各計測変数の相対的な重みを表現している。この重みは、以下の2つの項目により評価可能である。
・計測センサの精度(SensorPRE)
・計測センサの故障率(SensorFAU)
ここで、計測センサの精度は、±5%等の%誤差範囲で表現される。また、故障率は、年間の故障回数(故障回数/年)で表現される。この値を用いて、各計測変数に対する重み係数wmiは、以下の数式5のように決定する。
[数5]
wmi=fw(SensorPREi,SensorFAUi), i=1,……,NumMea
SensorPREi:i番目の計測変数に対する計測センサの精度
SensorFAUi:i番目の計測変数に対する計測センサの故障率
例えば、重み係数wmiは以下のような式で表現可能である。
w mi represents the relative weight of each measurement variable with respect to the probability of the measurement variable. This weight can be evaluated by the following two items.
Measurement sensor accuracy (Sensor PRE )
・ Measurement sensor failure rate (Sensor FAU )
Here, the accuracy of the measurement sensor is expressed in a% error range such as ± 5%. The failure rate is expressed by the number of failures per year (the number of failures / year). Using this value, the weighting factor w mi for each measurement variable is determined as in
[Equation 5]
w mi = f w (Sensor PREi , Sensor FAUi ), i = 1, ..., NumMea
Sensor PREi : Measurement sensor accuracy for the i-th measurement variable
Sensor FAUi : Failure rate of the measurement sensor with respect to the i-th measurement variable For example, the weight coefficient w mi can be expressed by the following equation.
ここで、
a:計測変数に対応するセンサ精度に対する重み
b:計測変数に対応するセンサ故障率に対する重み
であり、これらのa,bの値は事前に指定することとする。
(3)最終的な圧縮空気の漏れ場所候補とその場所での漏れ量を決定し出力する機能(A3)
本機能では、(2)の機能A2で得られた各組み合わせに対する格納データを用いて、以下のように最終的な圧縮空気の漏れ場所候補とその場所における漏れ量を決定する。
・Step.1:各組合せの目的関数値を用いて、各漏れ場所数について、目的関数値の小さいものから各組合せを順に並べ替える。
・Step.2:この並べ替えた結果の目的関数値の小さいものから順に、可能性の高い候補として以下を出力する。
・漏れ場所数
・候補の順位
・指定された空気漏れ場所候補
・指定された各空気漏れ場所候補の漏れ量
上記ステップにより、漏れ場所が1ヶ所の場合の可能性が高い候補順、2ヶ所の場合の可能性が高い候補順というように、順番に圧縮空気の漏れ場所候補とその場所での漏れ量を決定する。
here,
a: Weight for sensor accuracy corresponding to measurement variable b: Weight for sensor failure rate corresponding to measurement variable, and the values of a and b are designated in advance.
(3) Function for determining and outputting the final compressed air leak location candidate and the leak amount at that location (A3)
In this function, using the stored data for each combination obtained in the function A2 of (2), the final compressed air leak location candidate and the leak amount at that location are determined as follows.
-Step.1: Using each objective function value of each combination, rearrange each combination in order from the smallest objective function value for each number of leak locations.
Step.2: Output the following as the most likely candidates in order from the sorted objective function values in ascending order.
・ Number of leaking locations ・ Candidate ranking ・ Designated air leak location candidates ・ Leakage amount of each designated air leak location candidate According to the above steps, in the order of candidates that are most likely to be in the case of one leak location, As in the order of candidates with the highest possibility, the candidate for the leak location of compressed air and the leak amount at that location are determined in order.
なお、最適化問題の定式化に当たって用いる状態変数としては、各漏れ場所候補が実際に漏れているか否かを特定する変数と、漏れている場合のその場所における漏れ量とを用いることもできる。すなわち、この場合の状態変数は以下のようになる。
・圧縮空気の漏れ場所候補が実際に漏れている場所であるか否かを示す2値量(漏れている場所である場合を1、漏れている場所でない場合を0とする)
・漏れ場所候補における圧縮空気漏れ量(連続量)
この場合、定式化に用いる目的関数は、以下の項目を考慮する。
・漏れ場所が存在する確率の最小化
・各計測点における計測値と計測点における計算値のノルムの最小化
従って、目的関数は以下の数式7のように記述できる。
[数7]
minf1(Pi,xi,yj)
ここで、Pi:i番目の漏れ場所候補で実際に空気漏れが発生する確率
xi:状態変数(i番目の場所が漏れ場所か否かの2値量)
yj:状態変数(漏れ場所と指定されたj番目の場所の圧縮空気漏れ量)
具体的には、例えば数式8、数式9のような目的関数を設定できる。
In addition, as a state variable used in formulating the optimization problem, a variable that specifies whether or not each leakage location candidate is actually leaking and a leakage amount at that location when there is a leakage can also be used. That is, the state variables in this case are as follows.
Binary amount indicating whether or not a candidate for a leaked location of compressed air is a location where leakage is actually occurring (1 if the location is leaking, 0 if it is not a location where leaking)
-Compressed air leakage amount (continuous amount) at potential leak locations
In this case, the objective function used for formulation considers the following items.
-Minimizing the probability that a leak location exists-Minimizing the norm of the measured value at each measurement point and the calculated value at each measurement point Therefore, the objective function can be described as in Equation 7 below.
[Equation 7]
minf 1 (P i , x i , y j )
Here, P i : Probability that air leakage actually occurs at the i-th leakage location candidate
x i : State variable (binary amount of whether or not the i-th place is a leaking place)
y j : State variable (the amount of compressed air leakage at the jth location designated as the leak location)
Specifically, for example, objective functions such as Expression 8 and Expression 9 can be set.
[数9]
0≦yj≦yj,max
数式8,9において、
NumLea1:漏れていると指定された漏れ場所候補の数
NumLea2:漏れていないと指定された漏れ場所候補の数
w1:目的関数の各項に対する重み
yj,max:j番目の場所の漏れ量の最大値
である。
なお、重み係数wmiの決定方法は前記同様である。
数式8におけるh(x,y)は圧縮空気プラントシミュレータによって計算される。プラントシミュレータでは、状態変数のうち、圧縮空気の漏れ場所候補に対する2値数が1、つまり漏れていると指定された場所については、連続量の状態変数であるその場所での圧縮空気漏れ量を仮想的な負荷として、プラントの計算を実行する。
なお、圧縮空気の漏れ場所候補に対する2値数が0、つまり漏れていないと指定された場所については、その場所での負荷量が0として計算する。
[Equation 9]
0 ≦ y j ≦ y j, max
In Equations 8 and 9,
NumLea1: Number of potential leak locations designated as leaking
NumLea2: Number of potential leak locations designated as not leaking
w 1 : Weight for each term of the objective function
y j, max : The maximum value of the leakage amount at the j-th place.
The method for determining the weight coefficient w mi is the same as described above.
H (x, y) in Equation 8 is calculated by a compressed air plant simulator. In the plant simulator, the binary number for the compressed air leakage location candidate among the state variables is 1, that is, for the location designated as leaking, the compressed air leakage amount at that location, which is a continuous amount of state variable, is set. The plant calculation is executed as a virtual load.
It should be noted that the calculation is performed assuming that the binary number for the compressed air leak location candidate is 0, that is, the location designated as not leaking, with the load amount at that location being 0.
この場合、格納するデータは前記同様に以下のとおりとする。
・指定された空気漏れ場所候補
・各漏れ場所候補の漏れ量(最適化の結果得られた状態変数の値)
・最適化の結果得られた目的関数値
なお、図2は、上記最適化手法を用いて圧縮空気の漏れ場所及び漏れ量を特定する処理の概要を示すフローチャートである。
図示するように、初期解から徐々に解を変更して最適解へ至るような最適化手法を用いており、最良解が得られた度にその最良解を格納し、得られた最良解の集合を目的関数値が小さい順にソートし、最終的に出力する。
上述の方法により、以下の出力項目が決定される。
・候補の順位
・漏れ場所数
・漏れ場所
・各漏れ場所の漏れ量
上記ステップにより、目的関数が小さい、つまり、可能性が高く、かつ特定された場所で空気が漏れていると仮定すると、全ての計測値のつじつまが合うような場所とその漏れ量のうち、可能性が高い候補から順に出力されることになる。
3.次に、遺伝的アルゴリズムまたはその改良手法を用いた圧縮空気漏れ診断装置について述べる。
In this case, the data to be stored is as follows as described above.
・ Specified air leak location candidates ・ Leak amount of each leak location candidate (value of state variable obtained as a result of optimization)
-Objective function value obtained as a result of optimization FIG. 2 is a flowchart showing an outline of a process for specifying the location and amount of leakage of compressed air using the optimization method.
As shown in the figure, we use an optimization method that gradually changes the solution from the initial solution to the optimal solution, and stores the best solution every time the best solution is obtained. Sort the set in ascending order of objective function values and finally output.
The following output items are determined by the above-described method.
・ Candidate ranking ・ Leakage location ・ Leakage location ・ Leakage amount of each leakage location Assuming that the objective function is small, that is, the possibility is high and air is leaking at the specified location by the above steps, all Among the locations where the measured values match, and the leakage amount, the candidates are output in order from the most likely candidates.
3. Next, a compressed air leakage diagnosis apparatus using a genetic algorithm or an improved method thereof will be described.
本実施形態では、最適化手法に遺伝的アルゴリズムまたはその改良手法を用いて解を求める。本提案において、遺伝的アルゴリズム或いはその改良手法とは、D. E. Goldberg、Genetic Algorithms in Search、 Optimization、 and Machine Learning、 Addison-Wesley、 1989の中で述べられているSimple Genetic Algorithm(以下、SGA)とその改良手法のことを指す。ここでは、前述した最適化をSGAにより実現する方法について述べる。
なお、数式8に示した目的関数を用いる場合は、離散量と連続量を扱っており、更に目的関数が非線形となることから、混合整数非線形最適化問題(Mixed-integer Nonlinear Optimization Problem (MINLP))となる。本実施形態では、このMINLP問題の解決方法も提案する。
(1)状態変数と遺伝子表現
状態変数としては、以下を考える。
・圧縮空気の漏れ場所候補(数式8の目的関数を用いる場合)
前述の如く、各漏れ場所候補について、空気漏れが発生しているか否かにより1または0の2値量で表現する。
・漏れ場所の漏れ量(数式3,数式8の目的関数を用いる場合)
この漏れ量は、0から数式4または9で事前に設定される漏れ量最大値までの値をとるが、この値を事前に設定する離散化のルールにより離散化する。この離散化のルールは、例えば、0から漏れ量最大値までを一定の値ΔxまたはΔyで離散するというようなルールである。このような離散化ルールによって得られる離散化された圧縮空気漏れ量を、以下のような方法により2進法または10進法で表現する。
(a)2進法による表現
0から漏れ量最大値までを一定値ΔxまたはΔyで離散化された数値に対し、小さい順番に番号着けを行い、この番号を2進法で表現する。以下の遺伝子操作上は、この番号を表現する2進数を利用し、目的関数値の評価等、圧縮空気漏れ量そのものが必要な場合は、2進数の番号に対応する圧縮空気漏れ量(実際には対応表を作成し、これを利用して求める)を利用して計算を行う。
(b)10進法による表現
0から漏れ量最大値までを一定値ΔxまたはΔyで離散化された数値に対し、小さい順番に番号着けを行い、この番号を10進法で表現する。以下の遺伝子操作上は、この番号を表現する10進数を利用し、目的関数値の評価等、圧縮空気漏れ量そのものが必要な場合は、10進数の番号に対応する圧縮空気漏れ量(実際には対応表を作成し、これを利用して求める)を利用して計算を行う。
In this embodiment, a solution is obtained by using a genetic algorithm or an improved method thereof as an optimization method. In this proposal, the genetic algorithm or its improved method is the Simple Genetic Algorithm (SGA) described in DE Goldberg, Genetic Algorithms in Search, Optimization, and Machine Learning, Addison-Wesley, 1989 and its It refers to an improved method. Here, a method for realizing the above-described optimization by SGA will be described.
When the objective function shown in Equation 8 is used, discrete quantities and continuous quantities are handled, and the objective function becomes nonlinear. Therefore, a mixed-integer nonlinear optimization problem (MINLP) ). In the present embodiment, a solution for this MINLP problem is also proposed.
(1) State variables and gene expression The following are considered as state variables.
-Compressed air leak location candidate (when using the objective function of Equation 8)
As described above, each leakage place candidate is expressed by a binary amount of 1 or 0 depending on whether or not air leakage has occurred.
・ Leakage amount at the leak location (when using the objective function of Formula 3 and Formula 8)
This leakage amount takes a value from 0 to the maximum leakage amount set in advance in
(a) Representation in binary system Numbering is performed on numerical values discretized from 0 to the maximum leakage amount with a constant value Δx or Δy in ascending order, and this number is represented in binary. In the following genetic operations, when a binary number representing this number is used and the compressed air leakage amount itself is required, such as evaluation of an objective function value, the compressed air leakage amount corresponding to the binary number (actually Create a correspondence table and use this to calculate).
(b) Expression in decimal system Numbering is performed on numerical values discretized from 0 to the maximum leakage amount with a constant value Δx or Δy in ascending order, and this number is expressed in decimal system. In the following genetic operations, a decimal number representing this number is used, and when the compressed air leakage amount itself is required, such as evaluation of an objective function value, the compressed air leakage amount corresponding to the decimal number (actually Create a correspondence table and use this to calculate).
そして、指定された漏れ場所候補数だけの上記の2進数または10進数を持つ遺伝子を対象遺伝子とする。
図3は、漏れ場所候補及び各候補における漏れ量(10進法により表現)を遺伝子により表現した例を示す。
(2)計測値
以下の値が計測(測定)でき、本実施形態の診断装置に入力可能と仮定する。
・ネットワークの入力エネルギー
コンプレッサ等の圧縮空気供給装置への燃料入力、電気入力、または蒸気入力(連続値)
・ネットワークの出力エネルギー
圧縮空気消費機器の空気消費量
・ネットワークにおける限定されたノード及びブランチの状態量
ネットワークにおいて、計測機器が設置してあるノードの圧力値、及び、ブランチの圧縮空気流量
(3)アルゴリズム
以下に、SGAを利用した場合のアルゴリズムを示す。
Step.1:前提条件と初期条件設定
・各計測値を入力する。
・状態変数(圧縮空気漏れ量)の上限値を設定
0から上限値の間で、状態変数を2進法または10進法に変換する表を作成する。
・ストリング数、交差確率、突然変異確率、最大世代数を設定する。
Step.2:初期値の生成
・各ストリングの遺伝子座について、2進数の場合は0または1、10進数の場合は上限及び下限の間の範囲の可能な整数値の中からランダムに2進数または10進数値を生成する。
・現在の世代数を1とする。
・評価値の最良値(Obj*)を無限大とする。
Step.3:各ストリングの評価と選択
・各ストリングの遺伝子座の2進数または10進数と対応表を用いて圧縮空気漏れ量(及び漏れ場所)を決定する。
・ネットワークモデルに圧縮空気漏れ量(及び漏れ場所)を入力し、各計測点における計測値に対する計算値を求め、この値を用いて数式3または数式8により評価値を計算する。
・上記の評価値の逆数をFitness関数値として、ルーレット・ホイール・セレクションによりストリングの選択を行う。
・選択されたストリングの評価値のうち、最小値が現在のObj*より小さかったら、その評価値をObj*としてその値を格納する。また、その時の状態変数の値をX*として格納する。
Step.4:ストリング操作
・ストリング集合に対して、交差確率、突然変異確率を用いて、交差及び突然変異を実行する。
Step.5:終了判定
・世代が事前に決定した値に達したら、格納したすべてのObj*,X*についてのObj*の値が小さい順にソートし、すべてのObj*,X*を出力する。
・世代が事前に決定した値に達しない場合には、世代数を1足して、Step.3へ戻る。
4.次に、タブサーチまたはその改良手法を用いた圧縮空気漏れ診断装置について述べる。
Then, the gene having the above binary number or decimal number corresponding to the designated number of leak location candidates is set as a target gene.
FIG. 3 shows an example in which leak location candidates and the leak amount (expressed in decimal notation) in each candidate are expressed by genes.
(2) Measured value It is assumed that the following values can be measured (measured) and can be input to the diagnostic apparatus of this embodiment.
・ Network input energy Fuel input, electric input, or steam input (continuous value) to compressed air supply equipment such as compressors
-Network output energy-Air consumption of compressed air consuming equipment-State quantities of limited nodes and branches in the network-Pressure values of nodes where measuring devices are installed in the network, and compressed air flow rates of branches
(3) Algorithm The algorithm when using SGA is shown below.
Step.1: Set preconditions and initial conditions ・ Enter each measurement value.
-Set the upper limit value of the state variable (compressed air leakage) Create a table that converts the state variable to binary or decimal between 0 and the upper limit.
・ Set the number of strings, the probability of crossing, the probability of mutation, and the maximum number of generations.
Step.2 : Generation of initial values ・ Regarding the locus of each string, 0 or 1 for binary numbers, or binary numbers randomly from possible integer values in the range between upper and lower limits for decimal numbers Generate a decimal value.
・ The current generation number is 1.
・ The best evaluation value (Obj * ) is set to infinity.
Step.3: Evaluation and selection of each string ・ Determine the amount of compressed air leak (and leak location) using the binary or decimal number of the locus of each string and the correspondence table.
A compressed air leak amount (and leak location) is input to the network model, a calculated value for a measured value at each measurement point is obtained, and an evaluation value is calculated using Equation 3 or Equation 8 using this value.
-Select the string by roulette wheel selection using the reciprocal of the above evaluation value as the fitness function value.
If the minimum value of the evaluation values of the selected string is smaller than the current Obj * , the evaluation value is stored as Obj * . The value of the state variable at that time is stored as X * .
Step.4: Perform crossover and mutation on string operations / string sets using crossing probability and mutation probability.
Step.5: When the end judgment / generation reaches a predetermined value, all the stored Obj * and X * are sorted in ascending order of the Obj * value, and all Obj * and X * are output.
・ If the generation does not reach the predetermined value, add the number of generations and go back to Step 3.
4). Next, a compressed air leakage diagnosis apparatus using a tab search or an improved technique thereof will be described.
ここでは、前述した最適化手法にタブサーチまたはその改良手法を用いて解を求める。ここで、タブサーチ或いはその改良手法とはF. Glover、 "Tabu Search Part I"、 ORSA Journal of Computing、 Vol. 1、 NO. 3、 Summer 1989で述べられているタブーサーチ(以下、TS)とその改良手法のことを指す。ここでは、前述した最適化をTSにより実現する方法について述べる。
(1)状態変数の表現方法
状態変数としては、以下を考える。
・圧縮空気の漏れ場所候補(数式8の目的関数を用いる場合)
前述の如く、各漏れ場所候補について、空気漏れが発生しているか否かにより1または0の2値量で表現する。
・漏れ場所の漏れ量(数式3,数式8の目的関数を用いる場合)
この漏れ量は、0から数式4または9で事前に設定される漏れ量最大値までの値をとるが、この値を事前に設定する離散化のルールにより離散化する。この離散化のルールは、例えば、0から漏れ量最大値までを一定の値ΔxまたはΔyで離散するというようなルールである。このような離散化ルールによって得られる離散化された圧縮空気漏れ量を、以下のような方法により10進法で表現する。
Here, the solution is obtained by using the tab search or its improved method as the optimization method described above. Here, tab search or its improved method is tabu search (hereinafter referred to as TS) described in F. Glover, "Tabu Search Part I", ORSA Journal of Computing, Vol. 1, NO. 3, Summer 1989. It refers to the improved method. Here, a method for realizing the above-described optimization with TS will be described.
(1) State variable expression method The following are considered as state variables.
-Compressed air leak location candidate (when using the objective function of Equation 8)
As described above, each leakage place candidate is expressed by a binary amount of 1 or 0 depending on whether or not air leakage has occurred.
・ Leakage amount at the leak location (when using the objective function of Formula 3 and Formula 8)
This leakage amount takes a value from 0 to the maximum leakage amount set in advance in
0から漏れ量最大値までを一定値ΔxまたはΔyで離散化された数値に対し、小さい順番に番号着けを行い、この番号を10進法で表現する。以下のタブサーチ上の状態推移上は、この番号を表現する10進数を利用し、目的関数値の評価等、圧縮空気漏れ量そのものが必要な場合は、10進数の番号に対応する圧縮空気漏れ量(実際には対応表を作成し、これを利用して求める)を利用して計算を行う。
これにより、漏れ場所の候補数だけの10進数(及び2進数)を持つ配列を利用して状態変数は表現される。
(2)計測値
前記SGAにおいて説明したものと同様の計測値を、本実施形態の診断装置に入力可能と仮定する。
(3)アルゴリズム
以下に、TSを利用した場合のアルゴリズムを示す。
Step.1:前提条件と初期条件設定
・各計測値を入力する。
・状態変数(圧縮空気漏れ量)の上限値を設定
0から上限値の間で、状態変数を10進法に変換する対応表を作成する。
・タブー長及び最大探索回数を設定する。
Step.2:初期値の生成
・配列の各要素について、2進数の場合は0または1、10進数の場合は上限及び下限の間の範囲の可能な整数値の中からランダムに2進数または10進数値を生成し、これを現在状態とする。
・現在の探索回数を1とする。
・評価値の最良値(Obj*)を無限大とする。
Step.3:隣接状態の生成と次状態の決定
・各漏れ場所候補の漏れ量を示す状態変数については、現在状態の各配列インデックスに対して10進法の±1の値(上下限値の場合は、限界値を超える方向には値を生成しない)を隣接状態とする。
Numbering is performed on numerical values discretized from 0 to the maximum leakage amount with a constant value Δx or Δy in ascending order, and this number is expressed in decimal. In the following tab search state transition, a decimal number representing this number is used, and if the compressed air leakage amount itself is required, such as evaluation of an objective function value, the compressed air leakage corresponding to the decimal number Calculation is performed using the quantity (actually a correspondence table is created and obtained using this).
As a result, the state variable is expressed using an array having decimal numbers (and binary numbers) as many as the number of candidate leak locations.
(2) Measurement Value It is assumed that the same measurement value as that described in the SGA can be input to the diagnostic apparatus of this embodiment.
(3) Algorithm The algorithm when TS is used is shown below.
Step.1: Set preconditions and initial conditions ・ Enter each measurement value.
・ Set the upper limit value of the state variable (compressed air leak amount) Create a correspondence table that converts the state variable to the decimal system between 0 and the upper limit value.
・ Set tabu length and maximum number of searches.
Step.2 : Initial value generation ・ Each element of the array is a binary number or 10 at random from the possible integer values in the range between the upper and lower limits for
・ The current search count is 1.
・ The best evaluation value (Obj *) is set to infinity.
Step.3 : Neighboring state generation and next state determination ・ For state variables indicating the leakage amount of each leakage location candidate, a
例えば、3つ漏れ場所が指定され、現在状態が(2,3,4)であった場合、第1要素の2の±1、第2要素3の±1、第3要素4の±1をそれぞれ個別に生成し、隣接状態を生成するため、隣接状態は以下の6つとなる。
(1,3,4),(3,3,4),(2,2,4),(2,4,4),(2,3,3),(2,3,5)
そして、各隣接状態に対し、配列の値の10進数を対応表を用いて各場所の圧縮空気漏れ量に変換する。
また、各漏れ場所候補が漏れているか否かを示す1,0の2値量に関しては、各配列インデックスに対して数値を反転した値を隣接状態とする。例えば、3つの漏れ場所候補に対し現在状態が(1,0,0)であった場合、隣接状態は(0,0,0),(1,1,0),(1,0,1)となる。
・ネットワークモデルに圧縮空気漏れ量(及び漏れ場所)を入力し、各計測点における計測値に対する計算値を求め、この値を用いて数式3または数式8により評価値を計算する。
・各隣接状態の中でタブーでない最も評価が良いもの(評価値が小さい)を次状態とする。次状態の評価値が現在のObj*より小さかったら、その評価値をObj*として格納する。また、その時の状態変数の値をX*として格納する。
・現在の値を次状態とする。
Step.4:終了判定
・探索回数が事前に設定した最大探索回数に達したら、格納した全てのObj*,X*についてObj*の小さい順にソートし、全てのObj*,X*を出力する。
For example, if three leak locations are specified and the current state is (2, 3, 4), then ± 1 of the
(1, 3, 4), (3, 3, 4), (2, 2, 4), (2, 4, 4), (2, 3, 3), (2, 3, 5)
Then, for each adjacent state, the decimal value of the array value is converted into a compressed air leakage amount at each location using the correspondence table.
In addition, regarding the binary amount of 1, 0 indicating whether or not each leakage place candidate is leaking, a value obtained by inverting the numerical value with respect to each array index is set as an adjacent state. For example, if the current state is (1, 0, 0) for three leak location candidates, the adjacent states are (0, 0, 0), (1, 1, 0), (1, 0, 1). It becomes.
A compressed air leak amount (and leak location) is input to the network model, a calculated value for a measured value at each measurement point is obtained, and an evaluation value is calculated using Equation 3 or Equation 8 using this value.
-Among the adjacent states, the one with the best evaluation (small evaluation value) that is not taboo is set as the next state. If the evaluation value of the next state is smaller than the current Obj *, the evaluation value is stored as Obj * . The value of the state variable at that time is stored as X * .
・ The current value is the next state.
Step.4: Once you reached the maximum number of searches that end determination and number of times of search has been set in advance, all of Obj stored *, sorted in ascending order of the Obj * for X *, all of the Obj *, and outputs the X *.
探索回数が事前に設定した最大探索回数に達しない場合には、現在の探索回数に1を足してStep.3へ戻る。
5.次に、Particle Swarm Optimizationまたはその改良手法を用いた圧縮空気漏れ診断
装置について述べる。
ここで、Particle Swarm Optimization(以下、PSO)或いはその改良手法とは、J. Kennedy and R. Eberhart、 Swarm Intelligence、 Morgan Kaufmann Publishers、 2001で解説されているように、Eberhart氏らにより開発された群れ理論を基にしたParticle Swarm OptimizationのGbestモデル、Lbestモデル、または、Angeline氏により開発されたHybrid Particle Swarm Optimization等のParticle Swarm Optimizationの様々なバリエーションを含む手法を指す。以下、例として前述した最適化をgbestモデル及びHybrid PSOにより実現する方法について述べる。
(1)gbestモデル
例えば、魚の群れや鳥の群れ等の自然界の生物の群れの動きは、簡単なルールで記述できることがわかってきている。つまり、個体(エージェント)の動きは簡単なルールで記述しても、群れの動きは複雑にすることができる。Reynoldsが開発したboid(Reynolds、 C.W. ,"Flocks, Herds, and Schools: A Distributed Behavioral Model, in Computer Graphics", Proceedings of SIGGRAPH '87, pp. 25-34, 1987.)は以下の3つの簡単なルールのみを利用している。
・隣接するエージェントから離れようとする方向へ進む。
・群れ全体の向かっている方向に進む。
・群れの中心に向かって進む。
つまり、群れの中の個々のエージェントの動きは、簡単なベクトルの合成で考えることができる。
If the number of searches does not reach the preset maximum number of searches, 1 is added to the current number of searches, and the process returns to Step 3.
5. Next, a compressed air leak diagnosis apparatus using Particle Swarm Optimization or its improved technique will be described.
Here, Particle Swarm Optimization (hereinafter referred to as PSO) or its improvement method is a group developed by Eberhart and others as described in J. Kennedy and R. Eberhart, Swarm Intelligence, Morgan Kaufmann Publishers, 2001. It refers to a method that includes various variations of Particle Swarm Optimization such as Gparticle model of Particle Swarm Optimization based on theory, Lbest model, or Hybrid Particle Swarm Optimization developed by Angeline. Hereinafter, as an example, a method for realizing the above-described optimization using the gbest model and Hybrid PSO will be described.
(1) gbest model For example, it has been found that the movement of a group of natural creatures such as a school of fish and a group of birds can be described by simple rules. In other words, even if the movements of individuals (agents) are described with simple rules, the movements of the flock can be complicated. Reynolds developed a boid (Reynolds, CW, "Flocks, Herds, and Schools: A Distributed Behavioral Model, in Computer Graphics", Proceedings of SIGGRAPH '87, pp. 25-34, 1987) Only rules are used.
-Proceed in the direction of leaving the adjacent agent.
・ Proceed in the direction that the entire flock is heading.
・ Proceed toward the center of the flock.
In other words, the movement of individual agents in the group can be considered by simple vector composition.
BoydとRichersonは人間の意思決定のプロセスを調査し、個人の学習と文化の伝達の概念を開発した(R. Boyd and P. Richerson, Culture and the Evolutionary Process, University of Chicago Press, 1985.)。彼らの研究によると、人間は意思決定において、2つの重要な情報を利用している。1つ目は、自分自身の経験である。つまり、自分自身でこれまで選択してきたことから、どのような状況がよかったか、その状況がどの程度良かったかについて知っている。2つ目は、他の人々の経験である。つまり、他の人々がどのように行動してどのような結果になったかということを知っている。このような2つの情報、つまり、自分の経験及び、他人の経験上良かった状況に関する情報を用いて人間は意志決定を行っている。
以上のように、群れの個体が簡単なベクトルを用いて動いていること、及び人間の意志決定が自分の経験及び、他人の経験上良かった状況に関する情報を用いて行われているという2つの観点が、新しい最適化手法であるPSOの背景となっている。
(2)PSOの探索方法
PSOは、上述の観点を用いて以下のように開発された。各エージェントの位置(状態量)をXY座標で表現し、その速度をvx(X方向の速度)、vy(Y方向の速度)で表現する。この位置と速度情報から次時点の各エージェントの位置を更新することができる。この概念に基づき、鳥の群れ全体がなんらかの目的関数を最適化するような行動をとると考えると、以下のような最適化が考えられる。
Boyd and Richerson investigated the human decision-making process and developed the concept of personal learning and cultural communication (R. Boyd and P. Richerson, Culture and the Evolutionary Process, University of Chicago Press, 1985). According to their research, humans use two important pieces of information in decision making. The first is my own experience. In other words, I know what the situation was good and how good it was because of my choices. The second is the experience of other people. In other words, we know how other people acted and what the results were. Humans make decisions using such two pieces of information, that is, information about their own experience and the situation that was good in the experience of others.
As described above, the fact that the individuals of the group are moving using simple vectors, and that human decision-making is performed using information related to their own experience and the circumstances of other people's experiences are good. The viewpoint is the background of PSO, which is a new optimization method.
(2) Search method of PSO PSO was developed as follows using the above-mentioned viewpoint. The position (state quantity) of each agent is represented by XY coordinates, and the velocity is represented by v x (velocity in the X direction) and v y (velocity in the Y direction). The position of each agent at the next time point can be updated from this position and speed information. Based on this concept, the following optimization can be considered if the whole flock of birds takes action that optimizes some objective function.
いま、複数のエージェントが共同して良い解を見つける探索を考える。この時、各エージェントは過去の探索における目的関数の最良値(パーソナルベスト:pbest)とそのXY位置(状態量)を覚えている。このpbestは、BoydとRichersonらの示した個人の経験に対応している。また、各エージェントはpbestのうち集団の中で最も最良なもの、つまり集団の過去の探索における目的関数の最良値(グループベスト:gbest)情報を共有している。このgbestは、BoydとRichersonらの示した他人の経験に対応している。各エージェントは、現在のXY値とvx値、vy値、及びpbestとgbestとの距離に応じて、その方向に位置を変更しようとする。この変更しようとする行動は速度で表現される。現在の速度と、pbest及びgbestを用いて、各エージェントの速度は以下の数式10により修正される。
[数10]
vi k+1=w×vi k+c1×rand()×(pbesti−si k)+c2×rand()×(gbesti−si k)
ここで、vi k:探索k回目におけるi番目のエージェントの速度
rand():0〜1の一様乱数
si k:i番目のエージェントの探索k回目における探索点
pbesti:i番目のエージェントのpbest
gbesti:i番目のエージェントのgbest
w:エージェント速度に対する重み係数
c1,c2:各項に対する重み係数
つまり、最適化を実現する複雑な探索の方向は、Boydと同様にベクトルの合成で表現できる。また、数式10の右辺第2項は、pbestに収束する方向となっており、第3項は同様に、gbestに収束する方向となっている。つまり、この探索方向は、個人の経験と他人の経験を融合した方向となっている。また、数式10による探索方向の算出により、PSOはこれまでの速度を維持しようとする大域探索(数式10の右辺第1項)とpbest,gbestを用いてそれに近付こうとする局所探索(数式10の右辺第2,3項)とをバランスよく行う機構をもった探索手法である。
Consider a search where multiple agents work together to find a good solution. At this time, each agent remembers the best value (personal best: pbest) of the objective function in the past search and its XY position (state quantity). This pbest corresponds to the personal experience presented by Boyd and Richerson et al. Further, each agent shares the best value in the group among pbest, that is, information on the best value (group best: gbest) of the objective function in the past search of the group. This gbest corresponds to the experience of others shown by Boyd and Richerson et al. Each agent present XY value and v x value, v y values, and in accordance with the distance between pbest and gbest, it attempts to change the position in that direction. The action to be changed is expressed by speed. Using the current speed, pbest, and gbest, the speed of each agent is modified by
[Equation 10]
v i k + 1 = w × v i k + c 1 × rand () × (pbest i −s i k ) + c 2 × rand () × (gbest i −s i k )
Where v i k is the speed of the i-th agent in the k-th search
rand (): Uniform random number between 0 and 1
s i k : Search point at the k-th search for the i-th agent
pbest i : pbest of i- th agent
gbest i : gbest of i- th agent
w: Weighting factor for agent speed
c 1 , c 2 : Weighting coefficient for each term In other words, the direction of a complicated search for realizing optimization can be expressed by vector synthesis as in Boyd. In addition, the second term on the right side of
上記数式10を用いることにより、各エージェントのこれまでの最良解及び集団の最良解に確率的に近づくような速度が求められ、これにより、各エージェントの現在の位置(探索点)を以下の数式11により修正する。
上記に示した探索点の修正(変更)の概念を、図4に示す。
[数11]
si k+1=si k+vi k+1
PSOはGA等と同様に複数の探索点を持った多点探索であり、各探索点のpbestと集団のgbestを用いて各探索点を確率的に変更していくことにより、大域最適解(最良解)を得る方法である。また、PSOは各ステップで目的関数値を評価する必要があるが、評価の回数は問題の規模によらずエージェント数のみで良いというメリットがある。従って、容易に大規模問題への適用が可能である。
図5は、多次元空間におけるPSOによる解探索の概念を示しており、n次元の問題に対しm個のエージェントにより解を探索する例である。
(3)PSOのパラメータ
PSOにおいて重要なパラメータは、試行回数、エージェント数、反復回数、数式10における各重み係数である。これらは全て設定値として変更可能とする。
・試行回数
PSOは確率的な最適化手法であるため、通常1回の最適化のみでなく乱数の種(seed)を変更して複数回の最適化を行い、その結果の中から最も良い解を最適解とする。その最適化を実行する回数を試行回数とする。
・エージェント数と反復回数
エージェント数は何点の同時探索を行うかの数値である。反復回数は、各探索点(エージェント)が何回位置を更新して探索を行うかの数値である。つまり、PSOのアルゴリズムでは、各エージェントの目的関数値は反復回数分評価される。
By using the
The concept of the search point correction (change) described above is shown in FIG.
[Equation 11]
s i k + 1 = s i k + v i k + 1
PSO is a multi-point search having a plurality of search points like GA, etc., and the global optimal solution (by using each search point's pbest and collective gbest to change probabilistically ( This is a method for obtaining the best solution. In addition, the PSO needs to evaluate the objective function value at each step, but there is an advantage that the number of evaluations need only be the number of agents regardless of the scale of the problem. Therefore, it can be easily applied to large-scale problems.
FIG. 5 shows the concept of solution search by PSO in a multidimensional space, and is an example in which a solution is searched by m agents for an n-dimensional problem.
(3) Parameters of PSO The important parameters in PSO are the number of trials, the number of agents, the number of iterations, and each weighting factor in
-Number of trials Since PSO is a probabilistic optimization method, it is usually not only one optimization, but also a random seed is changed to optimize multiple times, and the best solution is obtained from the results. Is the optimal solution. The number of times that the optimization is executed is the number of trials.
-Number of agents and number of iterations The number of agents is the number of simultaneous searches. The number of iterations is a numerical value indicating how many times each search point (agent) updates the position. That is, in the PSO algorithm, the objective function value of each agent is evaluated for the number of iterations.
従って、1回の最適化試行に対して、目的関数値の評価に必要な計算時間×エージェント数×反復回数の計算時間が必要となる。この計算時間を考慮しながら、これらのパラメータを決定する必要がある。
・重み係数(数式10のw,c1,c2)
wは、数式12の関数により表現できる。
[数12]
wk=h(k,kmax)
ここで、kmax:最大反復回数、k:現在の反復回数
例えば、経験的に以下のように設定すると良いことが分かっている。
[数13]
wk=wmax−k(wmax−wmin)/kmax
wmax=0.9,wmin=0.4
[数14]
c1=c2=2.0
数式13によって決定される重み係数wは、図6に示すように探索が進む(反復回数kが増える)に従って小さくなることがわかる。これは、重み係数wのかかる項は上述のように大域探索に相当する項であり、探索の開始時点では大域探索への比重を比較的大きくしておき、探索が進むに従ってその比重を小さくする。つまり、局所探索の比重を大きくするような特性となっていることがわかる。
(4)PSOによる最適化アルゴリズム
一回の最適化試行におけるアルゴリズムの概略を、図7に示す。
6.次に、gbestモデルを用いた圧縮空気漏れ量の出力方法を説明する。
(1)状態変数の表現方法
状態変数としては、以下を考える。
・圧縮空気の漏れ場所候補(数式8の目的関数を用いる場合)
前述の如く、各漏れ場所候補について、空気漏れが発生しているか否かにより1または0の2値量で表現する。
・漏れ場所の漏れ量(数式3,数式8の目的関数を用いる場合)
この漏れ量は、連続量で表現する。PSOでは、状態変数を連続量として表現可能であり、対象とする漏れ場所数だけの要素をもつ配列を用意し、この配列の1つ1つの要素が、圧縮空気の漏れ量となる。
(2)計測値
前記SGA,TSにおいて説明したものと同様の計測値を、本実施形態の診断装置に入力可能と仮定する。
(3)求解アルゴリズム
以下に、gbestモデルを用いたPSOを利用した場合のアルゴリズムを示す。
Step.1:前提条件と初期条件設定
・各計測値を入力する。
・状態変数(各漏れ場所候補の空気漏れ量)の上限値を設定する。
・エージェント数、各最適化パラメータ値、最大探索回数を設定する。
Step.2:初期値の生成
・各エージェント毎に、状態変数値を0または1,あるいは設定した上下限値内でランダムに生成する。
・pbest及びgbestの初期設定
各エージェント毎のpbest値及びgbest値を事前に設定した大きな値とする。
・現在の探索回数を1とする。
Step.3:各エージェントの評価
・各エージェント毎の評価値の計算
現在の各状態変数(空気漏れ量(及び、漏れ場所で漏れているか否かを示す1,0の2値量))をプラントシミュレータに入力し、各計測値に対する計算値を求め、この値を用いて数式3または数式8により評価値を計算する。
・pbest及びgbestの更新
上記で計算した各エージェント毎の評価値が現在の各エージェント毎のpbest値より良かったら、現在の値をpbest値に変更する。
Therefore, the calculation time required for evaluating the objective function value × the number of agents × the number of iterations is required for one optimization trial. It is necessary to determine these parameters in consideration of this calculation time.
-Weight coefficient (w, c 1 , c 2 in Equation 10)
w can be expressed by the function of
[Equation 12]
w k = h (k, k max )
Here, k max is the maximum number of iterations, k is the current number of iterations. For example, it has been empirically found that the following settings are preferable.
[Equation 13]
w k = w max −k (w max −w min ) / k max
w max = 0.9, w min = 0.4
[Formula 14]
c 1 = c 2 = 2.0
It can be seen that the weighting factor w determined by Equation 13 decreases as the search proceeds (the number of iterations k increases) as shown in FIG. This is a term corresponding to the global search as described above. The specific gravity for the global search is relatively increased at the start of the search, and the specific gravity is reduced as the search proceeds. . That is, it can be seen that the characteristics increase the specific gravity of the local search.
(4) Optimization algorithm by PSO FIG. 7 shows an outline of the algorithm in one optimization trial.
6). Next, a method for outputting the compressed air leakage amount using the gbest model will be described.
(1) State variable expression method The following are considered as state variables.
-Compressed air leak location candidate (when using the objective function of Equation 8)
As described above, each leakage place candidate is expressed by a binary amount of 1 or 0 depending on whether or not air leakage has occurred.
・ Leakage amount at the leak location (when using the objective function of Formula 3 and Formula 8)
This leakage amount is expressed as a continuous amount. In PSO, a state variable can be expressed as a continuous amount, and an array having elements corresponding to the number of target leak locations is prepared, and each element of the array is a leak amount of compressed air.
(2) Measurement Value It is assumed that the same measurement value as that described in the SGA and TS can be input to the diagnostic apparatus of this embodiment.
(3) Algorithm for finding solutions The following is an algorithm when using PSO using the gbest model.
Step.1: Set preconditions and initial conditions ・ Enter each measurement value.
・ Set the upper limit value of the state variable (the amount of air leakage of each leakage location candidate).
-Set the number of agents, each optimization parameter value, and the maximum number of searches.
Step.2: Generation of initial value ・ For each agent, the state variable value is randomly generated within 0 or 1, or within the set upper and lower limit values.
-Initial setting of pbest and gbest The pbest value and the gbest value for each agent are set to large values set in advance.
・ The current search count is 1.
Step.3 : Evaluation of each agent and calculation of evaluation value for each agent The current state variables (air leakage amount (and binary value of 1 and 0 indicating whether or not leaking at the leakage location)) are planted. It inputs into a simulator, the calculation value with respect to each measured value is calculated | required, and an evaluation value is calculated by Formula 3 or Formula 8 using this value.
Update of pbest and gbest If the evaluation value for each agent calculated above is better than the current pbest value for each agent, the current value is changed to the pbest value.
上記で計算したpbestのうちの最良値が現在のgbestより良かったら、その値をgbest値に変更する。そして、このgbest値を実現する空気漏れ量(及び空気漏れ場所)をX*として格納する。
Step.4:各エージェントの探索点の修正
設定した上下限値内で、各エージェント毎の状態変数値を数式10,11を用いて修正する。
Step.5:終了判定
探索回数が事前に設定した最大探索回数に達したら終了する。格納した全てのgbestの評価値及びその状態変数値X*をgbestが小さい順にソートし、全てのgbest値及びその状態変数値X*を出力する。この状態変数値が、求める圧縮空気漏れ量(及び漏れ場所)となる。
最大探索回数に達しなければ、現在の探索回数に1を足して、Step.3へ戻る。
7.次いで、Hybrid PSO(HPSO)を用いた圧縮空気漏れ診断装置について述べる。
(1)HPSOはPSOのメカニズムとGA等で利用される自然淘汰の概念を組み合わせたハイブリッド手法である(P. Angeline, "Using Selection to Improve Particle Swarm Optimization", Proc. of IEEE International Conference on Evolutionary Computation (ICEC), Anchorage, May 1998.)。
If the best value of the pbest calculated above is better than the current gbest, the value is changed to the gbest value. Then, the air leak amount (and air leak location) that realizes this gbest value is stored as X * .
Step 4: Correction of search point of each agent Within the set upper and lower limit values, the state variable value for each agent is corrected using
Step.5: End judgment End when the number of searches reaches the preset maximum number of searches. All the stored gbest evaluation values and their state variable values X * are sorted in ascending order of gbest, and all the gbest values and their state variable values X * are output. This state variable value is the compressed air leakage amount (and leakage location) to be obtained.
If the maximum number of searches has not been reached, add 1 to the current number of searches and return to Step 3.
7). Next, a compressed air leakage diagnosis apparatus using Hybrid PSO (HPSO) will be described.
(1) HPSO is a hybrid method combining the mechanism of PSO and the concept of natural selection used in GA, etc. (P. Angeline, “Using Selection to Improve Particle Swarm Optimization”, Proc. Of IEEE International Conference on Evolutionary Computation) (ICEC), Anchorage, May 1998.).
MH(メタ・ヒューリスティック)手法の多くは、自然淘汰に対応する選択の概念を入れている。選択は、探索空間の中で、他の探索点が最近探索した点と比較して相対的に有効である探索点に探索方向を向け直す機能となる。PSOもそれまでの探索で有効であった探索点(pbest,gbest)を利用しているが、その点自体にかなり依存してそれ以降の探索点が限定されてしまう。
これに対し、HPSOは、通常のMH手法と同様に有効な点は利用するが、その点への依存が徐々に薄らいでいくような機能を実現している。具体的には、現状の探索点の評価値を良い順番に並べ、事前に設定した割合分だけ、現状の探索点に対し評価値の最も悪いエージェントの探索点と速度から順番に、評価値の最も良いエージェントの値にリプレイスする。この際、各エージェントのこれまで探索してきた最も評価が良い探索点(pbest)の情報は残す。このような方法により、有効な領域への探索の集中とこれまで探索してきた有効な領域への探索の方向の向け直し及びその方向への弱い依存関係という機能を実現できる。
HPSOの一般的なアルゴリズムは図8のようになる。このアルゴリズムにより、HPSOはPSOとMH手法の選択のダイナミクスの混合となる。HPSOと従来のPSOのメカニズムとしての差は少ないが、この選択手法を加えることによって、評価の高い領域を集中的に探索するメカニズムが追加され、より良い解を見つける事ができる探索メカニズムとなる。
(2)次に、HPSOを用いた圧縮空気漏れ量の出力方法を述べる。
Many of the MH (meta heuristic) methods incorporate the concept of selection corresponding to natural selection. The selection has a function of redirecting the search direction to a search point that is relatively effective as compared to a point recently searched by another search point in the search space. The PSO also uses search points (pbest, gbest) that have been effective in the previous search, but the search points thereafter are limited depending on the points themselves.
On the other hand, HPSO realizes a function that uses an effective point in the same way as a normal MH method, but gradually becomes less dependent on that point. Specifically, the evaluation values of the current search points are arranged in a good order, and the evaluation values are set in order from the search point and speed of the agent having the worst evaluation value with respect to the current search points by the preset ratio. Replace with the best agent value. At this time, the information of the search point (pbest) that has been searched so far for each agent so far is left. By such a method, it is possible to realize functions such as concentration of search in an effective area, redirection of a search direction to an effective area that has been searched so far, and weak dependence on the direction.
A general algorithm of HPSO is as shown in FIG. With this algorithm, HPSO is a mixture of PSO and MH method selection dynamics. Although there is little difference between the mechanisms of HPSO and conventional PSO, by adding this selection method, a mechanism for intensively searching a highly evaluated region is added, and a search mechanism that can find a better solution is obtained.
(2) Next, a method for outputting the amount of compressed air leakage using HPSO will be described.
以下に、HPSOを利用した場合のアルゴリズムを示す。
Step.1:前提条件と初期条件設定
Step.2:初期値の生成
Step.3:各エージェントの評価
上記のStep.1〜Step.3の内容は、PSOを利用した場合と同様である。
Step.4:選択の実行
・現在の各エージェントの評価値を良い順番にソーティングする。
・事前に設定した割合(Sr)を用いて変更する個体数(Ns)を以下の式により計算する。
[数15]
Ns = Round(AgentNum×Sr)
・最も評価の悪いエージェントからNs個だけの探索点及び速度を、最も評価の良いエージェントからNs個だけの探索点及び速度と変更する。
この際、変更したエージェントのpbest情報はそのままとする。
Step.5:各エージェントの探索点の修正
設定した上下限値内で、各エージェント毎の状態変数値を数式10,数式11を用いて修正する。
Step.6:終了判定
探索回数が事前に設定した最大探索回数に達したら終了する。格納した全てのgbestの評価値及びその状態変数値X*をgbestが小さい順にソートし、全てのgbest値及びその状態変数値X*を出力する。この状態変数値が、求める圧縮空気漏れ量(及び漏れ場所)となる。
The algorithm when using HPSO is shown below.
Step.1: Precondition and initial condition setting
Step.2: Generate initial values
Step.3: Evaluation of each agent The contents of
Step.4 : Execution of selection ・ Sorting the evaluation value of each current agent in order of good.
-Calculate the number of individuals (Ns) to be changed using the ratio (Sr) set in advance using the following formula.
[Equation 15]
Ns = Round (AgentNum × Sr)
Change Ns search points and speeds from the worst-rated agent to Ns search points and speeds from the best-evaluated agent.
At this time, the pbest information of the changed agent is left as it is.
Step.5: Correction of search point of each agent Within the set upper and lower limit values, the state variable value for each agent is corrected using
Step.6: End determination End when the number of searches reaches the preset maximum number of searches. All the stored gbest evaluation values and their state variable values X * are sorted in ascending order of gbest, and all the gbest values and their state variable values X * are output. This state variable value is the compressed air leakage amount (and leakage location) to be obtained.
最大探索回数に達しなければ、現在の探索回数に1を足して、Step.3へ戻る。
8.次に、同時性を確保した計測値が入力され、前述した最適化手法のいずれかを用いて圧縮空気の漏れ場所候補を特定すると共に、その場所における漏れ量を画面に表示出力する圧縮空気漏れ診断装置を図9、図10に示す。
なお、図9に示す診断装置は請求項1〜4の発明を実施するためのものであり、図10に示す診断装置は、参考例を実施するためのものである。
これらの装置には、ネットワーク内に設置された各計測器から同期のとれた計測値が入力される。この同期の取り方には、例えばGPS等を利用し、事前に決定した周期(例えば10分単位)で計測値と同時に時間タグを付けた計測データを装置に入力し、装置側でもGPSに合わせた計測時間を持ち、各計測機器に対する計測データのうち、この装置側の計測時間に一番近いデータをその時点での計測点とする方法が考えられる。また、この方法はGPSを用いるのではなく、各計測器をネットワークで接続し、NTPサーバ等により、絶対時間の同期を取り、この絶対的な計測時間の時間タグと計測値とを装置に入力し、同じ計測時間の計測値を同期した計測データとして扱う方法も考えられる。
診断装置により、圧縮空気の漏れ場所とその場所での空気漏れ量との組合せが可能性の高い候補として出力される。この候補のうち、評価値が低い(可能性の高い)組合せから順番に表形式で画面に出力する。
If the maximum number of searches has not been reached, add 1 to the current number of searches and return to Step 3.
8). Next, a measurement value that ensures simultaneity is input, and a compressed air leak location is identified using one of the optimization methods described above, and the leak amount at that location is displayed on the screen and output. The diagnostic apparatus is shown in FIGS.
The diagnostic device shown in FIG. 9 is for carrying out the inventions of
To these devices, synchronized measurement values are input from each measuring instrument installed in the network. For this synchronization, for example, using GPS or the like, measurement data with a time tag is input to the apparatus at the same time as a measurement value at a predetermined period (for example, in units of 10 minutes), and the apparatus also adjusts to GPS. A method is conceivable in which, among measurement data for each measurement device, the data closest to the measurement time on the apparatus side is used as a measurement point at that time. In addition, this method does not use GPS, but connects each measuring instrument via a network, synchronizes the absolute time with an NTP server or the like, and inputs the time tag and measurement value of this absolute measurement time to the device. However, a method of handling the measurement values of the same measurement time as synchronized measurement data is also conceivable.
The combination of the leaked location of compressed air and the amount of air leak at that location is output as a highly likely candidate by the diagnostic device. Out of the candidates, the combinations having the lowest evaluation value (highly likely) are output in the form of a table in order.
以下、上記診断装置を用いて圧縮空気の漏れ場所とその場所における漏れ量を求める実施例について説明する。
図11は、この実施例が適用される圧縮空気の供給システムを示しており、10はコンプレッサ、21〜23は空気負荷、m1〜m5は計測点(5箇所)、c1〜c5は空気漏れ場所候補である。なお、図11では簡単化のため、エアタンクは省略してある。また、空気漏れ場所候補は、例えば配管、管継手、機器の接続部等が考えられる。(1)機器モデル
・コンプレッサ
コンプレッサは、燃料(電気等)を入力することにより、圧縮空気を出力するモデルとなっており、下記の数式で表されるものとする。
[数16]
y1=f1(x1)
ここで、x1:コンプレッサへの燃料(電気等)入力量
y1:コンプレッサの圧縮空気出力量
例として、ここでは下記のように線形式で表現されているとする。
[数17]
y1=a1x1+b1
ここで、a1,b1:機器特性パラメータ
・圧縮空気合計出力
圧縮空気合計出力は、数式18に示すようにすべてのコンプレッサで発生した圧縮空気出力合計値となる。ここでは、1台のコンプレッサを仮定しているが、複数台ある場合は、複数台のコンプレッサからの圧縮空気出力合計値となる。
[数18]
y2=f2(y1)=y1
ここで、y2:圧縮空気出力合計値
(2)その他の計算条件
計測値mimeasをそれぞれ、m1meas、m2meas、m3meas、m4meas、m5measとする。ここで、mimeasはi番目の計測値を意味する。
(3)計算の実行
圧縮空気の漏れ場所とその漏れ量の計算
請求項1〜4または参考例により、図11に示す圧縮空気の供給システムにおいて最も確からしい圧縮空気の漏れ場所とその漏れ量を計算することが可能である。a.計測点における計算値の計算方法
それぞれの計算値は以下の数式19〜23のようになる。
[数19]
m1calc=x1
[数20]
m2calc=y1
[数21]
m3calc=y2
[数22]
m4calc=y3
[数23]
m5calc=y4
ここで、m1calc:計測点1の計算値
m2calc:計測点2の計算値
m3calc:計測点3の計算値
m4calc:計測点4の計算値
m5calc:計測点5の計算値
b.最適化手法を用いた圧縮空気の漏れ場所及び漏れ量の特定方法
まず、請求項1〜4の発明を用いる場合、図1の機能A1によって圧縮空気の漏れ場所候補を指定する。
Hereinafter, the Example which calculates | requires the leak location in the location and leak location of compressed air using the said diagnostic apparatus is described.
FIG. 11 shows a compressed air supply system to which this embodiment is applied, where 10 is a compressor, 21 to 23 are air loads, m 1 to m 5 are measurement points (five places), and c 1 to c 5. Is a potential air leak location. In FIG. 11, the air tank is omitted for simplification. The air leak location candidate may be, for example, a pipe, a pipe joint, or a device connection. (1) Equipment model / compressor The compressor is a model that outputs compressed air by inputting fuel (electricity, etc.), and is expressed by the following formula.
[Equation 16]
y 1 = f 1 (x 1 )
Where x 1 : Fuel (electricity, etc.) input to the compressor
y 1 : Compressed air output amount of the compressor As an example, here, it is assumed that it is expressed in a linear form as follows.
[Equation 17]
y 1 = a 1 x 1 + b 1
Here, a 1 , b 1 : device characteristic parameter / compressed air total output The compressed air total output is a total compressed air output value generated by all the compressors as shown in Equation 18. Here, although one compressor is assumed, when there are a plurality of compressors, the total compressed air output value from the plurality of compressors is obtained.
[Equation 18]
y 2 = f 2 (y 1 ) = y 1
Where y 2 : total compressed air output
(2) Other calculation conditions The measured values mimeas are m1meas , m2meas , m3meas , m4meas , and m5meas , respectively. Here, mimeas means the i-th measurement value.
(3) Calculation Execution Calculation of Compressed Air Leakage Location and Amount of Leakage According to
[Equation 19]
m 1calc = x 1
[Equation 20]
m 2calc = y 1
[Equation 21]
m 3calc = y 2
[Equation 22]
m 4calc = y 3
[Equation 23]
m 5calc = y 4
Where m 1calc : Calculated value at
m 2calc : Calculated value at
m 3calc : Calculated value at measurement point 3
m 4calc : Calculated value at
m 5calc : Calculated value of measurement point 5 b. Method for Specifying Compressed Air Leakage Location and Leakage Amount Using Optimization Method First, when using the inventions of
この例では、漏れ場所候補がc1,c2,c3の3箇所あるため、以下の組合せが生成される。ここで、配列の第1要素はc1が漏れ場所かどうか、第2要素はc2が漏れ場所かどうか、第3要素はc3が漏れ場所かどうかを示している。また、各要素の1は漏れ場所、0は漏れ場所でないことを示している。
(0,0,0),(0,0,1) ,(0,1,0) ,(0,1,1),(1,0,0),(1,0,1) ,(1,1,0) ,(1,1,1)
例えば、(1,0,0)はc1だけが漏れ場所であることを示している。
次に、指定された各圧縮空気の漏れ場所の組合せに対する空気漏れ量の計算を最適化を用いて行う。ここで、組合せ(1,0,0)に対する空気漏れ量の計算を例にとって説明する。
機器の上下限制約等の機器制約も考慮した最適化の定式化は以下のようになる。
・状態変数
状態変数は、指定された空気漏れ場所の空気漏れ量となる。この漏れ量は上述のように、仮想的な空気負荷となる。
・目的関数
目的関数は、数式24に示すごとく、計測点における計測値と計算値とのノルムの最小化となる。
In this example, since there are three leak location candidates c 1 , c 2 , and c 3 , the following combinations are generated. Here, the first element of the array indicates whether c 1 is a leak location, the second element indicates whether c 2 is a leak location, and the third element indicates whether c 3 is a leak location. Moreover, 1 of each element has shown that it is a leak location and 0 is not a leak location.
(0,0,0), (0,0,1), (0,1,0), (0,1,1), (1,0,0), (1,0,1), (1 , 1,0), (1,1,1)
For example, (1, 0, 0) indicates that only c 1 is a leak location.
Next, calculation of the amount of air leakage for each specified combination of leak locations of compressed air is performed using optimization. Here, calculation of the amount of air leakage for the combination (1, 0, 0) will be described as an example.
The optimization formulation taking into account equipment constraints such as equipment upper and lower limits is as follows.
• State variable The state variable is the amount of air leak at the specified air leak location. As described above, this leakage amount becomes a virtual air load.
Objective Function The objective function is the minimization of the norm between the measured value and the calculated value at the measurement point, as shown in Equation 24.
ここで、wiは各計測値に対する重み係数である。
・制約条件
コンプレッサの圧縮空気出力制約として、数式25で与えられる。
[数25]
0≦y1≦Aircom,airmax
ここで、Aircom,airmaxはコンプレッサの圧縮空気出力最大値である。
つまり、数式25の制約を満たす範囲で数式24の目的関数を最小化する状態変数を求めることになる。その際、各計測値に対する計算値は、数式16〜23のネットワークに関する方程式から計算される。
圧縮空気の漏れ場所の組合せは、(1,0,0)以外についても、数式24の目的関数を最小化する状態変数値を求め、漏れ場所が同一であるものについて、目的関数値の小さい順番に、例えば図12のような形式で画面に表示出力する。また、漏れ場所の数が少ない方から順に表示するものとする。
次に、参考例の、圧縮空気の漏れ場所及び漏れ量の特定方法を説明する。
Here, w i is a weighting factor for each measurement value.
-Restriction condition It is given by
[Equation 25]
0 ≦ y 1 ≦ Air com, airmax
Here, Air com, airmax is the maximum compressed air output value of the compressor.
That is, a state variable that minimizes the objective function of Formula 24 within a range that satisfies the constraint of
For combinations of leak locations of compressed air, other than (1, 0, 0), a state variable value that minimizes the objective function of Equation 24 is obtained. In addition, for example, it is displayed on the screen in a format as shown in FIG. In addition, the information is displayed in order from the smallest number of leaking places.
Next, a method for specifying the location and amount of leakage of compressed air according to a reference example will be described.
漏れ場所候補がc1,c2,c3の3箇所あるため、これらの候補1つ1つで漏れが発生しているか否かの2値量と各場所での空気漏れ量との計算を、最適化を用いて行う。
機器の上下限制約等の機器制約も考慮した最適化の定式化は、以下のようになる。
・状態変数
状態変数は、各空気漏れ場所候補に実際に空気漏れが発生しているか否かを示す1,0の2値量と、各空気漏れ場所の空気漏れ量(連続量)となる。この漏れ量は、上述のように仮想的な空気負荷となる。
・目的関数
目的関数は、計測点における計測値と計算値とのノルムの最小化となり、例えば前述の数式8から、以下の数式26のようになる。
Since there are three leak location candidates c 1 , c 2 , and c 3 , the calculation of the binary amount of whether or not a leak has occurred in each of these candidates and the air leak amount at each location is performed. , Using optimization.
The optimization formulation taking into account equipment constraints such as equipment upper and lower limits is as follows.
State variable The state variable is a binary amount of 1, 0 indicating whether or not an air leak actually occurs in each air leak location candidate, and an air leak amount (continuous amount) at each air leak location. This leakage amount becomes a virtual air load as described above.
Objective Function The objective function is the minimization of the norm between the measured value and the calculated value at the measurement point. For example, the following
・制約条件
前記数式25と同様である。
すなわち、数式25の制約を満たす範囲で数式26の目的関数を最小化する状態変数を求めることになる。その際、各計測値に対する計算値は、数式16〜23のネットワークに関する方程式から計算される。
そして、最終的に得られた解を利用して、診断装置は、漏れ場所が少なく目的関数値の小さい順番に、図12のように画面に表示出力する。
Restriction conditions The same as
That is, a state variable that minimizes the objective function of
Then, using the finally obtained solution, the diagnostic apparatus displays and outputs on the screen as shown in FIG.
10:コンプレッサ
21〜23:空気負荷
m1〜m5:計測点
c1〜c5:空気漏れ場所候補
10: Compressor 21-23: air load m 1 ~m 5: Measurement point c 1 to c 5: air leakage location candidates
Claims (4)
前記構成機器の入出力関係をブランチとして表現する機器モデルを複数のノードにより接続し、前記ノードごとの入出力エネルギーが等しくなるように構成して前記ネットワークの入出力エネルギーを表現するネットワークモデルを備え、前記ネットワークの入出力エネルギーが与えられたときに、前記ノードごとの入出力エネルギーが等しくなる関係と前記機器モデルとに基づいて、前記ノード及び前記機器モデルにおけるある時間断面の空気流量や圧力を状態量として計算し、この状態量を前記ネットワークの状態量として出力する圧縮空気プラントシミュレータを備え、
オペレータにより入力された前記ネットワークにおける圧縮空気の漏れ場所候補を、圧縮空気の消費装置による消費として前記機器モデルにて表現して前記ネットワークモデルに組み込む機能と、
漏れ場所候補の漏れ場所数を1から予め定めた最大値まで変化させ、漏れ場所数ごとに漏れ場所候補を選択する全ての組み合わせを生成する機能と、
前記選択された漏れ場所候補の圧縮空気の漏れ量を状態変数として前記圧縮空気プラントシミュレータにより状態量を求め、前記ネットワークの入出力エネルギー及び前記ネットワークに設置された計測機器により測定された状態量を計測値とし、前記生成された漏れ場所候補を選択する全ての組み合わせについて、前記圧縮空気プラントシミュレータから出力される状態量と前記計測値とからなる所定の目的関数を用いて最適化問題を解くことにより、前記生成された漏れ場所候補を選択する全ての組み合わせにおける圧縮空気の漏れ量を計算する機能と、
前記生成された漏れ場所候補を選択する全ての組み合わせにおける各漏れ場所候補及び計算された圧縮空気の漏れ量を出力する機能と、
を備えたことを特徴とする圧縮空気漏れ診断装置。 In a compressed air leak diagnosis apparatus using a compressed air plant simulator in a compressed air plant provided with a compressed air supply device, a compressed air piping network, and a compressed air consumption device as network constituent devices,
A device model that expresses the input / output relationship of the component device as a branch is connected by a plurality of nodes, and a network model that expresses the input / output energy of the network by configuring the input / output energy of each node to be equal is provided. , When the input / output energy of the network is given, based on the relationship between the input / output energy of each node and the device model, the air flow rate and pressure of a certain time section in the node and the device model A compressed air plant simulator that calculates a state quantity and outputs the state quantity as a state quantity of the network;
A function of expressing a compressed air leak location candidate in the network input by an operator as a consumption by a compressed air consumption device in the device model and incorporating it into the network model;
A function of changing the number of leak locations of the leak location candidates from 1 to a predetermined maximum value and generating all combinations for selecting the leak location candidates for each number of leak locations;
Using the compressed air plant simulator as a state variable, the amount of compressed air leakage of the selected leakage location candidate is obtained as a state variable, and the input / output energy of the network and the state amount measured by the measuring device installed in the network are obtained. Solving the optimization problem using a predetermined objective function consisting of the state quantity output from the compressed air plant simulator and the measured value for all combinations for selecting the generated leak location candidates as measured values The function of calculating the leak amount of compressed air in all combinations for selecting the generated leak location candidate,
A function of outputting each leak location candidate and the calculated compressed air leak amount in all combinations of selecting the generated leak location candidates;
A compressed air leakage diagnostic apparatus comprising:
圧縮空気の漏れ場所候補及びその場所における圧縮空気の漏れ量を計算する機能を、遺伝的アルゴリズムまたはその改良手法を用いて実現したことを特徴とする圧縮空気漏れ診断装置。 In the compressed air leakage diagnosis device according to claim 1,
A compressed air leakage diagnostic apparatus characterized in that a function for calculating a compressed air leakage location candidate and a compressed air leakage amount at the location is realized by using a genetic algorithm or an improved method thereof.
圧縮空気の漏れ場所候補及びその場所における圧縮空気の漏れ量を計算する機能を、タブサーチまたはその改良手法を用いて実現したことを特徴とする圧縮空気漏れ診断装置。 In the compressed air leakage diagnosis device according to claim 1,
A compressed air leakage diagnostic apparatus characterized in that a function for calculating a compressed air leakage place candidate and a compressed air leakage amount at the place is realized by using a tab search or an improved method thereof.
圧縮空気の漏れ場所候補及びその場所における圧縮空気の漏れ量を計算する機能を、パーティクル スウォーム オプティマイゼーション(Particle Swarm Optimization)またはその改良手法を用いて実現したことを特徴とする圧縮空気漏れ診断装置。
In the compressed air leakage diagnosis device according to claim 1,
A compressed air leakage diagnostic apparatus characterized by realizing a candidate for a compressed air leakage location and a function for calculating the amount of compressed air leakage at the location using Particle Swarm Optimization (Particle Swarm Optimization) or an improved method thereof.
Priority Applications (1)
| Application Number | Priority Date | Filing Date | Title |
|---|---|---|---|
| JP2009180935A JP4765005B2 (en) | 2009-08-03 | 2009-08-03 | Compressed air leak diagnostic device |
Applications Claiming Priority (1)
| Application Number | Priority Date | Filing Date | Title |
|---|---|---|---|
| JP2009180935A JP4765005B2 (en) | 2009-08-03 | 2009-08-03 | Compressed air leak diagnostic device |
Related Parent Applications (1)
| Application Number | Title | Priority Date | Filing Date |
|---|---|---|---|
| JP2004157057A Division JP2005339195A (en) | 2004-05-27 | 2004-05-27 | Compressed air plant simulator and compressed air leakage diagnosis device |
Related Child Applications (1)
| Application Number | Title | Priority Date | Filing Date |
|---|---|---|---|
| JP2010276511A Division JP4911244B2 (en) | 2010-12-13 | 2010-12-13 | Compressed air leak diagnostic device |
Publications (2)
| Publication Number | Publication Date |
|---|---|
| JP2009259279A JP2009259279A (en) | 2009-11-05 |
| JP4765005B2 true JP4765005B2 (en) | 2011-09-07 |
Family
ID=41386532
Family Applications (1)
| Application Number | Title | Priority Date | Filing Date |
|---|---|---|---|
| JP2009180935A Expired - Lifetime JP4765005B2 (en) | 2009-08-03 | 2009-08-03 | Compressed air leak diagnostic device |
Country Status (1)
| Country | Link |
|---|---|
| JP (1) | JP4765005B2 (en) |
Family Cites Families (2)
| Publication number | Priority date | Publication date | Assignee | Title |
|---|---|---|---|---|
| JPH07103960B2 (en) * | 1991-04-06 | 1995-11-08 | 石油資源開発株式会社 | Pipeline leak detection method |
| JPH09217900A (en) * | 1995-12-06 | 1997-08-19 | Hitachi Ltd | Fluid transport network control system and method |
-
2009
- 2009-08-03 JP JP2009180935A patent/JP4765005B2/en not_active Expired - Lifetime
Also Published As
| Publication number | Publication date |
|---|---|
| JP2009259279A (en) | 2009-11-05 |
Similar Documents
| Publication | Publication Date | Title |
|---|---|---|
| Sedki et al. | Hybrid particle swarm optimization and differential evolution for optimal design of water distribution systems | |
| Haghighi et al. | Uncertainty analysis of water supply networks using the fuzzy set theory and NSGA-II | |
| Wang et al. | Stochastic combined heat and power dispatch based on multi-objective particle swarm optimization | |
| Alkayem et al. | Damage identification in three-dimensional structures using single-objective evolutionary algorithms and finite element model updating: evaluation and comparison | |
| Karami et al. | A review and evaluation of multi and many-objective optimization: Methods and algorithms | |
| Eldrandaly | Exploring multi-criteria decision strategies in GIS with linguistic quantifiers: an extension of the analytical network process using ordered weighted averaging operators | |
| JP4337461B2 (en) | Device characteristic parameter estimation device and device characteristic parameter information output device | |
| Marghny et al. | A hybrid multi-objective optimization algorithm for software requirement problem | |
| Fan et al. | Domain-Specific Large Language Model for Maintenance Decision-Making on Wind Farms by Labeled-Data-Supervised Fine-Tuning | |
| Yuan et al. | Integrated optimisation of human-robot collaborative disassembly planning and adaptive evaluation driven by a digital twin | |
| CN117522132A (en) | Vendor risk assessment system and application method | |
| Shrestha et al. | Enhancing seismic vulnerability assessment: a neural network effort for efficient prediction of multi-storey reinforced concrete building displacement | |
| Patro et al. | A fuzzy inventory model with time dependent Weibull deterioration, quadratic demand and partial backlogging | |
| Okasha et al. | A near-optimum multi-objective optimization approach for structural design | |
| JP4911244B2 (en) | Compressed air leak diagnostic device | |
| Long et al. | A similarity-detection-based evolutionary algorithm for large-scale multimodal multi-objective optimization | |
| Li et al. | AI agent-driven virtual in-situ calibration for intelligent building digital twins | |
| JP4765005B2 (en) | Compressed air leak diagnostic device | |
| JP2005339195A (en) | Compressed air plant simulator and compressed air leakage diagnosis device | |
| JP2006209331A (en) | Device diagnostic device and measuring device diagnostic device on network | |
| De Kuyffer et al. | Offshore windmill and substation maintenance planning with Distance, Fuel consumption and Tardiness optimisation | |
| Puhan et al. | Ensuring grid resilience: Voltage stability analysis and contingency ranking in electric power systems | |
| CN118839457A (en) | Regional heating pipe network optimization design method and device | |
| Carnero et al. | A new metaheuristic based approach for the design of sensor networks | |
| Marcher et al. | Decision support systems in building construction–an Axiomatic Design approach |
Legal Events
| Date | Code | Title | Description |
|---|---|---|---|
| A621 | Written request for application examination |
Free format text: JAPANESE INTERMEDIATE CODE: A621 Effective date: 20090804 |
|
| A131 | Notification of reasons for refusal |
Free format text: JAPANESE INTERMEDIATE CODE: A131 Effective date: 20101026 |
|
| A977 | Report on retrieval |
Free format text: JAPANESE INTERMEDIATE CODE: A971007 Effective date: 20101028 |
|
| A521 | Request for written amendment filed |
Free format text: JAPANESE INTERMEDIATE CODE: A523 Effective date: 20101213 |
|
| TRDD | Decision of grant or rejection written | ||
| A01 | Written decision to grant a patent or to grant a registration (utility model) |
Free format text: JAPANESE INTERMEDIATE CODE: A01 Effective date: 20110412 |
|
| A711 | Notification of change in applicant |
Free format text: JAPANESE INTERMEDIATE CODE: A712 Effective date: 20110422 |
|
| A61 | First payment of annual fees (during grant procedure) |
Free format text: JAPANESE INTERMEDIATE CODE: A61 Effective date: 20110425 |
|
| R150 | Certificate of patent or registration of utility model |
Ref document number: 4765005 Country of ref document: JP Free format text: JAPANESE INTERMEDIATE CODE: R150 Free format text: JAPANESE INTERMEDIATE CODE: R150 |
|
| FPAY | Renewal fee payment (event date is renewal date of database) |
Free format text: PAYMENT UNTIL: 20140624 Year of fee payment: 3 |
|
| R250 | Receipt of annual fees |
Free format text: JAPANESE INTERMEDIATE CODE: R250 |
|
| R250 | Receipt of annual fees |
Free format text: JAPANESE INTERMEDIATE CODE: R250 |
|
| R250 | Receipt of annual fees |
Free format text: JAPANESE INTERMEDIATE CODE: R250 |
|
| R250 | Receipt of annual fees |
Free format text: JAPANESE INTERMEDIATE CODE: R250 |
|
| R250 | Receipt of annual fees |
Free format text: JAPANESE INTERMEDIATE CODE: R250 |
|
| R250 | Receipt of annual fees |
Free format text: JAPANESE INTERMEDIATE CODE: R250 |
|
| R250 | Receipt of annual fees |
Free format text: JAPANESE INTERMEDIATE CODE: R250 |
|
| R250 | Receipt of annual fees |
Free format text: JAPANESE INTERMEDIATE CODE: R250 |
|
| R250 | Receipt of annual fees |
Free format text: JAPANESE INTERMEDIATE CODE: R250 |
|
| R250 | Receipt of annual fees |
Free format text: JAPANESE INTERMEDIATE CODE: R250 |
|
| EXPY | Cancellation because of completion of term |