JP5484591B2 - PLANT DIAGNOSIS DEVICE AND PLANT DIAGNOSIS METHOD - Google Patents
PLANT DIAGNOSIS DEVICE AND PLANT DIAGNOSIS METHOD Download PDFInfo
- Publication number
- JP5484591B2 JP5484591B2 JP2012546576A JP2012546576A JP5484591B2 JP 5484591 B2 JP5484591 B2 JP 5484591B2 JP 2012546576 A JP2012546576 A JP 2012546576A JP 2012546576 A JP2012546576 A JP 2012546576A JP 5484591 B2 JP5484591 B2 JP 5484591B2
- Authority
- JP
- Japan
- Prior art keywords
- model
- state
- plant
- measurement signal
- predictive
- Prior art date
- Legal status (The legal status is an assumption and is not a legal conclusion. Google has not performed a legal analysis and makes no representation as to the accuracy of the status listed.)
- Expired - Fee Related
Links
Images


Classifications
-
- G—PHYSICS
- G05—CONTROLLING; REGULATING
- G05B—CONTROL OR REGULATING SYSTEMS IN GENERAL; FUNCTIONAL ELEMENTS OF SUCH SYSTEMS; MONITORING OR TESTING ARRANGEMENTS FOR SUCH SYSTEMS OR ELEMENTS
- G05B23/00—Testing or monitoring of control systems or parts thereof
- G05B23/02—Electric testing or monitoring
- G05B23/0205—Electric testing or monitoring by means of a monitoring system capable of detecting and responding to faults
- G05B23/0218—Electric testing or monitoring by means of a monitoring system capable of detecting and responding to faults characterised by the fault detection method dealing with either existing or incipient faults
- G05B23/0243—Electric testing or monitoring by means of a monitoring system capable of detecting and responding to faults characterised by the fault detection method dealing with either existing or incipient faults model based detection method, e.g. first-principles knowledge model
- G05B23/0254—Electric testing or monitoring by means of a monitoring system capable of detecting and responding to faults characterised by the fault detection method dealing with either existing or incipient faults model based detection method, e.g. first-principles knowledge model based on a quantitative model, e.g. mathematical relationships between inputs and outputs; functions: observer, Kalman filter, residual calculation, Neural Networks
Landscapes
- Physics & Mathematics (AREA)
- Engineering & Computer Science (AREA)
- Artificial Intelligence (AREA)
- Evolutionary Computation (AREA)
- Mathematical Physics (AREA)
- General Physics & Mathematics (AREA)
- Automation & Control Theory (AREA)
- Testing And Monitoring For Control Systems (AREA)
Description
本発明は、プラントの診断装置及びプラントの診断方法に関する。 The present invention relates to a plant diagnosis apparatus and a plant diagnosis method.
プラントの診断装置は、プラントに異常な過渡事象や事故等が生じた際に、プラントからの計測信号を基にその異常や事故の発生を検知するものである。 The plant diagnostic device detects an abnormality or an accident based on a measurement signal from the plant when an abnormal transient or accident occurs in the plant.
公知例のプラントの診断装置として特開2005−165375号公報には、適応共鳴理論(Adaptive Resonance Theory:ART)を用いたプラントの診断装置が開示されている。ここで、ARTとは、多次元のデータをその類似度に応じてカテゴリーに分類する技術である。 As a known example of a plant diagnostic apparatus, Japanese Patent Application Laid-Open No. 2005-165375 discloses a plant diagnostic apparatus using an adaptive resonance theory (ART). Here, ART is a technique for classifying multidimensional data into categories according to their similarity.
この特開2005−165375号公報に記載されたプラントの診断装置の技術においては、まず、プラントの運転データを記録した過去の計測信号から、プラントの状態が正常と考えられる期間の信号を学習データとして抽出する。そして、ARTを用いて、学習データを複数のカテゴリー(正常カテゴリー)に分類して正常モデルを作成する。次に、プラントの現在の計測信号をARTでカテゴリーに分類する。この現在の計測信号が正常モデルと一致しない時、すなわち正常カテゴリーに分類できない時は、新しいカテゴリー(新規カテゴリー)が生成される。つまり、新規カテゴリーの発生は、計測信号の傾向が変化し、プラントの状態が変化したことを意味する。そこで、異常の発生を新規カテゴリーの発生で判断することとし、新規カテゴリーの発生割合が閾値を越えた場合に異常と診断する技術である。 In the technique of the plant diagnosis apparatus described in Japanese Patent Laid-Open No. 2005-165375, first, a learning signal is used as a learning signal from a past measurement signal in which operation data of the plant is recorded. Extract as Then, using ART, the learning data is classified into a plurality of categories (normal categories) to create a normal model. Next, the current measurement signal of the plant is classified into categories by ART. When the current measurement signal does not match the normal model, that is, when it cannot be classified into the normal category, a new category (new category) is generated. In other words, the occurrence of a new category means that the trend of the measurement signal has changed and the state of the plant has changed. Therefore, it is a technique for determining the occurrence of an abnormality based on the occurrence of a new category and diagnosing an abnormality when the occurrence rate of the new category exceeds a threshold value.
プラントの診断装置には、異常の対策を検討する時間を確保するため、異常が発生するよりも前に、プラントの状態変化を検知することが求められる。これを実現するには、正常状態から異常状態に至る途中の、予兆状態を検知する必要がある。 A plant diagnosis apparatus is required to detect a change in the state of a plant before the occurrence of an abnormality in order to secure time for examining countermeasures against the abnormality. In order to realize this, it is necessary to detect a predictive state on the way from the normal state to the abnormal state.
通常、プラントの制御装置には、計測信号が予め定められた範囲を逸脱した時に警報を発生させる機能がある。異常に伴って警報が発生すれば、警報が発生している期間のデータを過去の計測信号から除外することで、異常状態のデータを除外した学習データを作成できる。 Usually, a plant control device has a function of generating an alarm when a measurement signal deviates from a predetermined range. If an alarm is generated in accordance with an abnormality, learning data excluding data in an abnormal state can be created by excluding data in a period during which the alarm is generated from past measurement signals.
しかしながら、この学習データには、正常状態から警報が発生する異常状態に至る途中の予兆状態のデータが含まれる。そのため、この学習データを用いて正常モデルを構築すると、予兆状態を正常と診断してしまい、予兆状態を検知できないことになる。 However, this learning data includes data of a predictive state on the way from a normal state to an abnormal state where an alarm is generated. Therefore, when a normal model is constructed using this learning data, the predictive state is diagnosed as normal, and the predictive state cannot be detected.
本発明の目的は、プラントの状態が正常状態から異常状態に至る途中の予兆状態を検知可能にするプラントの診断装置及びプラントの診断方法を提供することにある。 An object of the present invention is to provide a plant diagnostic apparatus and a plant diagnostic method that can detect a sign state in the middle of a plant state from a normal state to an abnormal state.
本発明のプラントから状態量を計測した計測信号に基づいてプラントの運転状態を診断し、診断結果を画像表示装置に表示するプラントの診断装置は、プラントの診断装置にプラントの状態量を計測した計測信号を用いて診断に用いるモデルを構築する学習手段と、前記学習手段で構築したモデルを用いてプラントの運転状態を診断する診断手段を備え、前記学習手段に、類似の値を持つデータを同じカテゴリーに分類する分類部と、前記分類部でのカテゴリーの分類結果に基づいて計測信号の傾向の違いを評価して正常期間、予兆期間、異常期間を決定する期間決定部と、前記正常期間の計測信号を用いて正常モデルを構築するモデル構築部を備え、前記診断手段は、現時刻の計測信号が前記モデル構築部で構築される正常モデルに分類されるか否かを判定して、現時刻の計測信号が正常モデルに含まれる場合はプラントが正常状態であると診断して画像表示装置に表示し、現時刻の計測信号が正常モデルに含まれない場合はプラントが過去に経験したことのない未知状態であると診断して画像表示装置に表示するように構成し、前記学習手段に設けた前記期間決定部では、前記プラントの状態量を計測した前記計測信号が前記分類部によって予兆モデルに分類される予兆状態と異常モデルに分類される異常状態との境界時刻を、警報が発生した時刻に設定する処理と、前記プラントの状態量を計測した前記計測信号が前記分類部によって正常モデルに分類される正常状態と前記予兆モデルに分類される予兆状態との境界時刻を、正常状態と予兆状態との前記境界時刻から、予兆状態と異常状態の境界時刻の期間における正常状態にないカテゴリーの発生割合の最小値が予め定めた値より高くなる時刻に設定する処理をそれぞれ行うように構成されていることを特徴とする。The plant diagnosis apparatus for diagnosing the operation state of the plant based on the measurement signal obtained by measuring the state quantity from the plant of the present invention and displaying the diagnosis result on the image display apparatus measured the state quantity of the plant in the plant diagnosis apparatus. A learning means for constructing a model to be used for diagnosis using a measurement signal, and a diagnostic means for diagnosing the operating state of the plant using the model constructed by the learning means, the learning means having data having similar values A classification unit that classifies the same category, a period determination unit that evaluates a difference in the tendency of the measurement signal based on the classification result of the category in the classification unit, and determines a normal period, a precursor period, and an abnormal period, and the normal period A model constructing unit that constructs a normal model using the measurement signal of the current, and the diagnostic means classifies the measurement signal at the current time into a normal model constructed by the model constructing unit. If the measurement signal at the current time is included in the normal model, the plant is diagnosed as normal and displayed on the image display device, and the measurement signal at the current time is included in the normal model. If not, the plant is diagnosed as an unknown state that has never been experienced and displayed on the image display device, and the period determining unit provided in the learning means measures the state quantity of the plant. The process of setting the boundary time between the predictive state where the measured signal is classified into the predictive model by the classifying unit and the abnormal state classified into the abnormal model to the time when the alarm is generated, and measuring the state quantity of the plant The boundary time between the normal state in which the measured signal is classified as a normal model by the classification unit and the predictive state classified into the predictive model is determined from the boundary time between the normal state and the predictive state. Wherein the minimum value of the occurrence rate categories not in the normal state in the period of the boundary time on purpose the abnormal state is configured a process of setting the higher becomes time than a predetermined value so as to perform, respectively.
また、本発明のプラントから入力された計測信号に基づいてプラントの運転状態を診断し、診断結果を画像表示装置に表示するプラントの診断装置は、プラントの診断装置にプラントの状態量を計測した前記計測信号を用いて診断に用いるモデルを構築する学習手段と、前記学習手段で構築したモデルを用いてプラントの運転状態を診断する診断手段を備え、前記学習手段に、類似の値を持つデータを同じカテゴリーに分類する分類部と、前記分類部でのカテゴリーの分類結果に基づいて計測信号の傾向の違いを評価して正常期間、予兆期間、異常期間を決定する期間決定部と、前記正常期間の計測信号を用いて正常モデルを構築し、前記予兆期間の計測信号を用いて予兆モデルを構築し、前記異常期間の計測信号を用いて異常モデルを構築するモデル構築部を備え、前記診断手段は、現時刻の計測信号が正常モデル、予兆モデル、異常モデルのどのモデルに分類されるかを判定して、現時刻の計測信号が正常モデル、予兆モデル、異常モデルに含まれる場合はプラントが当該モデルに対応した正常、予兆、異常のうち該当する状態であると診断して画像表示装置に表示し、現時刻の計測信号が正常モデル、予兆モデル、異常モデルの何れにも含まれない場合はプラントが過去に経験したことのない未知状態であると診断して画像表示装置に表示するように構成し、
前記学習手段に設けた前記期間決定部では、
前記プラントの状態量を計測した前記計測信号が前記分類部によって予兆モデルに分類される予兆状態と異常モデルに分類される異常状態との境界時刻を、警報が発生した時刻に設定する処理と、
前記プラントの状態量を計測した前記計測信号が前記分類部によって正常モデルに分類される正常状態と前記予兆モデルに分類される予兆状態との境界時刻を、正常状態と予兆状態との前記境界時刻から、予兆状態と異常状態の境界時刻の期間における正常状態にないカテゴリーの発生割合の最小値が予め定めた値より高くなる時刻に設定する処理をそれぞれ行うように構成されていることを特徴とする。
In addition, the plant diagnosis device that diagnoses the operation state of the plant based on the measurement signal input from the plant of the present invention and displays the diagnosis result on the image display device measures the state quantity of the plant in the plant diagnosis device. The learning means for constructing a model used for diagnosis using the measurement signal, and the diagnostic means for diagnosing the operation state of the plant using the model constructed by the learning means, the learning means having data having similar values A period determining unit that evaluates a difference in the tendency of the measurement signal based on a classification result of the category in the classification unit, and determines a normal period, a predictive period, and an abnormal period, and the normal Build a normal model using the measurement signal of the period, build a sign model using the measurement signal of the sign period, and build an abnormality model using the measurement signal of the abnormal period And the diagnostic means determines whether the current time measurement signal is classified into a normal model, a predictive model, or an abnormal model, and the current time measurement signal is a normal model or a predictive model. If it is included in the abnormal model, the plant is diagnosed as being in the normal, predictive or abnormal state corresponding to the model and displayed on the image display device, and the measurement signal at the current time is the normal model, predictive model, When it is not included in any of the abnormal models, it is configured to diagnose and display on the image display device that the plant is in an unknown state that has not been experienced in the past ,
In the period determining unit provided in the learning means,
A process of setting a boundary time between a predictive state in which the measurement signal obtained by measuring the state quantity of the plant is classified into a predictive model by the classification unit and an abnormal state classified into an abnormal model, at a time when an alarm is generated,
The boundary time between the normal state where the measurement signal obtained by measuring the state quantity of the plant is classified as a normal model by the classification unit and the predictive state classified as the predictor model is the boundary time between the normal state and the predictor state. From the above, it is characterized in that each of the processing is performed to set the time when the minimum value of the occurrence ratio of the category that is not in the normal state during the boundary time period between the predictive state and the abnormal state becomes higher than a predetermined value To do.
本発明のプラントから入力された計測信号に基づいてプラントの運転状態を診断し、診断結果を表示するプラントの診断方法は、プラントの診断装置としてプラントの状態量を計測した計測信号を用いて診断に用いるモデルを構築する学習手段と、前記学習手段で構築したモデルを用いてプラントの運転状態を診断する診断手段が備えられており、プラントの状態量を計測した計測信号を学習手段に入力させ、該学習手段にて前記計測信号のうち類似の値を持つデータを同じカテゴリーに分類し、このカテゴリーの分類結果に基づいて計測信号の傾向の違いを評価して正常期間、予兆期間、異常期間をそれぞれ決定し、前記正常期間の計測信号を用いて正常モデルを構築し、前記予兆期間の計測信号を用いて予兆モデルを構築し、前記異常期間の計測信号を用いて異常モデルを構築し、プラントの状態量を計測した計測信号を診断手段に入力させ、該診断手段にて現時刻の計測信号が正常モデル、予兆モデル、異常モデルのどのモデルに分類されるかを判定して、現時刻の計測信号が正常モデル、予兆モデル、異常モデルの何れかに含まれる場合は、プラントが当該モデルに対応した正常、予兆、異常のうち該当する状態であると診断して画像表示装置に表示し、現時刻の計測信号が正常モデル、予兆モデル、異常モデルの何れにも含まれない場合はプラントが過去に経験したことのない未知状態であると診断して画像表示装置に表示し、前記プラントの状態量を計測した前記計測信号が前記学習手段によって予兆モデルに分類される予兆状態と異常モデルに分類される異常状態との境界時刻を警報が発生した時刻に設定し、前記プラントの状態量を計測した前記計測信号が前記学習手段によって正常モデルに分類される正常状態と前記予兆モデルに分類される予兆状態との境界時刻を、正常状態と予兆状態との前記境界時刻から、予兆状態と異常状態の境界時刻の期間における正常状態にないカテゴリーの発生割合の最小値が予め定めた値より高くなる時刻に設定することを特徴とする。The plant diagnosis method for diagnosing the operation state of the plant based on the measurement signal input from the plant of the present invention and displaying the diagnosis result is diagnosed using the measurement signal obtained by measuring the state quantity of the plant as a plant diagnosis device. Learning means for constructing a model used in the above and a diagnostic means for diagnosing the operation state of the plant using the model constructed by the learning means, and a measurement signal obtained by measuring the state quantity of the plant is input to the learning means. The learning means classifies data having similar values in the measurement signal into the same category, and evaluates the difference in the tendency of the measurement signal based on the classification result of this category, so that the normal period, the predictive period, and the abnormal period Determining a normal model using the measurement signal of the normal period, constructing a predictive model using the measurement signal of the predictive period, and the abnormal period An abnormal model is constructed using the measurement signals of the plant, and the measurement signal obtained by measuring the state quantity of the plant is input to the diagnosis means, and the measurement signal at the current time by the diagnosis means is any model of normal model, predictive model, and abnormal model. If the measurement signal at the current time is included in the normal model, predictor model, or abnormal model, the plant is in the normal, predictive, or abnormal state corresponding to the model. If the measurement signal at the current time is not included in any of the normal model, predictive model, and abnormal model, the plant is in an unknown state that has not been experienced in the past. Diagnosis and display on an image display device, and the measurement signal obtained by measuring the state quantity of the plant is an indication state that is classified into an indication model by the learning means and an abnormal state that is classified as an abnormality model The boundary time between the normal state in which the measurement signal obtained by setting the boundary time to the time when the alarm is generated and measuring the state quantity of the plant is classified as a normal model by the learning unit and the predictive state classified in the predictive model Is set from the boundary time between the normal state and the predictive state to a time when the minimum value of the occurrence ratio of the category not in the normal state in the period of the boundary time between the predictive state and the abnormal state is higher than a predetermined value. Features.
また、本発明のプラントから入力された計測信号に基づいてプラントの運転状態を診断し、診断結果を表示するプラントの診断方法は、プラントの診断装置としてプラントの状態量を計測した計測信号を用いて診断に用いるモデルを構築する学習手段と、前記学習手段で構築したモデルを用いてプラントの運転状態を診断する診断手段が備えられており、プラントの状態量を計測した計測信号を学習手段に入力させ、該学習手段にて前記計測信号のうち類似の値を持つデータを同じカテゴリーに分類し、このカテゴリーの分類結果に基づいて計測信号の傾向の違いを評価して正常期間、予兆期間、異常期間をそれぞれ決定し、前記正常期間の計測信号を用いて正常モデルを構築し、前記予兆期間の計測信号を用いて予兆モデルを構築し、前記異常期間の計測信号を用いて異常モデルを構築し、プラントの状態量を計測した計測信号を診断手段に入力させ、該診断手段にて現時刻の計測信号が正常モデル、予兆モデル、異常モデルのどのモデルに分類されるかを判定して、現時刻の計測信号が正常モデル、予兆モデル、異常モデルの何れかに含まれる場合は、プラントが当該モデルに対応した正常、予兆、異常のうち該当する状態であると診断して画像表示装置に表示し、現時刻の計測信号が正常モデル、予兆モデル、異常モデルの何れにも含まれない場合はプラントが過去に経験したことのない未知状態であると診断して画像表示装置に表示し、
前記プラントの状態量を計測した前記計測信号が前記学習手段によって予兆モデルに分類される予兆状態と異常モデルに分類される異常状態の境界時刻を警報が発生した時刻に設定し、
前記プラントの状態量を計測した前記計測信号が前記学習手段によって正常モデルに分類される正常状態と前記予兆モデルに分類される予兆状態との境界時刻を、任意の時間間隔でデータを区間に分割して各区間のカテゴリー出現率の変化度が予め定めた値より高くなる時刻に設定することを特徴とする。
Moreover, the plant diagnosis method for diagnosing the operation state of the plant based on the measurement signal input from the plant of the present invention and displaying the diagnosis result uses a measurement signal obtained by measuring the state quantity of the plant as a plant diagnosis device. Learning means for constructing a model to be used for diagnosis, and diagnostic means for diagnosing the operation state of the plant using the model constructed by the learning means, and the measurement signal obtained by measuring the state quantity of the plant is used as the learning means. Input, classify data having similar values among the measurement signals in the learning means in the same category, evaluate the difference in the tendency of the measurement signals based on the classification results of this category, normal period, predictive period, Determine each abnormal period, build a normal model using the measurement signal of the normal period, build a predictive model using the measurement signal of the sign period, An abnormal model is constructed using the measurement signal of the regular period, and the measurement signal obtained by measuring the state quantity of the plant is input to the diagnostic means, and the measurement signal at the current time is the normal model, predictor model, abnormal model If it is determined which model is classified, and the measurement signal at the current time is included in one of the normal model, predictive model, or abnormal model, the plant corresponds to normal, predictive, or abnormal corresponding to the model If the measurement signal at the current time is not included in any of the normal model, predictive model, and abnormal model, the plant is in an unknown state that has not been experienced in the past. Diagnose it and display it on the image display device .
The measurement signal that measures the state quantity of the plant is set to the time when an alarm occurs, the boundary time between the predictive state that is classified into a predictive model by the learning means and the abnormal state that is classified into an abnormal model,
The measurement signal obtained by measuring the state quantity of the plant divides the data into sections at an arbitrary time interval at the boundary time between the normal state classified as a normal model by the learning means and the predictive state classified as the predictor model Then, the change rate of the category appearance rate in each section is set at a time when it becomes higher than a predetermined value.
本発明によれば、プラントの状態が正常状態から異常状態に至る途中の予兆状態を検知できるプラントの診断装置及びプラントの診断方法を実現することができる。 ADVANTAGE OF THE INVENTION According to this invention, the plant diagnostic apparatus and the plant diagnostic method which can detect the precursor state in the middle of the state of a plant from a normal state to an abnormal state are realizable.
この結果、プラントが異常状態に至る前にプラントの状態変化を早期に検知することが可能なプラントの診断装置及びプラントの診断方法が得られる。 As a result, a plant diagnostic apparatus and a plant diagnostic method capable of detecting a change in the state of the plant at an early stage before the plant reaches an abnormal state are obtained.
次に、本発明の実施例であるプラントの診断装置について図面を参照して以下に説明する。 Next, a plant diagnosis apparatus according to an embodiment of the present invention will be described below with reference to the drawings.
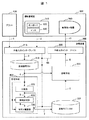
図1は、本発明の一実施例であるプラントの診断装置を説明するブロック図である。図1に示したプラントの診断装置においては、プラント100の状態を診断装置200により診断する。
診断装置200は、診断装置200を構成する演算装置として、学習手段400、及び診断手段800を備えている。この診断装置200は、データベースとして、計測信号データベース310、及び診断モデルデータベース320を備えている。なお、図1においては、データベースをDBと略記している。FIG. 1 is a block diagram illustrating a plant diagnosis apparatus according to an embodiment of the present invention. In the plant diagnosis apparatus shown in FIG. 1, the
The
前記計測信号データベース310及び診断モデルデータベース320のデータベースには、電子化された情報が記録されており、通常、電子ファイル(電子データ)と呼ばれる。
In the
前記学習手段400は、プラント100の運転状態を計測した計測信号から、プラント100の過去の運転状態の計測信号を蓄積した蓄積データを基に、正常モデル、予兆モデル、及び異常モデルをそれぞれ作成する機能を有するものである。
The
また、診断手段800は、この学習手段400で作成した正常モデル、予兆モデル及び異常モデルと、計測したプラント100の計測信号のデータとを比較して、前記計測信号のデータがどのモデルに属しているのかを判定する機能を有するものである。
前記学習手段400には、分類部500、期間決定部600、及びモデル構築部700がそれぞれ備えられている。The
The
前記分類部500は、計測信号データベース310に蓄積されているプラント100の過去の運転状態の計測信号4である蓄積した蓄積データを、類似のグループに分類する機能を有するものである。
The
前記期間決定部600は、分類部500による分類結果5と計測信号4に基づいて、プラント100の運転状態が、正常の状態、予兆の状態、或いは異常の状態となっている期間を決定する機能を有するものである。
The period determining unit 600 has a function of determining a period during which the operation state of the
前記モデル構築部700は、前記した分類部500の分類結果5、期間決定部600の基幹情報6、及び計測信号4に基づいて、正常モデル、予兆モデル、或いは異常モデルを構築する機能を有するものである。
また、診断装置200は、外部とのインターフェイスとして外部入力インターフェイス210及び外部出力インターフェイス220を備えている。The
The
そして、外部入力インターフェイス210を介してプラント100の運転状態である各種状態量を計測した計測信号1と、運転管理室900に備えられているキーボード920及びマウス930で構成される外部入力装置910の操作で作成する外部入力信号2が診断装置200に取り込まれる。また、外部出力インターフェイス220を介して、画像表示情報10を運転管理室900に備えられている画像表示装置940に出力する。
And the
なお、本実施例のプラントの診断装置においては、学習手段400、診断手段800、計測信号データベース310、診断モデルデータベース320が診断装置200の内部に備えられているが、これらの一部を診断装置200の外部に配置し、データのみをこれらの装置の間で通信するようにしてもよい。
In the plant diagnosis apparatus according to this embodiment, the
また、本実施例のプラントの診断装置において診断対象とするプラント100は1基である場合を示しているが、1台の診断装置200で複数基のプラント100を診断することも可能である。
Moreover, although the case where the number of
次に、本実施例のプラントの診断装置に備えられた診断装置200の動作を説明する。
Next, the operation of the
図1に示した本実施例のプラントの診断装置において、プラント100の各種状態量を計測した計測信号1は外部入力インターフェイス210を介して取り込まれるが、この外部入力インターフェイス210からプラント100の計測信号3として、診断装置200に設置された計測信号データベース310に保存される。
In the plant diagnosis apparatus of the present embodiment shown in FIG. 1, the
診断装置200に設置された学習手段400には、分類部500、期間決定部600、及びモデル構築部700が備えられている。
The
学習手段400では、計測信号データベース310に保存されているプラント100の各種状態量を計測した計測信号1である過去の蓄積データを、正常データ、予兆データ、異常データに分け、それぞれのデータを用いて正常モデル、予兆モデル、異常モデルを構築する機能を有している。
The
前記正常モデル、予兆モデル、異常モデルの各モデルは、学習手段400に設置された分類部500、期間決定部600、モデル構築部700を動作させることによって作成する。
The normal model, predictive model, and abnormal model are created by operating the
前記学習手段400に設置された分類部500では、計測信号データベース310に保存されている過去の蓄積データである計測信号4を、類似性を持つデータのまとまりに分類し、分類結果5として、学習手段400の期間決定部600に出力する。この分類部500の実装方法については、図3を用いて後述する。
The
前記学習手段400に設置された期間決定部600では、計測信号データベース310に保存されている過去の蓄積データである計測信号4と、分類部500による分類結果5の入力情報を用いて、計測信号4の傾向の違いを評価する。そして、この評価結果に基づいて、計測信号4のデータ期間を、正常期間、予兆期間、異常期間のいずれかに分ける。この結果は期間情報6として、学習手段400のモデル構築部700に出力する。期間決定部600の実装方法については、図5、図6を用いて後述する。
The period determination unit 600 installed in the
前記学習手段400に設置されたモデル構築部700では、前記正常期間、予兆期間、異常期間のこれらの期間についてそれぞれ正常モデル、予兆モデル、異常モデルを作成する。そして、作成したこれらの各モデルは、モデル情報7として診断モデルデータベース320に出力する。
The
前記診断装置200に設置された診断手段800では、計測信号4の入力に対して、診断モデルデータベース320の正常モデル、予兆モデル、異常モデルを参照することによってプラント100の運転状態を診断し、その診断結果9を出力する。
The diagnostic means 800 installed in the
即ち、診断手段800では、プラント100の計測信号4が診断モデルデータベース320の正常モデル、予兆モデル、異常モデルのどのモデルに属するかを判定する。その結果、プラント100の現在の運転状態が正常、予兆、異常のどの状態であるかを診断し、その診断結果9を診断表示装置940に出力して表示する。
That is, the
また、診断手段800における判定によって、プラント100の計測信号4が正常モデル、予兆モデル、異常モデルのいずれにも属さない時は、過去に経験したことのない未知状態と診断し、その診断結果9を診断表示装置940に出力して表示する。
Further, when the
また、診断手段800における診断においては、簡便な手段として、正常モデルのみを用いて、正常かそれ以外の未知状態と診断することも可能である。診断手段800の詳細は、図7を用いて後述する。
In the diagnosis by the
診断手段800が診断したプラント100の現在の運転状態に対する診断結果9は、外部出力インターフェイス220を介して、画像表示情報10として運転管理室900に設置した画像表示装置940に送信され、表示される。これにより、運転管理室900にいるオペレータに、プラント100の運転状態に対する診断結果を通知する。
The
このように、本実施例のプラントの診断装置200では、プラント100の各種状態量を計測した計測信号から診断モデルを作成するための正常データを適切に抽出し、正常モデルを構築する。正常モデルと異なる傾向のデータが入力されると、状態変化を検知できる。すなわち、異常発生前の予兆状態を検知し、プラントの状態が変化したことを、早期にオペレータに通知できる。
As described above, in the
また、診断装置200に設置された計測信号データベース310、診断モデルデータベース320に保存されている診断装置情報50は、任意に運転管理室900の画像表示装置940に表示できるようになっている。また、これらの情報は、外部入力装置910を操作して生成する外部入力信号2で、修正することができる。
The
診断装置200の動作モードは、学習モードと診断モードの2種類ある。学習モードでは、学習手段400を動作させてモデル情報7を生成し、モデル情報7を診断モデルデータベース320に保存する。
There are two types of operation modes of the diagnostic device 200: a learning mode and a diagnostic mode. In the learning mode, the
診断モードは、診断手段800を動作させて診断結果9を生成し、診断結果9に含まれる画像表示情報10を運転管理室900の画像表示装置940送信することにより、プラントの運転状態を画像表示装置940に表示する。
In the diagnosis mode, the
次に、本実施例のプラントの診断装置の動作について説明する。以下に診断装置200の動作フローチャートを、図1に示したプラントの診断装置の基本動作を示すフローチャート図である図2(a)を用いて説明する。
Next, operation | movement of the diagnostic apparatus of the plant of a present Example is demonstrated. Hereinafter, an operation flowchart of the
図2(a)のフローチャート図に示すように、診断装置200の基本動作はステップ1000、1010、1020を組み合わせて実行する。
As shown in the flowchart of FIG. 2A, the basic operation of the
まず、ステップ1000では診断装置200の動作モードが学習モードか診断モードかを判定する。そして、学習モードの場合はステップ1010に進み、診断モードの時はステップ1020に進む。
First, in step 1000, it is determined whether the operation mode of the
ステップ1010では、学習手段400を動作させてモデル構築部700によってモデル情報7を生成し、作成したモデル情報7を診断モデルデータベース320に保存する。
In step 1010, the
また、ステップ1020では、診断手段800を動作させてプラント100の運転状態である計測信号4に対する診断結果9を生成し、生成した診断結果9の含まれる画像表示情報10を画像表示装置940送信することにより、プラント100の運転状態を画像表示装置940に表示する。
In Step 1020, the
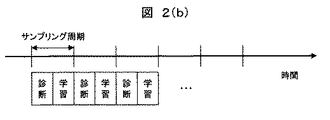
診断装置200の学習モードと診断モードを動作させるタイミングはオペレータによって任意に指定することができる。以下、図2(b)〜(d)を用いて、学習モードと診断モードを動作させるタイミングの各種の実施例をそれぞれ説明する。
The timing for operating the learning mode and the diagnostic mode of the
図2(b)に示した実施例においては、計測信号のサンプリング周期毎に学習モードと診断モードの両方を動作させて診断する。
計測信号を取得する毎に診断モデルを更新することで、常に最新のモデルを用いた診断が可能である。In the embodiment shown in FIG. 2 (b), diagnosis is performed by operating both the learning mode and the diagnostic mode at every sampling period of the measurement signal.
Diagnosis using the latest model is always possible by updating the diagnosis model every time the measurement signal is acquired.
しかし、学習に用いるデータ量が多い時は、モデル構築に時間を要するため、サンプリング周期内に計算が終了しない可能性がある。 However, when the amount of data used for learning is large, it takes time to build a model, and thus there is a possibility that the calculation does not end within the sampling period.
このような場合は、図2(c)に示した実施例のように、所定の設定期間毎に正常状態学習モードを動作させ、サンプリング周期毎に診断モードのみを動作させて診断することもできる。図2(b)及び図2(c)に示した実施例の方法では、サンプリング周期毎に診断モードが実行され、オンラインでプラントの状態を診断できる。 In such a case, as in the embodiment shown in FIG. 2 (c), the normal state learning mode can be operated every predetermined set period, and only the diagnostic mode can be operated every sampling period for diagnosis. . In the method of the embodiment shown in FIGS. 2B and 2C, the diagnosis mode is executed every sampling period, and the state of the plant can be diagnosed online.
また、図2(d)に示した実施例のように、オペレータが学習、診断を実施する外部入力信号2を診断装置200に入力することで、任意のタイミングで学習モードと診断モードを動作できる。つまり、色々な条件を変えてプラント100の運転状態を診断することが可能となる。
Further, as in the embodiment shown in FIG. 2 (d), the learning mode and the diagnostic mode can be operated at arbitrary timings by inputting an
次に、図3、図4を用いて本実施例のプラントの診断装置を構成する診断装置200を構成する学習手段400に備えた分類部500、及び診断手段800に備えた、プラント100の計測信号4を分類する機能を説明する。
Next, the measurement of the
本実施例のプラントの診断装置では、データ分類機能に適応共鳴理論(Adaptive Resonance Theory:ART)を適用した場合について述べる。尚、データ分類機能として、ベクトル量子化等、他のクラスタリング手法を用いることもできる。 In the plant diagnosis apparatus according to the present embodiment, a case where an adaptive resonance theory (ART) is applied to the data classification function will be described. Note that other clustering methods such as vector quantization can be used as the data classification function.
図3(a)に図1に示したプラントの診断装置における学習手段を構築する分類部におけるデータ分類機能の実装例を示すように、データ分類機能はデータ前処理装置510とARTモジュール520で構成する。データ前処理装置510は、運転データをARTモジュール520の入力データに変換する。前記データ前処理装置510及びARTモジュール520は、学習手段400の分類部500に設置されているものである。
As shown in FIG. 3 (a), an implementation example of the data classification function in the classification unit that constructs the learning means in the plant diagnosis apparatus shown in FIG. 1 is configured by the
以下に、前記データ前処理装置510及びARTモジュール520によるそれらの手順(工程)について説明する。
Below, those procedures (processes) by the
まず、計測項目毎に最大値及び最小値を計算する。計算した最大値及び最小値を用いてデータを正規化する。 First, the maximum value and the minimum value are calculated for each measurement item. Data is normalized using the calculated maximum and minimum values.
ここでは、正規化の方法についてプラントのプロセス量xiを例に説明する。 Here, the normalization method will be described by taking the process amount xi of the plant as an example.
xiのデータ数がN個でn番目の計測値をxi(n)とする。また、N個のデータにおける最大値及び最小値をそれぞれMax_i、Min_iとすると、正規化したデータNxi(n)は、下記式(1)で表される。 The number of data of xi is N and the nth measurement value is xi (n). Further, if the maximum value and the minimum value in N pieces of data are Max_i and Min_i, respectively, normalized data Nxi (n) is expressed by the following formula (1).
Nxi(n)=α+(1−α)×(xi(n)−Min_i)/(Max_i−Min_i) …(1)
ここで、α(0≦α<0.5)の定数であり、上記式(1)によりデータは[α、1−α]の範囲に正規化される。Nxi (n) = [alpha] + (1- [alpha]) * (xi (n) -Min_i) / (Max_i-Min_i) (1)
Here, it is a constant of α (0 ≦ α <0.5), and the data is normalized to the range of [α, 1−α] by the above equation (1).
次に、正規化したデータの補数を計算し、入力データに加える。 Next, the complement of the normalized data is calculated and added to the input data.
正規化データNxi(n)の補数CNxi(n)は、下記式(2)で計算される。 The complement CNxi (n) of the normalized data Nxi (n) is calculated by the following equation (2).
CNxi(n)=1−Nxi(n) …(2)
尚、式(1)及び式(2)の演算式は前記データ前処理装置510に組み込まれている。CNxi (n) = 1-Nxi (n) (2)
Note that the equations (1) and (2) are incorporated in the
次に、データNxi(n)及びCNxi(n)を含むデータを入力データIi(n)が、ARTモジュール520に入力される。
Next, input data Ii (n) including data Nxi (n) and CNxi (n) is input to the
以上の手順が、データ前処理装置510において行われる運転データのARTモジュール520への入力データ変換処理に含まれる。
The above procedure is included in the input data conversion processing of the operation data to the
ARTモジュール520においては、入力データであるプラント100の計測信号4を複数のカテゴリーに分類する。
In the
ARTモジュール520は、F0レイヤー521、F1レイヤー522、F2レイヤー523、メモリ524及び選択サブシステム525を備え、これらは相互に結合している。F1レイヤー522及びF2レイヤー523は、重み係数を介して結合している。重み係数は、入力データが分類されるカテゴリーのプロトタイプ(原型)を表している。ここで、プロトタイプとは、カテゴリーの代表値を表すものである。
The
次に、ARTモジュール520のアルゴリズムについて説明する。
Next, the algorithm of the
ARTモジュール520に入力データが入力された場合のアルゴリズムの概要は、下記の処理1〜処理5のようになる。
The outline of the algorithm when input data is input to the
処理1:F0レイヤー521により入力ベクトルを正規化し、ノイズを除去する。
Process 1: The input vector is normalized by the
処理2:F1レイヤー522に入力された入力データと重み係数との比較により、ふさわしいカテゴリーの候補を選択する。
Process 2: A suitable category candidate is selected by comparing the input data input to the
処理3:選択サブシステム525で選択したカテゴリーの妥当性がパラメータρとの比により評価される。妥当と判断されれば、入力データはそのカテゴリーに分類され、処理4に進む。一方、妥当と判断されなければ、そのカテゴリーはリセットされ、他のカテゴリーからふさわしいカテゴリーの候補を選択する(処理2を繰り返す)。パラメータρの値を大きくするとカテゴリーの分類が細かくなり、ρの値を小さくすると分類が粗くなる。このパラメータρをビジランス(vigilance)パラメータと呼ぶ。
Process 3: The validity of the category selected by the
処理4:処理2において全ての既存のカテゴリーがリセットされると、入力データが新規カテゴリーに属すると判断され、新規カテゴリーのプロトタイプを表す新しい重み係数を生成する。
Process 4: When all the existing categories are reset in
処理5:入力データがカテゴリーJに分類されると、カテゴリーJに対応する重み係数WJ(new)は、過去の重み係数WJ(old)及び入力データp(又は入力データから派生したデータ)を用いて下記式(3)により更新される。
WJ(new)=Kw・p+(1−Kw)・WJ(old) …(3)
ここで、Kwは、学習率パラメータ(0<Kw<1)であり、入力ベクトルを新しい重み係数に反映させる度合いを決定する値である。Process 5: When input data is classified into category J, weight coefficient WJ (new) corresponding to category J uses past weight coefficient WJ (old) and input data p (or data derived from input data). And updated by the following equation (3).
WJ (new) = Kw.p + (1-Kw) .WJ (old) (3)
Here, Kw is a learning rate parameter (0 <Kw <1), and is a value that determines the degree to which the input vector is reflected in the new weighting factor.
尚、式(3)及び後述する式(4)乃至式(14)の各演算式は前記ARTモジュール520に組み込まれている。
It should be noted that equations (3) and equations (4) to (14) described later are incorporated in the
ARTモジュール520のデータ分類アルゴリズムの特徴は、上記の処理4にある。
The characteristic of the data classification algorithm of the
処理4においては、学習した時のパターンと異なる入力データが入力された場合、記録されているパターンを変更せずに新しいパターンを記録することができる。このため、過去に学習したパターンを記録しながら、新たなパターンを記録することが可能となる。
In
このように、入力データとして予め与えた運転データを与えると、ARTモジュール520は与えられたパターンを学習する。したがって、学習済みのARTモジュール520に新たな入力データが入力されると、上記アルゴリズムにより、過去におけるどのパターンに近いかを判定することができる。また、過去に経験したことのないパターンであれば、新規カテゴリーに分類される。
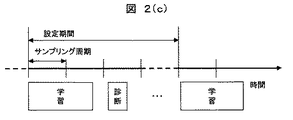
図3(b)は、F0レイヤー521の構成を示すブロック図である。F0レイヤー521では、入力データを各時刻で再度正規化し、F1レイヤー521、及び選択サブシステム525に入力する正規化ベクトルui 0を作成する。
始めに、入力データIiから、式(4)に従ってwi 0を計算する。
ここで、aは定数である。Thus, when the operation data given in advance is given as input data, the
FIG. 3B is a block diagram showing the configuration of the
First, w i 0 is calculated from the input data I i according to the equation (4).
Here, a is a constant.
![]()
![]()
次に、wi 0を正規化したxi 0を、式(5)を用いて計算する。
ここで、記号|| ||はノルムを表す記号である。Next, x i 0 obtained by normalizing w i 0 is calculated using equation (5).
Here, the symbol || || is a symbol representing the norm.
そして、式(6)を用いて、xi 0からノイズを除去したvi 0を計算する。ただし、θはノイズを除去するための定数である。式(6)の計算により、微小な値は0となるため、入力データのノイズが除去される。Then, using equation (6), to calculate the v i 0 obtained by removing noise from x i 0. However, θ is a constant for removing noise. Since the minute value becomes 0 by the calculation of the equation (6), noise of the input data is removed.
最後に、式(7)を用いて正規化入力ベクトルui 0を求める。ui 0はF1レイヤーの入力となる。Finally, a normalized input vector u i 0 is obtained using equation (7). u i 0 is input to the F1 layer.
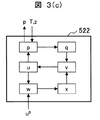
図3(c)は、F1レイヤー522の構成を示すブロック図である。F1レイヤー522では、式(7)で求めたui 0を短期記憶として保持し、F2レイヤー522に入力するpiを計算する。F2レイヤーの計算式をまとめて式(8)〜式(14)に示す。ただし、a、bは定数、f( )は式(6)で示した関数、TjはF2レイヤー522で計算する適合度である。FIG. 3C is a block diagram showing the configuration of the
![]()
![]()
![]()
![]()
![]()
![]()
![]()
![]()
![]()
![]()
ただし、 However,
次に、学習手段400の分類部500でプラント100の計測信号4をカテゴリーに分類する実例を説明する。まず、図4(a)を用いてプラント100の実施例を説明し、計測信号4に含まれる情報を述べる。次に、図4(b)及び図4(c)を用いて、計測信号4をカテゴリーに分類する様子を述べる。
Next, an example in which the
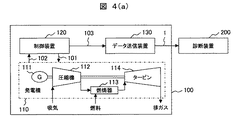
図4(a)は、プラント100の実施例である火力発電プラントを示すブロック図である。
FIG. 4A is a block diagram showing a thermal power plant that is an embodiment of the
図4(a)において、火力発電プラント100は、ガスタービン発電機110、制御装置120及びデータ送信装置130を含む。ガスタービン発電機110は、発電機111、圧縮機112、燃焼器113及びタービン114を含む。
4A, the
発電に際しては、圧縮機112にて吸い込んだ空気を圧縮して圧縮空気とし、この圧縮空気を燃焼器113に送り、燃料と混合して燃焼する。燃焼により発生した高圧ガスを用いてタービン114を回転させ、発電機111により発電を行う。
At the time of power generation, the air sucked by the
制御装置120においては、電力需要に応じてガスタービン発電機110の出力を制御する。また、制御装置120は、ガスタービン発電機110に設置されたセンサ(図示せず)で計測した運転データ102を入力データとしている。運転データ102は、吸気温度、燃料投入量、タービン排ガス温度、タービン回転数、発電機発電量、タービン軸振動などの状態量であり、サンプリング周期毎に計測している。また、大気温度などの気象情報も計測している。
In the
制御装置120においては、これらの運転データ102を用いて、ガスタービン発電機110を制御するための制御信号101を算出する。また、制御装置120では、運転データ102の値が予め設定した範囲を逸脱した時に警報を発生させる処理を実施している。警報信号は、運転データ102が予め設定した範囲を逸脱した時に1、範囲内の時は0のデジタル信号として処理する。警報信号が1の時は、音や画面表示などで、警報の内容をオペレータに通知する。
In the
信号データ送信装置130は、制御装置120で計測した運転データ102、及び制御装置120で算出した制御信号101、および警報信号を含む計測信号1を診断装置200に送信する。
The signal
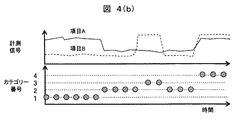
図4(b)は、プラント100から取得した計測信号1を、カテゴリーに分類した結果を説明する図である。横軸は、時間、縦軸は計測信号、カテゴリー番号である。
FIG. 4B is a diagram for explaining the result of classifying the
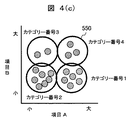
図4(c)は、プラント100の計測信号1を、図4(b)に示すようにカテゴリーに分類した結果に基づいて、更に項目分けした結果の一例を示す図である。前記図4(c)では、一例として、計測信号のうちの2項目を表示したものであり、2次元のグラフで表記した。また、縦軸及び横軸は、それぞれの項目の計測信号を規格化して示した。
FIG. 4 (c) is a diagram showing an example of the result of further classifying the
計測信号は、図3(a)のARTモジュール520によって複数のカテゴリー550(図4(c)に示す円)に分割される。1つの円が、1つのカテゴリーに相当する。
The measurement signal is divided into a plurality of categories 550 (circles shown in FIG. 4C) by the
本実施例では、計測信号は4つのカテゴリーに分類されている。カテゴリー番号1は、項目Aの値が大きく、項目Bの値が小さいグループ、カテゴリー番号2は、項目A、項目Bの値が共に小さいグループ、カテゴリー番号3は項目Aの値が小さく、項目Bの値が大きいグループ、カテゴリー番号4は項目A、項目Bの値が共に大きいグループである。
In this embodiment, measurement signals are classified into four categories.
このように、分類部500では、計測信号の類似性に着目して、計測信号をカテゴリーに分類する。
As described above, the
尚、本実施例においては、2項目の計測信号をカテゴリーに分類する例を述べたが、3項目以上の計測信号について多次元の座標を用いてカテゴリーに分類することもできる。 In this embodiment, an example in which two items of measurement signals are classified into categories has been described. However, three or more items of measurement signals can be classified into categories using multidimensional coordinates.
本実施例では、上述したように計測信号をカテゴリーに分類した結果に基づいて、正常状態、予兆状態、異常状態の期間を決定することを特徴としている。以下、これらの期間を決定する期間決定部600の動作を説明する。 The present embodiment is characterized in that the periods of normal state, predictive state, and abnormal state are determined based on the result of classifying the measurement signals into categories as described above. Hereinafter, the operation of the period determination unit 600 that determines these periods will be described.
図5(a)は、学習手段400を構成する期間決定部600の第1の実装例を説明する図である。
FIG. 5A is a diagram for explaining a first implementation example of the period determining unit 600 constituting the
まず、図5(a)を用いて、プラント100の運転状態が、正常状態と予兆状態との境界と、予兆状態と異常状態との境界を決定する方法を説明する。 First, a method for determining the boundary between the normal state and the predictive state and the boundary between the predictive state and the abnormal state will be described with reference to FIG.
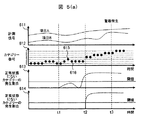
図5(a)のグラフ611はプラント100の計測信号の経時変化、グラフ612はプラント100の計測信号が分類されたカテゴリーの経時変化である。
A
グラフ613、614は、プラント100の運転状態が正常状態にないカテゴリーの発生割合の経時変化である。すなわち、グラフ613、614の値が大きいほど、プラント100の運転状態が変化したと判断できる。本実施例では、図5に示す閾値より大きい場合、プラント100の運転状態が変化したと判定することとする。
グラフ613では、プラント100の運転状態について、正常状態と予兆状態との境界を時刻t1に設定した時の結果である。すなわち、時刻t1より前に発生したカテゴリーの番号と、時刻t1以降に発生したカテゴリーの番号を比較し、その番号が異なる程度が大きいほど、値が大きくなる。また、グラフ614では、プラント100の運転状態について、正常状態と予兆状態との境界を時刻t2に設定した時の結果である。
正常状態と予兆状態の境界を時刻t1に設定した時(グラフ613参照)、時刻t1以降に正常状態にはない3番のカテゴリー615が発生しているが、その後、正常状態の2番のカテゴリー616が発生している。このような場合、3番のカテゴリーが発生した理由は、異常やその予兆の影響ではなく、計測値のノイズ等の影響であると考えられる。従って、時刻t1〜時刻t2の期間は正常状態にあると考えられる。
When the boundary between the normal state and the prognostic state is set at time t1 (see graph 613), the
一方、プラント100の運転状態について、正常状態と予兆状態との境界を時刻t2に設定した時(グラフ614参照)は、時刻t2から異常の発生を知らせる警報が発生する時刻t3までの期間、正常状態にないカテゴリーの発生割合は閾値よりも高い状態で推移する。すなわち、時刻t2を境に、プラントの運転状態が変化したと考えられる。
On the other hand, when the boundary between the normal state and the predictive state is set at time t2 (see graph 614) with respect to the operation state of the
従って時刻t2を正常状態と予兆状態との境界時刻とし、時刻t2よりも前の期間を正常状態、時刻t2から警報発生までの期間を予兆状態と考えられる。 Therefore, the time t2 is considered as the boundary time between the normal state and the predictive state, the period before the time t2 is considered as the normal state, and the period from the time t2 to the alarm occurrence is considered as the predictive state.
そこで、本実施例の期間決定部600は時刻t2を正常状態と予兆状態との境界に決定するように動作する。また、警報が発生した時刻t3を、予兆状態と異常状態との境界と決定する。 Therefore, the period determining unit 600 of this embodiment operates to determine the time t2 as the boundary between the normal state and the predictive state. Further, the time t3 when the alarm is generated is determined as the boundary between the predictive state and the abnormal state.
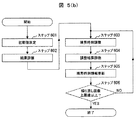
図5(a)を用いて説明したプラント100の運転状態についての正常状態と予兆状態との境界時刻と、予兆状態と異常状態との境界時刻を決定するアルゴリズムは図5(b)に示されているので、この図5(b)に示されアルゴリズムを用いて前記境界時刻を決定する方法について以下に説明する。
An algorithm for determining the boundary time between the normal state and the predictive state and the boundary time between the predictive state and the abnormal state with respect to the operating state of the
図5(b)に示すように、本アルゴリズムはステップ601、602、603、604、605、606を組み合わせて実行する。 As shown in FIG. 5B, the present algorithm is executed by combining steps 601, 602, 603, 604, 605, and 606.
まず、学習手段400の期間決定部600における処理であるステップ601では、正常状態と予兆状態の境界時刻の初期値t(0)を設定する。この初期値は任意の時刻であり、例えば乱数を用いて決定する。また、警報が発生した時刻taを、予兆状態と異常状態の境界時刻とする。次に、ステップ602では、時刻t(0)から時刻taの期間における、正常状態にないカテゴリーの発生割合の最小値Nを計算する。
First, in step 601 which is processing in the period determining unit 600 of the
次に、ステップ603では、Nと閾値αを比較して、式(15)及び式(16)を用いて正常状態と予兆状態の境界時刻を更新する。ここで、nは、本フローチャートにおけるステップ603〜606の繰り返し回数、βは定数である。 Next, in step 603, N is compared with the threshold value α, and the boundary time between the normal state and the predictive state is updated using the equations (15) and (16). Here, n is the number of repetitions of steps 603 to 606 in this flowchart, and β is a constant.
N>α t(n+1) = t(n) - β×(N-α) ・・・(15)
N≦α t(n+1) = t(n) +β×(N-α) ・・・(16)
尚、式(15)及び式(16)の各演算式は学習手段400の前記期間決定部600に組み込まれている。N> α t (n + 1) = t (n) −β × (N−α) (15)
N ≦ α t (n + 1) = t (n) + β × (N−α) (16)
It should be noted that the arithmetic expressions (15) and (16) are incorporated in the period determination unit 600 of the
ステップ604では、時刻t(n+1)から時刻taの期間における、正常状態にないカテゴリーの発生割合の最小値Nを計算する。 In step 604, the minimum value N of the occurrence ratio of categories that are not in a normal state during the period from time t (n + 1) to time ta is calculated.
ステップ605では、N>αの時には、時刻t(n+1)を正常状態と予兆状態の境界時刻として保持する。 In step 605, when N> α, the time t (n + 1) is held as the boundary time between the normal state and the predictor state.
ステップ606では、繰り返し回数nが、予め定められた繰り返し回数の上限値以下であれば、nをn+1に変更してステップ603に進む。また、nが上限値を超えた場合は、終了とする。 In step 606, if the number of repetitions n is less than or equal to a predetermined upper limit of the number of repetitions, n is changed to n + 1 and the process proceeds to step 603. If n exceeds the upper limit value, the process ends.
本フローチャートを動作させることで、ステップ601で決定した予兆状態と異常状態の境界時刻taと、ステップ605で保持している正常状態と予兆状態の境界時刻tが得られる。この動作により、図5(a)で述べたような境界時刻が得られる。 By operating this flowchart, the boundary time ta between the predictive state and the abnormal state determined at step 601 and the boundary time t between the normal state and the predictive state held at step 605 are obtained. By this operation, the boundary time as described in FIG.
また、もしN>αとなる時刻が存在しない場合は、時刻taを正常状態と予兆状態の境界時刻として、予兆状態の期間はないものとして処理する。 If there is no time at which N> α, processing is performed assuming that the time ta is a boundary time between the normal state and the predictive state and that there is no period of the predictive state.
このようにして決定した時刻で構成する期間情報6が、期間決定部600からモデル構築部700に送信される。
The
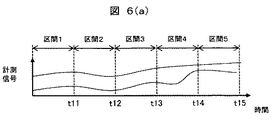
図6(a)は、学習手段400を構成する期間決定部600の第2の実装例を説明する図であって、任意の時間間隔でデータを区間に分割する状況を示した説明図である。
FIG. 6A is a diagram illustrating a second implementation example of the period determining unit 600 constituting the
本実施例では、学習手段400の期間決定部600によって、まず、図6(a)に示すように、任意の時間間隔でデータを区間に分割する。
In this embodiment, the period determining unit 600 of the
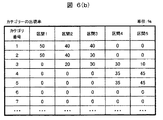
図6(b)は、図6(a)に示された分割した区間毎にカテゴリーの出現率Eを表した説明図であり、次に、学習手段400の分類部500で分類した結果を用いて、データを分割した区間毎にカテゴリーの出現率Eを、図6(b)に示した如く求める。
そして、直前の区間と、カテゴリーの出現率Eを用いて式(17)で変化度Vを計算する。尚、E(p、m)は、区間pのカテゴリー番号mの出現率、Σはカテゴリー番号mを1からカテゴリー番号の最大値まで変化させた時の総和を計算することを意味する。FIG. 6B is an explanatory diagram showing the appearance rate E of the category for each divided section shown in FIG. 6A. Next, the result classified by the
Then, the degree of change V is calculated by Expression (17) using the immediately preceding section and the category appearance rate E. E (p, m) means the appearance rate of the category number m in the interval p, and Σ means calculating the sum when the category number m is changed from 1 to the maximum value of the category number.
V = Σ(E(p、m) - E(p-1、m))2 ・・・(17)
尚、式(17)の演算式は学習手段400の前記期間決定部600に組み込まれている。V = Σ (E (p, m) −E (p−1, m)) 2 (17)
In addition, the arithmetic expression of Expression (17) is incorporated in the period determining unit 600 of the
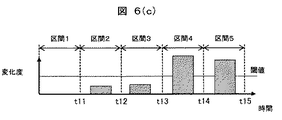
図6(c)は、図6(a)に示された分割した区間毎の変化度Vを計算した結果を示した説明図である。
図6(a)〜 図6(c)に示した説明図から理解できるように、計測信号の傾向が変化してカテゴリーの出現率が異なると、変化度Vが大きくなる。すなわち、変化度Vが大きいことは、プラントの運転状態が変化していることを意味する。従って、変化度Vを指標にプラント状態の変化を検知できる。FIG. 6C is an explanatory diagram showing a result of calculating the degree of change V for each of the divided sections shown in FIG.
As can be understood from the explanatory diagrams shown in FIGS. 6A to 6C, when the tendency of the measurement signal changes and the appearance rate of the category differs, the degree of change V increases. That is, a large change degree V means that the operating state of the plant is changing. Therefore, a change in the plant state can be detected using the degree of change V as an index.
そこで、本実施例では変化度Vが閾値を越えた時の時刻t13を、正常状態と予兆状態の境界時刻とする。また、予兆状態と異常状態の境界時刻は、図5(a)〜 図5(b)で説明した方法で決定する。 Therefore, in this embodiment, the time t13 when the degree of change V exceeds the threshold is set as the boundary time between the normal state and the predictive state. Further, the boundary time between the predictor state and the abnormal state is determined by the method described with reference to FIGS. 5 (a) to 5 (b).
このように、本発明では自動的に正常状態と予兆状態の境界時刻と、予兆状態と異常状態の境界時刻を求め、正常期間、予兆期間、異常期間を決定する。オペレータがこれらの期間を設定する必要がないため、診断装置適用に要する労力は少なくてすむ。 Thus, in the present invention, the boundary time between the normal state and the predictor state and the boundary time between the predictor state and the abnormal state are automatically obtained, and the normal period, the predictor period, and the abnormal period are determined. Since it is not necessary for the operator to set these periods, the labor required for applying the diagnostic apparatus can be reduced.
図7は、図1に示した本実施例のプラントの診断装置における診断手段800の動作を説明する図である。 FIG. 7 is a diagram for explaining the operation of the diagnostic means 800 in the plant diagnostic apparatus of the present embodiment shown in FIG.
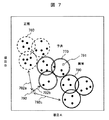
正常期間のデータをカテゴリーに分類した結果(=正常モデル、図中の点線で囲った円、カテゴリー760)、予兆期間のデータをカテゴリーに分類した結果(=予兆モデル、図中の二重線で囲った円、カテゴリー770)、異常期間のデータをカテゴリーに分類した結果(=異常モデル、図中の太線で囲った円、カテゴリー780)について、診断手段800では、計測信号が、どのモデルに属するかを判定し、プラントの運転状態を診断する。 Results of normal period data classified into categories (= normal model, circle surrounded by dotted line in category, category 760), results of classification of predictive period data into categories (= predictive model, double line in diagram) With respect to the result of classifying the data of the enclosed circle (category 770) and the abnormal period into the category (= abnormal model, circle surrounded by a thick line in the figure, category 780), the diagnostic means 800 uses which model the measurement signal belongs to. To determine the operating state of the plant.
図7において、計測信号をプロットした結果の例が、データ点791、792である。
In FIG. 7,
例えば、データ点791は、予兆モデル770に属するので、「予兆状態」であると診断する。 一方、データ点792は、どのモデルにも属さないので、「過去に経験したことのない未知状態」と診断する。
For example, since the
このように、診断手段800では、プラントの運転状態を正常状態、予兆状態、異常状態、未知状態のいずれかに診断することができる。
As described above, the
また、診断手段800を動作させる際、正常モデルに属するかどうかのみを判定し、正常モデルに属さない場合は未知状態と診断することもできる。未知状態であることは、プラントの状態が正常ではないので、プラントの状態が変化したことを意味する。
Further, when operating the
この方法では、異常状態と予兆状態の期間のデータを除外した計測信号を用いて正常モデルを構築して診断する。そのため、異常の予兆が計測信号に現れれば新規カテゴリーが発生し、プラントの状態変化を検知できる。 In this method, a normal model is constructed and diagnosed using measurement signals excluding data in periods of abnormal states and predictive states. For this reason, if a sign of abnormality appears in the measurement signal, a new category is generated, and a change in the state of the plant can be detected.
未知状態である時は、各モデルの距離を計算し、その距離が一番短いモデルに分類することも可能である。つまり、データ点と最も近いモデルに分類する。 When in an unknown state, it is possible to calculate the distance of each model and classify it into the model with the shortest distance. That is, the model is classified into the model closest to the data point.
例えば、図7において、データ点と正常モデル760との距離792aと、予兆モデル770との距離792bと、異常モデル780との距離792cを比較する。そして、距離が最も短いモデル(予兆モデル770)に分類する。これにより、過去に経験したことのない未知状態であっても、どの状態に近いかを判定することができ、この情報をオペレータに提供できる。
For example, in FIG. 7, the
図8(a)、図8(b)、図8(c)は、図1に示したプラントの診断装置における計測信号データベース310と、診断モデルデータベース320に保存される2種類のデータの態様をそれぞれ示したものである。これらの図は、図1の画像表示装置940に表示できる。
8 (a), 8 (b), and 8 (c) show two modes of data stored in the
図8(a)に示すように、計測信号データベース310には、プラント100に対して計測した運転データである計測信号1(図では、データ項目A、B、Cを記載)の値が、サンプリング周期(縦軸の時刻)毎に保存される。
As shown in FIG. 8 (a), in the
表示画面311において縦横に移動可能なスクロールボックス312及び313を用いることにより、広範囲のデータをスクロール表示することができる。
By using
図8(b)、及び図8(c)は、図1の診断モデルデータベース320に保存されるデータの態様をそれぞれ説明する図である。
FIG. 8B and FIG. 8C are diagrams for explaining modes of data stored in the
図8(b)には、診断モデルデータベース(1)におけるカテゴリー番号と重み係数との関係が、図8(c)には診断モデルデータベース(2)における時刻とその時刻におけるデータが分類されたカテゴリー番号との関係が保存されており、それぞれ画面321、325のように表示される。
FIG. 8B shows the relationship between the category number and the weighting factor in the diagnostic model database (1), and FIG. 8C shows the category in which the time in the diagnostic model database (2) and the data at that time are classified. Relations with numbers are stored and displayed as
ここで、重み係数とは、カテゴリーの中心座標のことである。重み係数は、図8(b)に示すように、正常モデル(322a、322b)、予兆モデル(322c)、異常モデル(322d)毎に作成される。 Here, the weighting factor is the center coordinate of the category. As shown in FIG. 8B, the weighting coefficient is created for each normal model (322a, 322b), predictive model (322c), and abnormal model (322d).
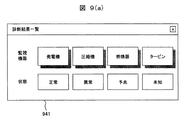
図9(a)及び図9(b)は、図1に示したプラントの診断装置における運転管理室900に設置された画像表示装置940に表示したプラントの診断結果の画面を説明する図である。
FIGS. 9A and 9B are diagrams for explaining screens of plant diagnosis results displayed on the
図9(a)は、画像表示装置940に診断結果(プラントの運転状態)を一覧で表示した説明図であり、この図9(a)に示すように、プラントの診断結果(プラントの運転状態)を一覧で表示してオペレータに診断結果を通知する。これにより、オペレータはプラントの運転状態を容易に把握でき、必要に応じて対策を講じることができる。
FIG. 9A is an explanatory diagram in which diagnosis results (plant operation states) are displayed in a list on the
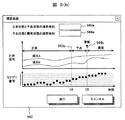
また、図9(b)は、図1に示したプラントの診断装置に設けた学習手段構成する期間決定部によって決定した正常状態と予兆状態の境界時刻tA、予兆状態と異常状態の境界時刻tBをデフォルト値として表示した説明図であり、この図9(b)に示すように、プラントの診断装置における学習手段400を構成する期間決定部600で決定した正常状態と予兆状態の境界時刻tA、予兆状態と異常状態の境界時刻tBをデフォルト値として表示する。正常状態、予兆状態、異常状態の期間と、計測信号、分類結果を同時に表示することで、期間決定部600の動作結果を容易に確認できる。
FIG. 9B shows the boundary time tA between the normal state and the predictive state, and the boundary time tB between the predictive state and the abnormal state determined by the period determining unit constituting the learning means provided in the plant diagnosis apparatus shown in FIG. As a default value, as shown in FIG. 9 (b), the boundary time tA between the normal state and the predictive state determined by the period determining unit 600 constituting the
また、正常状態、予兆状態、異常状態の期間を、キーボード920とマウス930で構成される外部入力装置910を操作して発生させる外部入力信号2を用いて修正することもできる。すなわち、画面942上で、正常状態と予兆状態の境界時刻が表示される欄943a、予兆状態と異常状態の境界時刻が表示される欄944aに修正した時刻をキーボード920を用いて入力し、実行ボタンを押すことで、期間情報6を修正できる。
In addition, the periods of the normal state, the predictive state, and the abnormal state can be corrected by using the
また、正常状態と予兆状態の境界ライン943b、予兆状態と異常状態の境界ライン943bをマウス930でドラッグしてラインの位置を修正し、実行ボタンを押すことにより、期間情報6を修正することもできる。オペレータの豊富な経験に基づいて期間情報6を決定することで、診断の確度を向上できる可能性がある。本実施例の診断装置は、上述した修正を実施できるようになっている。
In addition, the
なお、本発明は上記した実施例に限定されるものではなく、様々な変形例が含まれる。例えば、上記した実施例は本発明をわかりやすく説明するために詳細に記載したものであり、必ずしも説明したすべての構成を備えるものに限定されるものではない。 In addition, this invention is not limited to an above-described Example, Various modifications are included. For example, the above-described embodiments are described in detail for easy understanding of the present invention, and are not necessarily limited to those having all the configurations described.
また、上記の各構成、機能、処理部、処理手段等は、それらの一部又は全部を集積回路で設計する等によりハードウェアで実現してもよい。また上記の各構成、機能等は、プロセッサがそれぞれの機能を実現するプログラムを解釈し、実行するソフトウェアで実現してもよい。各機能を実現するプログラム、テーブル、ファイル、計測値、算出情報等の情報は、メモリやハードディスク等の記憶装置、またはICカード、SDカード、DVD等の記憶媒体に置くことができる。よって、各処理、各構成は処理ユニットやプログラムモジュールとして実現可能である。 Each of the above-described configurations, functions, processing units, processing means, and the like may be realized by hardware by designing a part or all of them with an integrated circuit. Each of the above-described configurations, functions, and the like may be realized by software that interprets and executes a program that realizes each function. Information such as programs, tables, files, measurement values, and calculation information for realizing each function can be stored in a storage device such as a memory or a hard disk, or a storage medium such as an IC card, an SD card, or a DVD. Therefore, each process and each configuration can be realized as a processing unit or a program module.
また、情報線は説明上必要と考えられるものを示しており、製品上必ずしもすべての制御線や情報線を示しているとは限らない。実際には、ほとんど全ての厚生が相互に接続されていると考えてもよい。
本実施例によれば、プラントの状態が正常状態から異常状態に至る途中の予兆状態を検知できるプラントの診断装置及びプラントの診断方法を実現することができる。この結果、プラントが異常状態に至る前にプラントの状態変化を早期に検知することが可能なプラントの診断装置及びプラントの診断方法が得られる。In addition, information lines indicate what is considered necessary for the explanation, and not all control lines and information lines on the product are necessarily shown. In fact, you may think that almost all welfare is connected to each other.
According to the present embodiment, it is possible to realize a plant diagnostic apparatus and a plant diagnostic method that can detect a sign state in the middle of a plant state from a normal state to an abnormal state. As a result, a plant diagnostic apparatus and a plant diagnostic method capable of detecting a change in the state of the plant at an early stage before the plant reaches an abnormal state are obtained.
本発明は、プラントの診断装置及びプラントの診断方法として各種プラント等に広く適用可能である。 The present invention is widely applicable to various plants and the like as a plant diagnosis apparatus and a plant diagnosis method.
1:計測信号、2:外部入力信号、3:計測信号、4:計測信号、5:分類結果、6:期間情報、7:モデル情報、8:モデル情報、9:診断結果、10:画面表示情報、50:診断装置情報、100:プラント、200:診断装置、210:外部入力インターフェイス、220:外部出力インターフェイス、310:計測信号データベース、320:診断モデルデータベース、400:学習手段、500:分類部、600:期間決定部、700:モデル構築部、800:診断手段、900:運転管理室、910:外部入力装置、920:キーボード、930:マウス、940:画像表示装置。 1: Measurement signal, 2: External input signal, 3: Measurement signal, 4: Measurement signal, 5: Classification result, 6: Period information, 7: Model information, 8: Model information, 9: Diagnosis result, 10: Screen display Information: 50: Diagnostic device information, 100: Plant, 200: Diagnostic device, 210: External input interface, 220: External output interface, 310: Measurement signal database, 320: Diagnostic model database, 400: Learning means, 500: Classification unit , 600: period determination unit, 700: model construction unit, 800: diagnostic means, 900: operation management room, 910: external input device, 920: keyboard, 930: mouse, 940: image display device.
Claims (6)
プラントの診断装置にプラントの状態量を計測した前記計測信号を用いて診断に用いるモデルを構築する学習手段と、前記学習手段で構築したモデルを用いてプラントの運転状態を診断する診断手段を備え、
前記学習手段に、類似の値を持つデータを同じカテゴリーに分類する分類部と、前記分類部でのカテゴリーの分類結果に基づいて計測信号の傾向の違いを評価して正常期間、予兆期間、異常期間を決定する期間決定部と、前記正常期間の計測信号を用いて正常モデルを構築し、前記予兆期間の計測信号を用いて予兆モデルを構築し、前記異常期間の計測信号を用いて異常モデルを構築するモデル構築部を備え、
前記診断手段は、現時刻の計測信号が正常モデル、予兆モデル、異常モデルのどのモデルに分類されるかを判定して、現時刻の計測信号が正常モデル、予兆モデル、異常モデルに含まれる場合はプラントが当該モデルに対応した正常、予兆、異常のうち該当する状態であると診断して画像表示装置に表示し、現時刻の計測信号が正常モデル、予兆モデル、異常モデルの何れにも含まれない場合はプラントが過去に経験したことのない未知状態であると診断して画像表示装置に表示するように構成し、
前記学習手段に設けた前記期間決定部では、
前記プラントの状態量を計測した前記計測信号が前記分類部によって予兆モデルに分類される予兆状態と異常モデルに分類される異常状態との境界時刻を、警報が発生した時刻に設定する処理と、
前記プラントの状態量を計測した前記計測信号が前記分類部によって正常モデルに分類される正常状態と前記予兆モデルに分類される予兆状態との境界時刻を、正常状態と予兆状態との前記境界時刻から、予兆状態と異常状態の境界時刻の期間における正常状態にないカテゴリーの発生割合の最小値が予め定めた値より高くなる時刻に設定する処理をそれぞれ行うように構成されていることを特徴とするプラントの診断装置。 In the plant diagnosis device that diagnoses the operation state of the plant based on the measurement signal input from the plant and displays the diagnosis result on the image display device,
The plant diagnostic device includes a learning unit that builds a model used for diagnosis using the measurement signal obtained by measuring the state quantity of the plant, and a diagnostic unit that diagnoses the operating state of the plant using the model built by the learning unit. ,
The learning means classifies the data having similar values into the same category, and evaluates the difference in the tendency of the measurement signal based on the classification result of the category in the classification unit, normal period, predictive period, abnormal A period determination unit that determines a period, and a normal model is constructed using the measurement signal of the normal period, a sign model is constructed using the measurement signal of the sign period, and an abnormality model is formed using the measurement signal of the abnormal period Equipped with a model building part to build
The diagnosis means determines whether the measurement signal at the current time is classified into a normal model, a predictive model, or an abnormal model, and the measurement signal at the current time is included in the normal model, the predictive model, or the abnormal model Indicates that the plant is in the normal, predictive, or abnormal state corresponding to the model and displays it on the image display device. The measurement signal at the current time is included in any of the normal, predictive, and abnormal models. If not, it is configured to diagnose and display on the image display device that the plant is in an unknown state that has not been experienced in the past,
In the period determining unit provided in the learning means,
A process of setting a boundary time between a predictive state in which the measurement signal obtained by measuring the state quantity of the plant is classified into a predictive model by the classification unit and an abnormal state classified into an abnormal model, at a time when an alarm is generated,
The boundary time between the normal state where the measurement signal obtained by measuring the state quantity of the plant is classified as a normal model by the classification unit and the predictive state classified as the predictor model is the boundary time between the normal state and the predictor state. From the above, it is characterized in that each of the processing is performed to set the time when the minimum value of the occurrence ratio of the category that is not in the normal state during the boundary time period between the predictive state and the abnormal state becomes higher than a predetermined value. Plant diagnostic equipment
プラントの診断装置にプラントの状態量を計測した前記計測信号を用いて診断に用いるモデルを構築する学習手段と、前記学習手段で構築したモデルを用いてプラントの運転状態を診断する診断手段を備え、
前記学習手段に、類似の値を持つデータを同じカテゴリーに分類する分類部と、前記分類部でのカテゴリーの分類結果に基づいて計測信号の傾向の違いを評価して正常期間、予兆期間、異常期間を決定する期間決定部と、前記正常期間の計測信号を用いて正常モデルを構築し、前記予兆期間の計測信号を用いて予兆モデルを構築し、前記異常期間の計測信号を用いて異常モデルを構築するモデル構築部を備え、
前記診断手段は、現時刻の計測信号が正常モデル、予兆モデル、異常モデルのどのモデルに分類されるかを判定して、現時刻の計測信号が正常モデル、予兆モデル、異常モデルに含まれる場合はプラントが当該モデルに対応した正常、予兆、異常のうち該当する状態であると診断して画像表示装置に表示し、現時刻の計測信号が正常モデル、予兆モデル、異常モデルの何れにも含まれない場合はプラントが過去に経験したことのない未知状態であると診断して画像表示装置に表示するように構成し、
前記学習手段に設けた前記期間決定部では、
前記プラントの状態量を計測した前記計測信号が前記分類部によって予兆モデルに分類される予兆状態と異常モデルに分類される異常状態との境界時刻を、警報が発生した時刻に設定する処理と、
前記プラントの状態量を計測した前記計測信号が前記分類部によって正常モデルに分類される正常状態と前記予兆状態との境界時刻を、任意の時間間隔でデータを区間に分割し、各区間のカテゴリー出現率の変化度が、予め定めた値より高くなる時刻に設定する処理をそれぞれ行うように構成されていることを特徴とするプラントの診断装置。 In the plant diagnosis device that diagnoses the operation state of the plant based on the measurement signal input from the plant and displays the diagnosis result on the image display device,
The plant diagnostic device includes a learning unit that builds a model used for diagnosis using the measurement signal obtained by measuring the state quantity of the plant, and a diagnostic unit that diagnoses the operating state of the plant using the model built by the learning unit. ,
The learning means classifies the data having similar values into the same category, and evaluates the difference in the tendency of the measurement signal based on the classification result of the category in the classification unit, normal period, predictive period, abnormal A period determination unit that determines a period, and a normal model is constructed using the measurement signal of the normal period, a sign model is constructed using the measurement signal of the sign period, and an abnormality model is formed using the measurement signal of the abnormal period Equipped with a model building part to build
The diagnosis means determines whether the measurement signal at the current time is classified into a normal model, a predictive model, or an abnormal model, and the measurement signal at the current time is included in the normal model, the predictive model, or the abnormal model Indicates that the plant is in the normal, predictive, or abnormal state corresponding to the model and displays it on the image display device. The measurement signal at the current time is included in any of the normal, predictive, and abnormal models. If not, it is configured to diagnose and display on the image display device that the plant is in an unknown state that has not been experienced in the past ,
In the period determining unit provided in the learning means,
A process of setting a boundary time between a predictive state in which the measurement signal obtained by measuring the state quantity of the plant is classified into a predictive model by the classification unit and an abnormal state classified into an abnormal model, at a time when an alarm is generated,
The measurement signal obtained by measuring the state quantity of the plant is divided into normal intervals by which the classification unit classifies the normal state and the predictive state, and the data is divided into intervals at arbitrary time intervals. A plant diagnosis apparatus, characterized in that it is configured to perform processing for setting a time at which a change rate of an appearance rate is higher than a predetermined value.
前記プラントの診断装置に、プラントの状態量を計測した計測信号の経時変化と、 前記学習手段に設けた分類部によってカテゴリーに分類した結果の経時変化と、前記学習手段に設けた期間決定部によって設定された正常状態と予兆状態との境界時刻、及び予兆状態と異常状態との境界時刻を画面上にそれぞれ表示し、In the plant diagnosis device, the change over time of the measurement signal obtained by measuring the state quantity of the plant, the change over time of the result of classification into categories by the classification unit provided in the learning unit, and the period determination unit provided in the learning unit The boundary time between the set normal state and predictive state and the boundary time between the predictive state and abnormal state are displayed on the screen, respectively.
マウスとキーボードからなる外部入力装置からの外部入力信号に基づいて正常状態と予兆状態との境界時刻と、予兆状態と異常状態との境界時刻を変更可能なように構成されていることを特徴とするプラントの診断装置。Based on an external input signal from an external input device consisting of a mouse and a keyboard, the boundary time between the normal state and the predictive state and the boundary time between the predictive state and the abnormal state can be changed. Plant diagnostic equipment
プラントの診断装置としてプラントの状態量を計測した計測信号を用いて診断に用いるモデルを構築する学習手段と、前記学習手段で構築したモデルを用いてプラントの運転状態を診断する診断手段が備えられており、As a plant diagnosis apparatus, a learning means for constructing a model used for diagnosis using a measurement signal obtained by measuring a state quantity of the plant, and a diagnosis means for diagnosing the operation state of the plant using the model constructed by the learning means are provided. And
プラントの状態量を計測した計測信号を学習手段に入力させ、該学習手段にて前記計測信号のうち類似の値を持つデータを同じカテゴリーに分類し、このカテゴリーの分類結果に基づいて計測信号の傾向の違いを評価して正常期間、予兆期間、異常期間をそれぞれ決定し、前記正常期間の計測信号を用いて正常モデルを構築し、前記予兆期間の計測信号を用いて予兆モデルを構築し、前記異常期間の計測信号を用いて異常モデルを構築し、A measurement signal obtained by measuring the state quantity of the plant is input to a learning unit, and the learning unit classifies data having similar values among the measurement signals into the same category. Based on the classification result of this category, Assessing the difference in tendency to determine the normal period, the predictive period, and the abnormal period respectively, constructing a normal model using the measurement signal of the normal period, constructing a predictive model using the measurement signal of the predictive period, Build an abnormal model using the measurement signal of the abnormal period,
プラントの状態量を計測した計測信号を診断手段に入力させ、該診断手段にて現時刻の計測信号が正常モデル、予兆モデル、異常モデルのどのモデルに分類されるかを判定して、現時刻の計測信号が正常モデル、予兆モデル、異常モデルの何れかに含まれる場合は、プラントが当該モデルに対応した正常、予兆、異常のうち該当する状態であると診断して画像表示装置に表示し、現時刻の計測信号が正常モデル、予兆モデル、異常モデルの何れにも含まれない場合はプラントが過去に経験したことのない未知状態であると診断して画像表示装置に表示し、A measurement signal obtained by measuring the state quantity of the plant is input to a diagnosis unit, and the diagnosis unit determines whether the measurement signal at the current time is classified into a normal model, a predictive model, or an abnormal model, and the current time If the measured signal is included in one of the normal model, predictive model, or abnormal model, the plant is diagnosed as being in the normal, predictive, or abnormal state corresponding to the model and displayed on the image display device. If the measurement signal at the current time is not included in any of the normal model, predictor model, and abnormal model, the plant is diagnosed as an unknown state that has not been experienced in the past, and is displayed on the image display device.
前記プラントの状態量を計測した前記計測信号が前記学習手段によって予兆モデルに分類される予兆状態と異常モデルに分類される異常状態との境界時刻を警報が発生した時刻に設定し、The measurement signal that measures the state quantity of the plant is set to the time when the alarm occurs, the boundary time between the predictive state that is classified into the predictive model by the learning means and the abnormal state that is classified into the abnormal model,
前記プラントの状態量を計測した前記計測信号が前記学習手段によって正常モデルに分類される正常状態と前記予兆モデルに分類される予兆状態との境界時刻を、正常状態と予兆状態との前記境界時刻から、予兆状態と異常状態の境界時刻の期間における正常状態にないカテゴリーの発生割合の最小値が予め定めた値より高くなる時刻に設定することを特徴とするプラントの診断方法。The boundary time between the normal state in which the measurement signal obtained by measuring the state quantity of the plant is classified as a normal model by the learning unit and the predictive state classified in the predictor model is the boundary time between the normal state and the predictor state. From the above, the plant diagnosis method is characterized in that the minimum value of the occurrence ratio of the category that is not in the normal state during the boundary time period between the predictive state and the abnormal state is set to a time that is higher than a predetermined value.
プラントの診断装置としてプラントの状態量を計測した計測信号を用いて診断に用いるモデルを構築する学習手段と、前記学習手段で構築したモデルを用いてプラントの運転状態を診断する診断手段が備えられており、As a plant diagnosis apparatus, a learning means for constructing a model used for diagnosis using a measurement signal obtained by measuring a state quantity of the plant, and a diagnosis means for diagnosing the operation state of the plant using the model constructed by the learning means are provided. And
プラントの状態量を計測した計測信号を学習手段に入力させ、該学習手段にて前記計測信号のうち類似の値を持つデータを同じカテゴリーに分類し、このカテゴリーの分類結果に基づいて計測信号の傾向の違いを評価して正常期間、予兆期間、異常期間をそれぞれ決定し、前記正常期間の計測信号を用いて正常モデルを構築し、前記予兆期間の計測信号を用いて予兆モデルを構築し、前記異常期間の計測信号を用いて異常モデルを構築し、A measurement signal obtained by measuring the state quantity of the plant is input to a learning unit, and the learning unit classifies data having similar values among the measurement signals into the same category. Based on the classification result of this category, Assessing the difference in tendency to determine the normal period, the predictive period, and the abnormal period respectively, constructing a normal model using the measurement signal of the normal period, constructing a predictive model using the measurement signal of the predictive period, Build an abnormal model using the measurement signal of the abnormal period,
プラントの状態量を計測した計測信号を診断手段に入力させ、該診断手段にて現時刻の計測信号が正常モデル、予兆モデル、異常モデルのどのモデルに分類されるかを判定して、現時刻の計測信号が正常モデル、予兆モデル、異常モデルの何れかに含まれる場合は、プラントが当該モデルに対応した正常、予兆、異常のうち該当する状態であると診断して画像表示装置に表示し、現時刻の計測信号が正常モデル、予兆モデル、異常モデルの何れにも含まれない場合はプラントが過去に経験したことのない未知状態であると診断して画像表示装置に表示し、A measurement signal obtained by measuring the state quantity of the plant is input to a diagnosis unit, and the diagnosis unit determines whether the measurement signal at the current time is classified into a normal model, a predictive model, or an abnormal model, and the current time If the measured signal is included in one of the normal model, predictive model, or abnormal model, the plant is diagnosed as being in the normal, predictive, or abnormal state corresponding to the model and displayed on the image display device. If the measurement signal at the current time is not included in any of the normal model, predictor model, and abnormal model, the plant is diagnosed as an unknown state that has not been experienced in the past, and is displayed on the image display device.
前記プラントの状態量を計測した前記計測信号が前記学習手段によって予兆モデルに分類される予兆状態と異常モデルに分類される異常状態の境界時刻を警報が発生した時刻に設定し、The measurement signal that measures the state quantity of the plant is set to the time when an alarm occurs, the boundary time between the predictive state that is classified into a predictive model by the learning means and the abnormal state that is classified into an abnormal model,
前記プラントの状態量を計測した前記計測信号が前記学習手段によって正常モデルに分類される正常状態と前記予兆モデルに分類される予兆状態との境界時刻を、任意の時間間隔でデータを区間に分割して各区間のカテゴリー出現率の変化度が予め定めた値より高くなる時刻に設定することを特徴とするプラントの診断方法。The measurement signal obtained by measuring the state quantity of the plant divides the data into sections at an arbitrary time interval at the boundary time between the normal state classified as a normal model by the learning means and the predictive state classified as the predictor model Then, the plant diagnosis method is characterized in that it is set at a time when the degree of change in the category appearance rate in each section becomes higher than a predetermined value.
プラントの診断装置に、プラントの状態量を計測した計測信号の経時変化と、前記学習手段によってカテゴリーに分類した結果の経時変化と、前記学習手段によって設定された正常状態と予兆状態との境界時刻、及び予兆状態と異常状態との境界時刻を画面上にそれぞれ表示し、In the plant diagnosis device, the change over time of the measurement signal obtained by measuring the state quantity of the plant, the change over time of the result classified into the category by the learning means, and the boundary time between the normal state and the predictive state set by the learning means , And the boundary time between the predictive state and abnormal state are displayed on the screen,
マウスとキーボードからなる外部入力装置からの外部入力信号に基づいて正常状態と予兆状態との境界時刻と、予兆状態と異常状態との境界時刻を変更可能にしていることを特徴とするプラントの診断方法。A plant diagnosis characterized in that the boundary time between the normal state and the predictive state and the boundary time between the predictive state and the abnormal state can be changed based on an external input signal from an external input device including a mouse and a keyboard. Method.
Applications Claiming Priority (1)
| Application Number | Priority Date | Filing Date | Title |
|---|---|---|---|
| PCT/JP2010/007025 WO2012073289A1 (en) | 2010-12-02 | 2010-12-02 | Plant diagnostic device and plant diagnostic method |
Publications (2)
| Publication Number | Publication Date |
|---|---|
| JP5484591B2 true JP5484591B2 (en) | 2014-05-07 |
| JPWO2012073289A1 JPWO2012073289A1 (en) | 2014-05-19 |
Family
ID=46171280
Family Applications (1)
| Application Number | Title | Priority Date | Filing Date |
|---|---|---|---|
| JP2012546576A Expired - Fee Related JP5484591B2 (en) | 2010-12-02 | 2010-12-02 | PLANT DIAGNOSIS DEVICE AND PLANT DIAGNOSIS METHOD |
Country Status (2)
| Country | Link |
|---|---|
| JP (1) | JP5484591B2 (en) |
| WO (1) | WO2012073289A1 (en) |
Cited By (7)
| Publication number | Priority date | Publication date | Assignee | Title |
|---|---|---|---|---|
| KR20160006281A (en) * | 2014-07-08 | 2016-01-19 | 주식회사 글로비즈 | Monitoring method and system |
| US10281909B2 (en) | 2013-07-10 | 2019-05-07 | Globiz Co., Ltd. | Signal measuring/diagnosing system, and method for applying the same to individual devices |
| EP3454289A4 (en) * | 2016-05-04 | 2020-03-04 | Doosan Heavy Industries & Construction Co., Ltd. | METHOD AND SYSTEM FOR DETECTION OF PLANT ABNORMALITIES |
| JP7166395B1 (en) | 2021-06-23 | 2022-11-07 | セイコーソリューションズ株式会社 | MONITORING SYSTEM, MONITORING METHOD, AND MONITORING PROGRAM |
| CN115552345A (en) * | 2020-05-28 | 2022-12-30 | 三菱电机株式会社 | Device state monitoring apparatus and device state monitoring method |
| JP2024100928A (en) * | 2019-12-10 | 2024-07-26 | キヤノン株式会社 | Information processing method, information processing device, production system, product manufacturing method, program, and recording medium |
| JP2024114223A (en) * | 2023-02-13 | 2024-08-23 | 横河電機株式会社 | Diagnostic device, diagnostic program, diagnostic method, and diagnostic system |
Families Citing this family (20)
| Publication number | Priority date | Publication date | Assignee | Title |
|---|---|---|---|---|
| CN107209508B (en) * | 2015-01-21 | 2018-08-28 | 三菱电机株式会社 | Information processing unit and information processing method |
| JP2016192000A (en) * | 2015-03-31 | 2016-11-10 | 横河電機株式会社 | Business support apparatus and business support method |
| US11107169B2 (en) * | 2015-11-18 | 2021-08-31 | General Electric Company | Systems and methods for controlling and monitoring power assets |
| JP6632941B2 (en) * | 2016-07-20 | 2020-01-22 | 三菱電機ビルテクノサービス株式会社 | Equipment monitoring device and equipment monitoring method |
| JP2018077757A (en) | 2016-11-11 | 2018-05-17 | 横河電機株式会社 | Information processing device, information processing method, information processing program and storage medium |
| JP6950727B2 (en) * | 2016-11-11 | 2021-10-13 | 横河電機株式会社 | Information processing equipment, information processing methods, information processing programs and recording media |
| JP6185206B1 (en) * | 2017-05-31 | 2017-08-23 | オーナンバ株式会社 | Method and apparatus for detecting abnormalities or signs of abnormalities in a photovoltaic system |
| JP7034874B2 (en) | 2018-09-26 | 2022-03-14 | 株式会社日立製作所 | Process state analysis device and process state display method |
| TWI829807B (en) | 2018-11-30 | 2024-01-21 | 日商東京威力科創股份有限公司 | Hypothetical measurement equipment, hypothetical measurement methods and hypothetical measurement procedures for manufacturing processes |
| JP6950670B2 (en) * | 2018-12-12 | 2021-10-13 | 横河電機株式会社 | Detection device, detection method, and detection program |
| JP2020119267A (en) * | 2019-01-24 | 2020-08-06 | 株式会社荏原製作所 | Information processing device, information processing program, and information processing method |
| JP7239354B2 (en) * | 2019-03-12 | 2023-03-14 | 株式会社日立製作所 | data classifier |
| JP7329753B2 (en) | 2019-04-03 | 2023-08-21 | パナソニックIpマネジメント株式会社 | Information processing device, information processing method, and learning device |
| JP6680934B1 (en) * | 2019-06-25 | 2020-04-15 | 株式会社 日立産業制御ソリューションズ | Abnormality avoidance proposal device, abnormality avoidance proposal method, and abnormality avoidance proposal program |
| JP7517810B2 (en) * | 2019-11-19 | 2024-07-17 | 旭化成株式会社 | Diagnostic device, diagnostic method, and diagnostic program |
| JP7189859B2 (en) * | 2019-11-25 | 2022-12-14 | 株式会社日立製作所 | Plant operation support system |
| JP7452990B2 (en) * | 2019-11-29 | 2024-03-19 | 東京エレクトロン株式会社 | Anomaly detection device, anomaly detection method, and anomaly detection program |
| DE112021005441T5 (en) * | 2020-12-25 | 2023-08-10 | Fanuc Corporation | ANOMALITY CLASSIFICATION DEVICE |
| JP7676986B2 (en) * | 2021-06-23 | 2025-05-15 | オムロン株式会社 | Information processing device, model generation program, and model generation method |
| JP7552643B2 (en) | 2022-03-30 | 2024-09-18 | 横河電機株式会社 | DATA PROCESSING APPARATUS, DATA PROCESSING METHOD, AND PROGRAM |
Citations (4)
| Publication number | Priority date | Publication date | Assignee | Title |
|---|---|---|---|---|
| JPH0962340A (en) * | 1995-08-24 | 1997-03-07 | Toshiba Corp | Portable plant inspection data determination device |
| JP2007123007A (en) * | 2005-10-27 | 2007-05-17 | Hitachi Ltd | Diagnostic method and diagnostic apparatus for fuel cell system |
| JP2009042997A (en) * | 2007-08-08 | 2009-02-26 | Hitachi Ltd | Data classification method and apparatus |
| JP2010237893A (en) * | 2009-03-31 | 2010-10-21 | Hitachi Ltd | Plant abnormality diagnosis apparatus and abnormality diagnosis method |
-
2010
- 2010-12-02 WO PCT/JP2010/007025 patent/WO2012073289A1/en not_active Ceased
- 2010-12-02 JP JP2012546576A patent/JP5484591B2/en not_active Expired - Fee Related
Patent Citations (4)
| Publication number | Priority date | Publication date | Assignee | Title |
|---|---|---|---|---|
| JPH0962340A (en) * | 1995-08-24 | 1997-03-07 | Toshiba Corp | Portable plant inspection data determination device |
| JP2007123007A (en) * | 2005-10-27 | 2007-05-17 | Hitachi Ltd | Diagnostic method and diagnostic apparatus for fuel cell system |
| JP2009042997A (en) * | 2007-08-08 | 2009-02-26 | Hitachi Ltd | Data classification method and apparatus |
| JP2010237893A (en) * | 2009-03-31 | 2010-10-21 | Hitachi Ltd | Plant abnormality diagnosis apparatus and abnormality diagnosis method |
Cited By (11)
| Publication number | Priority date | Publication date | Assignee | Title |
|---|---|---|---|---|
| US10281909B2 (en) | 2013-07-10 | 2019-05-07 | Globiz Co., Ltd. | Signal measuring/diagnosing system, and method for applying the same to individual devices |
| KR20160006281A (en) * | 2014-07-08 | 2016-01-19 | 주식회사 글로비즈 | Monitoring method and system |
| KR101616072B1 (en) * | 2014-07-08 | 2016-04-28 | 주식회사 글로비즈 | Monitoring method and system |
| EP3454289A4 (en) * | 2016-05-04 | 2020-03-04 | Doosan Heavy Industries & Construction Co., Ltd. | METHOD AND SYSTEM FOR DETECTION OF PLANT ABNORMALITIES |
| US11092952B2 (en) | 2016-05-04 | 2021-08-17 | Doosan Heavy Industries & Construction Co., Ltd. | Plant abnormality detection method and system |
| JP2024100928A (en) * | 2019-12-10 | 2024-07-26 | キヤノン株式会社 | Information processing method, information processing device, production system, product manufacturing method, program, and recording medium |
| JP7771268B2 (en) | 2019-12-10 | 2025-11-17 | キヤノン株式会社 | Information processing method, information processing device, production system, article manufacturing method, program, and recording medium |
| CN115552345A (en) * | 2020-05-28 | 2022-12-30 | 三菱电机株式会社 | Device state monitoring apparatus and device state monitoring method |
| JP7166395B1 (en) | 2021-06-23 | 2022-11-07 | セイコーソリューションズ株式会社 | MONITORING SYSTEM, MONITORING METHOD, AND MONITORING PROGRAM |
| JP2023003226A (en) * | 2021-06-23 | 2023-01-11 | セイコーソリューションズ株式会社 | Monitoring system, monitoring method, and monitoring program |
| JP2024114223A (en) * | 2023-02-13 | 2024-08-23 | 横河電機株式会社 | Diagnostic device, diagnostic program, diagnostic method, and diagnostic system |
Also Published As
| Publication number | Publication date |
|---|---|
| JPWO2012073289A1 (en) | 2014-05-19 |
| WO2012073289A1 (en) | 2012-06-07 |
Similar Documents
| Publication | Publication Date | Title |
|---|---|---|
| JP5484591B2 (en) | PLANT DIAGNOSIS DEVICE AND PLANT DIAGNOSIS METHOD | |
| JP5292477B2 (en) | Diagnostic device and diagnostic method | |
| CN102870057B (en) | Diagnostic device, diagnostic method, and diagnostic program for mechanical equipment | |
| JP7108417B2 (en) | Anomaly detection system | |
| JP5097739B2 (en) | Plant abnormality diagnosis apparatus and abnormality diagnosis method | |
| CN102999038B (en) | Power generation facility diagnostic device and power generation facility diagnostic method | |
| JP5101396B2 (en) | Soundness diagnosis method and program, and windmill soundness diagnosis device | |
| JP4995134B2 (en) | Wind turbine monitoring device, method and program | |
| JP5199478B2 (en) | Plant diagnostic equipment | |
| JP5150590B2 (en) | Abnormality diagnosis apparatus and abnormality diagnosis method | |
| US20110106510A1 (en) | Methods, apparatus and computer readable storage mediums for model-based diagnosis | |
| JP6523815B2 (en) | Plant diagnostic device and plant diagnostic method | |
| JP7180985B2 (en) | Diagnostic device and diagnostic method | |
| CN112449696A (en) | Time series data diagnosis device, additional learning method, and program | |
| JP4430384B2 (en) | Equipment diagnostic apparatus and diagnostic method | |
| JP2015162140A (en) | Diagnostic system of plant and control device | |
| Ashkarkalaei et al. | Optimum feature selection for the supervised damage classification of an operating wind turbine blade | |
| JP6830414B2 (en) | Diagnostic device and diagnostic method | |
| JP6685124B2 (en) | Diagnostic device and diagnostic method | |
| JP5647626B2 (en) | Plant state monitoring device and plant state monitoring method | |
| King et al. | Probabilistic approach to the condition monitoring of aerospace engines | |
| CN119596856A (en) | Production control method, equipment, medium and product based on virtual measurement prediction data | |
| JP6347771B2 (en) | Abnormality diagnosis apparatus, abnormality diagnosis method, and abnormality diagnosis program | |
| JP2021110977A (en) | Diagnostic device, diagnostic method and program |
Legal Events
| Date | Code | Title | Description |
|---|---|---|---|
| TRDD | Decision of grant or rejection written | ||
| A01 | Written decision to grant a patent or to grant a registration (utility model) |
Free format text: JAPANESE INTERMEDIATE CODE: A01 Effective date: 20140204 |
|
| A61 | First payment of annual fees (during grant procedure) |
Free format text: JAPANESE INTERMEDIATE CODE: A61 Effective date: 20140218 |
|
| R150 | Certificate of patent or registration of utility model |
Ref document number: 5484591 Country of ref document: JP Free format text: JAPANESE INTERMEDIATE CODE: R150 |
|
| LAPS | Cancellation because of no payment of annual fees |